
Effects of Aftershocks on the Seismic Performances of Reinforced Concrete Eccentric Frame Structures
Abstract
:1. Introduction
2. Numerical Modeling
2.1. Modeling of the Tested Structures
- (a)
- Each floor is a rigid floor.
- (b)
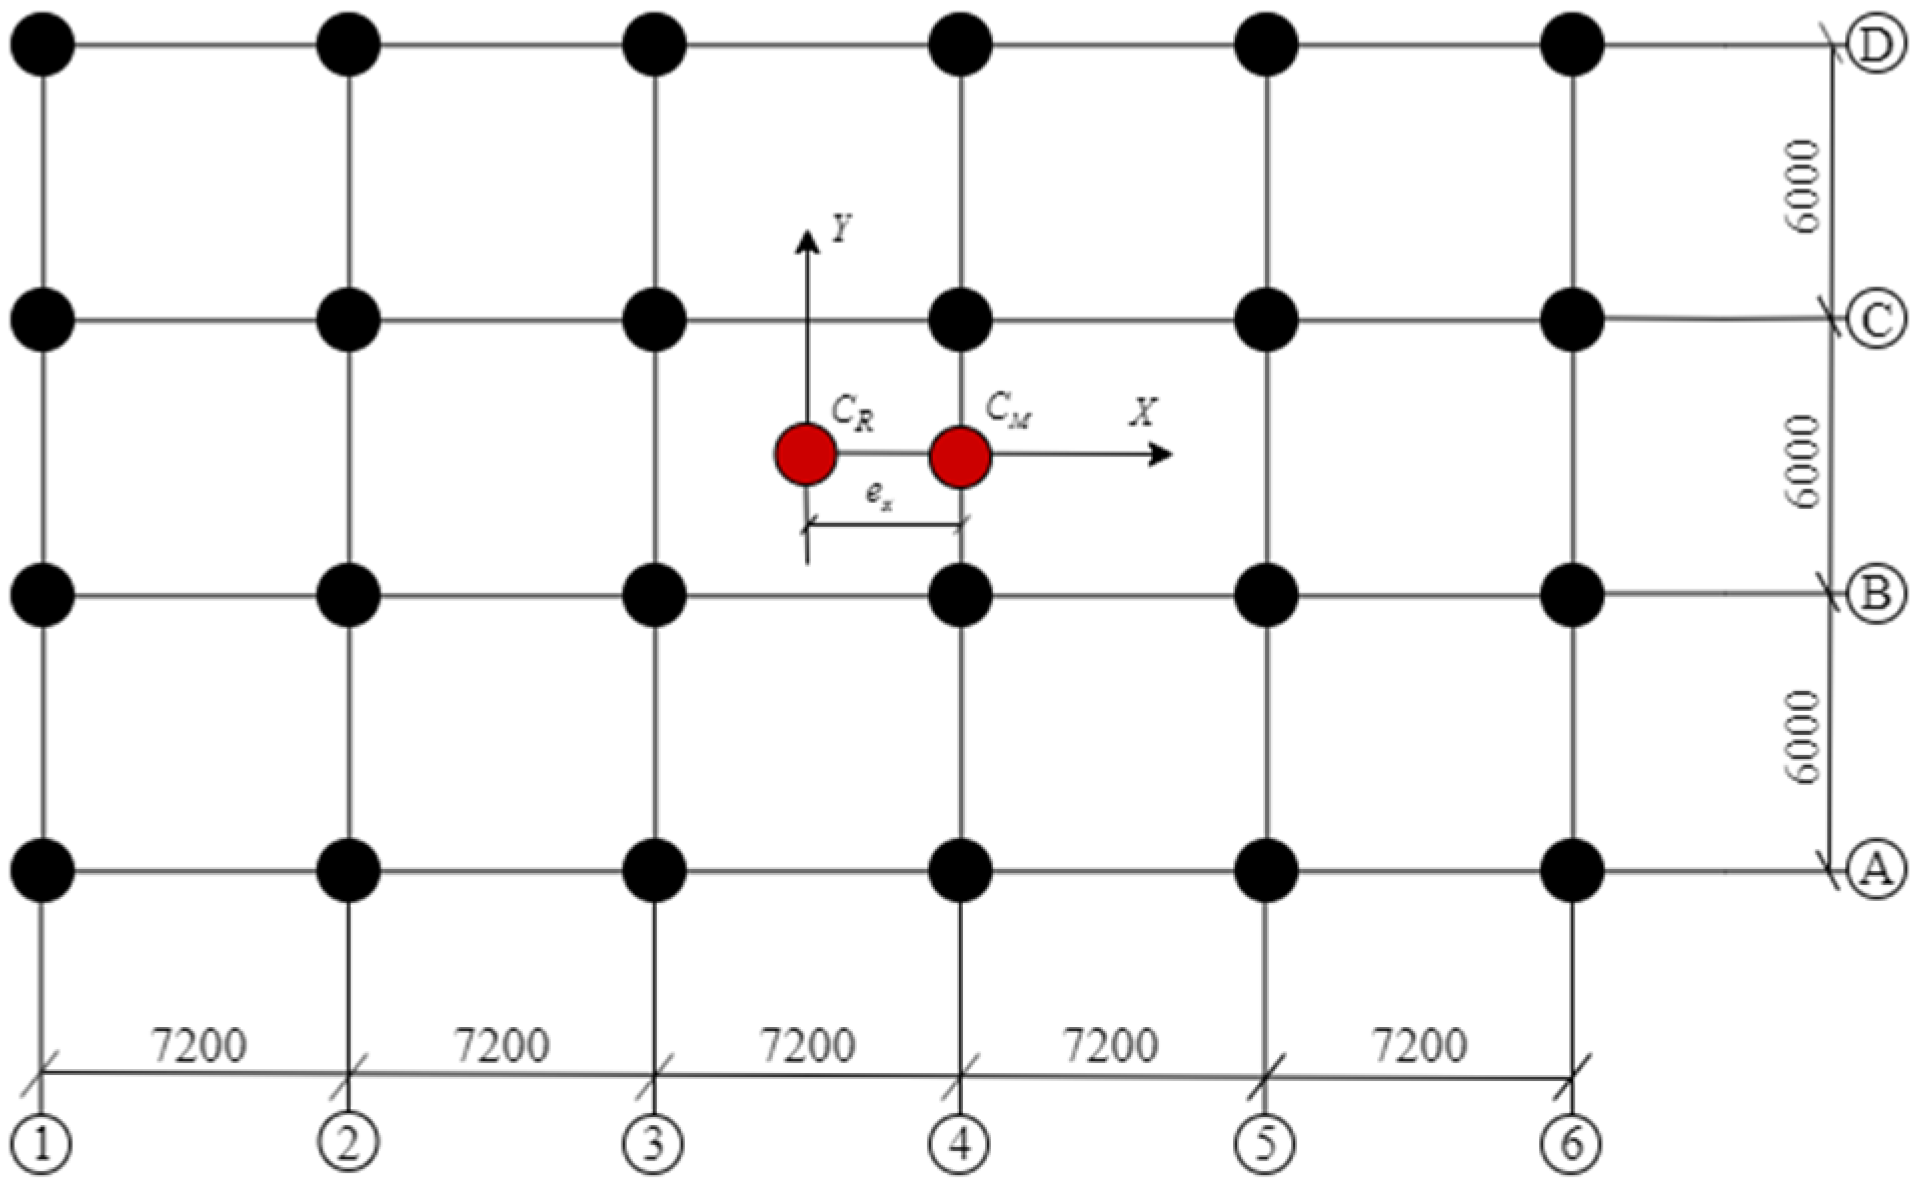
- The total mass and moment of inertia of each floor are appointed at the geometric center of the floor.
- (c)
- Each floor has three degrees of freedom (two translational degrees of freedom and one rotational degree of freedom).
- (d)
- The torsional stiffness of the structure is elastic.
- (e)
- The centers of stiffness are basically located at the geometric center of each story, present on the same vertical axis. The floor stiffness distribution could be regarded as uniform and symmetric.
- (f)
- The influence of the non-synchronous nonlinear behavior of different columns on the change in eccentricities is not considered in this study.
2.2. Vibrational Characteristic Analysis
2.3. Ground Motion Selection and Scaling
3. Results and Discussion
3.1. Spatial Pushover Analysis (SPA)
3.2. Seismic Dynamic Analyses of Unidirectional Eccentric Structures
3.2.1. Response of the Unidirectional Eccentric Structure under Unidirectional Mainshock
3.2.2. Responses of the Unidirectional Eccentric Structure under Unidirectional Mainshock–Aftershock Sequences
3.2.3. Response of Unidirectional Eccentric Structure under Bidirectional Mainshock
3.2.4. Response of the Unidirectional Eccentric Structure under Bidirectional Mainshock–Aftershock Sequences
3.3. Seismic Dynamic Analyses of Bidirectional Eccentric Structures
3.3.1. Response of Bidirectional Eccentric Structure under Bidirectional Mainshock
3.3.2. Response of the Bidirectional Eccentric Structure under Bidirectional Mainshock–Aftershock Sequences
4. Conclusions
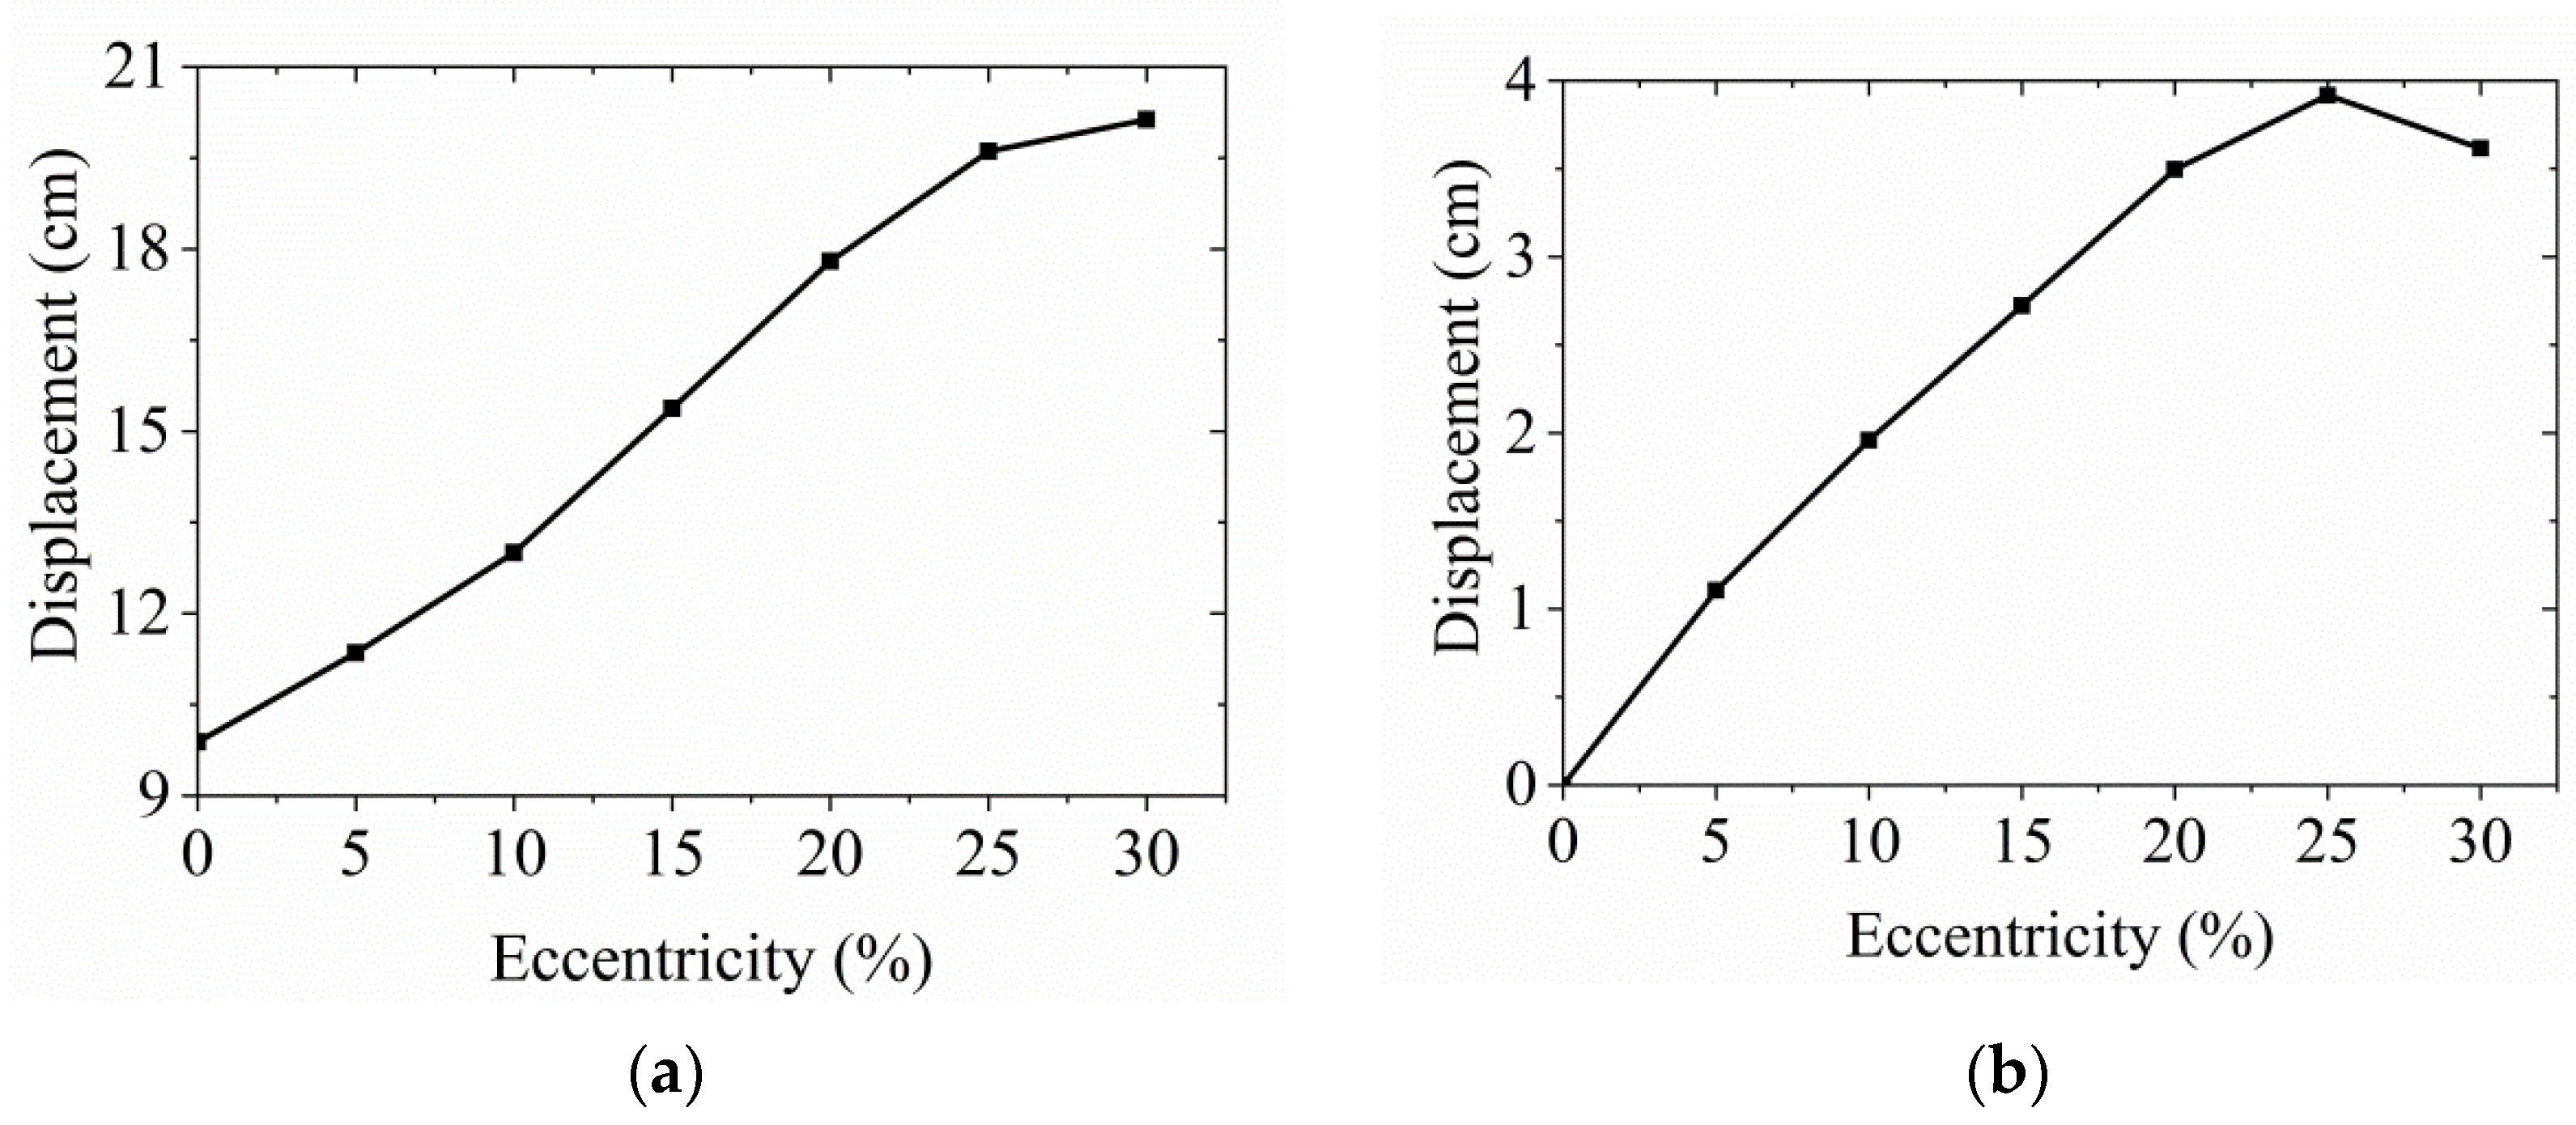
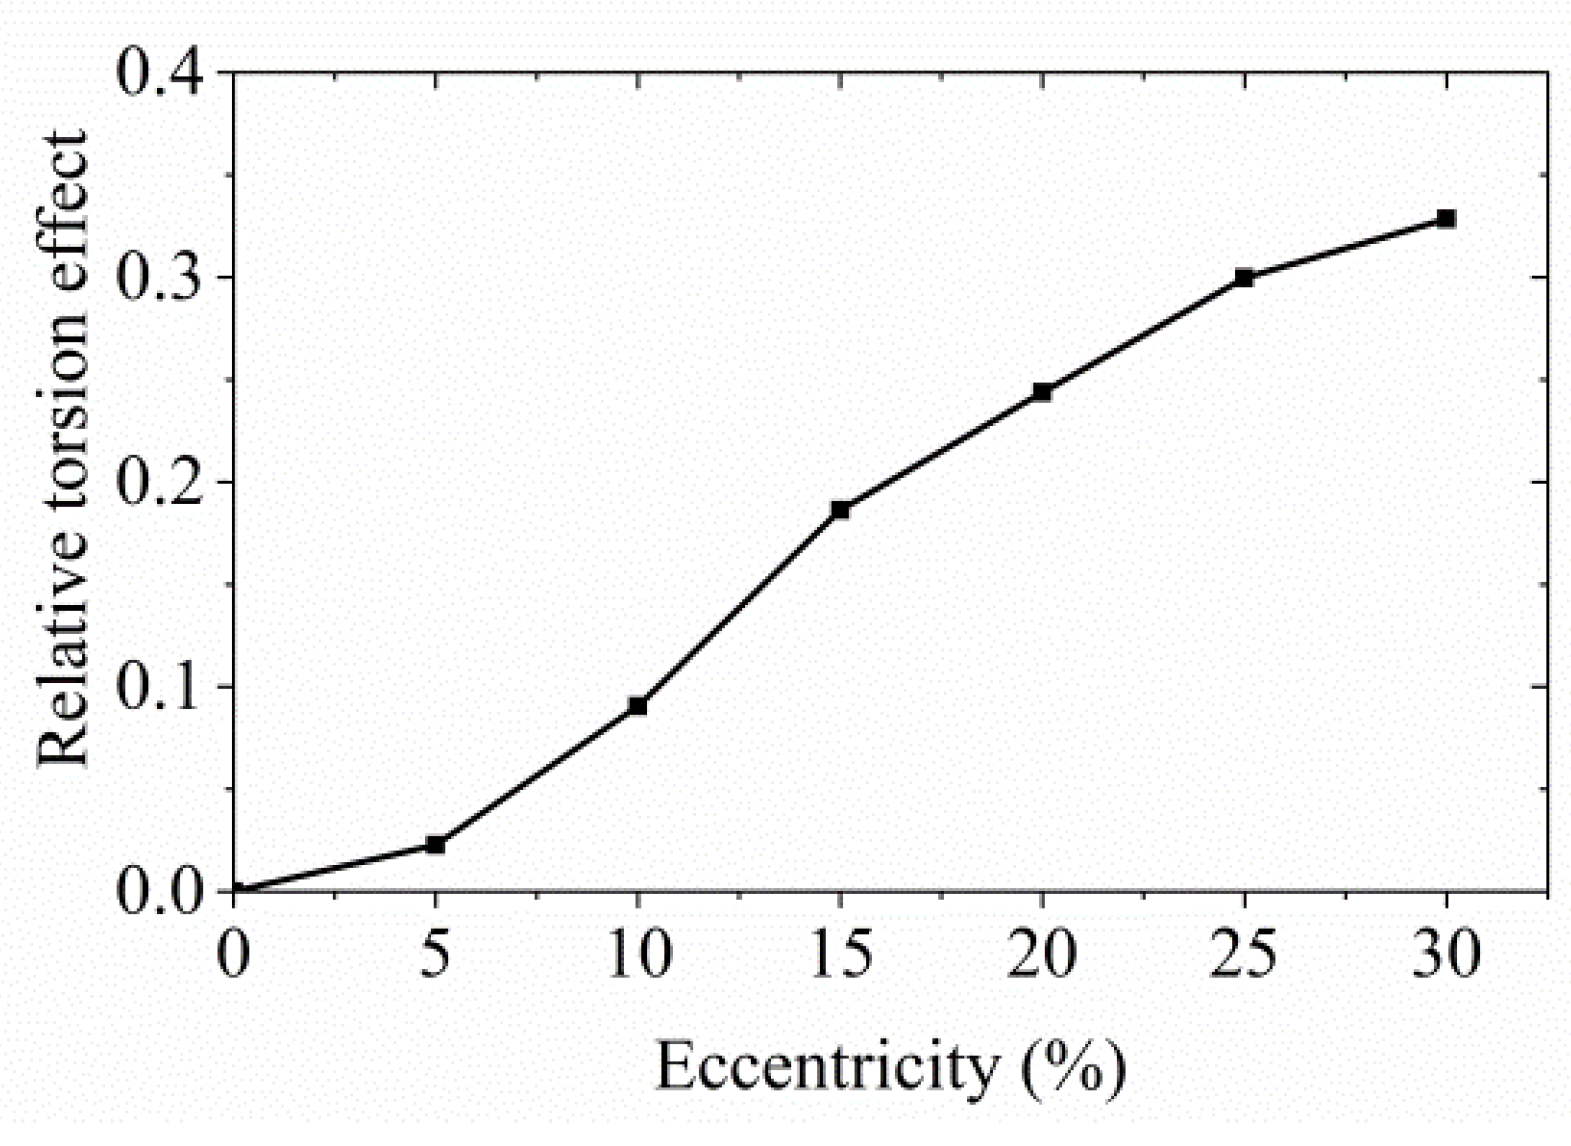
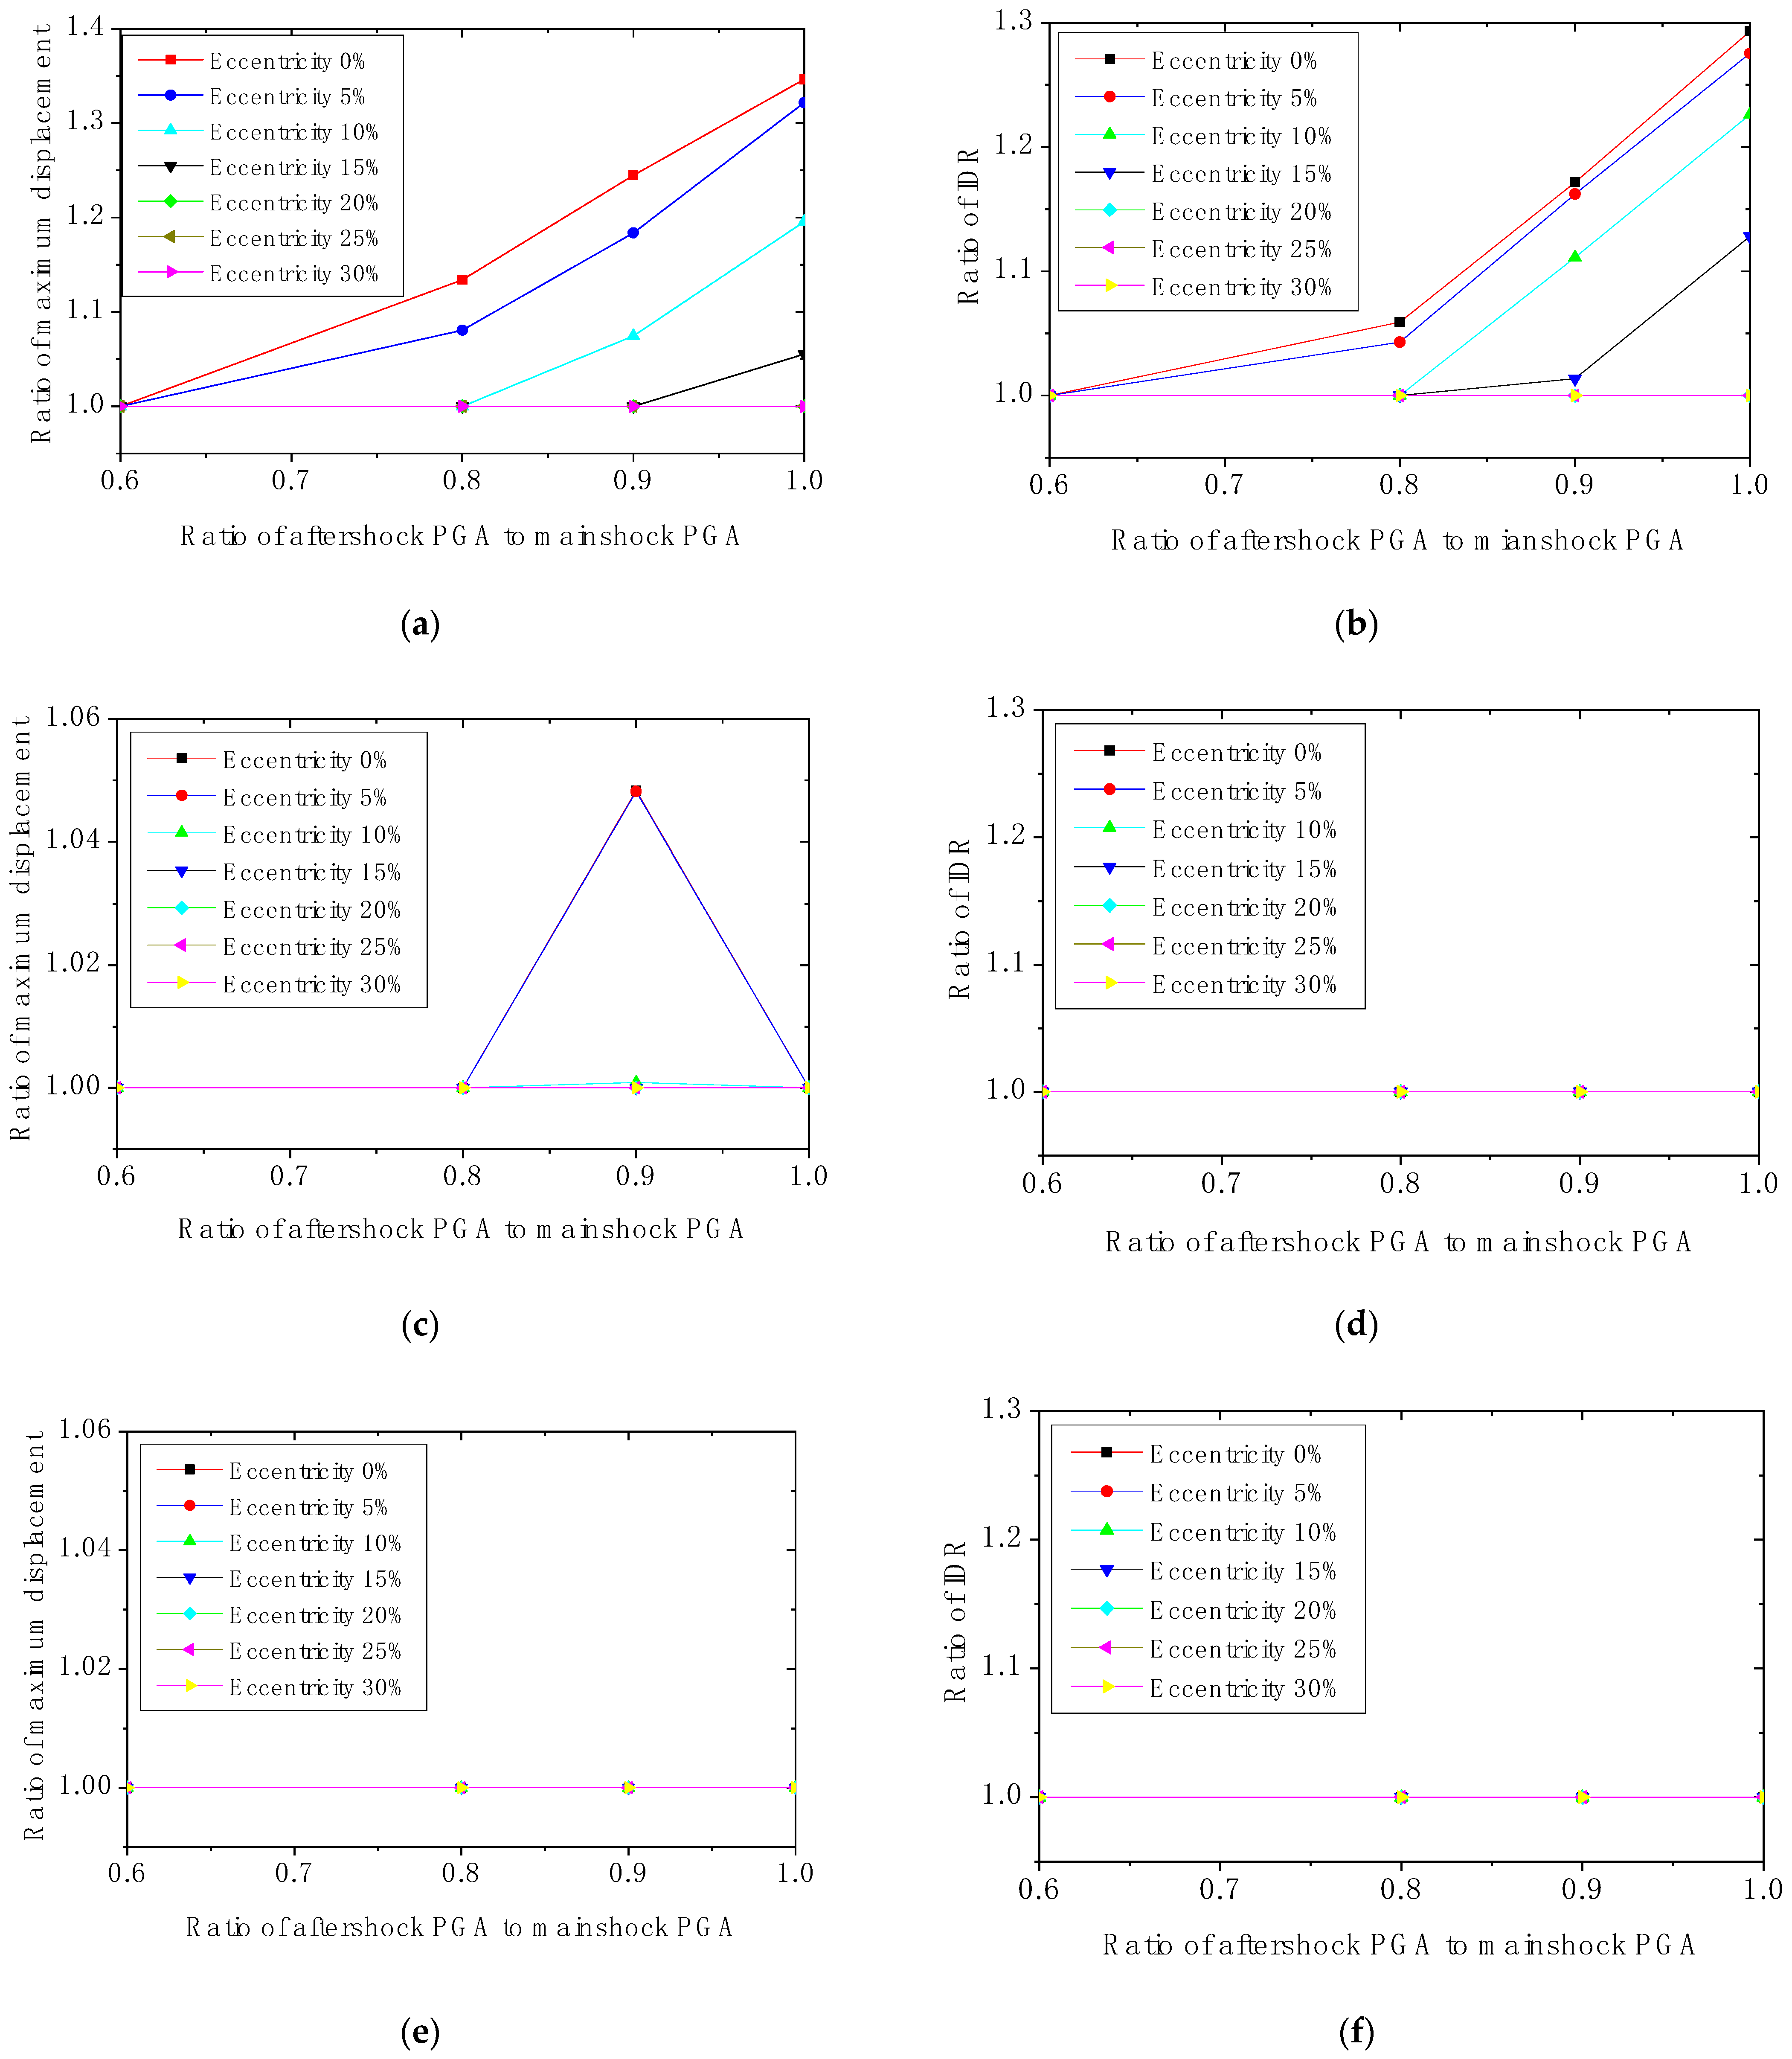
- For unidirectional eccentric structures, the displacement response during the unidirectional mainshock increases obviously with an improvement in eccentricity, and the displacement growth rate increases first and then decreases. The structural response increases further under the unidirectional MSAS. The peak displacement and maximum inter-story drift ratio during the aftershock can reach up to 1.4 times and 1.5 times those of the mainshock, respectively, when the structure experiences a mainshock of 0.15 g. When the amplitude of the mainshock is low, the aftershock shows a more significant influence on the structural response.
- For unidirectional eccentric structures, bidirectional horizontal loadings are more likely to cause damage to the structures and have a more adverse effect on the structural displacement responses in the main direction. The symmetric structure is most affected by the aftershock under the bidirectional MSAS. The peak displacement and maximum inter-story drift ratio during the aftershock can reach up to 1.35 times and 1.3 times those of the mainshock, respectively, when the structure experiences a mainshock of 0.15 g. Compared with the structural response under bidirectional loading, the structural response under unidirectional loading is more sensitive to the intensity of aftershock ground motions.
- For bidirectional eccentric structures, the peak displacements and maximum inter-story drift ratios of the structures tend to ascend with an increase in eccentricity. Compared with unidirectional eccentric structures, the responses of bidirectional eccentric structures are more complex under the same bidirectional horizontal earthquakes, and the aftershocks have a more significant influence on the responses of bidirectional eccentric structures. When the structure experienced a mainshock of 0.15 g, the peak displacement during the aftershock can reach 1.5 times that of the mainshock, and the maximum inter-story drift ratio during the aftershock can reach 1.4 times that of the mainshock.
Author Contributions
Funding
Data Availability Statement
Conflicts of Interest
References
- Li, X.; Zhou, Z.; Yu, H.; Wen, R.; Lu, D.; Huang, M.; Zhou, Y.; Cu, J. Strong motion observations and recordings from the great Wenchuan Earthquake. Earthq. Eng. Eng. Vib. 2008, 7, 235–246. [Google Scholar] [CrossRef]
- Zhai, C.-H.; Wen, W.-P.; Li, S.; Chen, Z.; Chang, Z.; Xie, L.-L. The damage investigation of inelastic SDOF structure under the mainshock–aftershock sequence-type ground motions. Soil Dyn. Earthq. Eng. 2014, 59, 30–41. [Google Scholar] [CrossRef]
- Fragiacomo, M.; Amadio, C.; Macorini, L. Seismic response of steel frames under repeated earthquake ground motions. Eng. Struct. 2004, 26, 2021–2035. [Google Scholar] [CrossRef]
- Hatzigeorgiou, G.D.; Liolios, A.A. Nonlinear behaviour of RC frames under repeated strong ground motions. Soil Dyn. Earthq. Eng. 2010, 30, 1010–1025. [Google Scholar] [CrossRef]
- Brown, R.D.; Ward, P.L. Geologic and seismologic aspects of the managua, nicaragua, earthquakes of December 23, 1972. Bull. Seismol. Soc. Am. 1974, 64, 1031. [Google Scholar] [CrossRef]
- Goel, R.K.; Chopra, A.K. Inelastic seismic response of one-storey, asymmetric-plan systems: Effects of stiffness and strength distribution. Earthq. Eng. Struct. Dyn. 1990, 19, 949–970. [Google Scholar] [CrossRef]
- Jiang, W.; Hutchinson, G.L.; Wilson, J.L. Inelastic torsional coupling of building models. Eng. Struct. 1996, 18, 288–300. [Google Scholar] [CrossRef]
- Reyes, J.C.; Kalkan, E. Should ground-motion records be rotated to fault-normal/parallel or maximum direction for response history analysis of buildings. US Geol. Surv. Open-File Rep. 2012, 1261, 89. [Google Scholar]
- Kalkan, E.; Reyes, J.C. Significance of rotating ground motions on behavior of symmetric-and asymmetric-plan structures: Part II. Multi-story structures. Earthq. Spectra 2015, 31, 1613–1628. [Google Scholar] [CrossRef]
- Kosmopoulos, A.J.; Fardis, M.N. Estimation of inelastic seismic deformations in asymmetric multistorey RC buildings. Earthq. Eng. Struct. Dyn. 2010, 36, 1209–1234. [Google Scholar] [CrossRef]
- Buratti, N.; Minghini, F.; Ongaretto, E.; Savoia, M.; Tullini, N. Empirical seismic fragility for the precast RC industrial buildings damaged by the 2012 Emilia (Italy) earthquakes. Earthq. Eng. Struct. Dyn. 2017, 46, 2317–2335. [Google Scholar] [CrossRef]
- Ruggieri, S.; Chatzidaki, A.; Vamvatsikos, D.; Uva, G. Reduced-order models for the seismic assessment of plan-irregular low-rise frame buildings. Earthq. Eng. Struct. Dyn. 2022, 51, 3327–3346. [Google Scholar] [CrossRef]
- Ruggieri, S.; Uva, G. Accounting for the Spatial Variability of Seismic Motion in the Pushover Analysis of Regular and Irregular RC Buildings in the New Italian Building Code. Buildings 2020, 10, 177. [Google Scholar] [CrossRef]
- Bhasker, R.A. A seismic fragility model accounting for torsional irregularity in low-rise non-ductile RC moment resisting frame buildings. Earthq. Eng. Struct. Dyn. 2021, 51, 912–934. [Google Scholar] [CrossRef]
- Manie, S.; Moghadam, A.S.; Ghafory-Ashtiany, M. Collapse response assessment of low-rise buildings with irregularities in plan. Earthq. Struct. 2015, 9, 49–71. [Google Scholar] [CrossRef]
- Michalis, F.; Dimitrios, V.; Manolis, P. Evaluation of the influence of vertical irregularities on the seismic performance of a nine-storey steel frame. Cornell Univ. Press 2006, 35, 1489–1509. [Google Scholar] [CrossRef]
- Sayyed, O.; Kushwah, S.S.; Rawat, A. Seismic Analysis of Vertical Irregular RC Building with Stiffness and Setback Irregularities. IOSR J. Mech. Civ. Eng. 2017, 14, 40–45. [Google Scholar] [CrossRef]
- Lee, H.S.; Ko, D.W. Seismic Response Characteristics of High-Rise RC Wall Buildings Having Different Irregularities in Lower Stories. Steel Constr. 2007, 29, 3149–3167. [Google Scholar] [CrossRef]
- Bilgin, H.; Urui, R. Effects of structural irregularities on low and mid-rise RC building response. J. Struct. Mech. 2018, 4, 33. [Google Scholar] [CrossRef]
- Pant, D.R.; Wijeyewickrema, A.C. Performance of base-isolated reinforced concrete buildings under bidirectional seismic excitation considering pounding with retaining walls including friction effects. Earthq. Eng. Struct. Dyn. 2014, 43, 1521–1541. [Google Scholar] [CrossRef]
- Kohrangi, M.; Bazzurro, P.; Vamvatsikos, D. Conditional spectrum bidirectional record selection for risk assessment of 3D structures using scalar and vector IMs. Earthq. Eng. Struct. Dyn. 2019, 48, 1066–1082. [Google Scholar] [CrossRef]
- Yamamoto, M.; Minewaki, S.; Yoneda, H.; Higashino, M. Nonlinear behavior of high-damping rubber bearings under horizontal bidirectional loading: Full-scale tests and analytical modeling. Earthq. Eng. Struct. Dyn. 2012, 41, 1845–1860. [Google Scholar] [CrossRef]
- Yang, Z.D.; Lam, E.S. Dynamic responses of two buildings connected by viscoelastic dampers under bidirectional earthquake excitations. Earthq. Eng. Eng. Vib. 2014, 13, 137–150. [Google Scholar] [CrossRef]
- Grant, D.N. Response Spectral Matching of Two Horizontal Ground-Motion Components. J. Struct. Eng. 2011, 137, 289–297. [Google Scholar] [CrossRef]
- Lee, H.S.; Hwang, K.R. Torsion design implications from shake-table responses of an RC low-rise building model having irregularities at the ground story. Earthq. Eng. Struct. Dyn. 2014, 44, 907–927. [Google Scholar] [CrossRef]
- De Domenico, D.; Losanno, D.; Vaiana, N. Experimental tests and numerical modeling of full-scale unbonded fiber reinforced elastomeric isolators (UFREIs) under bidirectional excitation. Eng. Struct. 2023, 274, 115118. [Google Scholar] [CrossRef]
- Hosseinpour, F.; Abdelnaby, A.E. Effect of different aspects of multiple earthquakes on the nonlinear behavior of RC structures. Soil Dyn. Earthq. Eng. 2017, 92, 706–725. [Google Scholar] [CrossRef]
- Oyguc, R.; Toros, C.; Abdelnaby, A.E. Seismic behavior of irregular reinforced-concrete structures under multiple earthquake excitations. Soil Dyn. Earthq. Eng. 2018, 104, 15–32. [Google Scholar] [CrossRef]
- GB 18306-2015; Construction, C.M.o. Seismic Ground Motion Parameter Zonation Map of China. China Earthquake Administration: Beijing, China, 2015.
- McKenna, F. OpenSees: A framework for earthquake engineering simulation. Comput. Sci. Eng. 2011, 13, 58–66. [Google Scholar] [CrossRef]
- Kent Dudley, C.; Park, R. Flexural Members with Confined Concrete. J. Struct. Div. 1971, 97, 1969–1990. [Google Scholar] [CrossRef]
- Menegotto, M. Method of analysis for cyclically loaded RC plane frames including changes in geometry and non-elastic behavior of elements under combined normal force and bending. In Proceedings of the IABSE Symposium on Resistance and Ultimate Deformability of Structures Acted on by Well Defined Repeated Loads; Istituto di Scienza e Tecnica delle Costruzioni Univerita di: Roma, Italy, 1973; pp. 15–22. [Google Scholar]
- Spacone, E.; Filippou, F.C.; Taucer, F.F. Fibre beam–column model for non-linear analysis of R/C frames: Part I. Formulation. Earthq. Eng. Struct. Dyn. 1996, 25, 711–725. [Google Scholar] [CrossRef]
- GB50011-2010; Construction, C.M.o. Code for Seismic Design of Buildings. Ministry of Housing and Urban-Rural Construction of the People’s Republic of China: Beijing, China, 2010.


| Component | Sectional Dimension (mm × mm) | Longitudinal Bar (mm2) | Hooping Bar (mm) |
|---|---|---|---|
| Beam (X direction) | 250 × 500 | Top 1140/bottom 1140 | Φ8@100 |
| Girder (Y direction) | 250 × 500 | Top 1140/bottom 1520 | Φ8@100 |
| Column | 500 × 500 | Top 942/bottom 942 | Φ10@100 |
| Material | Maximum Stress fc (MPa) | Strain at Maximum Stress ε0 | Ultimate Stress fu (MPa) | Strain at Ultimate Stress εu | Ratio between Unloading Slope and Initial Slope λ | Tensile Strength ft (MPa) | Tension Softening Stiffness Et (MPa) |
| Unconfined concrete | −27.4 | −0.003 | −5.5 | −0.01 | 0.1 | 2.7 | 1.4 × 10³ |
| Confined concrete | −35.6 | −0.006 | −7.1 | −0.012 | 0.1 | 3.6 | 1.8 × 10³ |
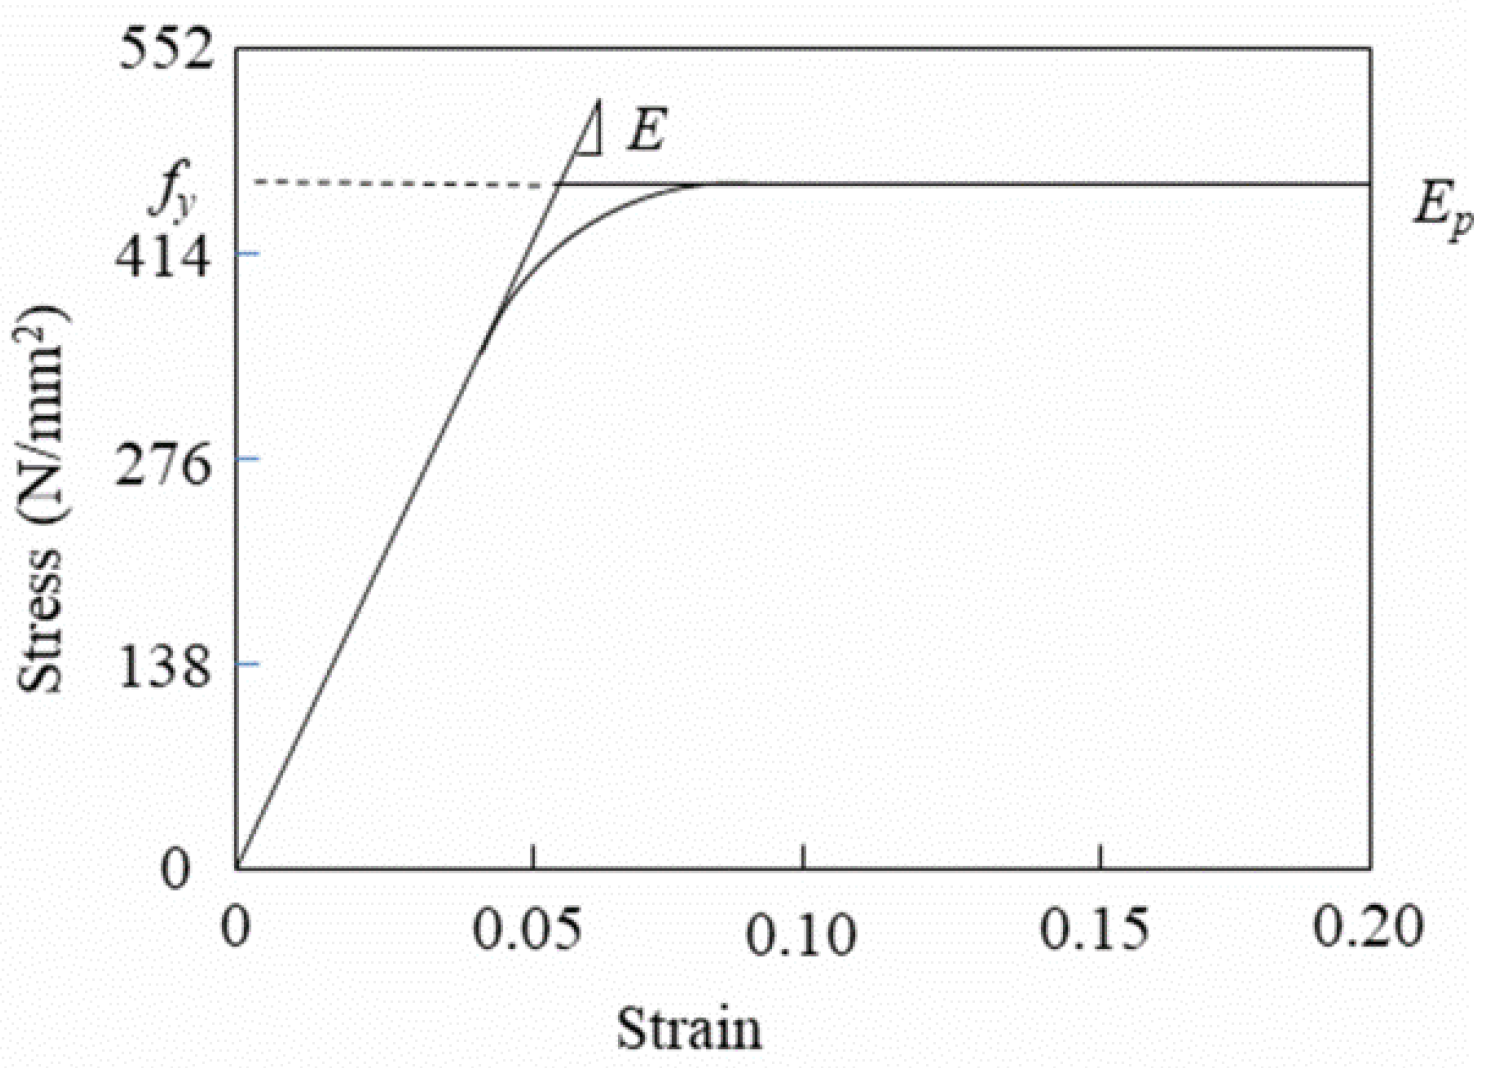
| Yield stress Fy (MPa) | Modulus of steel Es (MPa) | Strain-hardening ratio bs | Parameter R0 | Parameter cR1 | Parameter cR2 | ||
| Steel | 457 | 2 × 10⁵ | 0.01 | 18 | 0.925 | 0.15 |
| Mode | Eccentricity (%) | ||||||
|---|---|---|---|---|---|---|---|
| 0 | 5 | 10 | 15 | 20 | 25 | 30 | |
| 1 | 1.169 | 1.169 | 1.195 | 1.244 | 1.306 | 1.380 | 1.462 |
| 2 | 1.152 | 1.163 | 1.170 | 1.169 | 1.169 | 1.169 | 1.169 |
| 3 | 0.770 | 0.766 | 0.756 | 0.742 | 0.726 | 0.712 | 0.698 |
| 4 | 0.328 | 0.328 | 0.338 | 0.354 | 0.374 | 0.397 | 0.423 |
| 5 | 0.323 | 0.327 | 0.328 | 0.328 | 0.328 | 0.328 | 0.328 |
| Translational–torsional period ratio | 1.518 | 1.526 | 1.581 | 1.677 | 1.791 | 1.938 | 2.094 |
| Mode | Eccentricity (%) | ||||||
|---|---|---|---|---|---|---|---|
| 0 | 5 | 10 | 15 | 20 | 25 | 30 | |
| 1 | 1.169 | 1.175 | 1.209 | 1.268 | 1.342 | 1.430 | 1.528 |
| 2 | 1.152 | 1.161 | 1.165 | 1.166 | 1.166 | 1.166 | 1.166 |
| 3 | 0.770 | 0.765 | 0.753 | 0.737 | 0.720 | 0.704 | 0.691 |
| 4 | 0.328 | 0.330 | 0.342 | 0.362 | 0.386 | 0.413 | 0.443 |
| 5 | 0.323 | 0.326 | 0.327 | 0.327 | 0.327 | 0.327 | 0.327 |
| Translational–torsional period ratio | 1.518 | 1.536 | 1.606 | 1.720 | 1.864 | 2.031 | 2.211 |
| Earthquake Name | Type | Station | Direction | Time | Mw | PGA |
|---|---|---|---|---|---|---|
| CHICHI | Mainshock | CHY029 | N | 20 September 1999 | 7.62 | 0.238 g |
| Aftershock | CHY029 | N | 25 September 1999 | 6.30 | 0.158 g |
| Performance Level | Damage Description | PGAms | PGAas/PGAms | PGAas |
|---|---|---|---|---|
| Immediate occupancy | Maximum IDR is 1% | 0.15 g | 0.6 | 0.09 g |
| 0.8 | 0.12 g | |||
| 0.9 | 0.135 g | |||
| 1 | 0.15 g | |||
| Life safety | Maximum IDR is 2% | 0.25 g | 0.6 | 0.15 g |
| 0.8 | 0.2 g | |||
| 0.9 | 0.225 g | |||
| 1 | 0.25 g | |||
| Collapse prevention | Maximum IDR is 4% | 0.32 g | 0.6 | 0.192 g |
| 0.8 | 0.256 g | |||
| 0.9 | 0.288 g | |||
| 1 | 0.32 g |
| No | Structure | Load | Abbr. |
|---|---|---|---|
| 1 | Unidirectional eccentric structure | Unidirectional mainshock ground motion | UUM |
| 2 | Unidirectional eccentric structure | Unidirectional mainshock–aftershock sequences | UUS |
| 3 | Unidirectional eccentric structure | Bidirectional mainshock ground motion | UBM |
| 4 | Unidirectional eccentric structure | Bidirectional mainshock–aftershock sequences | UBS |
| 5 | Bidirectional eccentric structure | Bidirectional mainshock ground motion | BBM |
| 6 | Bidirectional eccentric structure | Bidirectional mainshock–aftershock sequences | BBS |
Disclaimer/Publisher’s Note: The statements, opinions and data contained in all publications are solely those of the individual author(s) and contributor(s) and not of MDPI and/or the editor(s). MDPI and/or the editor(s) disclaim responsibility for any injury to people or property resulting from any ideas, methods, instructions or products referred to in the content. |
© 2023 by the authors. Licensee MDPI, Basel, Switzerland. This article is an open access article distributed under the terms and conditions of the Creative Commons Attribution (CC BY) license (https://creativecommons.org/licenses/by/4.0/).
Share and Cite
Sun, P.; Wen, W.; Zhang, S. Effects of Aftershocks on the Seismic Performances of Reinforced Concrete Eccentric Frame Structures. Appl. Sci. 2023, 13, 10767. https://doi.org/10.3390/app131910767
Sun P, Wen W, Zhang S. Effects of Aftershocks on the Seismic Performances of Reinforced Concrete Eccentric Frame Structures. Applied Sciences. 2023; 13(19):10767. https://doi.org/10.3390/app131910767
Chicago/Turabian StyleSun, Pengyu, Weiping Wen, and Siwei Zhang. 2023. "Effects of Aftershocks on the Seismic Performances of Reinforced Concrete Eccentric Frame Structures" Applied Sciences 13, no. 19: 10767. https://doi.org/10.3390/app131910767