
Laboratory Study of Effective Stress Coefficient for Saturated Claystone
Abstract
:1. Introduction
2. Experimental Testing
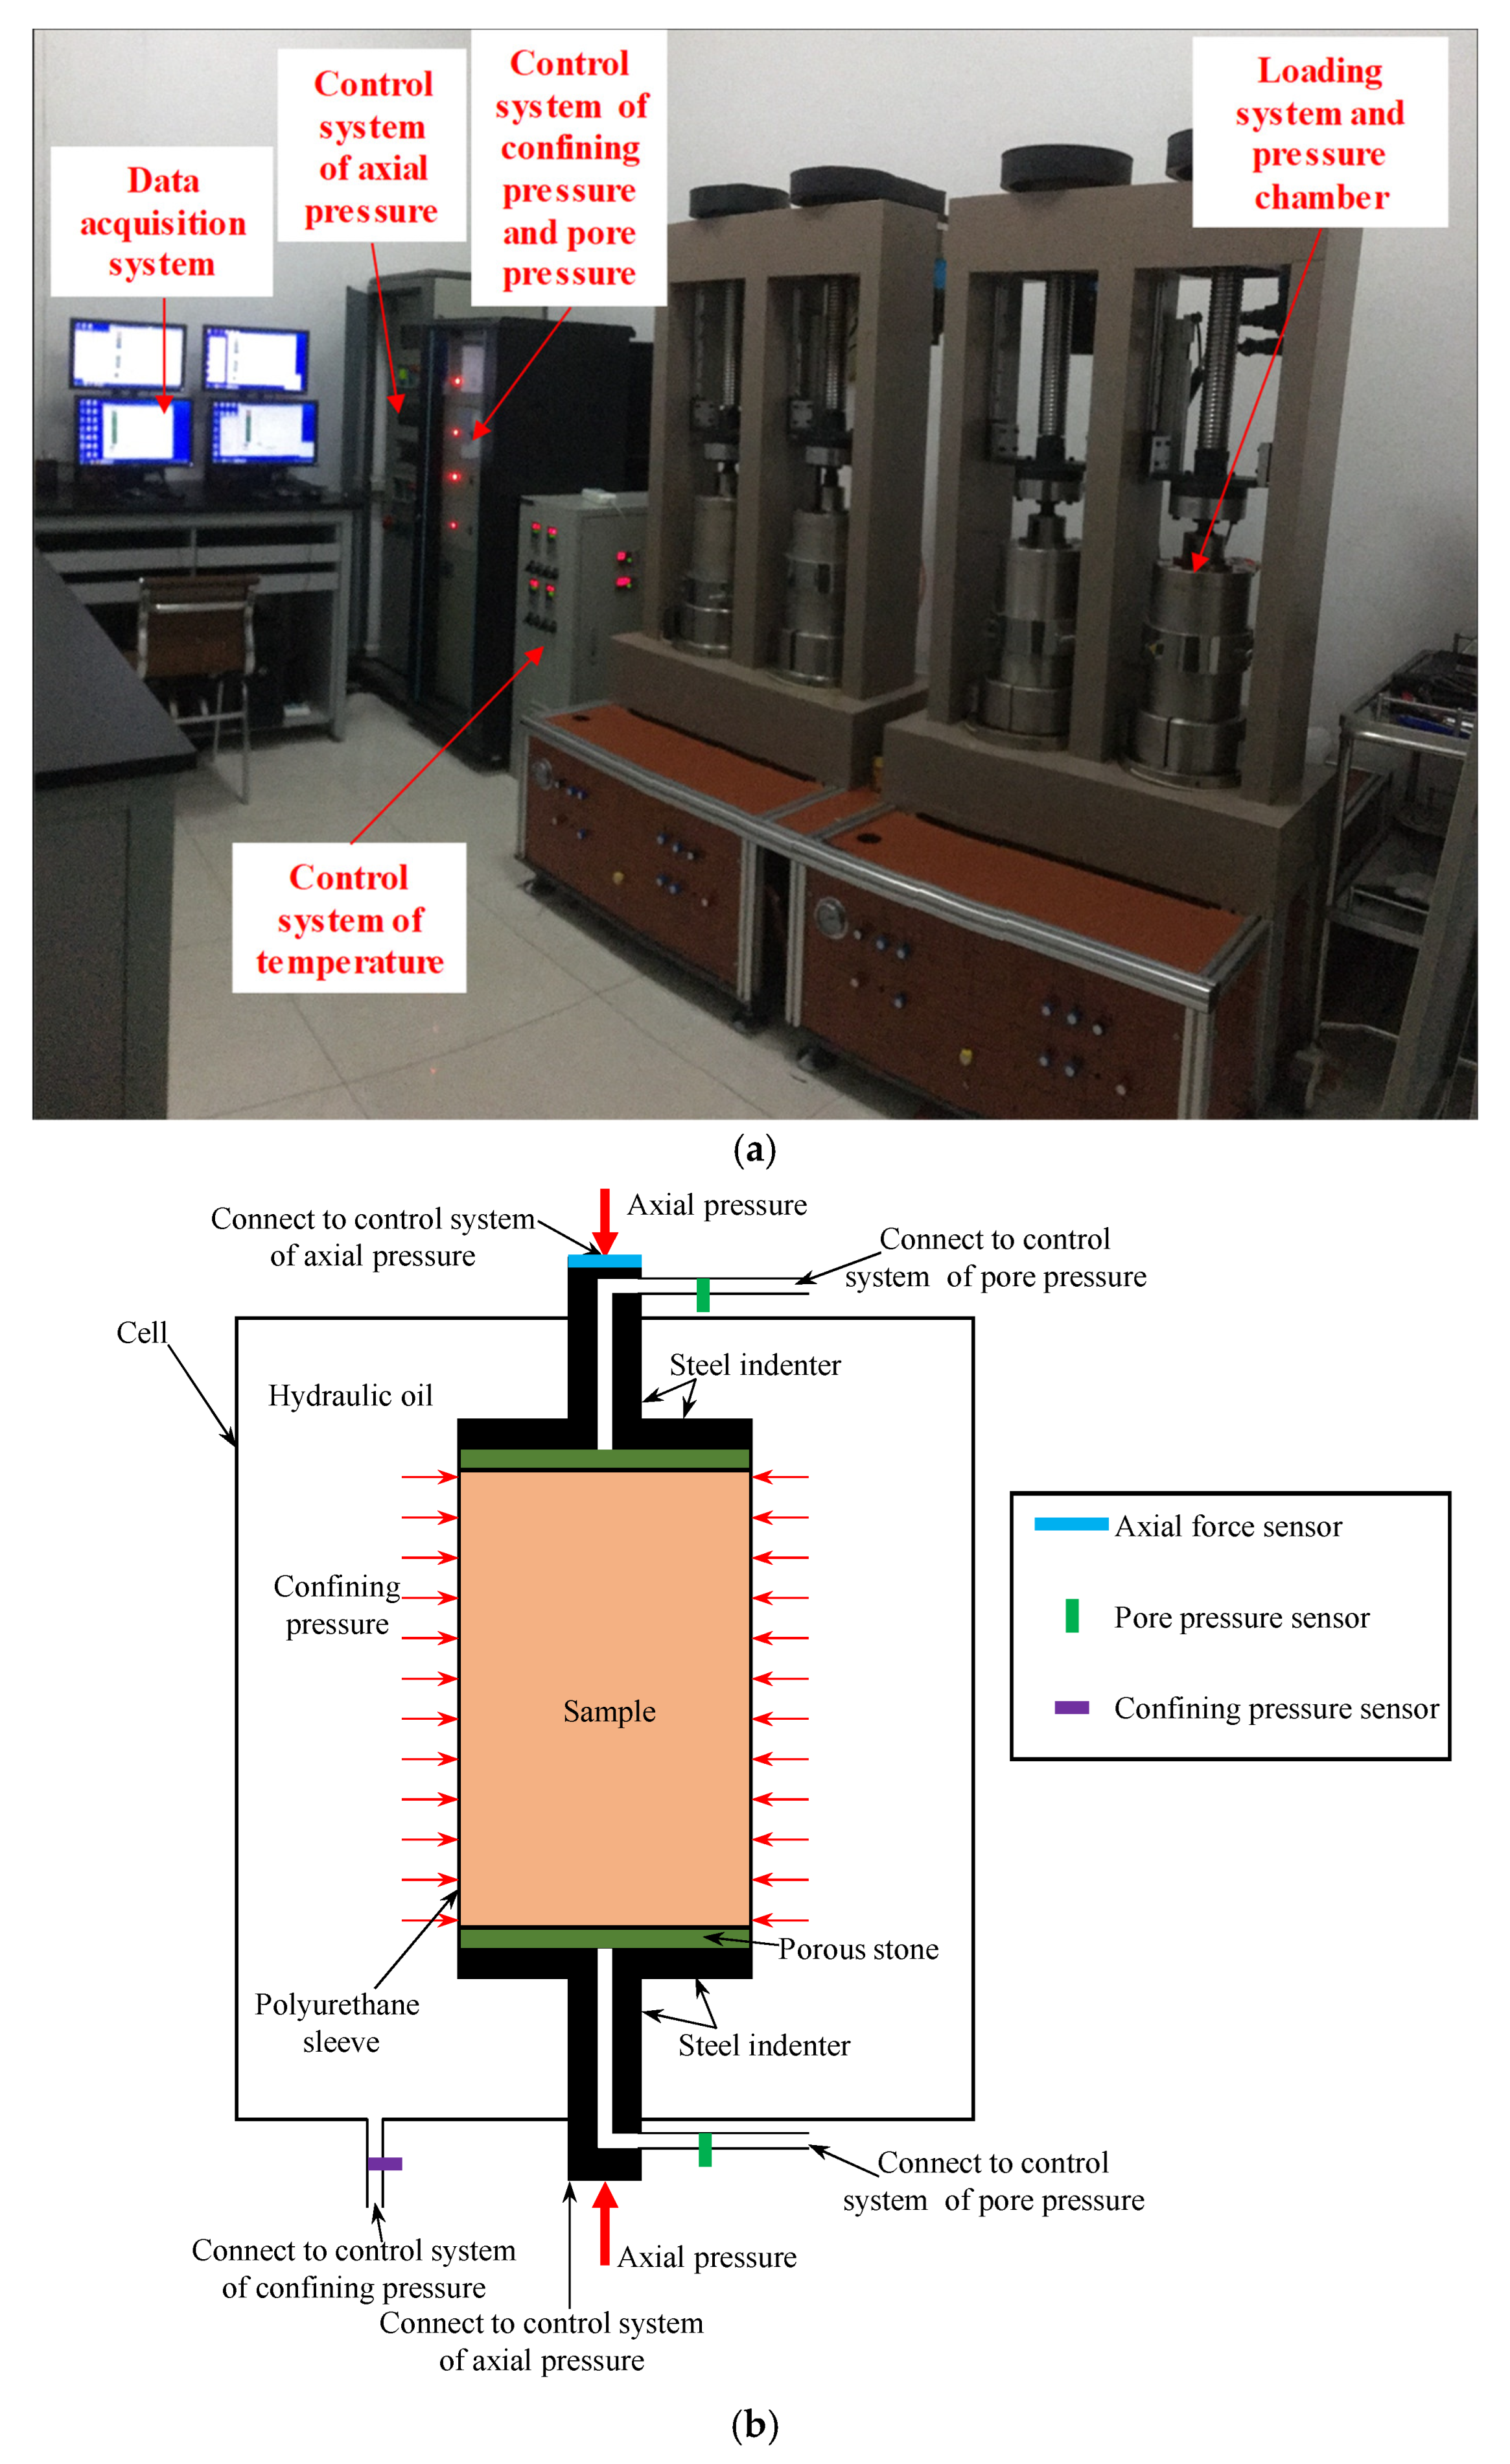
2.1. Experimental Device
2.2. Samples’ Preparation and Basic Properties
2.3. Test Procedures
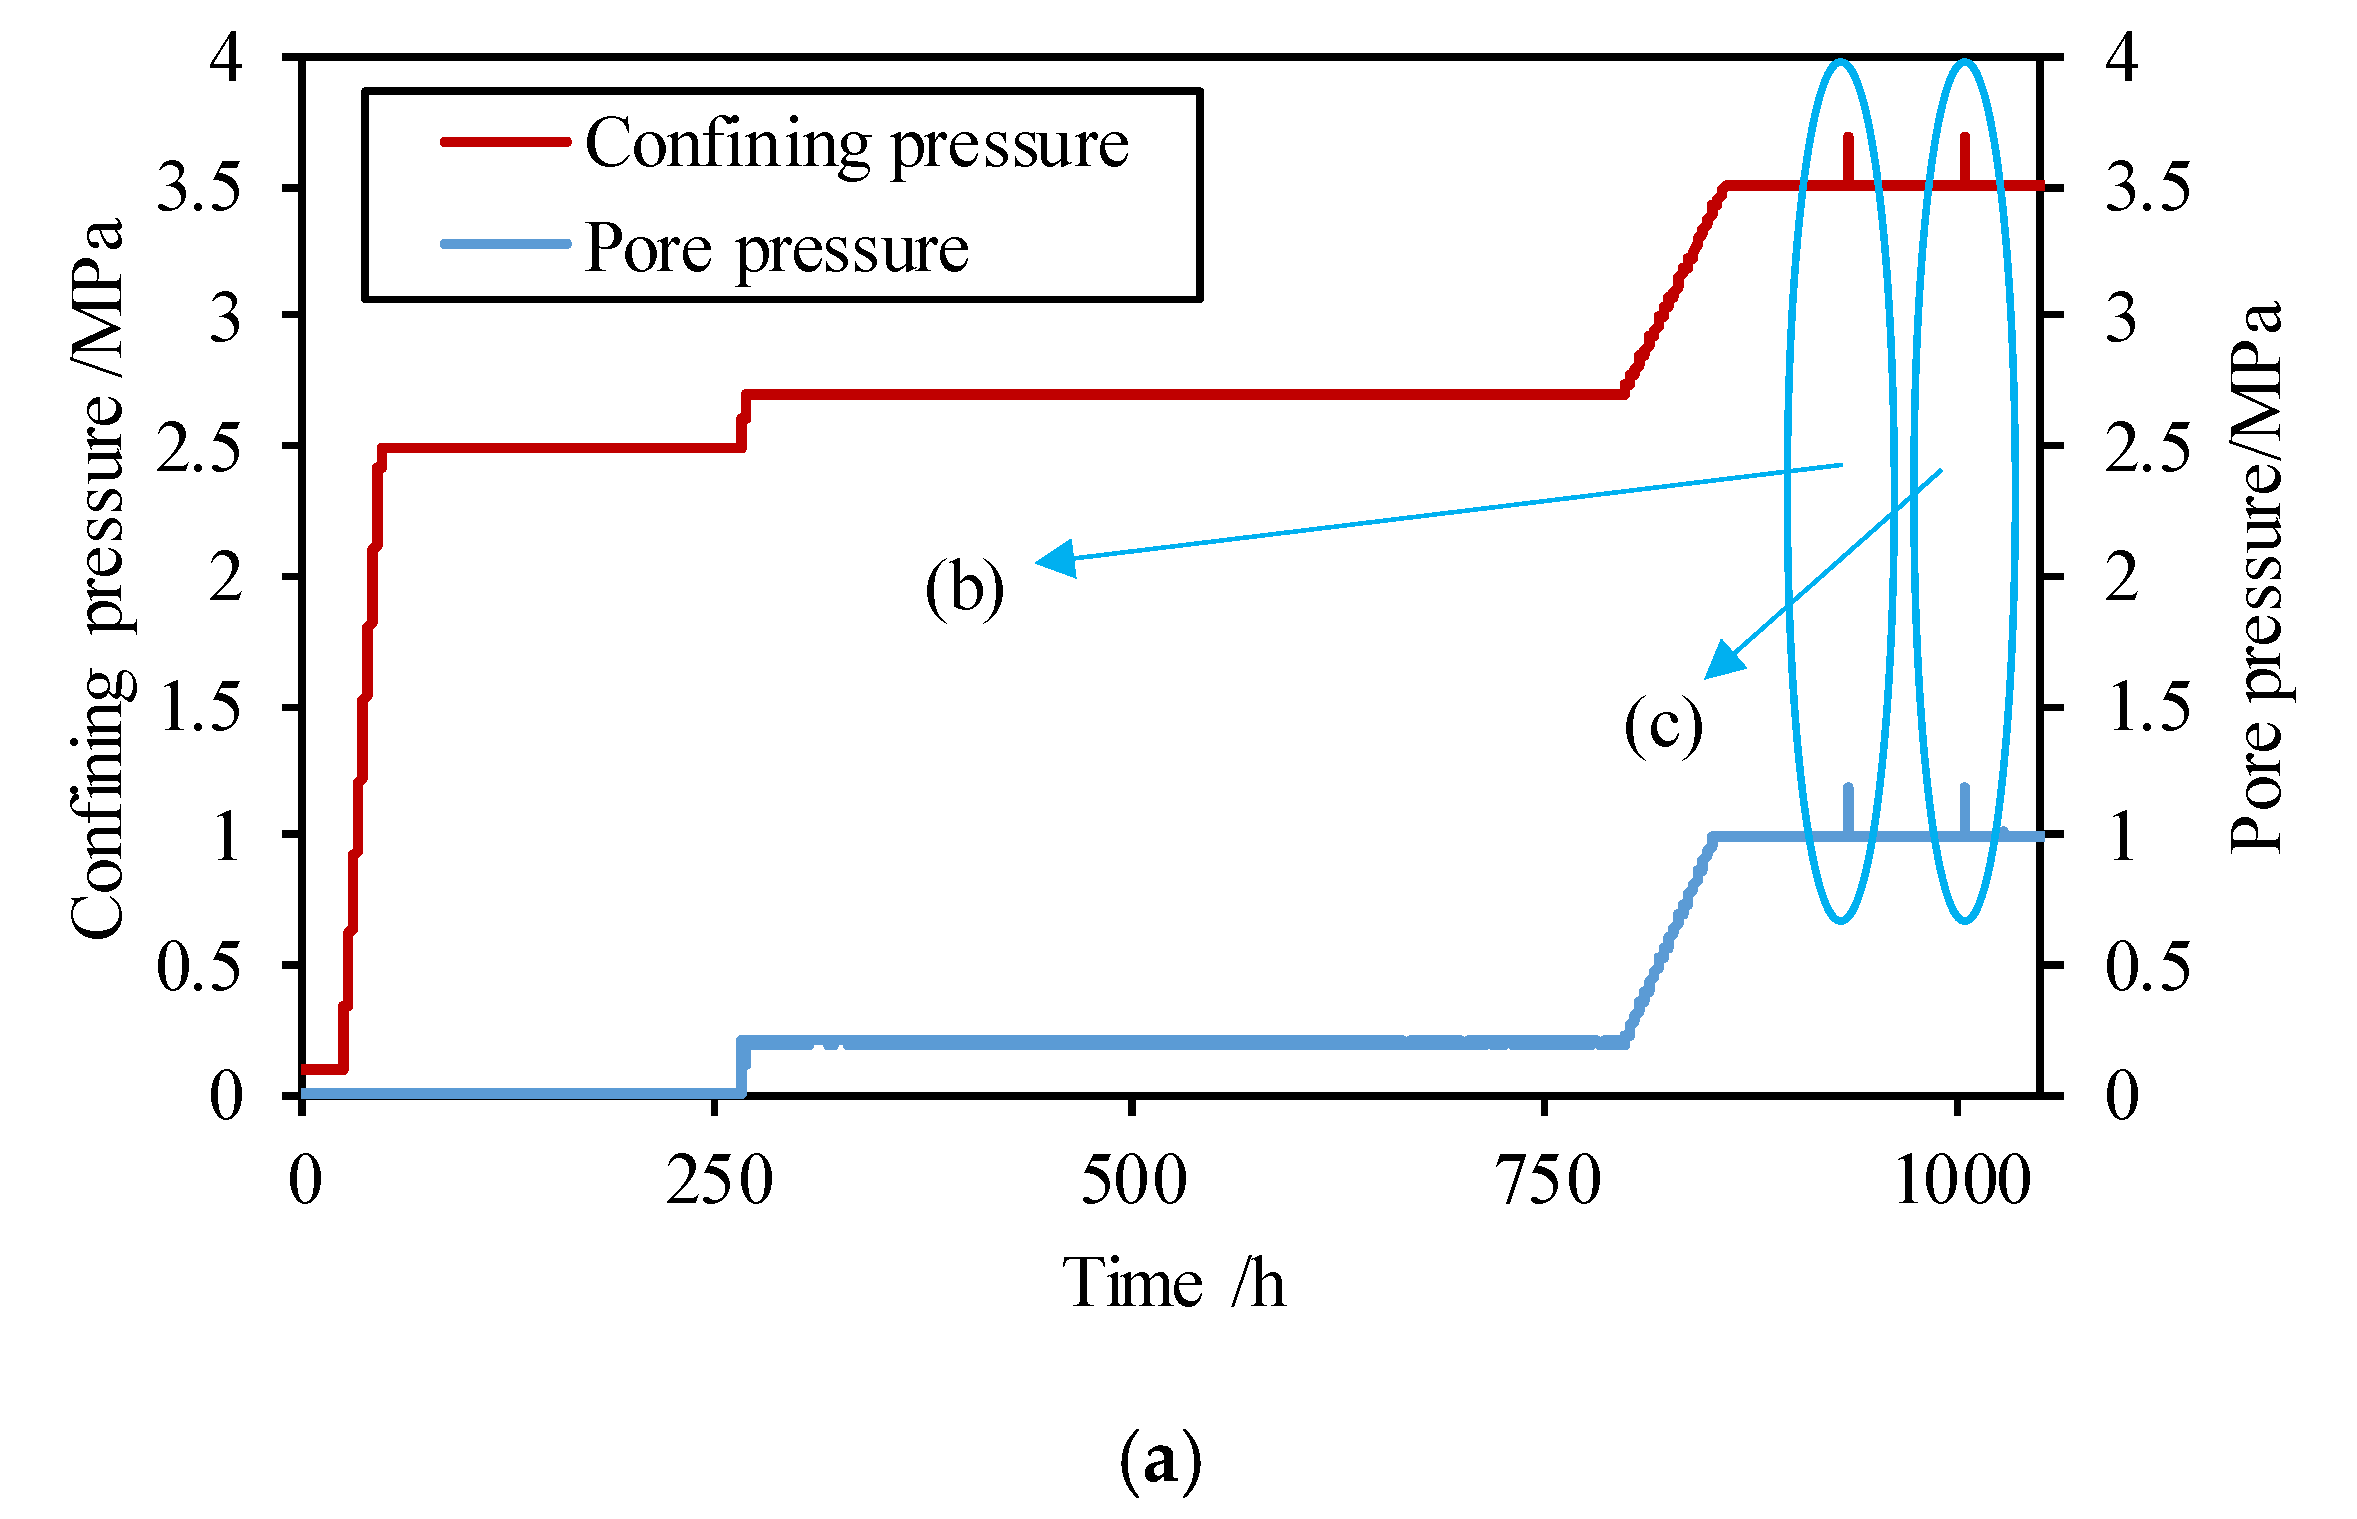
- A confining pressure of 0.1 MPa was applied to establish the initial system stabilization (about 24 h).
- The confining pressure was increased to 2.5 MPa at a low rate of 1.68 kPa/min. The volume changes were monitored by a measuring system.
- The water was thus injected into the samples from the top and bottom. Then, the pore pressure and confining pressure were simultaneously increased by 0.2 MPa at the rate of 1.68 kPa/min.
- Simultaneous increases of both the confining pressure to 3.5 MPa and pore pressure to 1.0 MPa were applied. The loading rate was controlled at 0.2 kPa/min.
- Then Skempton’s coefficient B was checked to determine the saturation degree of the samples by the following method:
- Closing the drainage valve.
- Increasing confining pressure of 0.2 MPa.
- Measuring the increase in the corresponding pore pressure.
- Decreasing the confining pressure down to 3.5 MPa and calculating Skempton’s coefficient B.
- Checking Skempton’s coefficient B repeatedly until it was greater than 0.85.
- Keeping the drainage valve open, the effective stress coefficient of claystone was tested in line with the following steps:
- Increasing the confining pressure by n MPa (n = 0, 0.1, 0.14, 0.16, 0.18, 0.2, 0.22), and the pore pressure by 0.2 MPa simultaneously. Then the confining pressure and pore pressure were restored to the previous state (σc = 3.5 MPa, σp = 1.0 MPa).
- Observing and recording the deformation of samples.
3. Results
3.1. Results of the Saturation Stage
3.2. Results of the Test Stage
3.2.1. Results of Stage One
- (1)
- The samples undergo a significant expansion when the increment of pore pressure Δσp = 0.2, 0.2, 0.2, 0.2, 0.2 MPa is greater than the increment of confining pressure Δσc = 0, 0.1, 0.14, 0.16, 0.18 MPa; This means that the effective stress is reduced under this confining and pore pressure condition.
- (2)
- Conversely, when Δσp = 0.2 MPa is less than Δσc = 0.22 MPa, these samples are compressed; This means that the effective stress is increased under this confining and pore pressure condition.
- (3)
- The deformation of the samples are hardly observed when Δσp = 0.2 MPa and Δσc = 0.2 MPa are equal; This means that the effective stress is constant under this confining and pore pressure condition.
3.2.2. Results of Stage Two
- (1)
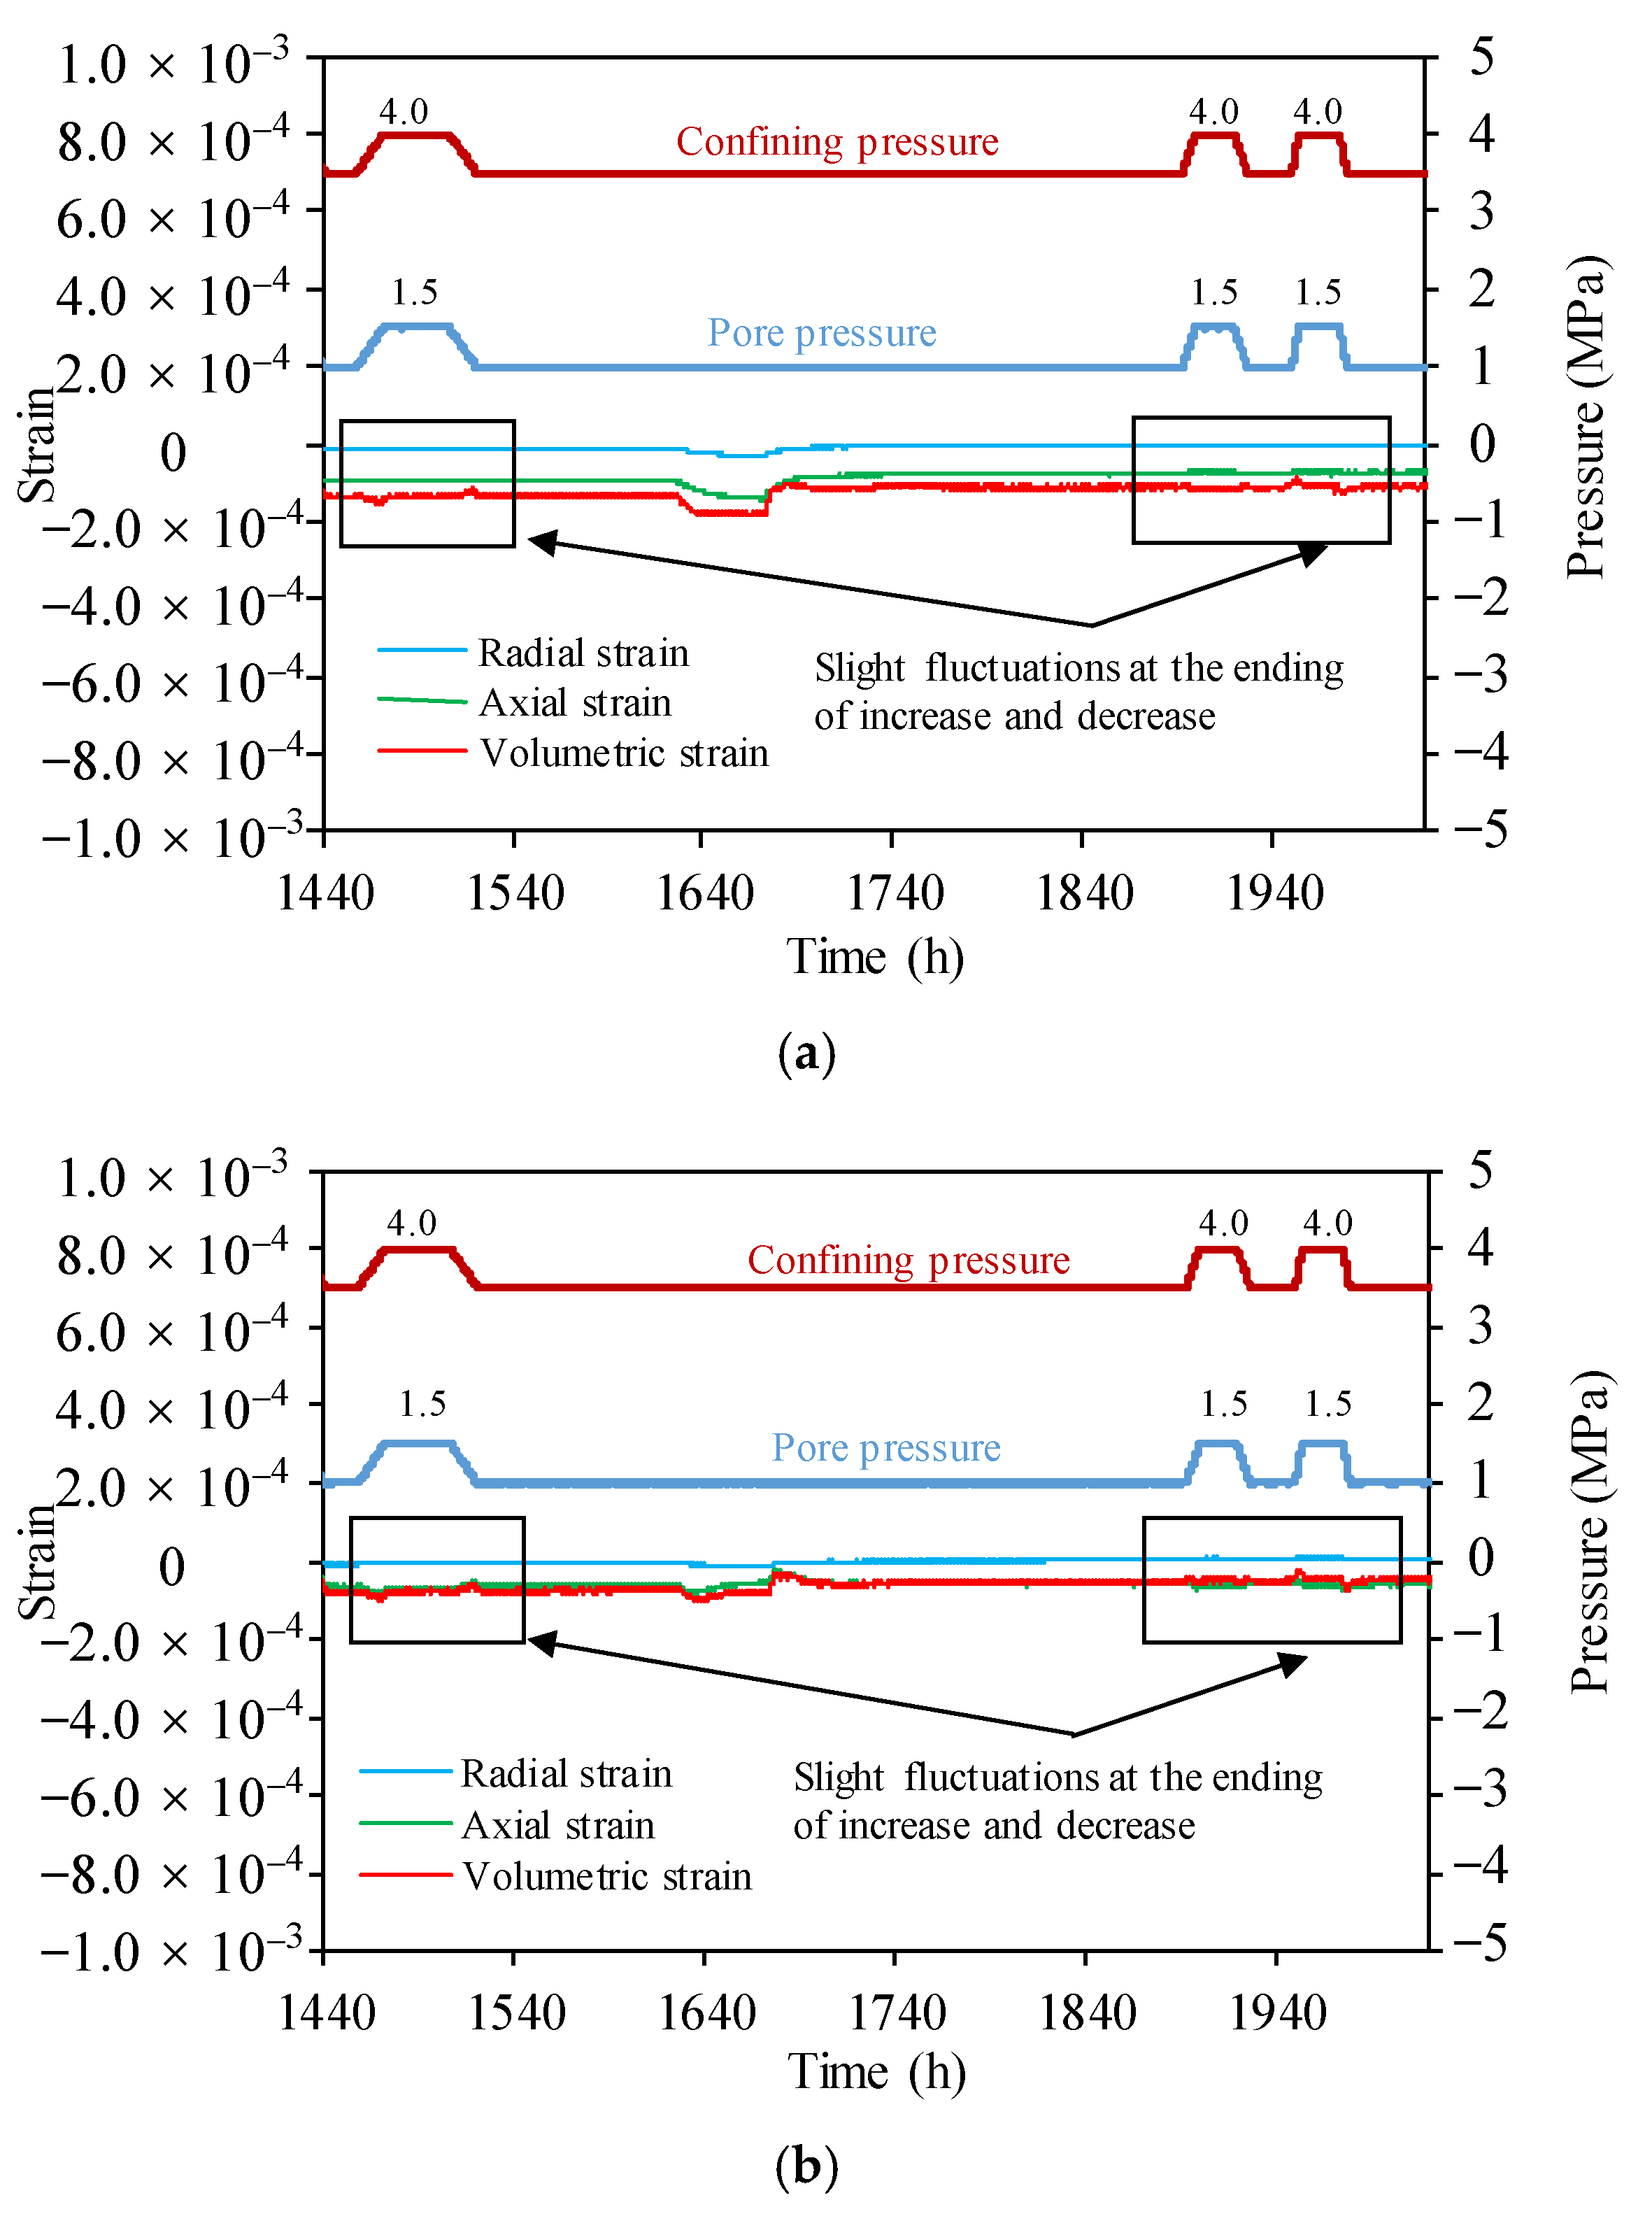
- There were slight fluctuations at the end of the loading and unloading. The reason for this phenomenon is that it was impossible to increase or decrease the pore pressure and confining pressure completely simultaneously.
- (2)
- The sudden jitter of the strain under stable stress conditions between the first and second cycles was due to a temperature fluctuation (Figure 4).
- (3)
- The deformations of the samples were all not obvious when the pore pressure and confining pressure were both increased or decreased by 0.5 MPa at a rate of 0.01 kPa/s, 0.02 kPa/s, and 0.04 kPa/s, because pore water could dissipate in time and no excess pore pressure would occur.
4. Discussion on the Effective Stress Principle for Saturated Claystone
4.1. The Value of Effective Stress Coefficient for Claystone
- (1)
- When Δσp = 0.2 MPa and Δσc = 0.18 MPa, the samples are dilatant, meaning Δσe < 0 under this stress condition.
- (2)
- When Δσp = 0.2 MPa and Δσc = 0.22 MPa, the samples are compressed, meaning Δσe > 0 under this stress condition.
- (3)
- When Δσp = 0.2 MPa and Δσc = 0.2 MPa, the deformation of samples are not obvious, meaning Δσe ≈ 0 under this condition.
4.2. Discussion on the Influencing Factors of Effective Stress Coefficient
- (1)
- Whether the testing condition was Δσc = Δσp = 0.2 MPa or Δσc = Δσp = 0.5 MPa, the results were the same. It means that the neutral stresses may have little effect on the determination of the effective stress coefficient for claystone.
- (2)
- The results with different loading rates showed an inconspicuous deformation. We may conclude that as long as the loading rates are low enough so that the pore pressure can be dissipated time-efficiently, it will not affect the effective stress coefficient of claystone.
5. Conclusions
- Several loading–unloading cycles were conducted on the saturated claystone samples, and the deformation during this procedure was recorded. The results showed that both of the two samples were dilatant when the increments of pore pressure were greater than the increments of confining pressure; conversely, these samples were compressed when the increments of pore pressure were less than the increments of confining pressure; finally, the deformation of the sample was hardly observed when the increments of pore pressure and confining pressure were equal. The conclusion is that the effective stress coefficient of claystone is close to one.
- The relationship between effective stress and strain was analyzed to determine the effective stress coefficient of claystone. The results showed that the coefficient was 0.991 for sample one and 0.995 for sample two.
- The relationship between the effective stress coefficient of claystone and the potential influencing factors (the neutral stress and loading rate) were studied. The results show that the neutral stress and loading rate may have little effect on the effective stress coefficient of claystone.
Author Contributions
Funding
Institutional Review Board Statement
Informed Consent Statement
Data Availability Statement
Conflicts of Interest
References
- Yu, H.D.; Chen, W.Z.; Jia, S.P.; Cao, J.J.; Li, X.L. Experimental study on the hydro-mechanical behavior of Boom clay. Int. J. Rock Mech. Min. Sci. 2012, 53, 159–165. [Google Scholar] [CrossRef]
- Ghabezloo, S.; Sulem, J.; Guédon, S.; Martineau, F. Effective stress law for the permeability of a limestone. Int. J. Rock Mech. Min. Sci. 2009, 46, 297–306. [Google Scholar] [CrossRef]
- Biot, M.A. General theory of three-dimensional consolidation. J. Appl. Phys. 1941, 12, 155–164. [Google Scholar] [CrossRef]
- Skempton, A.W. Selected Papers on Soil Mechanic; Thomas Telford Publishing: London, UK, 1984. [Google Scholar]
- Taghizadeh, R.; Goshtasbi, K.; Manshad, A.K.; Ahangari, K. Geomechanical and thermal reservoir simulation during steam flooding. Struct. Eng. Mech. 2018, 66, 505–513. [Google Scholar] [CrossRef]
- Sonmezer, Y.B. Energy-based evaluation of liquefaction potential of uniform sands. Geomech. Eng. 2019, 17, 145–156. [Google Scholar] [CrossRef]
- Lee, H.; Oh, T.M.; Park, C. Analysis of permeability in rock fracture with effective stress at deep depth. Geomech. Eng. 2020, 22, 375–384. [Google Scholar] [CrossRef]
- Guerriero, V.; Mazzoli, S. Theory of effective stress in soil and rock and implications for fracturing processes: A review. Geosciences 2021, 11, 119. [Google Scholar] [CrossRef]
- Nur, A.; Byerlee, J.D. An exact effective stress law for elastic deformation of rock with fluids. J. Geophys. Res. 1971, 76, 6414–6419. [Google Scholar] [CrossRef]
- Zoback, M.D.; Byerlee, J.D. Permeability and effective stress. AAPG Bull. 1975, 59, 154–158. [Google Scholar] [CrossRef]
- Berryman, J.G. Effective stress for transport properties of inhomogeneous porous rock. J. Geophys. Res. Solid Earth 1992, 97, 17409–17424. [Google Scholar] [CrossRef]
- Tuncay, K.; Corapcioglu, M.Y. Effective stress principle for saturated fractured porous media. Water Resour. Res. 1995, 31, 3103–3106. [Google Scholar] [CrossRef]
- George, J.D.; Barakat, M.A. The change in effective stress associated with shrinkage from gas desorption in coal. Int. J. Coal Geol. 2001, 45, 105–113. [Google Scholar] [CrossRef]
- Kwon, O.; Kronenberg, A.K.; Gangi, A.F.; Johnson, B. Permeability of Wilcox shale and its effective pressure law. J. Geophys. Res. Solid Earth 2001, 106, 19339–19353. [Google Scholar] [CrossRef]
- Tsuji, T.; Tokuyama, H.; Pisani, P.C.; Moore, G. Effective stress and pore pressure in the Nankai accretionary prism off the Muroto Peninsula, southwestern Japan. J. Geophys. Res. Solid Earth 2008, 113, 401. [Google Scholar] [CrossRef]
- Bagherieh, A.R.; Khalili, N.; Habibagahi, G.; Ghahramani, A. Drying response and effective stress in a double porosity aggregated soil. Eng. Geol. 2009, 105, 44–50. [Google Scholar] [CrossRef]
- Nowamooz, H.; Ho, X.N.; Chazallon, C.; Hornych, P. The effective stress concept in the cyclic mechanical behavior of a natural compacted sand. Eng. Geol. 2013, 152, 67–76. [Google Scholar] [CrossRef]
- Konrad, J.M.; Lebeau, M. Capillary-based effective stress formulation for predicting shear strength of unsaturated soils. Can. Geotech. J. 2015, 52, 2067–2076. [Google Scholar] [CrossRef]
- Zhang, C.L. Examination of effective stress in clay rock. J. Rock Mech. Geotech. Eng. 2016, 9, 479–489. [Google Scholar] [CrossRef]
- Saurabh, S.; Harpalani, S. The effective stress law for stress-sensitive transversely isotropic rocks. Int. J. Rock Mech. Min. Sci. 2018, 101, 69–77. [Google Scholar] [CrossRef]
- Ma, J.; Querci, L.; Hattendorf, B.; Saar, M.; Kong, X.Z. The effect of mineral dissolution on the effective stress law for permeability in a tight sandstone. Geophys. Res. Lett. 2020, 47, e2020GL088346. [Google Scholar] [CrossRef]
- Civan, F. Effective-stress coefficients of porous rocks involving shocks and loading/unloading hysteresis. SPE J. 2021, 26, 44–67. [Google Scholar] [CrossRef]
- Zhao, Z.; Chen, S.; Chen, Y.; Yang, Q. On the effective stress coefficient of single rough rock fractures. Int. J. Rock Mech. Min. Sci. 2021, 137, 104556. [Google Scholar] [CrossRef]
- Dehandschutter, B.; Vandycke, S.; Sintubin, M.; Vandenberghe, N.; Wouters, L. Brittle fractures and ductile shear bands in argillaceous sediments: Inferences from Oligocene Boom Clay (Belgium). J. Struct. Geol. 2005, 27, 1095–1112. [Google Scholar] [CrossRef]
- Mesri, G.; Adachi, G.; Ullrich, C.R. Pore-pressure response in rock to undrained change in all-round stress. Géotechnique 1976, 26, 317–330. [Google Scholar] [CrossRef]
- Dropek, R.K.; Johnson, J.N.; Walsh, J.B. The influence of pore pressure on the mechanical properties of Kayenta sandstone. J. Geophys. Res. Solid Earth 1978, 83, 2817–2824. [Google Scholar] [CrossRef]
- Yu, H.D.; Chen, W.Z.; Gong, Z.; Ma, Y.S.; Chen, G.J.; Li, X.L. Influence of temperature on the hydro-mechanical behavior of Boom Clay. Int. J. Rock Mech. Min. Sci. 2018, 108, 189–197. [Google Scholar] [CrossRef]
- Chen, G.J.; Sillen, X.; Verstricht, J.; Li, X.L. ATLAS III in situ heating test in boom clay: Field data, observation and interpretation. Comput. Geotech. 2011, 38, 683–696. [Google Scholar] [CrossRef]


| References | Effective Stress | Related Research Work |
|---|---|---|
| Nur and Byerlee [9] | Saturated: η = 1 – (K/Ks); K is the bulk moduli of rock; Ks is the bulk moduli of grain. | The rock strain was quantified based on this effective stress principle, and its validity was verified via compression test results of sandstone and granite. |
| Zoback and Byerlee [10] | Saturated: A variable greater than 1 and varies with stress. | The phenomenon that pore pressure has a greater impact on permeability than confining pressure was found according to the permeability test results of sandstone under different confining and pore pressures. |
| Berryman [11] | Saturated: ; is the bulk modulus of drained porous frame; K(1) and K(2) are the drained frame moduli of porous constituents (1) and (2); η(1) and η(2) are the effective stress coefficient of porous constituents (1) and (2); θ is the relative change in the effective stress coefficient for a two-component porous medium. | The effective stress coefficients of a two-component porous medium are deduced based on the existing research work, and the phenomenon of Zoback and Byerlee [10] is explained based on this conclusion. |
| Tuncay and Corapcioglu [12] | Saturated: ;;; η1 is the effective stress coefficient for the fractures; η2 is the effective stress coefficient for the pores; is the pore pressure in the fractures; is the pore pressure in the pores; is the volume fraction of the fractures; is the bulk moduli of grain; is the drained bulk modulus of the fractured porous medium; is the drained bulk modulus of the nonfractured porous medium. | An effective stress principle for saturated fractured porous media is proposed based on the assumption of linear elasticity. |
| George and Barakat [13] | Saturated: η = 0.71; | A series of loading–unloading (both total stress and pore pressure) cycles applied by gas pressure were performed on the coal specimen, and the effective stress coefficient was obtained. |
| Kwon et al. [14] | Saturated: ; is the permeability. | The effective stress coefficient of illite-rich shale was determined according to the transient pulse test results of saturated samples. |
| Tsuji et al. [15] | Saturated: Terzaghi’s effective stress principle. | A theoretical relationship between the acoustic velocity and mean effective stress of the Nankai accretionary prism was calculated using DEM (Differential Effective Medium) theory and the aspect ratio spectrum of pore space, and Terzaghi’s effective stress principle was introduced to analyze the pore pressure distribution of Nankai trough. |
| Bagherieh et al. [16] | Unsaturated: ; , , , and are the micropore water, micropore air, macro pore water, and macro pore air pressures; and are the conventional effective stress coefficients of saturated double-porous media; is the suction value separating saturated from unsaturated conditions in the micropores; is the matric suction value separating saturated from unsaturated conditions in the macro pores; is the material parameter. | Drying and one-dimensional consolidation tests are performed on initially saturated samples of the kaolin (double-porosity compacted soil) at different net stresses, and the test results were accurately predicted using the new effective stress principle. |
| Ghabezloo et al. [2] | Saturated: ; and are the fitting parameters; is the differential stress. | The effective stress law for the permeability of limestone is studied by drained hydrostatic compression and constant-head permeability tests, and the results show that the effective stress coefficient was linearly related to differential stress. |
| Nowamooz et al. [17] | Unsaturated: ; is the pore water pressure; is the pore air pressure; is the angle indicating the increase in the matrix suction’s shear stress function; is the lowest matrix suction. | The effective stress law of compacted natural clay sand in Missillac was obtained using the direct shear test and the soil water retention curve (SWRC), and its validity was verified by simulating the resilient behavior of repeated-load triaxial tests. |
| Konrad and Lebeau [18] | Unsaturated: ; is the fraction of the fracture surface wetted by water; is the maximum local aperture currently occupied by water; is the total perimeter of water menisci between two fracture walls; is the contact angle of the fracture water. | The effective stress equation is derived for partially saturated rough-walled fractures with any aperture distributions based on the capillary law, and the nonlinearity of the effective stress parameter versus the saturation degree curves is found to be mainly determined by the surface roughness (or the coefficient of variation) rather than the mean aperture of the fractures. |
| Zhang [19] | Saturated: ; is the total normal force externally applied on the surface ; is the total normal force acting on the solid– solid contact area, , with the local total stress ; is the total normal repulsive force acting in the water-film section, , between clay particles, with the local total pressure ; is the pressure acting on the surface in the large pores occupied by free water. | The effective stress in a dense clay–water system is transferred through both the adsorbed interparticle porewater in narrow pores and the solid–solid contact between non-clay mineral grains. This concept has been widely validated by various kinds of experiments performed on the COX and OPA claystones. |
| Saurabh and Harpalani [20] | Unsaturated:
; , and are the total stress, compliance matrix, and strain along the direction, respectively; and are the effective stress coefficients of transversely isotropic media; is the pore pressure; is the pore pressure in the cleat system of media; is a pressure-dependent quantity coupling the sorption-based stress and strain in a microporous media. | The estimated values of the effective stress coefficients in both the vertical and horizontal directions are different, varying with pressure for methane depletion, and a conceptual physical model of effective stress, which considered absorption, was proposed. |
| Ma et al. [21] | Saturated: ; and are the fitting parameters. | A series of flow-through experiments consisting of three continuous stages (pre-reaction stage, reaction stage, and post-reaction stage) were conducted, and the cross-plot method was introduced to determine the effective law of tight sandstone with mineral dissoluble mineral. |
| Civan [22] | Saturated: ; and are the fitting parameters; is the intrinsic permeability of porous rock; is the porosity of porous formation. | The modified power-law equation yields a physically meaningful correlation because it successfully satisfies the low-end- and high-end-limit values of the effective stress coefficient and also provides a better quality match of the available experimental data than the semilogarithmic equation and the popular basic power-law equation. |
| Zhao et al. [23] | Saturated: ; is the initial normal stiffness; is the maximum fracture closure. | A new effective stress coefficient model for single rough water-bearing fractures is proposed in terms of initial normal stiffness and maximum normal closure, and it was verified by laboratory and in situ experimental data. |
| Number | Height (mm) | Diameter (mm) | Density (g/cm3) | Dry Density (g/cm3) | Water Content | Void Ratio | Initial Saturation |
|---|---|---|---|---|---|---|---|
| Sample one | 76.26 | 38.36 | 2.02 | 1.68 | 20.68% | 0.64 | 89.06% |
| Sample two | 75.81 | 37.81 | 2.03 | 1.69 | 19.46% | 0.63 | 80.28% |
| Mineral Composition | Illite | Kaolinite | Illite-Smectite Mix Layer | Chlorite | Quartz | Calcite, Dolomite | Feldspar |
|---|---|---|---|---|---|---|---|
| Proportion (%) | 15 | 15 | 20 | 25 | 15 | 6 | 4 |
| Sample Number | First Time | Second Time |
|---|---|---|
| Sample one | 0.913 | 0.925 |
| Sample two | 0.907 | 0.914 |
| The Number of Cycles | Deformation of Sample One | Deformation of Sample Two | ||||
|---|---|---|---|---|---|---|
| Axial Strain | Radial Strain | Volumetric Strain | Axial Strain | Radial Strain | Volumetric Strain | |
| The first | −4.95 | −0.81 | −6.57 | −5.24 | −0.73 | −6.70 |
| The second | −2.36 | −0.23 | −2.82 | −2.46 | −0.30 | −3.06 |
| The third | −1.36 | −0.07 | −1.50 | −1.49 | −0.17 | −1.83 |
| The fourth | −0.89 | −0.07 | −1.03 | −1.01 | −0.10 | −1.21 |
| The fifth | −0.45 | −0.02 | −0.49 | −0.51 | −0.03 | −0.57 |
| The sixth | ≈0 | ≈0 | ≈0 | ≈0 | ≈0 | ≈0 |
| The last | 0.46 | 0.08 | 0.62 | 0.47 | 0.11 | 0.69 |
| Physical Parameters | Ev/MPa | Vvh | η |
|---|---|---|---|
| Range | 300–800 | 0.1–0.3 | 0.9–1.0 |
Disclaimer/Publisher’s Note: The statements, opinions and data contained in all publications are solely those of the individual author(s) and contributor(s) and not of MDPI and/or the editor(s). MDPI and/or the editor(s) disclaim responsibility for any injury to people or property resulting from any ideas, methods, instructions or products referred to in the content. |
© 2023 by the authors. Licensee MDPI, Basel, Switzerland. This article is an open access article distributed under the terms and conditions of the Creative Commons Attribution (CC BY) license (https://creativecommons.org/licenses/by/4.0/).
Share and Cite
Li, F.; Chen, W.; Wu, Z.; Yu, H.; Li, M.; Zhang, Z.; Zha, F. Laboratory Study of Effective Stress Coefficient for Saturated Claystone. Appl. Sci. 2023, 13, 10592. https://doi.org/10.3390/app131910592
Li F, Chen W, Wu Z, Yu H, Li M, Zhang Z, Zha F. Laboratory Study of Effective Stress Coefficient for Saturated Claystone. Applied Sciences. 2023; 13(19):10592. https://doi.org/10.3390/app131910592
Chicago/Turabian StyleLi, Fanfan, Weizhong Chen, Zhigang Wu, Hongdan Yu, Ming Li, Zhifeng Zhang, and Fusheng Zha. 2023. "Laboratory Study of Effective Stress Coefficient for Saturated Claystone" Applied Sciences 13, no. 19: 10592. https://doi.org/10.3390/app131910592