Article

Visual Ranging Based on Object Detection Bounding Box Optimization

School of Mechanical Engineering, Jiangsu University of Science and Technology, Zhenjiang 212100, China
*
Authors to whom correspondence should be addressed.
Appl. Sci. 2023, 13(19), 10578; https://doi.org/10.3390/app131910578
Submission received: 12 August 2023 / Revised: 19 September 2023 / Accepted: 20 September 2023 / Published: 22 September 2023

Abstract

:
Faster and more accurate ranging can be achieved by combining the object detection technique based on deep learning with conventional visual ranging. However, changes in scene, uneven lighting, fuzzy object boundaries and other factors may result in a non-fit phenomenon between the detection bounding box and the object. The pixel spacing between the detection bounding box and the object can cause ranging errors. To reduce pixel spacing, increase the degree of fit between the object detection bounding box and the object, and improve ranging accuracy, an object detection bounding box optimization method is proposed. Two evaluation indicators, WOV and HOV, are also proposed to evaluate the results of bounding box optimization. The experimental results show that the pixel width of the bounding box is optimized by 1.19~19.24% and the pixel height is optimized by 0~12.14%. At the same time, the ranging experiments demonstrate that the optimization of the bounding box improves the ranging accuracy. In addition, few practical monocular range measurement techniques can also determine the distance to an object whose size is unknown. Therefore, a similar triangle ranging technique based on height difference is suggested to measure the distance to items of unknown size. A ranging experiment is carried out based on the optimization of the detecting bounding box, and the experimental results reveal that the ranging relative error within 6 m is between 0.7% and 2.47%, allowing for precise distance measurement.

1. Introduction

Visual ranging, which is a research hotspot in the field of computer vision, automatically measures the distance between an object and the camera and has significant research implications [1,2]. It is frequently employed in research areas such as visual navigation [3], traffic safety [4], visual obstacle avoidance [5], and others. The two primary visual ranging techniques are monocular vision measurement and stereo vision measurement [6]. By utilizing the parallax concept, stereo vision can measure distance, but accurate feature point matching is challenging and can result in subpar real-time performance [7]. In contrast, monocular vision simply employs one image to calculate distance, and it has drawn a lot of industry attention due to its quick computation speed, straightforward design, and superior mobility [8].
Perspective-n-point (PNP) ranging, imaging models, data regression modeling, and geometric relation methods are typical monocular distance measurement techniques. The PNP ranging method needs to achieve ranging by corresponding objects [9], which is not applicable without corresponding objects. The imaging model method, which is inapplicable for objects with unknown sizes, relies on a similar triangle relationship between the known size of the object and the object’s pixel size to achieve ranging [10]. The method based on data regression modeling determines the precise distance corresponding to the pixel point through a data fitting function [11], but this method has a significant burden and is not portable or generalizable. In contrast, the geometric relation method can measure the distance between the camera and an object of unknown size by establishing a geometric ranging model between the camera and the object [12], a method which has simple structure and strong portability. All in all, there are few practical methods that can measure the distance objects of unknown size in monocular visual ranging.
In visual ranging, object detection is the first phase. In visual fields including face recognition [13], pedestrian detection [14], video detection [15], and vehicle detection [16], object detection is frequently used to identify and locate objects. Deep learning detection methods and conventional detection methods are two categories of object detection. Traditional detection methods include DPM [17], Selective Search [18], Oxford-MKL [19], NLPR-HOGLBP [20], etc. Deep learning has made significant progress in object detection over the past few years due to the constant advancement of artificial intelligence and machine vision [21]. In terms of detection accuracy, detection speed, and generalization, the object detection algorithms represented by you only look once (YOLO) [22], single shot multiBox detector (SSD) [23], regions with convolutional neural network features (R-CNN) [24], feature pyramid network (FPN) [25], etc., greatly outperform the conventional object identification approaches. As a result, numerous researchers have merged deep learning-based object detection algorithms with the visual ranging approach for object ranging, with promising results. Meng [26] proposed a single-vehicle ranging method based on a fitting approach by combining the R-CNN algorithm with the data regression modeling method. The experiment’s lateral inaccuracy was within 0.3 m, while its error within 60 m was within 10%. Yang [27] proposed a vehicle distance measurement method for two-way lanes with an average inaccuracy of 3.15% within 60 m by combining the YOLOv5 algorithm and the geometric relation method. By combining the YOLOv3 algorithm with binocular vision, Fu [28] developed an unmanned aerial vehicle (UAV) ranging method, and the experimental results demonstrate that the measured relative error may reach a minimum of 2.54%. Huang [29] proposed a locating method for small object pedestrians that has a minimum longitudinal error of 3% and a minimum transverse error of 4.5% within 90 m by combining yolov3 with the geometric relation approach.
The combination of deep learning object detection algorithms and visual ranging enables faster and more accurate measurement of the distance to the object. However, when most researchers apply this method, they do not consider the situation that the object detection bounding box does not fit the object due to uneven illumination, fuzzy object boundaries and other reasons, and the pixel spacing between the detection bounding box and the object results in ranging errors.
In order to address this issue, this study proposes an object detection bounding box optimization method to reduce pixel spacing and increase the degree of fit between the bounding box and the object, hence increasing the range accuracy.
In addition, there are few practical methods for measuring objects of unknown size in monocular visual ranging. Therefore, a similar triangle ranging method based on height difference is proposed. This method can measure the distance to objects of unknown size and also represents a new method for measuring monocular visual ranging.

2. Research Content and Works

With the advancement of deep learning in recent years, monocular visual ranging based on object detection has been widely used, yet there are some neglected issues in this research.
First of all, most scholars have ignored an issue when using this method. Due to the uneven distribution of light and the fuzzy object boundary and other factors, there may be a non-fit phenomenon between the object detection bounding box and the object, resulting in pixel spacing (as shown in Figure 1), and this pixel spacing causes ranging errors.
Secondly, among all the monocular range measurement methods, there are very few methods that are really practical and can measure objects of unknown size. The PNP ranging method needs the placement of an object in order to measure distance. The imaging model method needs knowledge of the object size in order to measure distance, and the method based on data regression modeling is used to find the real distance corresponding to the pixel point using a data fitting function. The methods described above are either laborious, time-consuming, or need an exact object size, so they are unsuitable for practical use.
In this study, we propose two methods to address the two issues mentioned above:
(1)
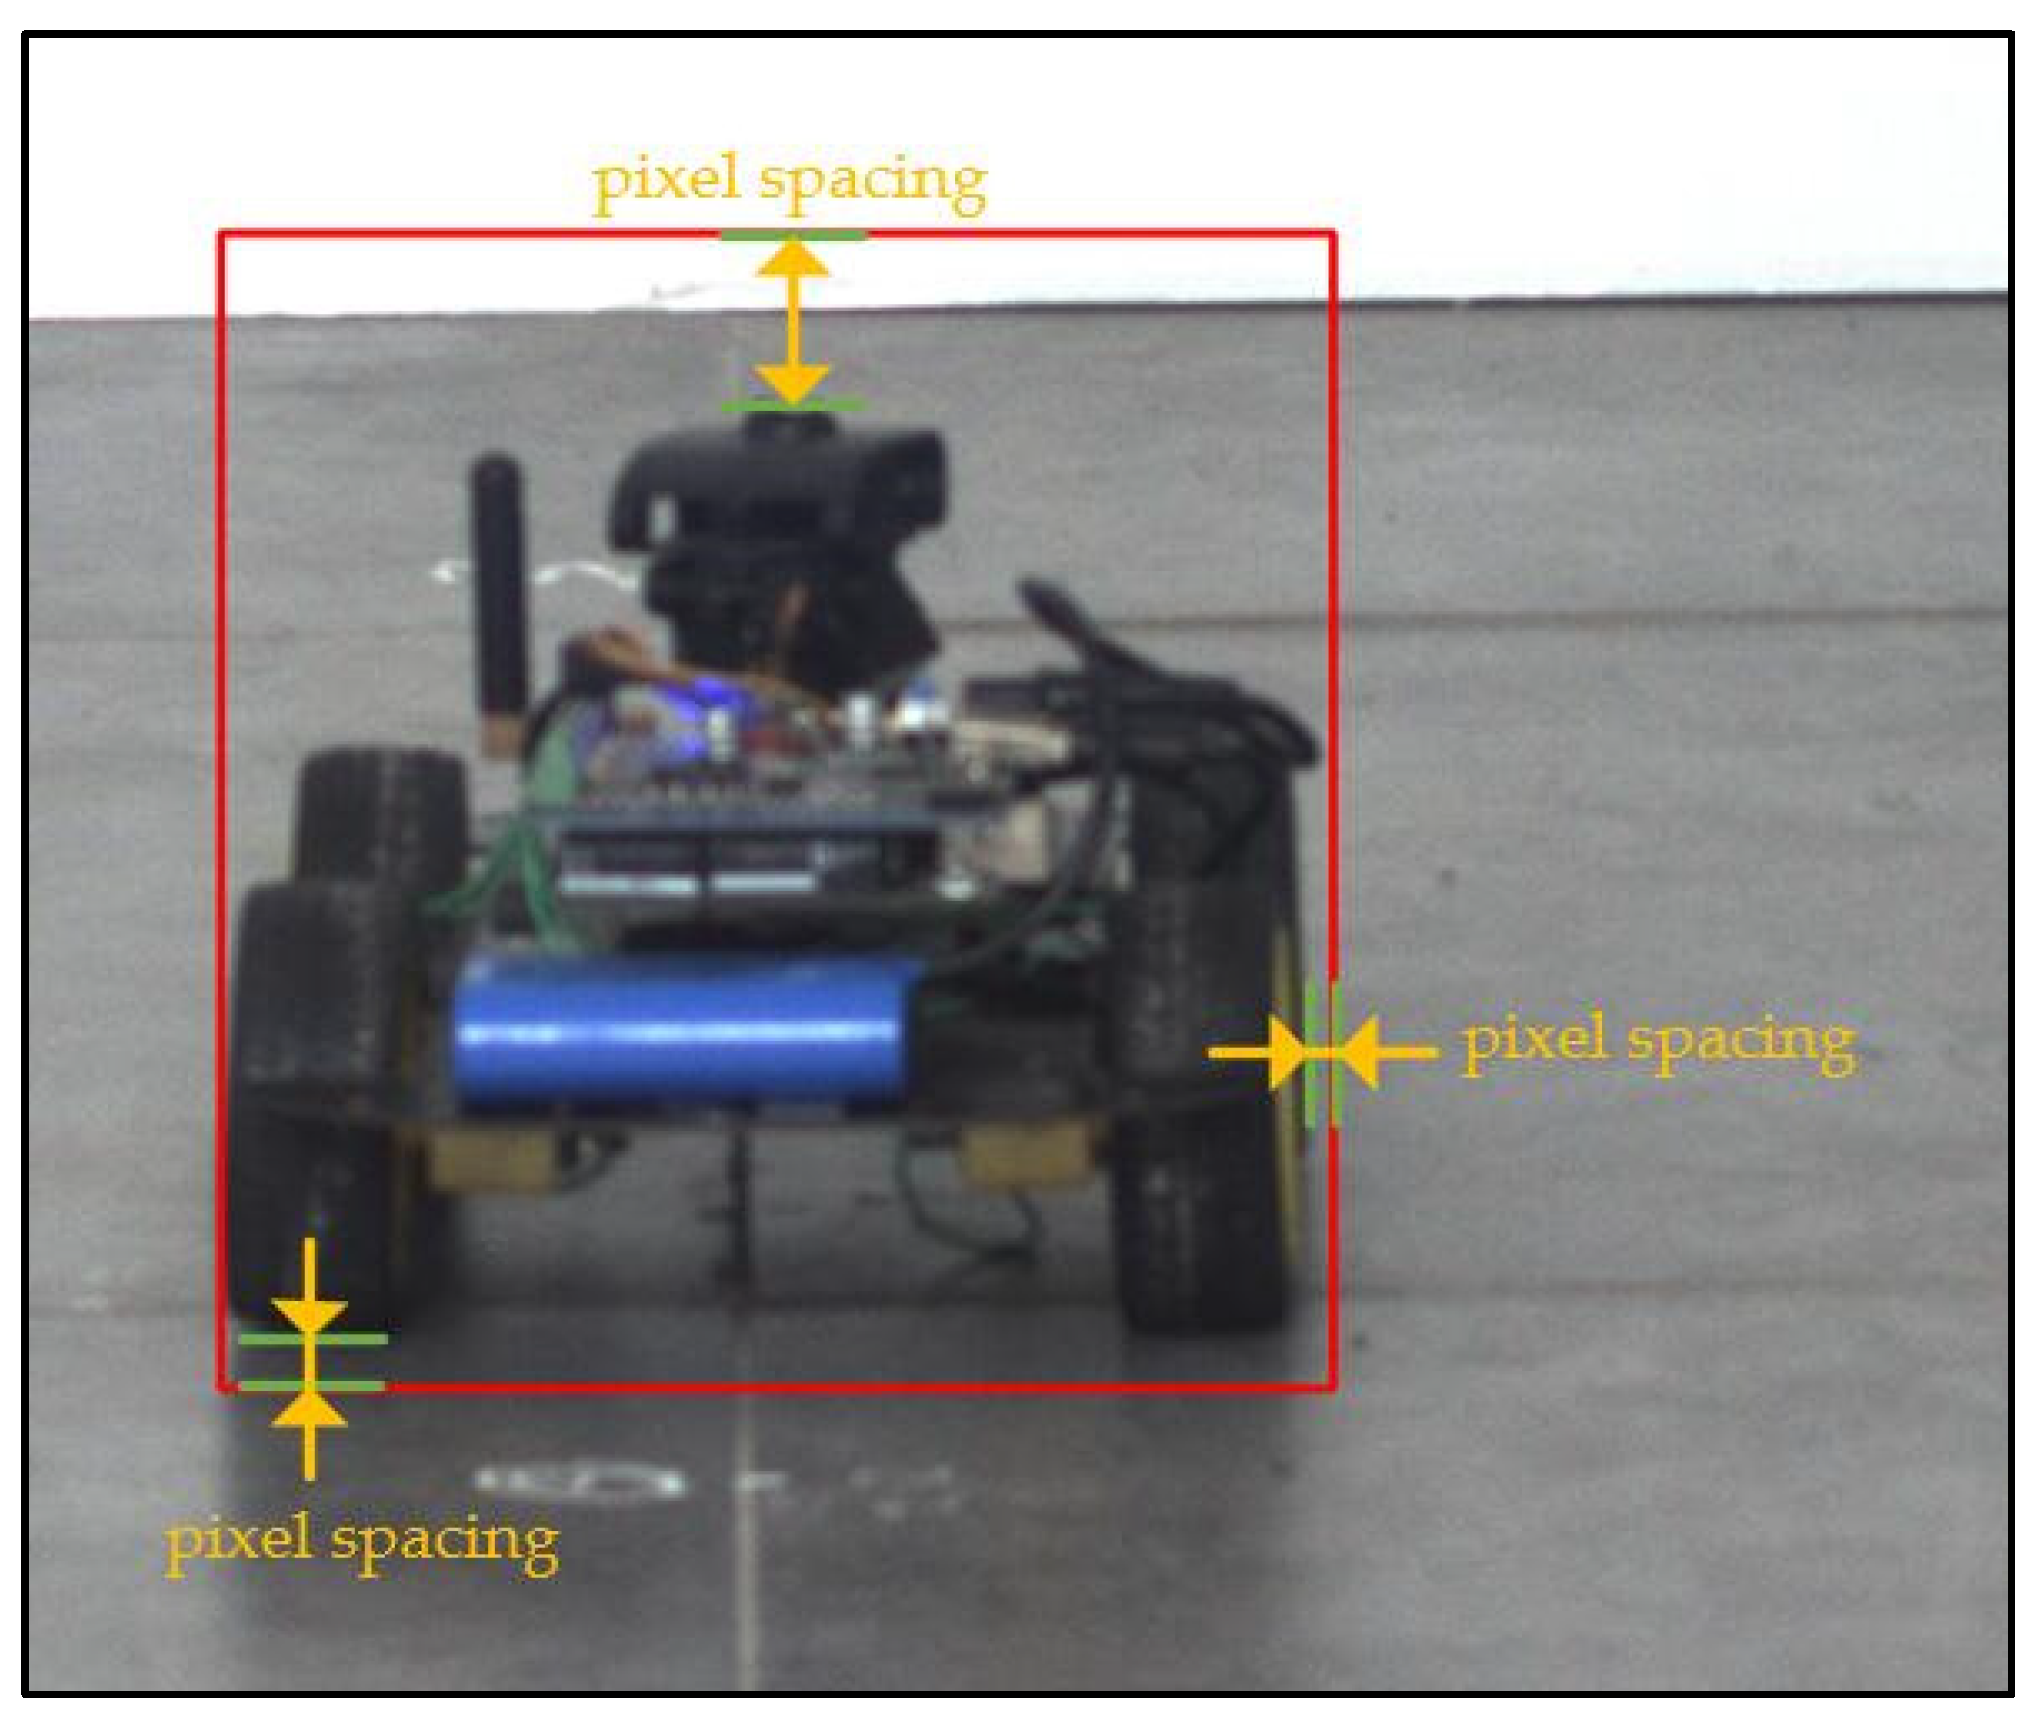
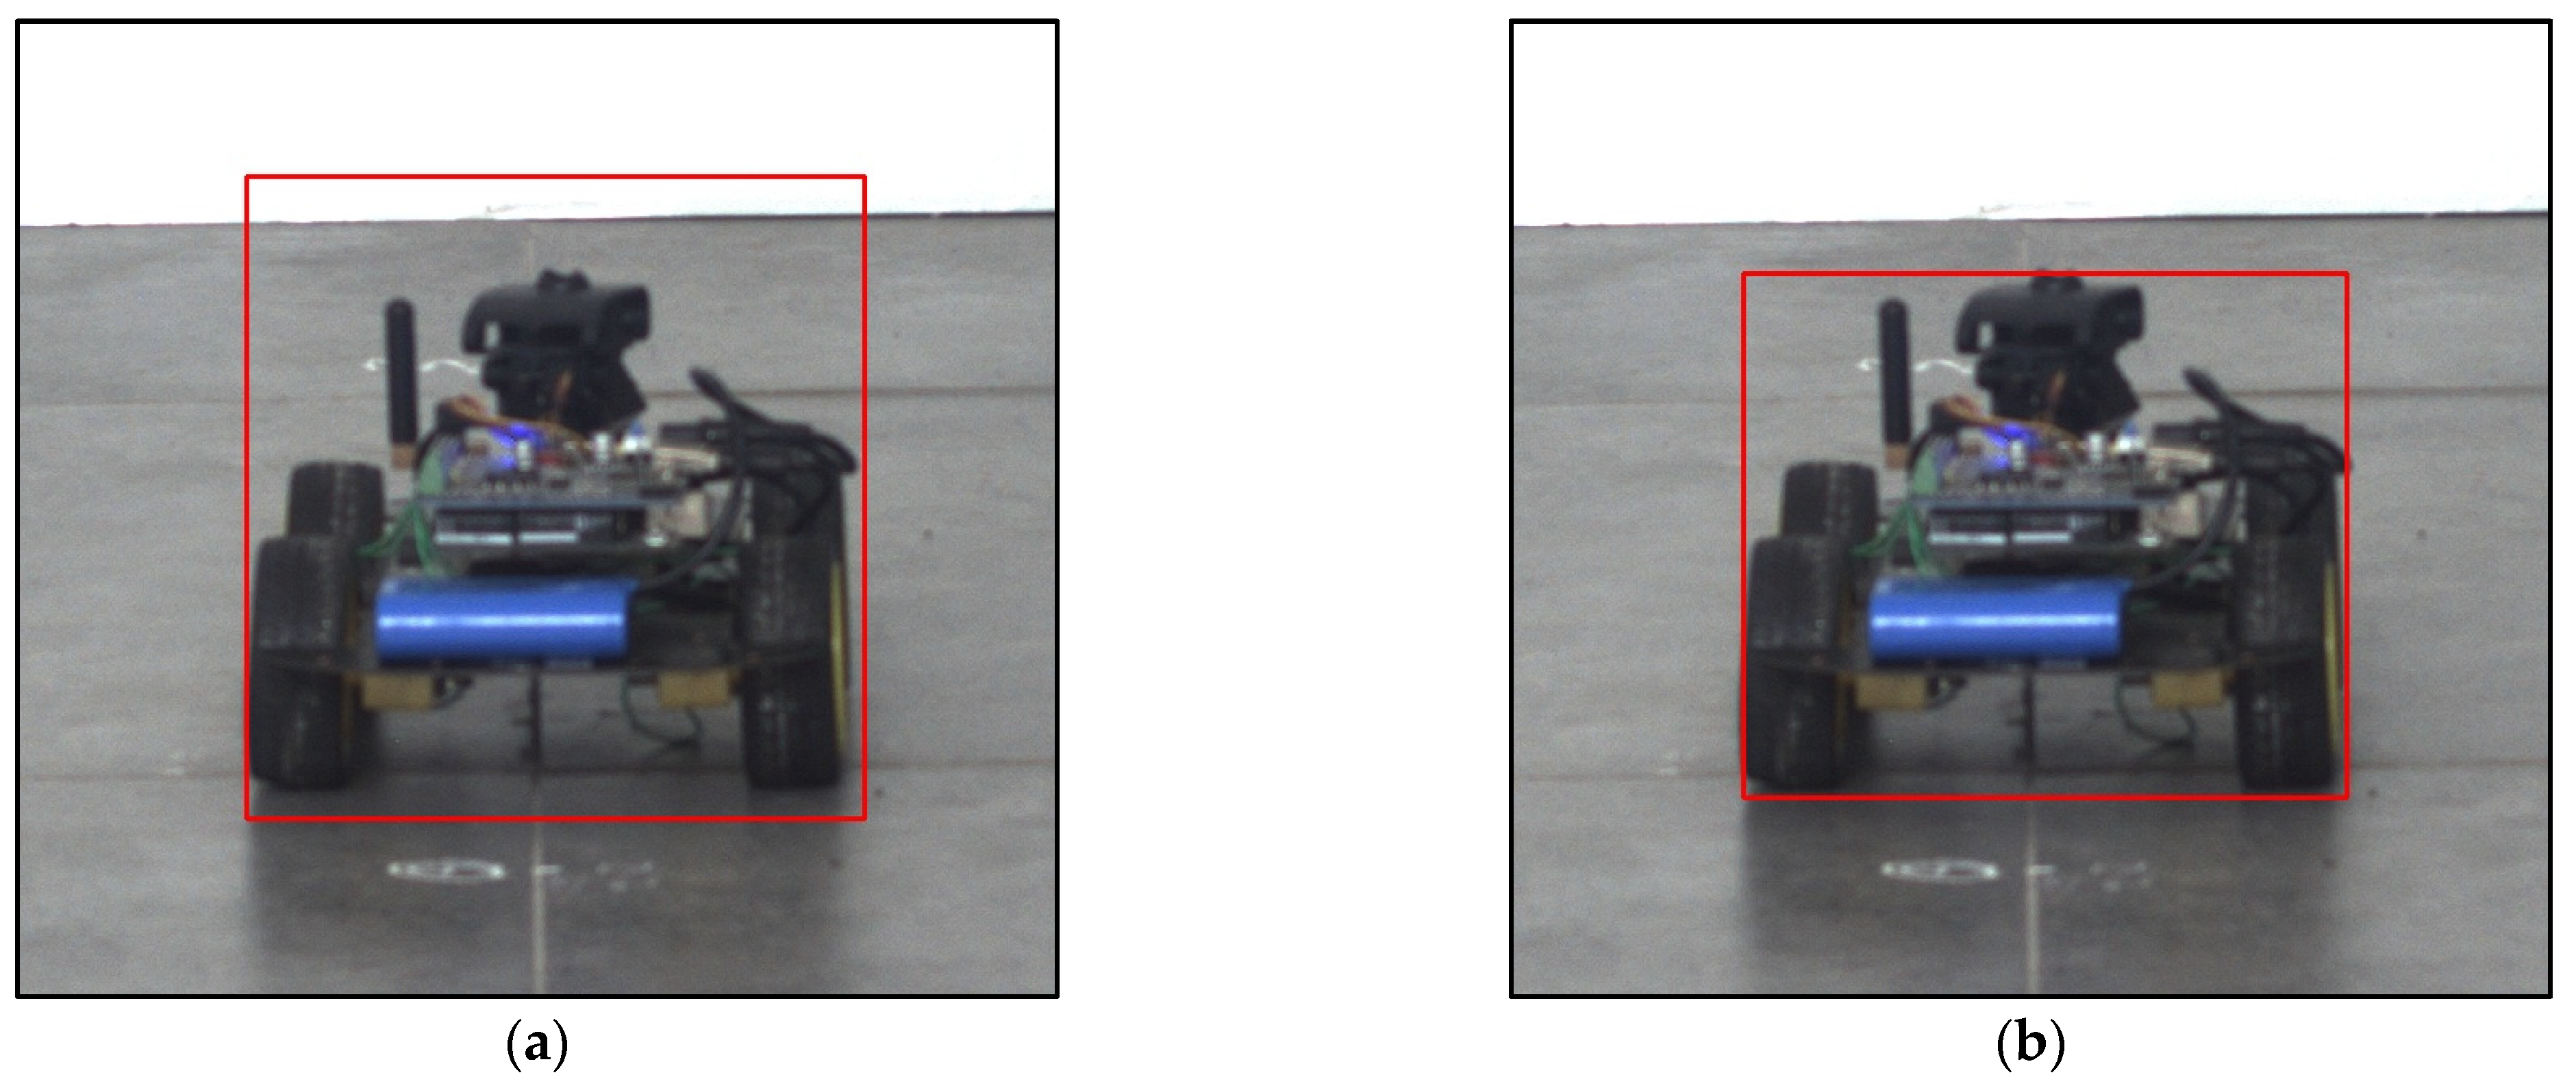
To address the issue of ranging error caused by the non-fit phenomenon between the object detection bounding box and the object, an object detection bounding box optimization method is proposed which can eliminate pixel spacing and improve the fit degree of the bounding box and the object, thereby improving ranging accuracy.
(2)
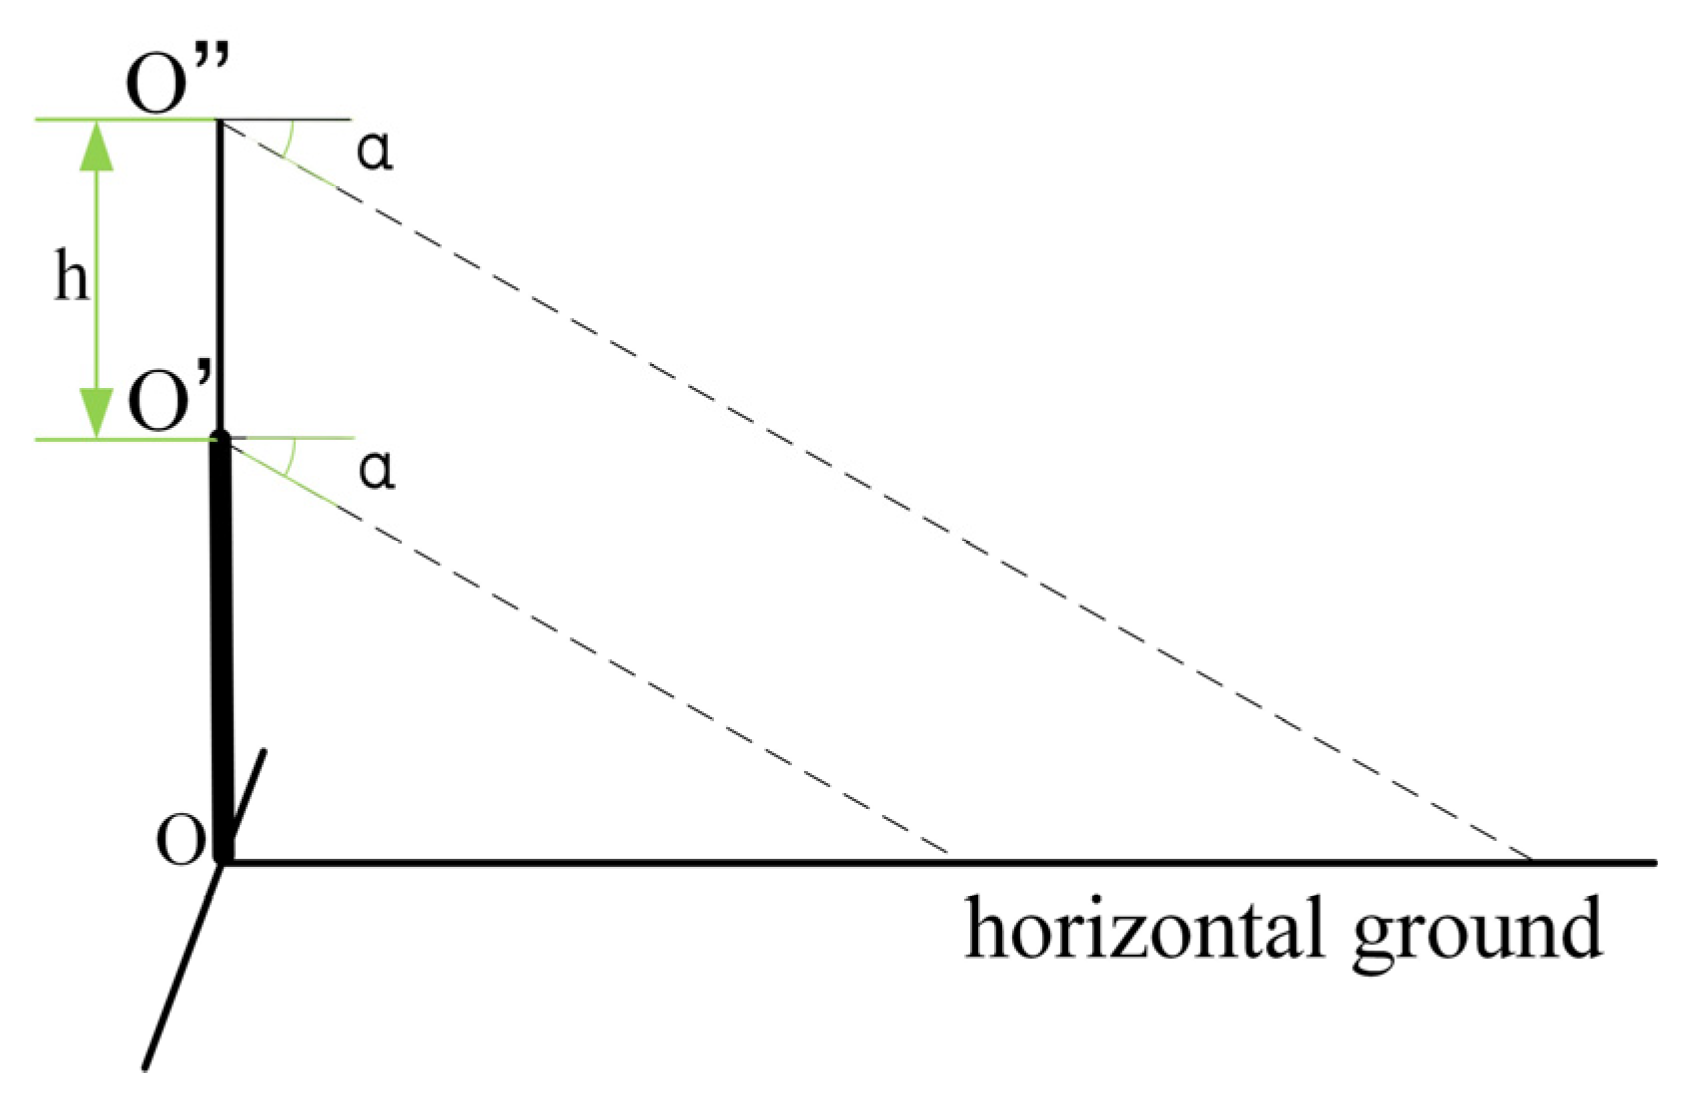
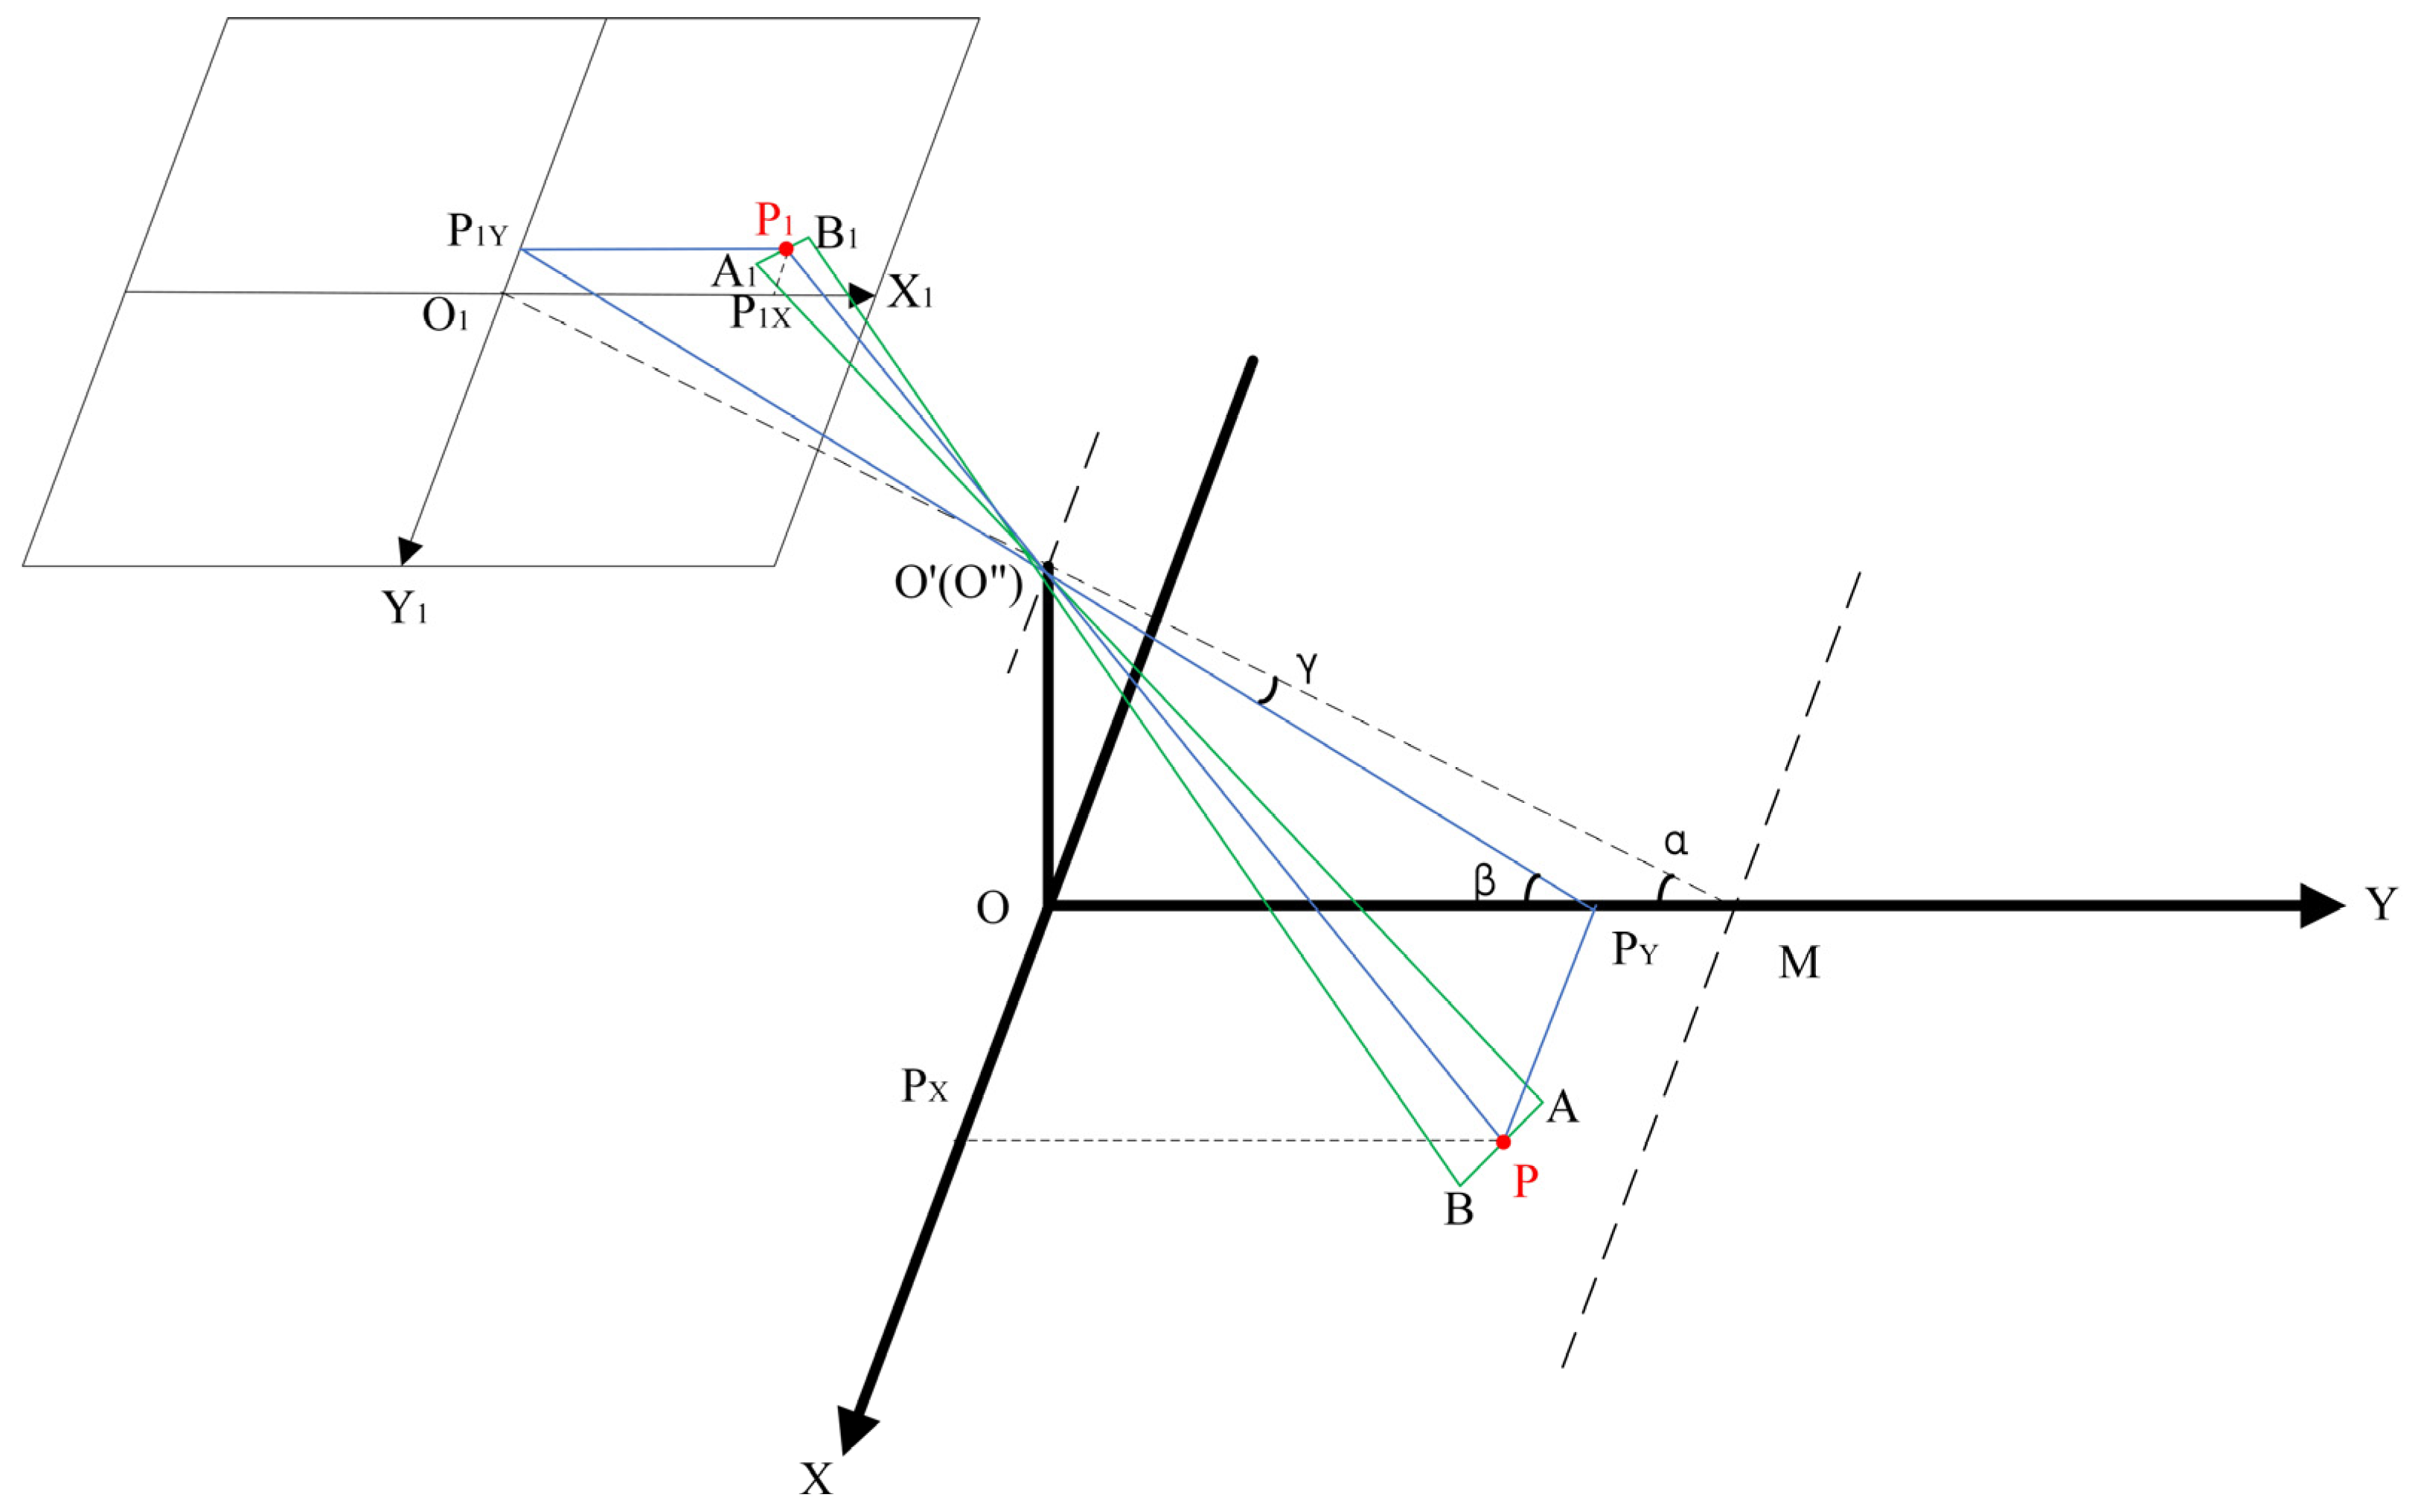
In response to the lack of practical methods for measuring the distance to an object of unknown size in monocular visual ranging, a similar triangle ranging method based on height difference is proposed. This method can realize the distance measurement of an object of unknown size and also provides a new method for monocular visual distance measurement.
The two methods described above are both improvements and inventions aimed at addressing current difficulties in the field of visual range based on object detection. In order to verify the two methods proposed in this paper, the first phase involves object detection. In this paper, we use the classical YOLOv5 algorithm for object detection. Secondly, to eliminate the pixel spacing caused by the non-fit phenomenon due to the mismatch between the object bounding box and the object, we use the proposed bounding box optimization method and then apply it to the ranging to improve the ranging accuracy. Finally, after optimizing the object detection bounding box, we use the proposed similar triangle ranging method based on height difference to carry out the ranging experiment.

3. Methods

3.1. YOLOv5 Object Detection

3.1.1. Methods and Evaluation Indicators

The two methods proposed in this paper are solutions to existing problems in the field of visual ranging based on object detection, and both of these methods are built upon object detection. In order to verify the effectiveness of the proposed methods, the first step is to perform object detection. Therefore, in this paper, the YOLOv5 algorithm is adopted for object detection.
YOLOv5 is the fifth generation of the YOLO algorithm, which is a typical generation in the YOLO series. It has numerous applications in the field of object detection due to its high detection accuracy and fast detection speed. Five versions of YOLOv5 are offered officially: YOLOv5n, YOLOv5s, YOLOv5m, YOLOv5l, and YOLOv5x. In this paper, the lightweight model YOLOv5s is used for object detection in order to achieve high detection accuracy and faster detection speed.
In order to obtain a good object detection model and to better apply the two methods proposed in this paper, precision (P), recall rate (R), and mean average accuracy (mAP) are used as evaluation measures to assess the training results of YOLOv5. P represents the proportion of correctly detected objects to the total number of detected objects, while R represents the percentage of correctly detected objects among all actual objects. In addition, mAP represents the average accuracy (AP) across all training classes.
P = T P T P + F P × 100 % ,
R = T P T P + F N × 100 % ,
m A P = ( A P ) N .
where TP represents the number of correctly detected objects, FP represents the number of error detections that treat non-objects as objects, and FN represents the number of missed detection objects. mAP = AP, which is due to the fact that the dataset produced has only one category (N = 1).

3.1.2. Data Set Preparation

The experiment employed a remote-control car as the detection object and used the MER-500-7UC camera with a resolution of 2592 pixels × 1944 pixels to collect 150 pictures as the initial samples for the remote-control car dataset. In general, larger datasets can lead to improved performance of deep learning models [30,31]. Data augmentation is a way to improve network performance by expanding the number of samples [32]. Common methods of data augmentation include flipping, rotation, translation, noise addition, color space transformation, brightness change, and so on [33].
The data augmentation technique is used to increase the number of samples in order to improve network performance, allowing the network to better learn features and create an object detection model. In this study, the sample count was increased by flipping, adding noise, and changing brightness (as shown in Figure 2). Ultimately, we obtained 750 samples, which were annotated using the Labellmg tool. The samples were then divided into training and testing sets, with 525 images in the training set and 225 images in the testing set. The specific experimental environment and configurations are shown in Table 1.

3.2. Object Detection Bounding Box Optimization

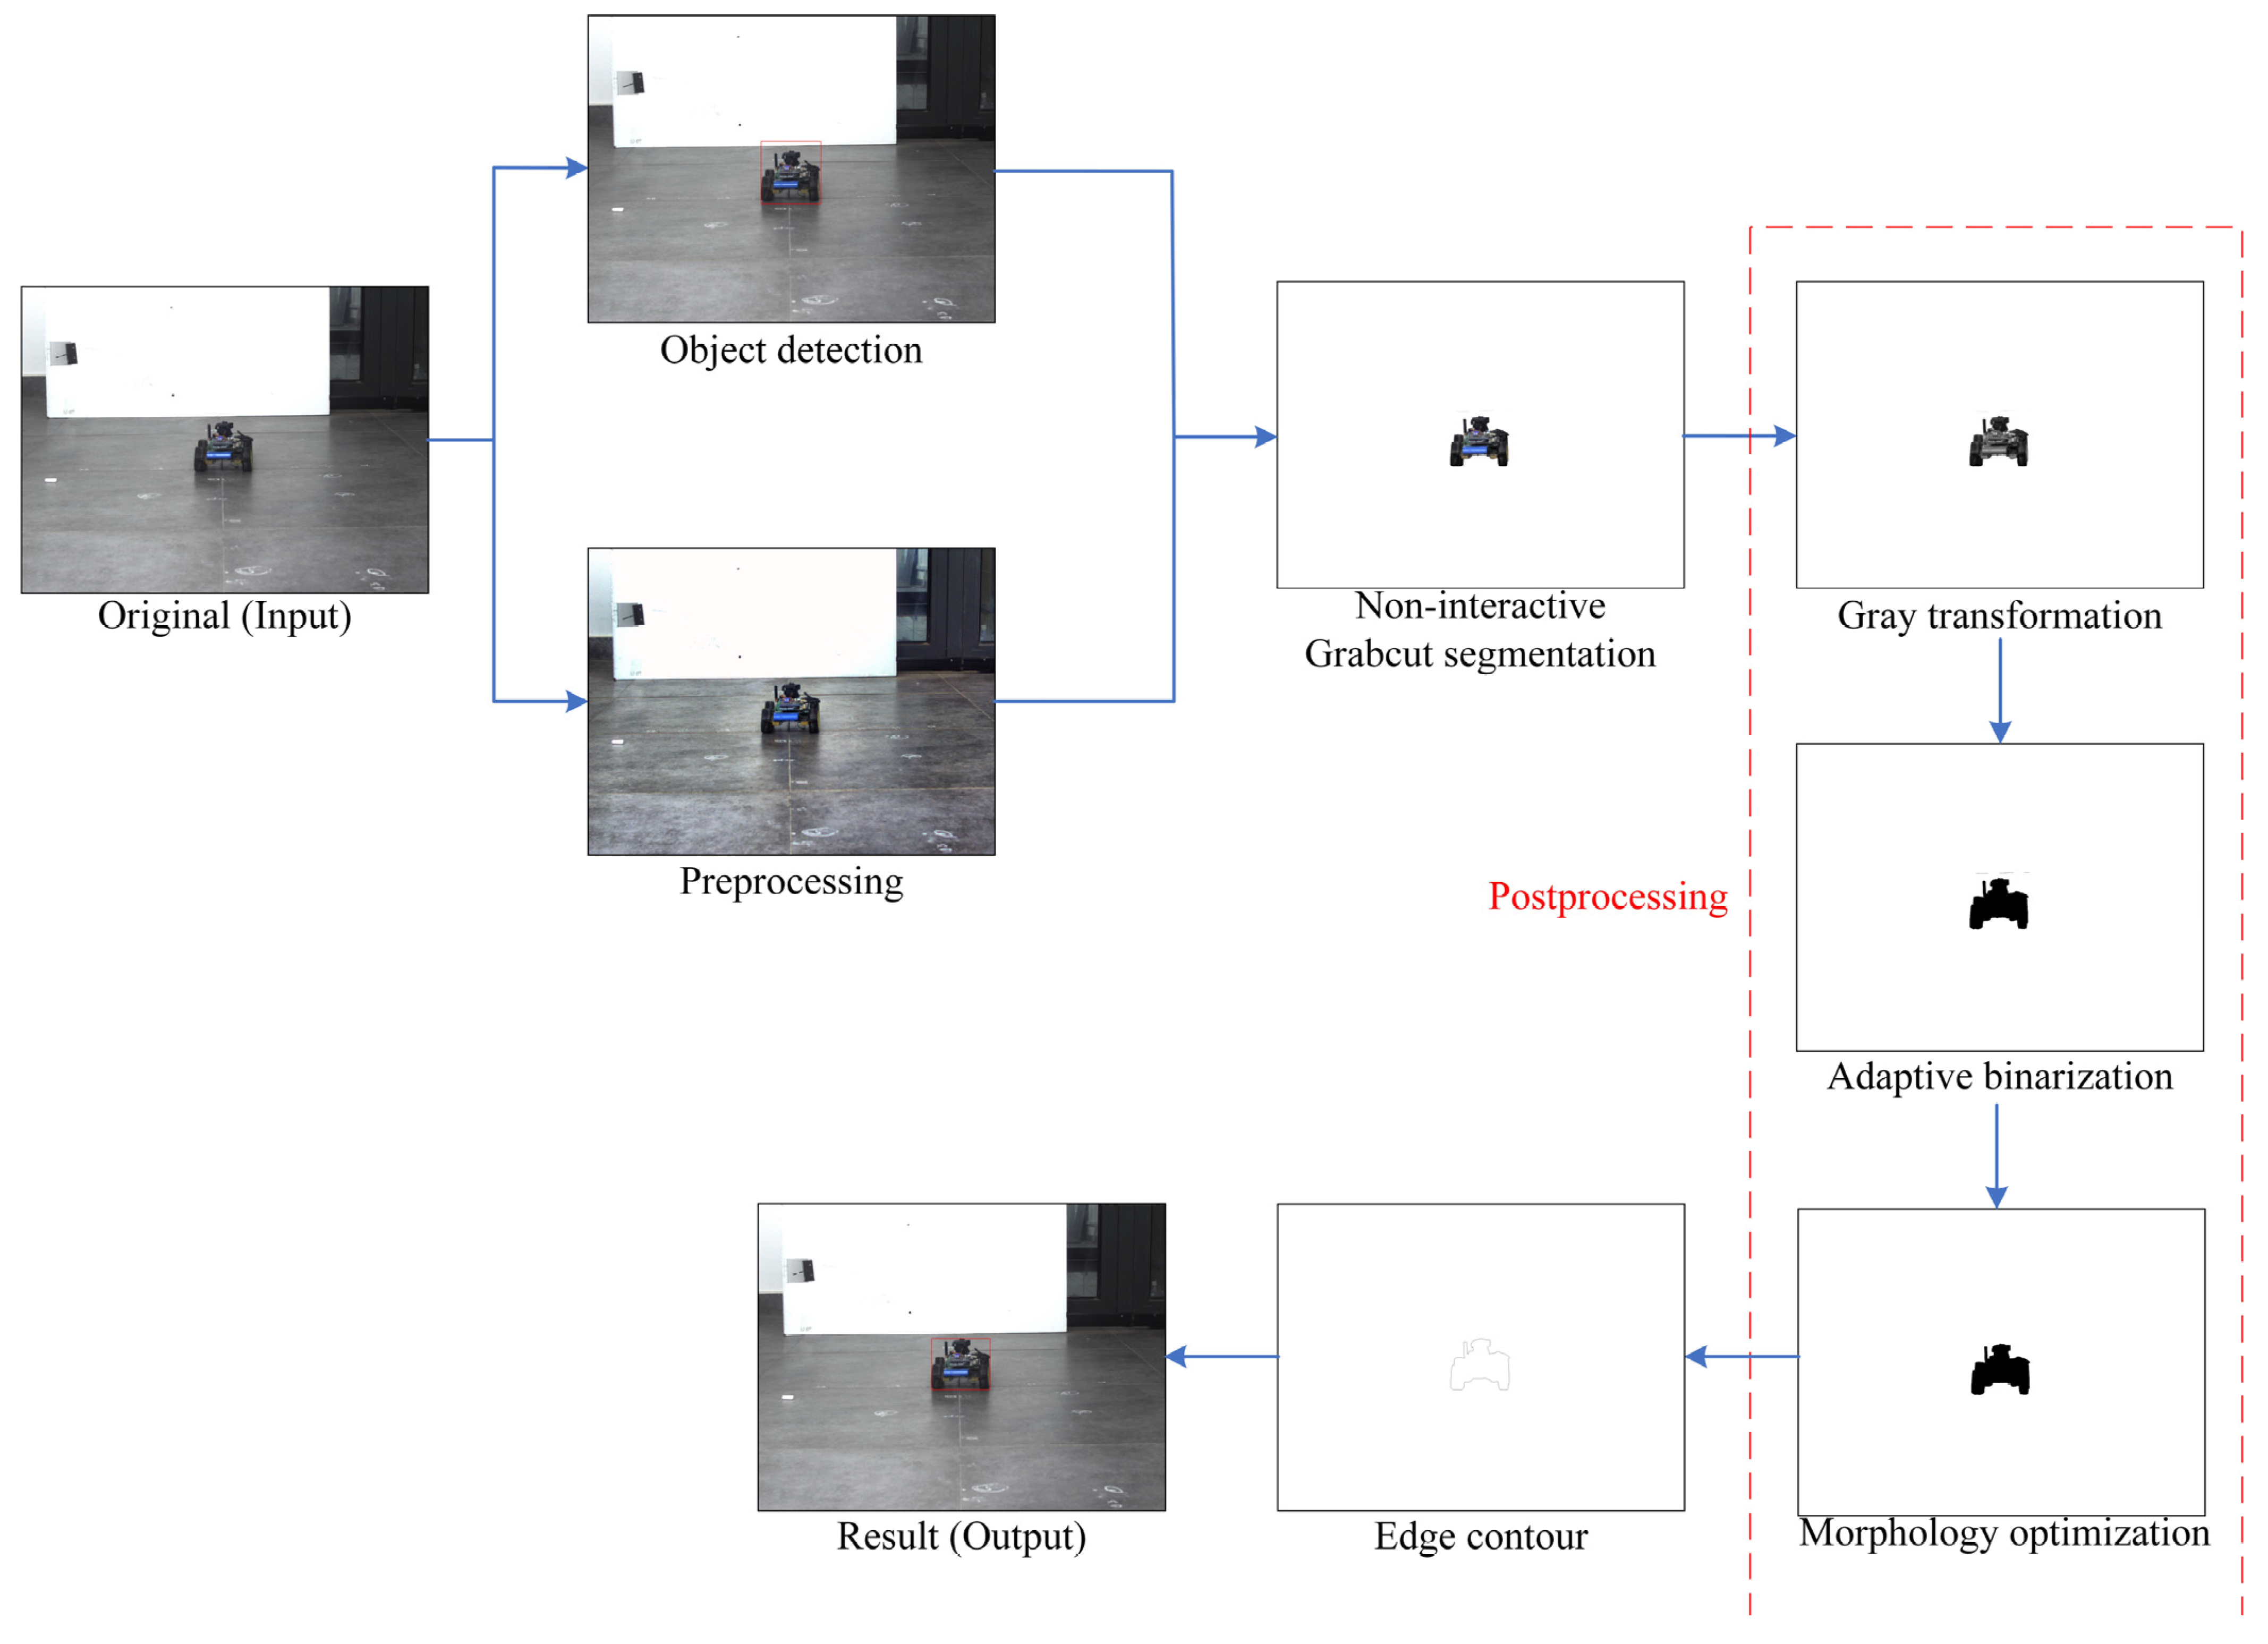
3.2.1. Methods and Principles

In the field of visual ranging based on object detection, when we carry out object detection, the non-fit phenomenon between the object detection bounding box and the object may be caused by factors such as uneven illumination and fuzzy object boundaries. The non-fit phenomenon, which leads to pixel gaps (as shown in Figure 1), can eventually result in ranging errors.
In order to solve this issue, an object detection bounding box optimization method is proposed. Overall, the method includes five steps: object detection, image preprocessing, non-interactive GrabCut foreground segmentation, segmentation postprocessing, and scanning the edge contour to obtain optimized bounding box information. The specific details of each step are as follows:
(1)
Object detection. The object in the image is detected using the detection model, and the bounding box data for the detected object is obtained.
(2)
Image preprocessing. First, the original RGB image is converted to an HSV image, and then divided into three single-channel images: Hue (H), Saturation (S), and Value (V), respectively. Then, the S image and the V image are processed using contrast limited adaptive histogram equalization (CLAHE). The processed single-channel images are merged into an HSV image and converted to an RGB image.
(3)
Non-interactive GrabCut foreground segmentation. The bounding box information from object detection in step (1) and the preprocessed image from step (2) are used as the input parameters for the GrabCut algorithm to achieve automatic non-interactive foreground segmentation, eliminating the need to manually set the foreground area in traditional interactive GrabCut segmentation.
(4)
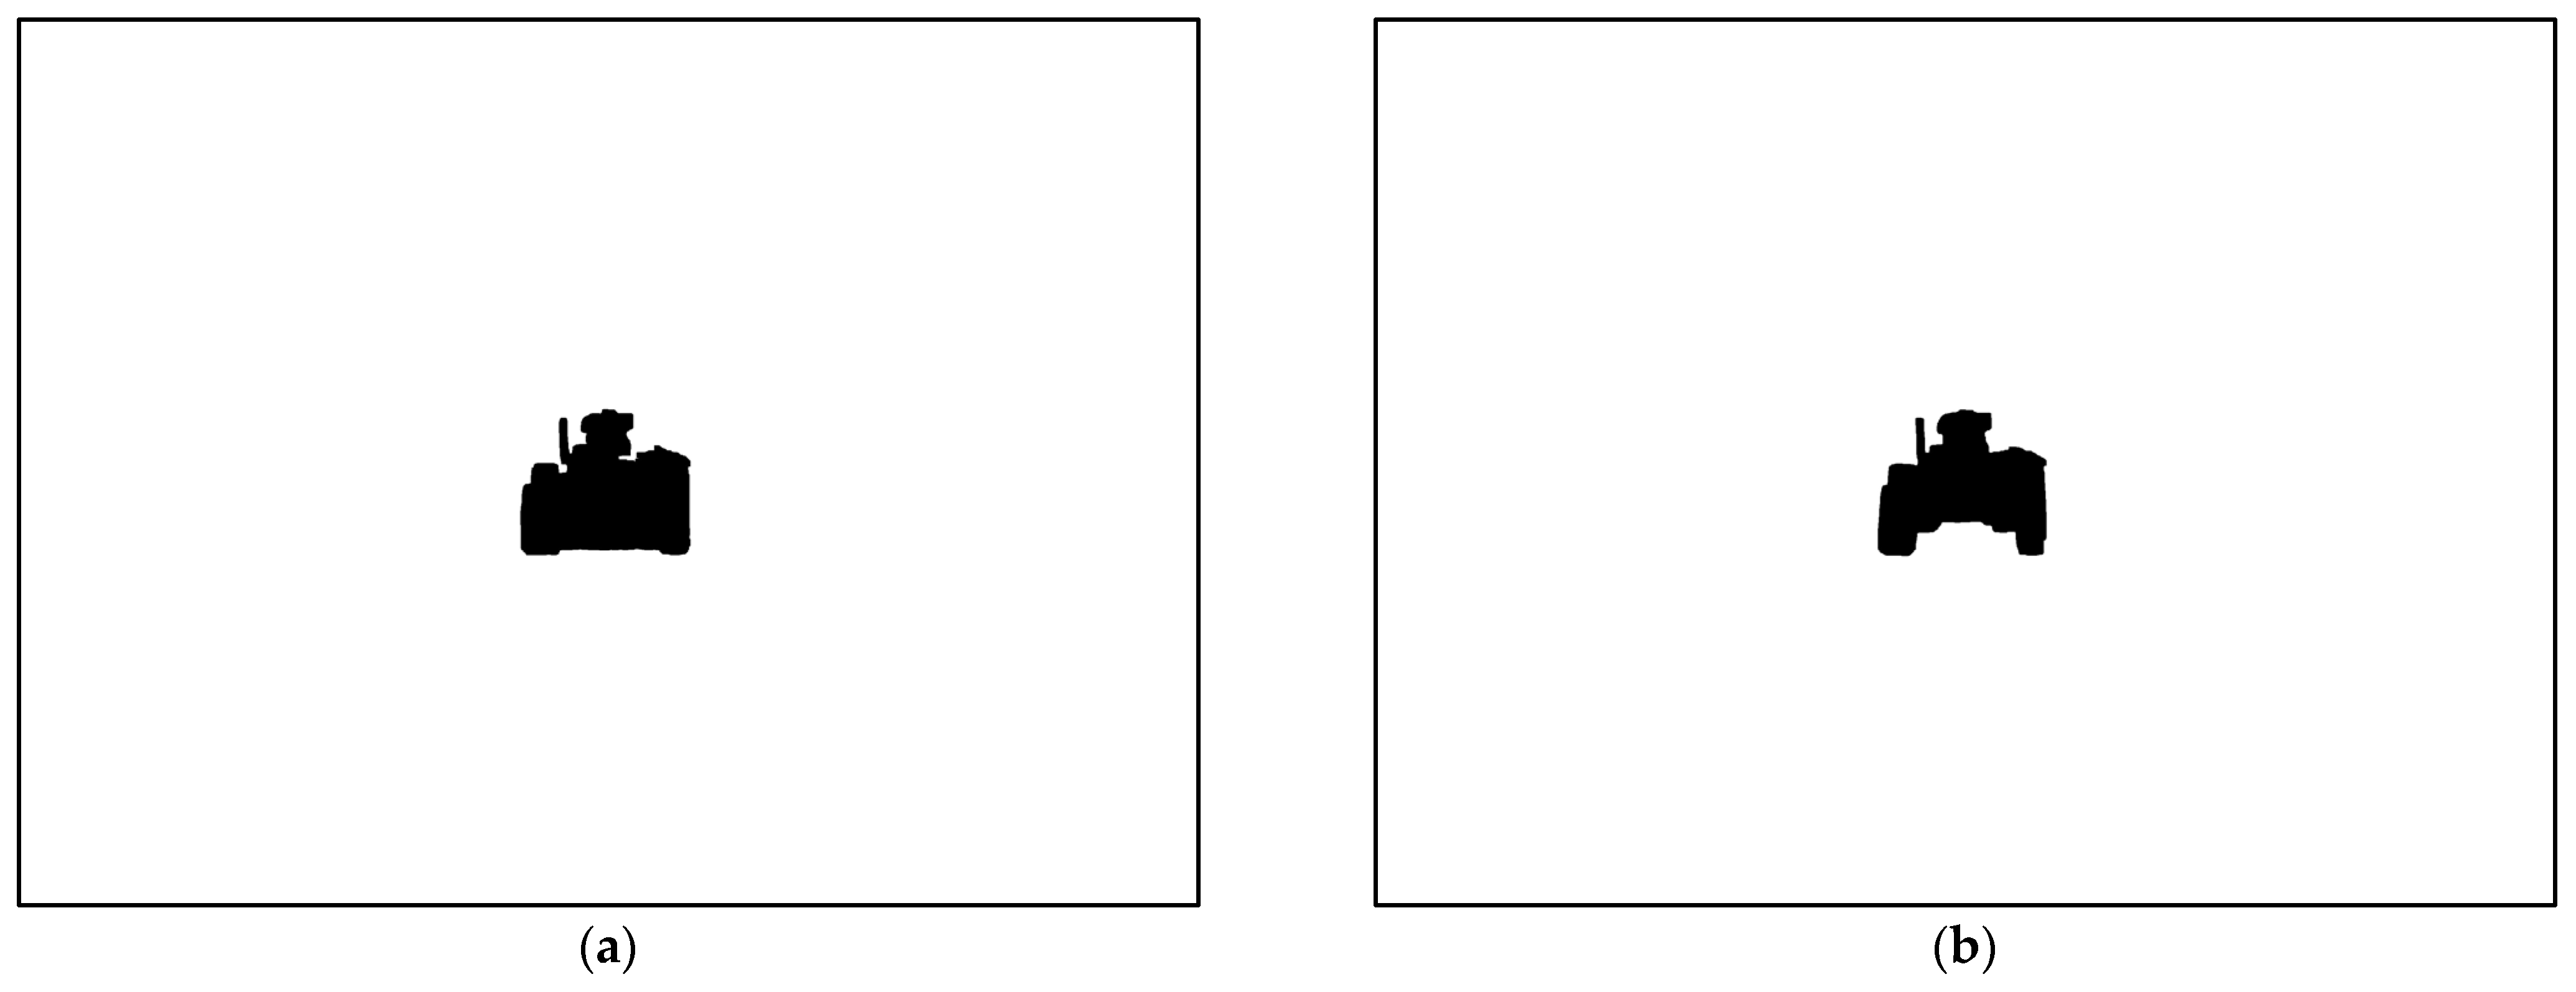
Segmentation postprocessing. The segmentation postprocessing includes gray transformation, adaptive binarization and morphological optimization. The adaptive binarization threshold is generated automatically based on the background pixel value set after foreground segmentation.
(5)
Scanning the edge contour to obtain the optimized bounding box. The object contour is scanned by row and column pixels using the object detection bounding box from step (1) as the boundary, and the optimized object detection bounding box is obtained based on the column and row index.
In the above five steps, step (1) is based on the YOLOv5 object detection in Section 3.1, and the pixel information of the detection boundary box is obtained. Step (2) converts the RGB image to an HSV image and then performs CLAHE processing. This step adjusts the image contrast and enhances the image boundary, which is more conducive to the non-interactive GrabCut foreground segmentation in step (3). In step (3), the non-interactive GrabCut foreground segmentation is realized by using the pixel information of the object detection bounding box in step (1) and the preprocessed image in step (2), which is an automatic object segmentation method. In step (4), the postprocessing of the non-interactive GrabCut foreground segmentation results can remove the excess pixels generated by segmentation, so as to better obtain the optimized bounding box in step (5). In step (5), after pixel scanning of the segmentation postprocessing results, we obtain the optimized detection bounding box, which is applied in the subsequent visual ranging method to achieve more accurate distance measurement.

3.2.2. Evaluation Indicator

To achieve a quantitative evaluation of the results of the object detection bounding box optimization, this paper sets two evaluation indicators, the width optimization value (WOV) and height optimization value (HOV), to evaluate the optimized results. The calculation formula is as follows:
W O V = w 1 w 2 w 1 × 100 % ,
H O V = h 1 h 2 h 1 × 100 % .
In Formula (4), w1 and w2 represent the pixel width of the object detection bounding box before and after optimization, respectively; in Formula (5), h1 and h2 represent the pixel height of the object detection bounding box before and after optimization, respectively.

3.3. Similar Triangle Ranging Method Based on Height Difference

The monocular visual ranging method, PNP ranging method, imaging model method, and data regression modeling method have limitations in practical application due to their high time and manpower costs, and inability to measure objects of unknown size.
Therefore, a similar triangle distance measurement method based on height difference is proposed in this paper. The method measures the distance to an object of unknown size by adjusting the height difference of the camera. Figure 3 shows shooting scenes at different heights, and Figure 4 shows a geometric model built at one height of the camera.
Figure 3 shows the shooting scene of the camera at O′ and O″. The pitch angle is α, and the height difference adjusted by the camera O′O″ = h. Figure 4 shows the ranging model established by the camera at O′ (or O″). The focal length of the camera is O1O′ = f; O′M is the camera optical axis; XOY is the world coordinate system; X1O1Y1 is the image coordinate system, where AB is the object width and P (PX, PY) is the midpoint of AB. A1, B1 and P1 are the corresponding points of A, B and P in the imaging plane. O′P(O″P) is the distance of the camera from O′(O″) to the object. The solution steps are as follows:
First, suppose the vertical height of the camera at O′ point is h1, and the vertical height at O″ point is h2, then h = h2 − h1. We then suppose that the actual width of the object is AB = W, the width of the pixel shot at O′ point is w1, and the width of the pixel shot at O″ point is w2. The ranging model established by the camera at O′ point is as follows:
γ 1 = arctan O 1 P 1 Y f ,
β = { α + γ , P 1 Y < 0 α , P 1 Y = 0 α - γ , P 1 Y > 0 } ,
O P Y = h 1 sin β ,
O P 1 Y = O 1 P 1 Y 2 + f 2 ,
O P 1 = O 1 P 1 2 + f 2 ,
From triangle O′P1P1Y similar to triangle O′PPY, we obtain:
O P 1 O P = O P 1 Y O P Y = O 1 P 1 Y 2 + f 2 h 1 × sin β 1 ,
From triangle O′AB similar to triangle O′A1B1, we obtain:
O P 1 O P = A 1 B 1 A B = w 1 W ,
According to Formulas (11) and (12), we can obtain:
w 1 W = O 1 P 1 Y 2 + f 2 h 1 × sin β 1 .
Similarly, when the camera is at O″ point, we obtain:
w 2 W = O 2 P 2 Y 2 + f 2 h 2 × sin β 2 .
With the known condition h2 − h1 = h, the parallel vertical Formulas (13) and (14) can be used to find the three unknown variables h1, h2 and W:
{ h 2 h 1 = h W = w 1 × h 1 O 1 P 1 Y 2 + f 2 × sin β 1 = w 2 × h 2 O 2 P 2 Y 2 + f 2 × sin β 2 ,
By substituting the obtained W into Formula (12), we can find the distance O′P from the object when the camera is at O′ point:
O P = O P 1 w 1 × W .
Similarly, when the camera is at O″ point, the distance to the object O″P is calculated as
O P = O P 2 w 2 × W .

4. Experimental Results and Analysis

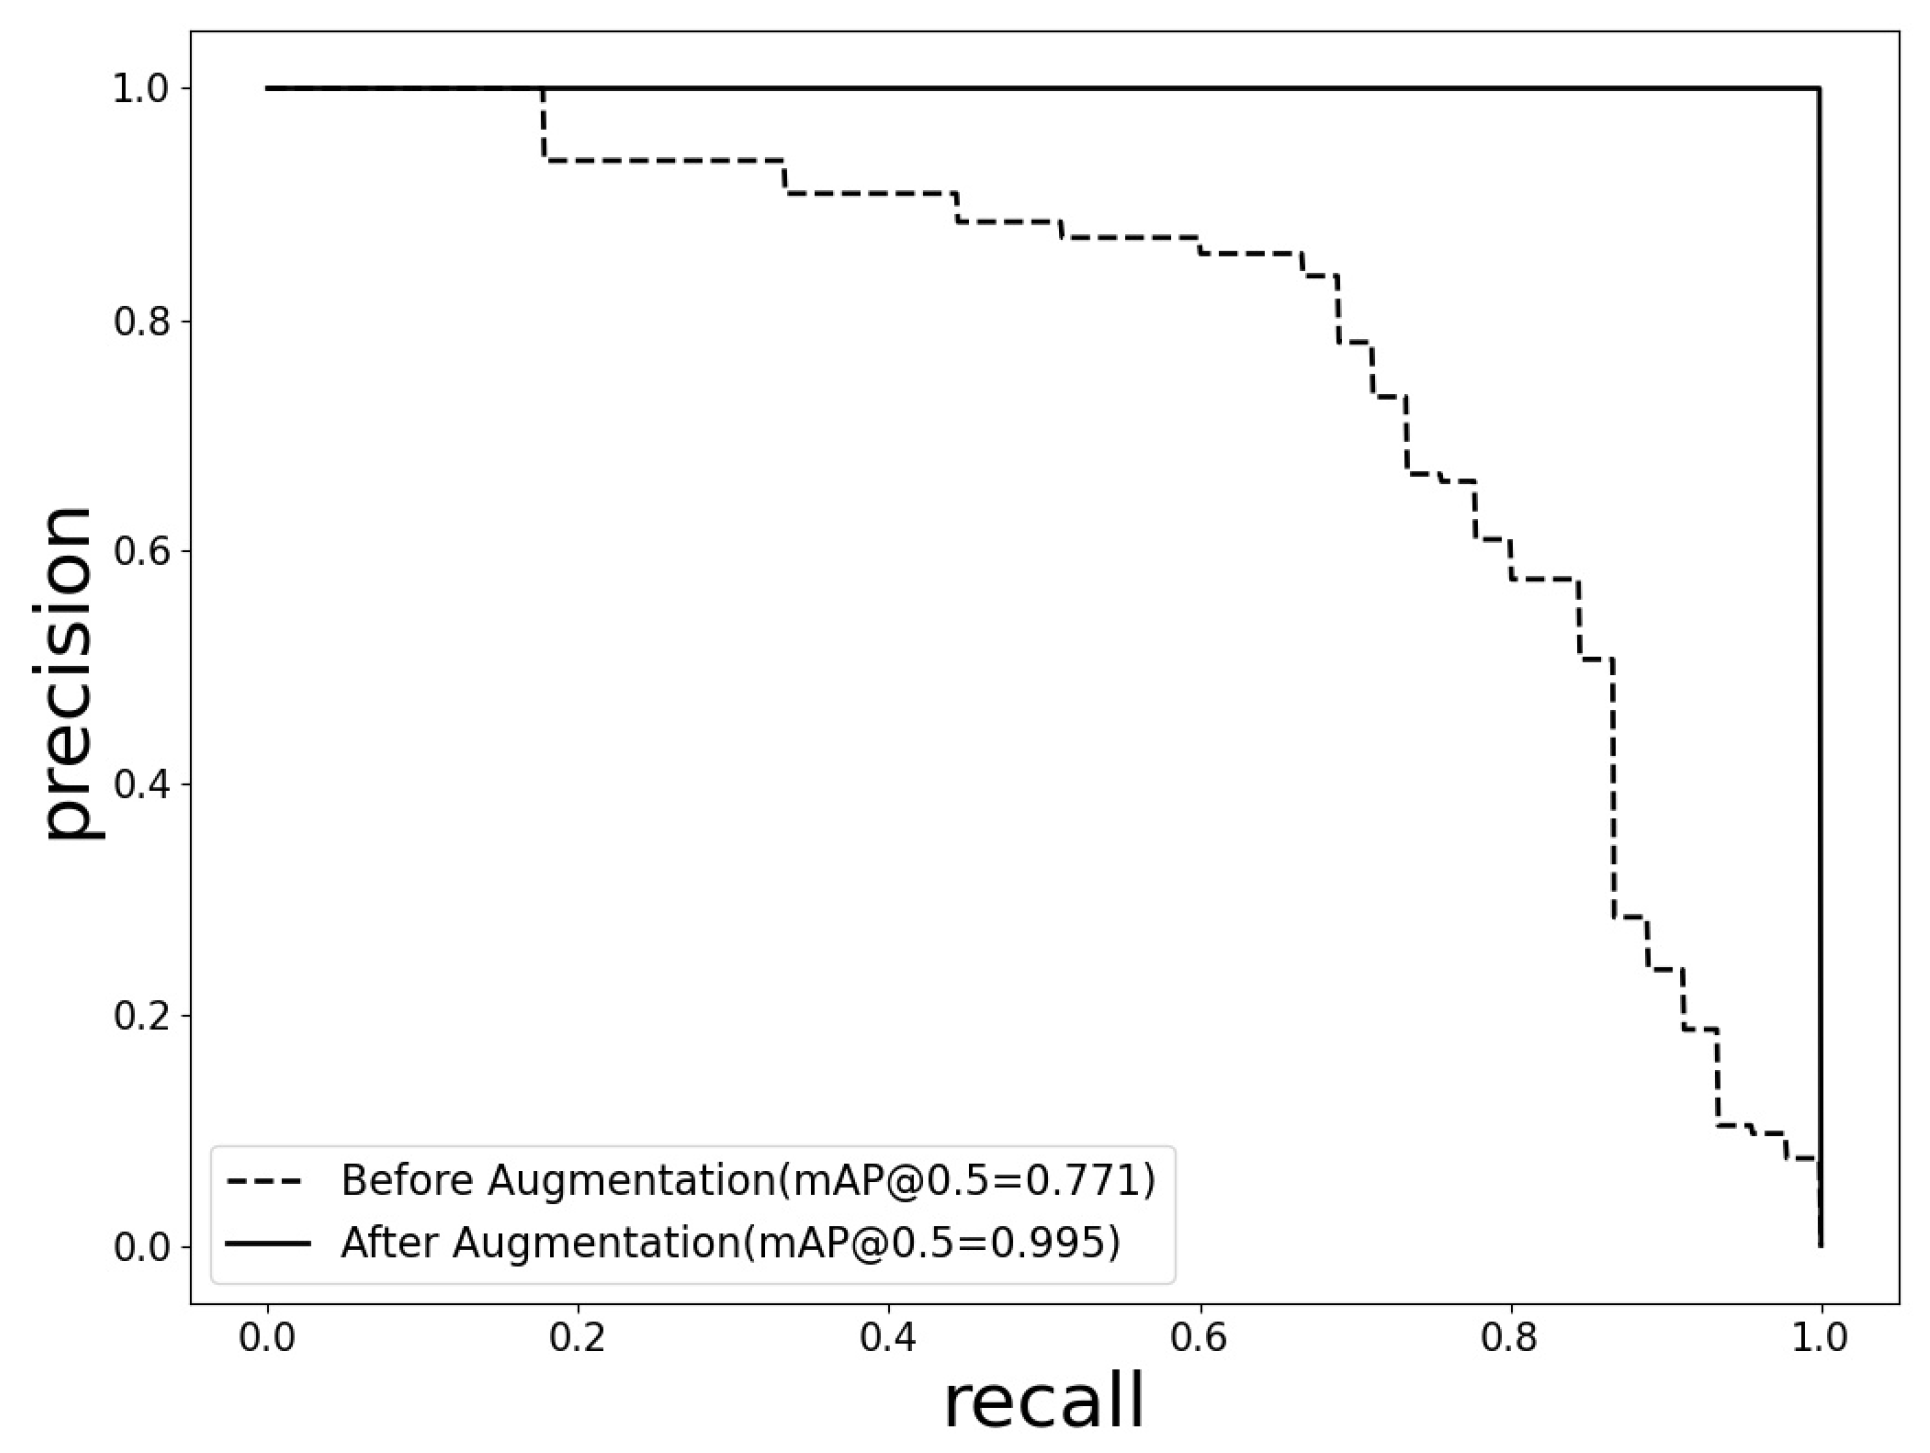
4.1. Object Detection

Object detection was carried out by YOLOv5s. YOLOv5s was used for training in the experimental environment of a cloud server with AMD EPYC 7601 CPU and 3070-8G GPU, and the epochs parameter set to 40. Figure 5 shows the training results before and after data augmentation. The results show that the model with data augmentation has higher accuracy. The mAP value is increased from 77.1% to 99.5%, and the effectiveness of the data augmentation method in improving accuracy is verified.
To test the performance of the trained model, experiments were conducted on the test set, and the final results are shown in Table 2. The results in Table 2 indicate that the detection model performs well in the detection task and also provides a solid foundation for the two new methods proposed in this paper.

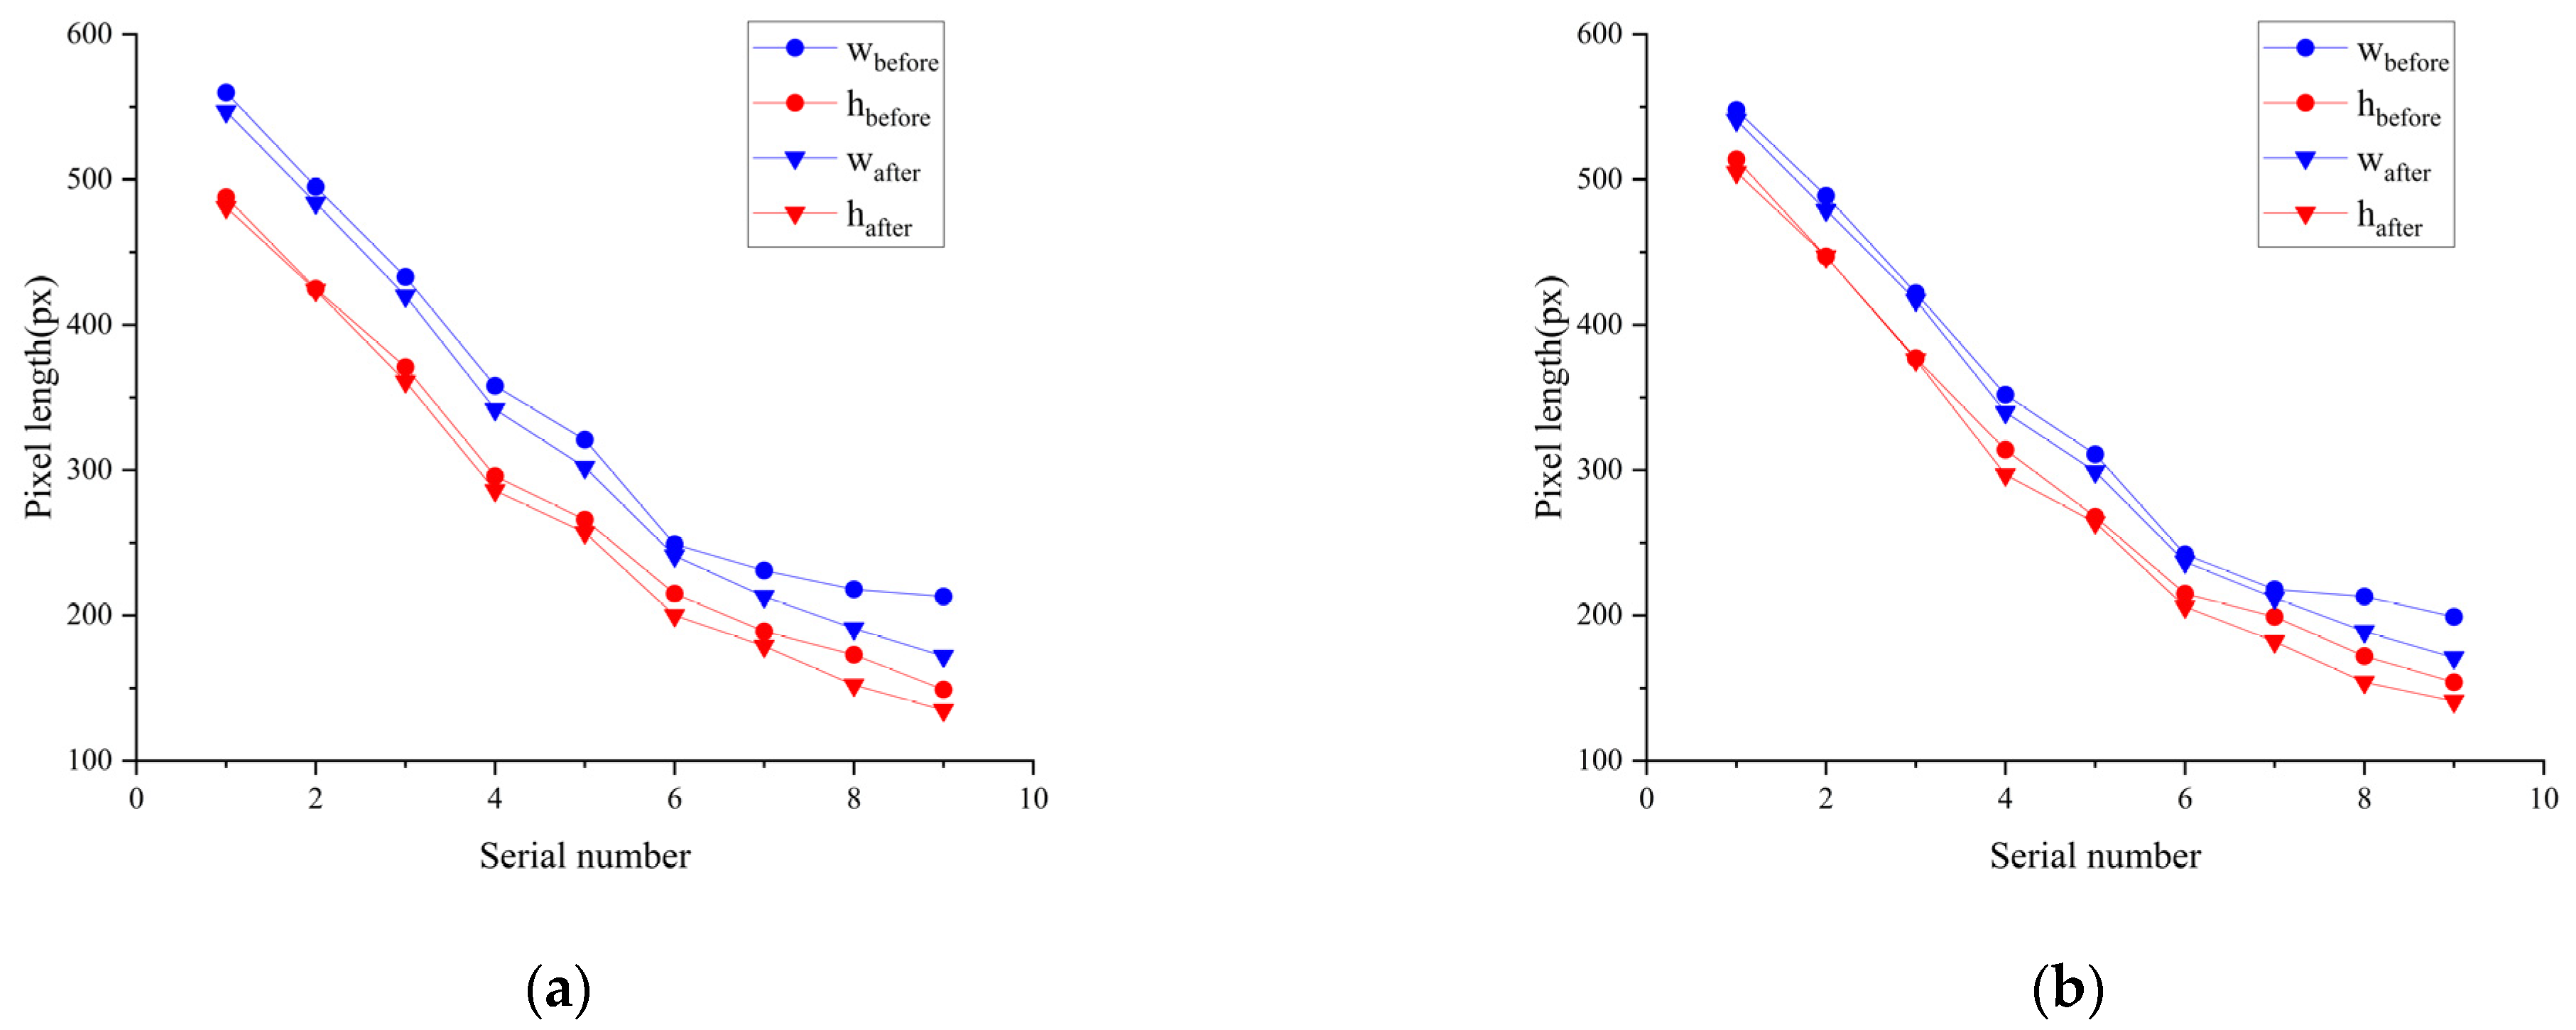
4.2. Object Detection Bounding Box Optimization Results

Figure 6 visually shows the process of the bounding box optimization method for object detection proposed in Section 3.2.1, including object detection, preprocessing, non-interactive Grabcut segmentation, postprocessing, and scanning the edge contour to obtain the optimized bounding box. From the perspective of the process, the preprocessed image is clearer than the original image, so a better segmentation effect is achieved (as shown in Figure 7), and the edge contour extracted after removing excess pixel information after postprocessing is very good fit to the object. Thus, the final bounding box can be better suited to the object.
Figure 8 visually shows the local comparison results before and after the object detection bounding box optimization. From the results, compared with the object detection before optimization, the bounding box of the optimized result is closer to the object.
To obtain a quantitative evaluation of the detection bounding box optimization method for detection objects, the two indicators WOV and HOV proposed in Section 3.2.2 are used for quantitative analysis. To facilitate the application of the results of bounding box optimization to the following visual ranging, tests are performed under the known conditions of 12 degrees of pitch angle and 10 degrees of height difference. The results of bounding box optimization are shown in Table 3, the changes in pixel width and pixel height before and after bounding box optimization are shown in Figure 8, where wbefore, hbefore, wafter, and hafter are the pixel width and pixel height before and after bounding box optimization, respectively.
In Table 3, the optimized WOV of the bounding box ranges from 1.19% to 19.24%, and the HOV ranges from 0% to 12.14%, indicating that the pixel width and pixel height of the bounding box are optimized by 1.19~19.24% and 0~12.14%, respectively.
In Figure 9, it is obvious that the pixel width and pixel height after optimization are smaller than before optimization. This method exploits the advantages of Grabcut segmentation in the bounding box optimization method by setting the area outside the detection bounding box as the background area, ensuring that the results obtained by this method are never worse than those obtained before bounding box optimization.
In summary, the proposed object detection bounding box optimization method is evaluated from two aspects: visualization and numerical results. This evaluation demonstrates that the proposed method can eliminate pixel spacing and improve the fit degree between objects and bounding boxes.

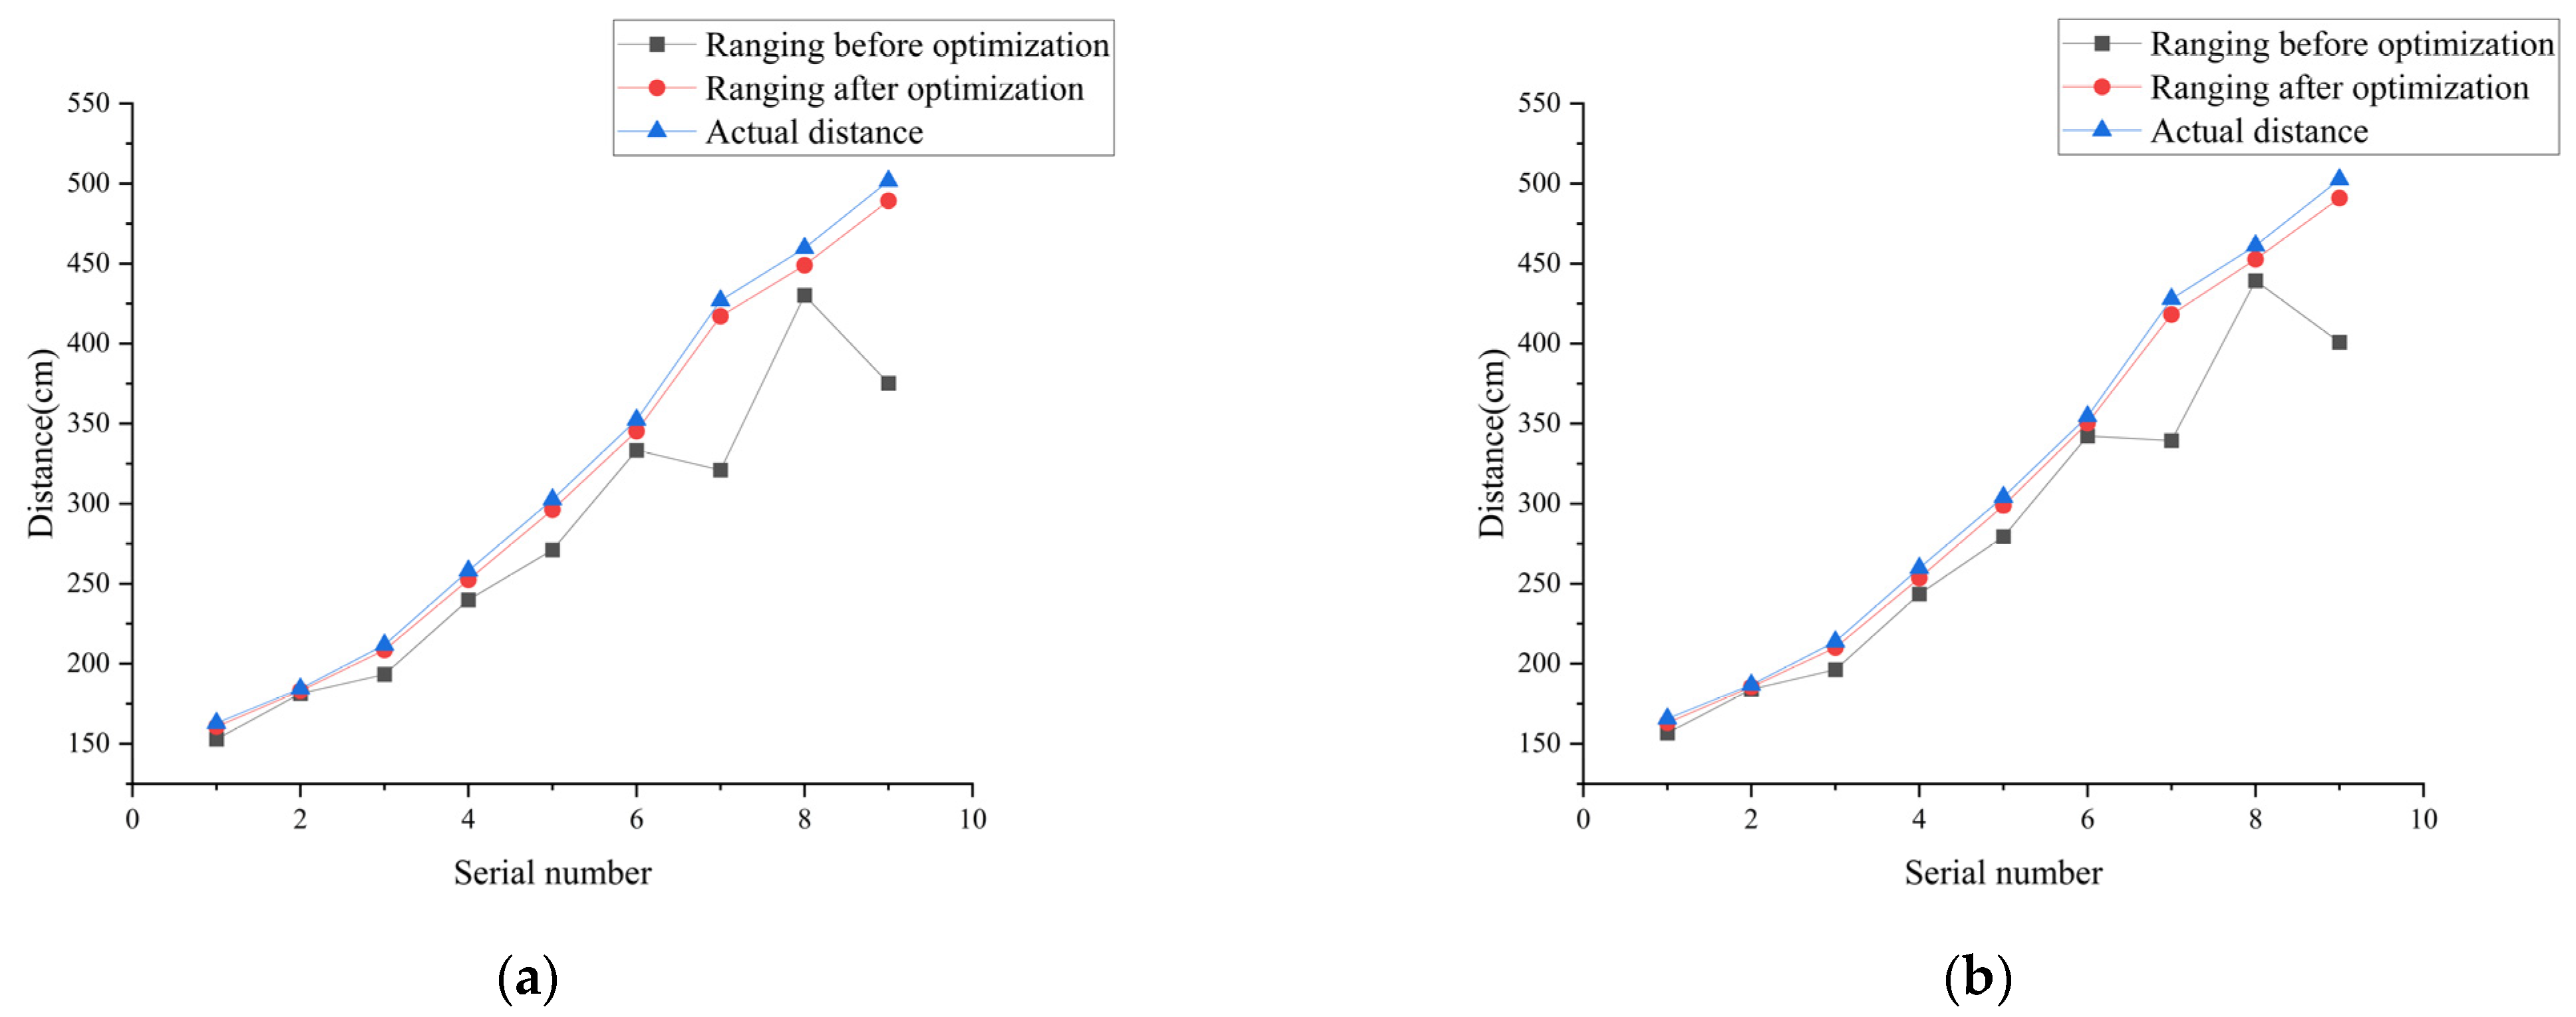
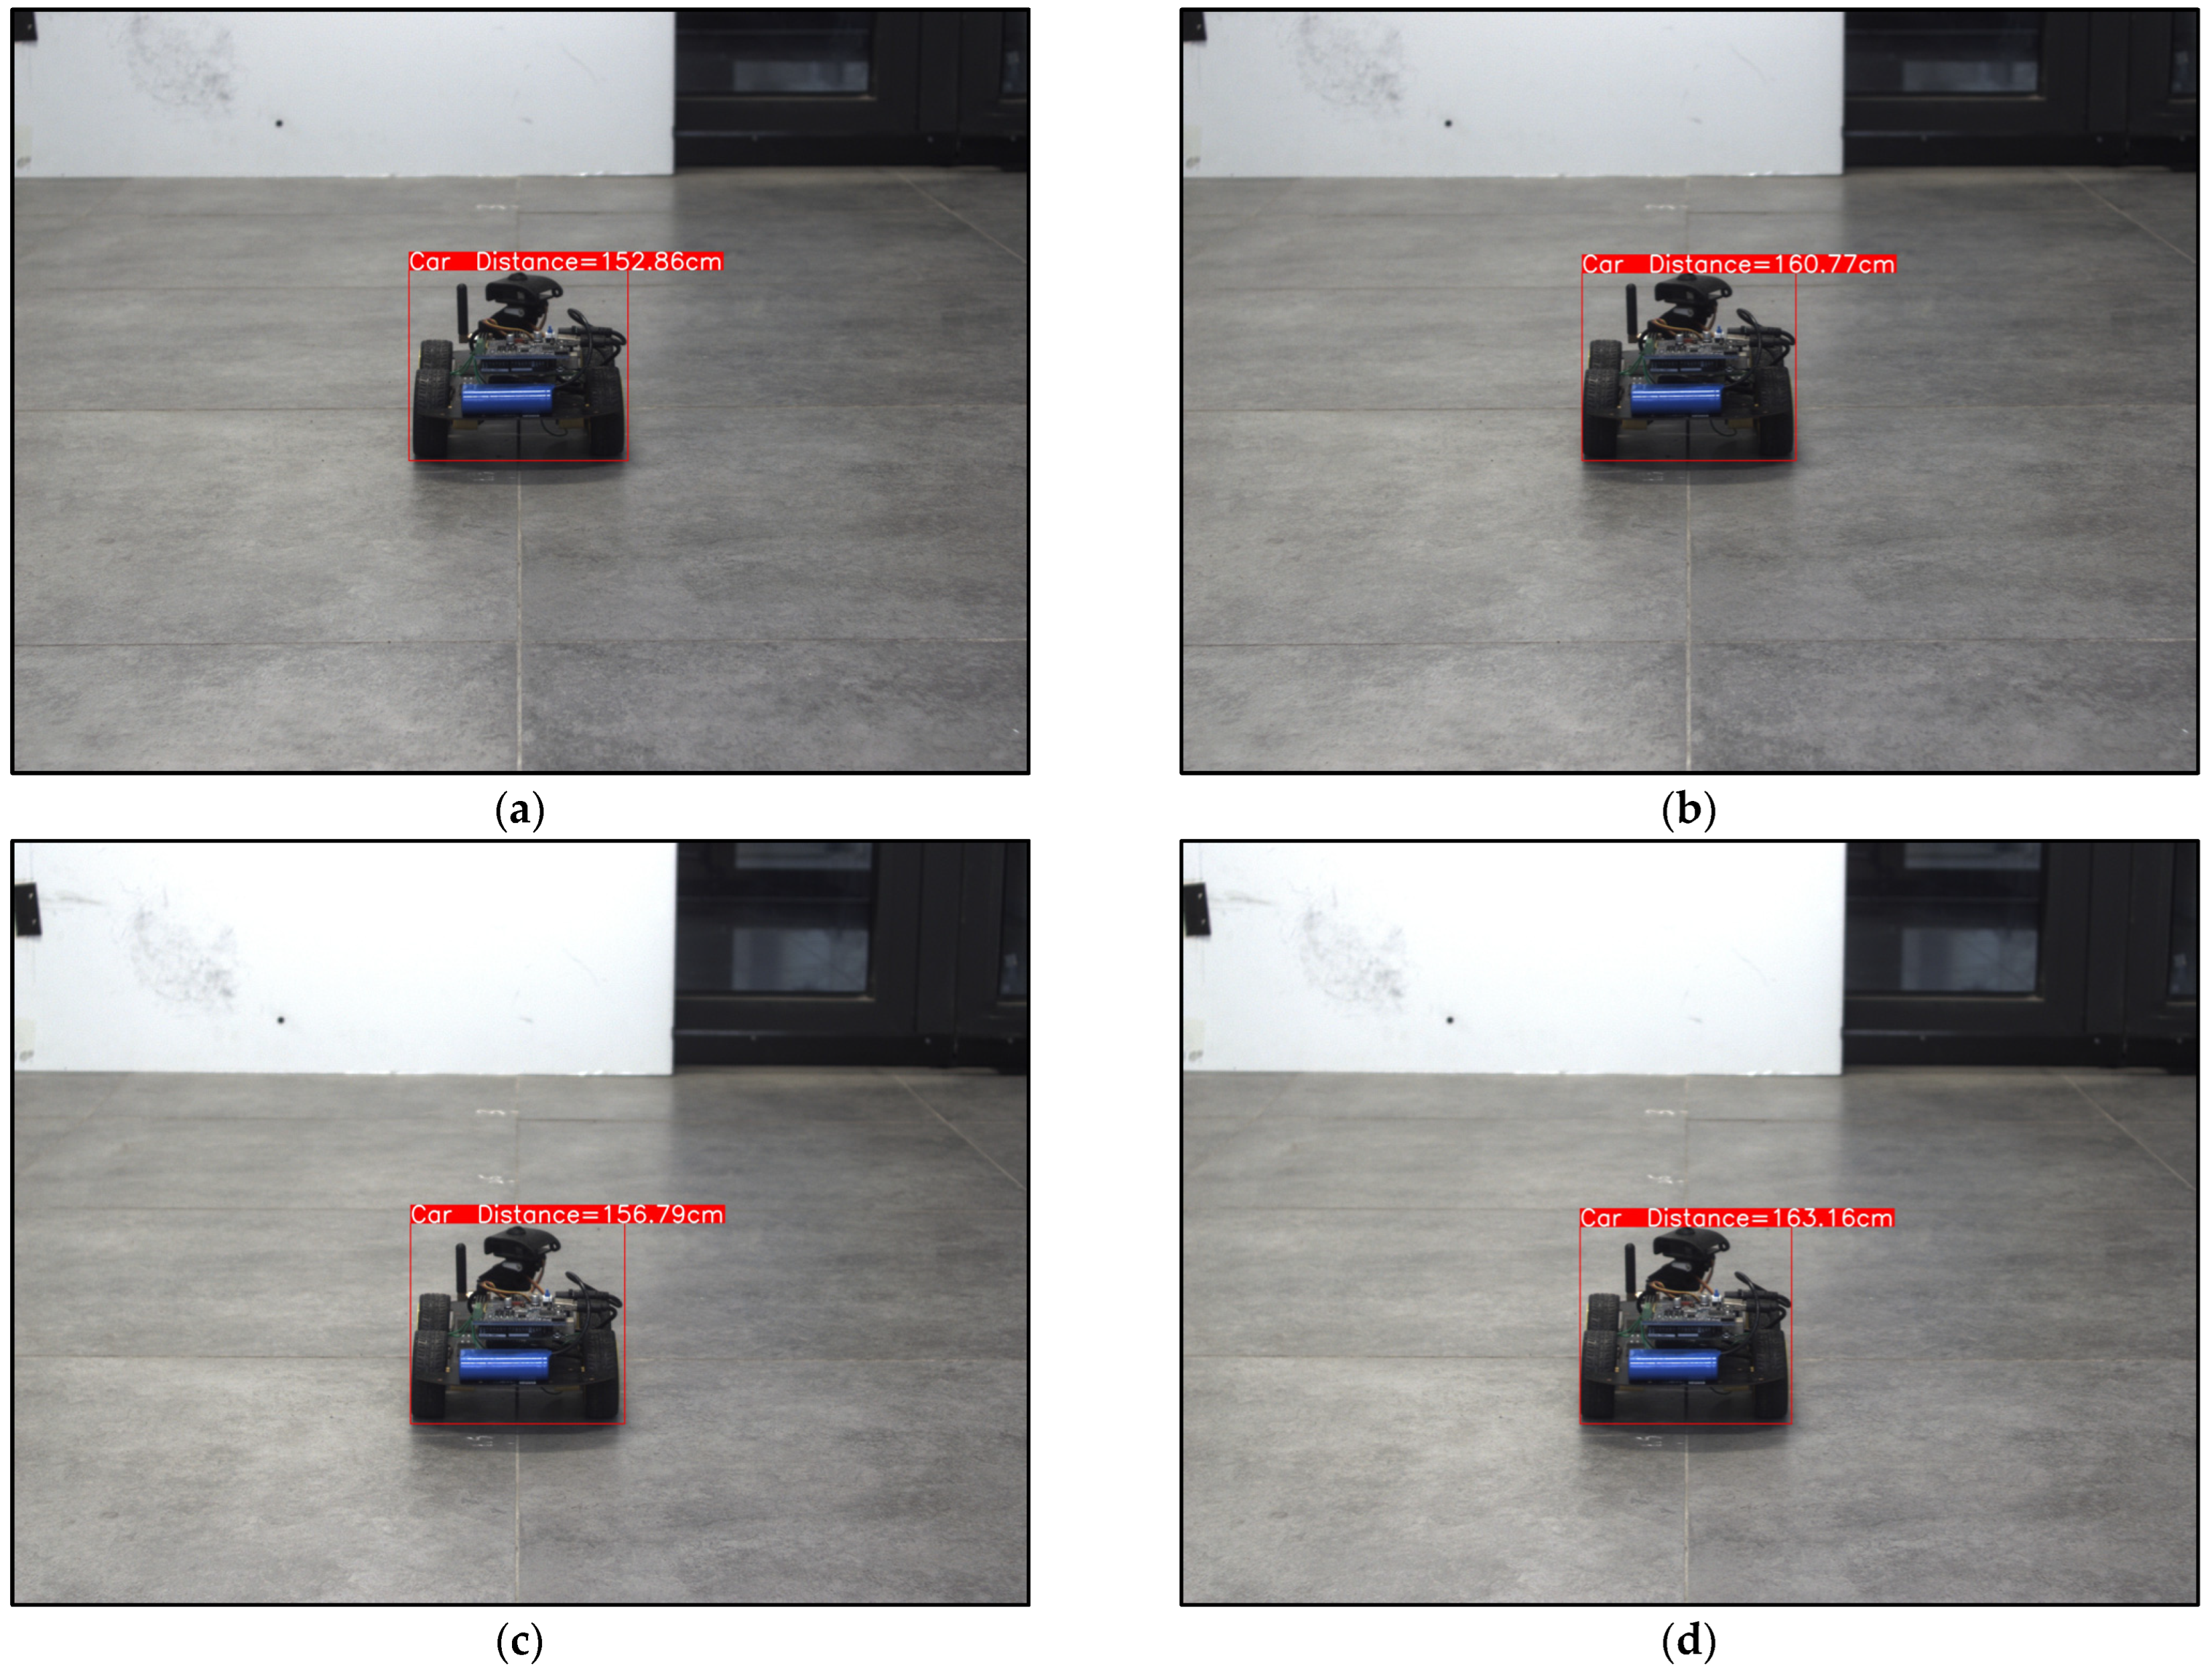
4.3. Ranging Results and Analysis

In order to verify the effectiveness of the proposed similar triangle ranging method based on height difference, a ranging experiment is carried out on the basis of the results of the object detection bounding box optimization. In this experiment, the known height difference h = 10 cm and the pitch angle α = 12°.
In Table 4, the results of similar triangle ranging based on height difference are shown. The results show that the relative error within 6 m is 0.7~2.47% after optimization, indicating that this ranging method can achieve more accuracy.
Figure 10 visually presents a clear comparison of the ranging accuracy before and after bounding box optimization at different distances. Additionally, Figure 11 illustrates the distance visualization before and after optimization for serial number 1. It is evident that the optimized ranging results are much closer to the actual values. This finding further serves to validate the feasibility of the bounding box optimization method proposed in this research paper.

5. Discussion

In order to solve the existing problems in the field of visual ranging based on object detection, an object detection bounding box method and a similar triangle ranging method based on height difference are proposed in this paper. The former aims to solve the problem of ranging error caused by pixel spacing when the bounding box and the object are not fitted, and the latter provides a new method to measure the distance to an object of unknown size for monocular visual ranging.
In order to validate the feasibility of the aforementioned methods, experiments were conducted in this study. Firstly, both methods are based on object detection. To better assess the effectiveness of these methods, data augmentation techniques were employed to improve the detection accuracy of the YOLOv5s model. The experimental results demonstrate a significant improvement in the mean average precision (mAP) value, which increased from 77.1% to 99.5%. Secondly, utilizing object detection, the proposed bounding box detection optimization method is tested, and the width optimization value (WOV) and height optimization value (HOV) are proposed to quantitatively evaluate the results. The results show that the pixel width and pixel height of bounding box were optimized by 1.19~19.24% and 0~12.14%, respectively, which shows that the method can eliminate the pixel spacing, improve the fit degree between the detection bounding box and the object, and improve the ranging accuracy. Finally, utilizing optimized bounding boxes, the proposed similar triangle ranging method based on height difference was verified experimentally. The experimental results show that the relative distance error within 6 m range is 0.7~2.47%, which meets the requirements of some ranging scenarios, and verifies the effectiveness of the ranging method. In addition, we compare the ranging results before and after the object detection bounding box optimization, and these results also demonstrate that the proposed object detection bounding box optimization method can improve the ranging accuracy.

6. Conclusions

The bounding box optimization method proposed in this study aims to improve ranging accuracy by eliminating the pixel gap between the bounding box and the object. This method can also be applied to other ranging methods (such as the imaging model method) to enhance ranging accuracy. In addition, in the preprocessing part of this method, we performed image enhancement using the CLAHE method to eliminate the influence of uneven illumination and blurred target boundaries on segmentation, which produced good segmentation results. Although this method produces good results, it increases the time cost and is not suitable for real-time tasks. In the future, a fuzzy segmentation algorithm, such as the fast generalized fuzzy c-means (FGFCM) algorithm, can be used for segmenting the original image to achieve higher efficiency and more accurate segmentation.
The proposed similar triangle ranging method based on height difference is only suitable for fixed targets, because the method needs to adjust the height of the camera to achieve distance measurement. Thus, it cannot be applied in ranging for moving targets. In addition, the distance measurement experiments in this study were conducted within a range of 6 m. If one wishes to measure targets at a greater distance, it is possible to adjust the camera height and pitch angle to achieve longer distance measurements. However, ensuring that the target can be captured at both heights is a prerequisite for utilizing the ranging method described in this paper. Otherwise, if only one image containing the target is available, it is not possible to measure the distance to the target using the method described in this paper.

Author Contributions

Conceptualization, Z.S. and Z.L.; methodology, Z.S.; visualization, Z.S. and S.C.; investigation, M.G. and H.T.; experiment, Z.S.; writing—original draft preparation, Z.S.; validation, Z.L. and S.C.; project administration, Z.S., Z.L. and S.C.; funding acquisition, Z.L. All authors have read and agreed to the published version of the manuscript.

Funding

This research was funded by the Key Research and Development Program of Jiangsu Province, grant number BE2022062.

Institutional Review Board Statement

Not applicable.

Informed Consent Statement

Not applicable.

Data Availability Statement

Not applicable.

Acknowledgments

We would like to acknowledge the funding of Key Research and Development Program of Jiangsu Province and thank our team members for their help and encouragement.

Conflicts of Interest

The authors declare no conflict of interest.

References

  1. Varuna, D.S.; Jamie, R.; Ahmet, K. Robust Fusion of LiDAR and Wide-Angle Camera Data for Autonomous Mobile Robots. Sensors 2018, 18, 2730. [Google Scholar]
  2. Tippetts, B.J.; Lee, D.J.; Archibald, J.K. An on-board vision sensor system for small unmanned vehicle applications. Mach. Vis. Appl. 2012, 23, 403–415. [Google Scholar] [CrossRef]
  3. Frag, A.L.; Yu, X.R.; Yi, W.J.; Saniie, J. Indoor Navigation System for Visually Impaired People using Computer Vision. In Proceedings of the 2022 IEEE International Conference on Electro Information Technology (eIT), Mankato, MN, USA, 19–21 May 2022; pp. 257–260. [Google Scholar]
  4. Li, S.; Zhao, Q. Research on the Emergency Obstacle Avoidance Strategy of Intelligent Vehicles Based on a Safety Distance Model. IEEE Access 2023, 11, 7124–7134. [Google Scholar] [CrossRef]
  5. Nunes, D.; Fortuna, J.; Damas, B.; Ventura, R. Real-time Vision Based Obstacle Detection in Maritime Environments. In Proceedings of the 2022 IEEE International Conference on Autonomous Robot Systems and Competitions (ICARSC), Santa Maria da Feira, Portugal, 29–30 April 2022; pp. 243–248. [Google Scholar]
  6. Xue, L.; Li, M.; Fan, L.; Sun, G.; Gao, T. Monocular Vision Ranging and Camera Focal Length Calibration. Sci. Program. 2021, 2021, 9979111. [Google Scholar] [CrossRef]
  7. Wang, H.; Sun, Y.; Wu, Q.M.J.; Lu, X.; Wang, X.; Zhang, Z. Self-supervised monocular depth estimation with direct methods. Neurocomputing 2021, 421, 340–348. [Google Scholar] [CrossRef]
  8. Arabi, S.; Sharma, A.; Reyes, M.; Hamann, C.; Peek-Asa, C. Farm vehicle following distance estimation using deep learning and monocular camera images. Sensors 2022, 22, 2736. [Google Scholar] [CrossRef]
  9. Li, Z.Q.; Gao, J.D.; Peng, K.; Liu, Q.Z.; Xu, X.W. Method of measurement vehicle distance based on PnP. Foreign. Electron. Meas. Technol. 2020, 39, 104–108. [Google Scholar]
  10. Zhang, Z.Z. Review of vehicle distance measurement based on monocular vision. Automot. Appl. Technol. 2022, 47, 153–157. [Google Scholar]
  11. Shen, Z.X.; Huang, X.Y. Monocular vision distance detection algorithm based on data regression modeling. Comput. Eng. Appl. 2007, 42, 15–18. [Google Scholar]
  12. Zhao, M.H.; Wang, J.H.; Zheng, X.; Zhang, S.J.; Zhang, C. Monocular vision based water-surface object distance measurement method for unmanned surface vehicles. Transducer Microsyst. Technol. 2021, 40, 47–104. [Google Scholar]
  13. Taigman, Y.; Yang, M.; Ranzato, M.; Wolf, L. DeepFace: Closing the Gap to Human-Level Performance in Face Verification. In Proceedings of the 2014 IEEE Conference on Computer Vision and Pattern Recognition, Columbus, OH, USA, 23–28 June 2014; pp. 1701–1708. [Google Scholar]
  14. Ouyang, W.L.; Wang, X.G. Joint Deep Learning for Pedestrian Detection. In Proceedings of the 2013 IEEE International Conference on Computer Vision, Sydney, Australia, 1–8 December 2013; pp. 2056–2063. [Google Scholar]
  15. Kang, K.; Li, H.S.; Yan, J.J.; Zeng, X.Y.; Yang, B.; Xiao, T.; Zhang, C.; Wang, Z.; Wang, R.H.; Wang, X.G.; et al. Tubelets with Convolutional Neural Networks for Object Detection from Videos. IEEE Trans. Circuits Syst. Video Technol. 2017, 28, 2896–2907. [Google Scholar] [CrossRef]
  16. Li, Z.W.; Pang, C.X.; Dong, C.H.; Zeng, X.H. R-YOLOv5: A Lightweight Rotational Object Detection Algorithm for Real-Time Detection of Vehicles in Dense Scenes. IEEE Access 2023, 11, 61546–61559. [Google Scholar] [CrossRef]
  17. Felzenszwalb, P.F.; Girshick, R.B.; McAllester, D.; Ramanan, D. Object detection with discriminatively trained part-based models. IEEE Trans. Pattern Anal. Mach. Intell. 2009, 32, 1627–1645. [Google Scholar] [CrossRef]
  18. Uijlings, J.R.R.; Van De Sande, K.E.A.; Gevers, T.; Smeulders, A.W.M. Selective search for object recognition. Int. J. Comput. Vis. 2013, 104, 154–171. [Google Scholar] [CrossRef]
  19. Vedaldi, A.; Gulshan, V.; Varma, M.; Zisserman, A. Multiple kernels for object detection. In Proceedings of the 2009 IEEE 12th International Conference on Computer Vision, Kyoto, Japan, 29 September–2 October 2009; pp. 606–613. [Google Scholar]
  20. Yu, Y.N.; Zhang, J.G.; Huang, Y.Z.; Zheng, S.A.; Ren, W.Q.; Wang, C. Object detection by context and boosted HOG-LBP. In Proceedings of the ECCV Workshop on PASCAL VOC, CAS, Beijing, China, 10 September 2010. [Google Scholar]
  21. Huang, M.; Zhang, Y.; Chen, Y. Small Object Detection Model in Aerial Images Based on TCA-YOLOv5m. IEEE Access 2022, 11, 3352–3366. [Google Scholar] [CrossRef]
  22. Redmon, J.; Divvala, S.; Girshick, R.; Farhadi, A. You Only Look Once: Unified, Real-Time Object Detection. In Proceedings of the 2016 IEEE Conference on Computer Vision and Pattern Recognition (CVPR), Las Vegas, NV, USA, 27–30 June 2016; pp. 779–788. [Google Scholar]
  23. Liu, W.; Anguelov, D.; Erhan, D.; Szegedy, C.; Reed, S.; Fu, C.Y.; Berg, A.C. SSD: Single Shot MultiBox Detector. In Proceedings of the Computer Vision–ECCV 2016: 14th European Conference, Amsterdam, The Netherlands, 11–14 October 2016; pp. 21–37. [Google Scholar]
  24. Girshick, R.; Donahue, J.; Darrell, T.; Malik, J. Rich Feature Hierarchies for Accurate Object Detection and Semantic Segmentation. In Proceedings of the 2014 IEEE Conference on Computer Vision and Pattern Recognition, Columbus, OH, USA, 23–28 June 2014; pp. 580–587. [Google Scholar]
  25. Lin, T.Y.; Dollár, P.; Girshick, R.; He, K.; Hariharan, B.; Belongie, S. Feature Pyramid Networks for Object Detection. In Proceedings of the IEEE Conference on Computer Vision and Pattern Recognition (CVPR), Honolulu, HI, USA, 21–26 July 2017; pp. 2117–2125. [Google Scholar]
  26. Meng, C.C.; Bao, H.; Ma, Y.; Xu, X.; Li, Y.Q. Visual Meterstick: Preceding Vehicle Ranging Using Monocular Vision Based on the Fitting Method. Symmetry 2019, 11, 1081. [Google Scholar] [CrossRef]
  27. Yang, R.; Yu, S.Y.; Yao, Q.H.; Huang, J.M.; Ya, F.M. Vehicle Distance Measurement Method of Two-Way Two-Lane Roads Based on Monocular Vision. Appl. Sci. 2023, 13, 3468. [Google Scholar] [CrossRef]
  28. Fu, Q.; Kong, J.M.; Ji, Y.F.; Ren, F.H. A method of UAV real-time ranging based on binocular vision. Electron. Opt. Control. 2023, 30, 94–99. [Google Scholar]
  29. Huang, T.Y.; Yang, X.J.; Xiang, G.H.; Chen, L. Study on small target pedestrian detection and ranging based on monocular vision. Comput. Sci. 2023, 30, 94–99. [Google Scholar]
  30. Halevy, A.; Norvig, P.; Pereira, F. The unreasonable effectiveness of data. IEEE. Intell. Syst. 2009, 24, 8–12. [Google Scholar] [CrossRef]
  31. Sun, C.; Shrivastava, A.; Singh, S.; Gupta, A. Revisiting Unreasonable Effectiveness of Data in Deep Learning Era. In Proceedings of the 2017 IEEE International Conference on Computer Vision (ICCV), Venice, Italy, 22–29 October 2017; pp. 843–852. [Google Scholar]
  32. Mikołajczyk, A.; Grochowski, M. Data augmentation for improving deep learning in image classification problem. In Proceedings of the 2018 International Interdisciplinary PhD Workshop (IIPhDW), Świnouście, Poland, 9–12 May 2018; pp. 117–122. [Google Scholar]
  33. Shorten, C.; Khoshgoftaar, T.M. A survey on Image Data Augmentation for Deep Learning. JBD 2019, 6, 1–48. [Google Scholar] [CrossRef]
Figure 1. The pixel spacing caused by non-fit phenomenon between the object detection bounding box and the object.
Applsci 13 10578 g001
Figure 2. Data augmentation.
Applsci 13 10578 g002
Figure 3. Camera shooting scene.
Applsci 13 10578 g003
Figure 4. Visual ranging model.
Applsci 13 10578 g004
Figure 5. Comparison of P–R curves and mAP@0.5 values before and after data augmentation.
Applsci 13 10578 g005
Figure 6. Bounding box optimization process.
Applsci 13 10578 g006
Figure 7. Results of Grabcut segmentation with and without CLAHE preprocessing: (a) segmentation results without preprocessing; and (b) segmentation results with preprocessing.
Applsci 13 10578 g007
Figure 8. Local comparison before and after object detection bounding box optimization: (a) before bounding box optimization; and (b) after bounding box optimization.
Applsci 13 10578 g008
Figure 9. The changes in pixel width and pixel height before and after bounding box optimization: (a) change in the image at point O′; and (b) change in the image at point O″.
Applsci 13 10578 g009
Figure 10. Comparison of ranging accuracy before and after bounding box optimization at different distances: (a) comparison of ranging accuracy at point O′; and (b) comparison of ranging accuracy at point O″.
Applsci 13 10578 g010
Figure 11. Comparison of distance visualization before and after optimization for serial number 1: (a) distance visualization before optimization at point O′; (b) distance visualization after optimization at point O′; (c) distance visualization before optimization at point O″; and (d) distance visualization after optimization at point O″.
Applsci 13 10578 g011
Table 1. Experimental environment and configurations.
ParametersParameter Settings
Camera modelMER-500-7UC
Image resolution (pixel)2592 × 1944
Number of dataset images750
Number of training set images525
Number of testing set images225
Image annotation toolLabellmg
Network modelYOLOv5s
CPUAMD EPYC 7601
GPU3070-8G
Table 2. Detection performance of model.
ParametersPrecisionRecallmAP@0.5FPS (f/s)
Result Values99.9%100%99.5%90.09
Table 3. Results of object detection bounding box optimization.
Serial
Number
Image at O′ PointImage at O″ Point
WOVHOVWOVHOV
12.32%1.43%1.28%1.75%
22.22%0.24%2.05%0
33%2.7%1.19%0.27%
44.47%3.38%3.41%5.41%
58.92%3.38%3.86%1.49%
63.21%6.98%2.07%4.19%
77.79%5.29%2.75%8.54%
812.38%12.14%11.27%10.46%
919.24%9.39%14.07%8.44%
Table 4. Results of ranging with height difference of 10 cm and pitch angle of 12°.
Serial
Number
Image at O′ PointImage at O″ Point
Actual
Distance
(cm)
Ranging before Optimization (cm)Ranging after Optimization
(cm)
Relative Error after OptimizationActual
Distance
(cm)
Ranging before Optimization (cm)Ranging after Optimization
(cm)
Relative Error after Optimization
1162.98152.86160.771.36%165.72156.79163.161.54%
2184.39181.41183.100.70%186.81184.07185.440.73%
3211.81193.33208.611.51%213.93196.30210.101.79%
4258.12239.94252.502.18%259.86243.62253.572.42%
5302.66271.17296.260.48%304.13279.42298.730.16%
6352.36333.42345.282.01%354.54342.35350.351.18%
7426.94320.99417.152.29%427.93339.37418.192.27%
8459.74430.26448.982.34%461.22439.39452.71.84%
9501.65375.32489.222.47%502.56400.82490.932.31%
Disclaimer/Publisher’s Note: The statements, opinions and data contained in all publications are solely those of the individual author(s) and contributor(s) and not of MDPI and/or the editor(s). MDPI and/or the editor(s) disclaim responsibility for any injury to people or property resulting from any ideas, methods, instructions or products referred to in the content.

