Article

Analysis of Energy Evolution and Acoustic Emission Characteristics of Rocks under Cyclic Loading and Unloading

College of Civil Engineering, Liaoning Technical University, Fuxin 123000, China
*
Author to whom correspondence should be addressed.
Appl. Sci. 2023, 13(18), 10453; https://doi.org/10.3390/app131810453
Submission received: 21 August 2023 / Revised: 5 September 2023 / Accepted: 15 September 2023 / Published: 19 September 2023
(This article belongs to the Special Issue Latest Research on Geotechnical Engineering)

Abstract

:
This paper presents two experimental schemes, graded cyclic loading and unloading, and variable lower limit cyclic loading and unloading, to investigate the energy evolution and acoustic emission characteristics of rocks under different cyclic loading and unloading paths. The experiments were conducted using a WAW-300B microcomputer-controlled hydraulic servo universal testing machine and an AMSY-6 acoustic emission testing instrument. The evolution characteristics of both the acoustic emission ring count and energy count during the loading process were monitored in real-time, and the energy evolution and damage status of the rocks in each cycle were inferred from the stress–strain curve. The results show that: (1) under both types of cyclic loading and unloading paths, the elastic energy, dissipative energy, and total energy of the rocks are positively correlated with the number of cycles; (2) through comparative analysis of the energy dissipation rate and storage rate, it is concluded that the gradual accumulation of dissipative energy ultimately leads to rock failure; (3) based on the energy dissipation method, the study reveals that rock damage is more severe under the variable lower limit cyclic loading and unloading path; (4) under both types of cyclic loading and unloading, the acoustic emission ring count exhibits the Kaiser effect, and Felicity is negatively correlated with the number of cycles. This holds significance in comprehending the behavior of rock deterioration and forecasting its state of destruction.

1. Introduction

Currently, in underground engineering construction, with the increase in deep mining, the rock mass is often subjected to repeated loading and unloading, which can compromise the stability of the rock mass and pose a significant threat to the safety of lives and properties. In recent years, numerous scholars have conducted laboratory experiments to study rock behavior under cyclic loading and unloading. Wu et al. [1] designed three different schemes for cyclic loading and unloading experiments and found that as the cyclic stress amplitude increases, the rock damage becomes more severe. Zhou Y.C. [2] used acoustic emission localization technology to observe the accumulation and expansion of internal microscopic cracks in rocks during uniaxial compression, leading to macroscopic failure. Yang [3] and others conducted uniaxial cyclic loading and unloading experiments on coal and discovered distinct phase characteristics in energy conversion within the coal. Jing Lai et al. [4] conducted experimental studies on saturated rocks under different cyclic loading and unloading conditions and concluded that rock damage was more severe under equal loading cyclic paths compared to graded cyclic paths. Chen [5] performed cyclic loading and unloading tests on dry and saturated sandstones and used the energy dissipation method to obtain a concave downward curve relationship between the damage variable D and the number of cycles. Cao [6] studied the acoustic emission characteristics of rocks under cyclic loading and unloading and quantitatively reflected the degree of the Kaiser effect using the Felicity ratio. Liu [7] analyzed the energy of rock uniaxial cyclic compression tests and fitted the hysteresis energy with the applied load, revealing a linear increase in hysteresis energy with the increase in load. Wang et al. [8] conducted triaxial cyclic loading and unloading experiments, using the acoustic emission impact rate associated dimension to characterize rock failure and found that the impact rate associated dimension tended to be more ordered as macroscopic fractures appeared in rocks. Liu et al. [9] studied the mechanical properties of sandstone under triaxial cyclic loading and used the cumulative dissipated energy damage variable theory to analyze the increase in the damage variable with the increase in cyclic loading stress. Qin et al. [10] studied the mechanical properties and acoustic emission characteristics of sandstone under cyclic loading and unloading, finding that an increase in the number of cycles improved the elastic modulus of rocks with a gradual decrease in the Felicity ratio. Zou et al. [11] investigated the energy evolution laws of hexagonal honeycomb structures under different graded cyclic loading and unloading patterns, reflecting the exacerbation of internal rock damage with increased upper and lower bounds of cyclic loading and unloading. Lu [12] conducted research on the acoustic emission response characteristics of internal strain in rocks under coal rock loading and unloading. When stress reached 80% of the peak strength, crack propagation and the number of acoustic emission events in rocks increased rapidly. Meng et al. [13] conducted triaxial cyclic loading–unloading tests on rocks under different confining pressures, demonstrating that confining pressure plays a suppressive role in rock failure, and the dissipated energy gradually decreases with the increase in confining pressure. Sun [14], through a comparison of uniaxial compression and conventional triaxial cyclic loading–unloading tests, concluded that the rock bearing capacity gradually increases with the increase in confining pressure, with minimal influence on the damping ratio. Through the work of Jiaqi L et al. [15], the deformation behavior and failure mechanism of frozen weakly cemented sandstone during cyclic loading and unloading processes are revealed. Sun Bing et al. [16] conducted research on the influence of different stress paths on energy dissipation and deformation damage. He proposed the concept and calculation method of ultimate damage energy and derived the energy evolution law considering viscoelasticity. Zhaoqi L et al. [17] employed acoustic emission technology to identify and analyze the damage of fiber mortar under cyclic loading, utilizing multiple parameters to characterize the failure mechanism of the mortar. Liang W et al. [18], utilizing sonic emission technology, explored the relationship between sonic emission energy and the rate at which damage energy is released. Numerous scholars have made certain achievements in studying the energy evolution and damage analysis of rocks under the same cyclic loading path. However, there is relatively limited research on the energy evolution and damage conditions of rocks under different cyclic loading paths.
This study examines the variations in the elastic strain energy, dissipated energy, total energy, plastic deformation energy, and hysteresis energy of rocks under diverse cyclic loading and unloading paths through an in-depth exploration of energy dynamics. By fusing the principles of dissipated energy, the correlation between the degree of rock damage and the number of cycles under distinct cyclic loading and unloading paths is discerned, ensuring a fortified foundation for underground engineering construction. Leveraging acoustic emission signal technology, the Felicity ratio is employed to ascertain the extent of internal rock damage, thereby corroborating the precision of the computed outcomes derived from the energy dissipation method. The realm of deep mining confronts a myriad of challenges, whereby various mining techniques, influenced by disruptive factors, engender recurrent loading and unloading on the immediate roof, consequently imparting direct ramifications on rock failure. Hence, an extensive investigation into energy evolution and rock damage under diverse cyclic paths assumes momentous import within the realm of deep coal mining.

2. Preparation and Experimental Methods

2.1. Sample Preparation

The rock samples used in the experiment were obtained from a depth of approximately 750 m underground in a mining area. They exhibit a yellow color. The primary constituent of these sandstones is sand particles, predominantly composed of quartz, but also containing other minerals such as feldspar, mica, and carbonate. The size of these particles typically ranges from 0.0625 mm to 2 mm. On-site drilling was conducted to obtain the rock specimens, which were promptly packaged and transported back to the laboratory. Following the specifications outlined in the “Standard Test Methods for Engineering Rock Mass Characterization” [19], the rock was cut and polished using a rock-cutting machine and grinding wheel to produce standardized specimens measuring 50 mm × 100 mm in dimensions.

2.2. Experimental Equipment

The experimental setup for this test consists of a WAW-300B microcomputer-controlled electro-hydraulic servo universal testing machine and an AMSY-6 acoustic emission testing instrument, as shown in Figure 1. The main components of the electro-hydraulic servo testing machine include the test host, hydraulic source, measurement and control system, and the testing device. The testing machine has a test force range of 0–300 kN, with a control accuracy of stress, strain, and displacement ≤1%, and a stress rate control range of 1 MPa/s to 45 MPa/s. The measurement range of the test force is 2–100%FS, making it suitable for tension and compression tests using various control methods such as stress, displacement, and test force. In the AMSY-6 acoustic emission testing instrument, the high-sensitivity piezoelectric sensor features a center frequency of 150 kHz for acoustic emission detection. The pre-amplifier with a resistance of 50 Ω ensures normal operation in complex operating environments. The front panel LED lights on the signal acquisition and processing system indicate the presence of impact signals, the normal connection of the pre-amplifier cables, the normal use of acoustic emission signals, and the amplitude saturation status. The main unit box contains 12 channels, and the testing instrument enables data acquisition, analysis, processing, and display.

2.3. Experimental Plan

2.3.1. Experimental Loading Scheme

The current experimental plan involves a graded cyclic loading and unloading scheme for rocks, with a loading rate set at 0.25 kN/s. Starting from 0 kN, each cycle of loading and unloading increases the load by 20 kN, with the test force reaching the target stress value before unloading at the same rate of 0.25 kN/s until it reaches 0 kN. This test procedure is repeated until the rock specimen is completely fractured, at which point the test is terminated. The variable lower bound cyclic loading and unloading test scheme differs from the graded cyclic loading and unloading test scheme in that only the first unloading is performed until it reaches 0 kN, while subsequent unloadings are conducted at the maximum test stress reached in the previous loading cycle. Both cyclic loading and unloading test schemes are depicted in Figure 2. To enhance the accuracy of the test results, three specimens are selected for each test scheme to undergo cyclic loading and unloading.

2.3.2. Acoustic Emission Detection Plan

Connect the acoustic emission probe to the preamplifier, and then connect it to the acoustic emission data acquisition card. Turn on the acoustic emission tester and check if it is functioning properly. In order to ensure that the acoustic emission tester can record the sounds of internal rock failure in detail during the test, the electro-hydraulic servo universal testing machine and the acoustic emission tester need to run simultaneously during both cyclic loading and unloading tests. The high-sensitivity acoustic emission sensor used in this experiment is set to a frequency of 100 kHz. To reduce interference from external noise, the preamplifier amplification factor is set to 40 dB, the threshold is set to 45 dB, and the sampling rate is 2 MSPS. Two acoustic emission sensors are placed about 35 cm apart and arranged in a staggered manner on the surface of the rock, as shown in Figure 3. The acoustic emission sensors are coupled to the rock by applying grease and secured with tape, which helps improve the accuracy of recording ring-down counts and energy counts for each channel.

3. Experimental Results Analysis

Considering the length of the article, one set of test data is selected from each different cyclic loading path for analysis. Undesirable data points are eliminated, and different cyclic loading and unloading stress–strain curves are plotted using Origin software 2022, as shown in Figure 4.
From Figure 4, it can be observed that no unstable failure occurred during 9 cycles for both the cyclic loading and unloading paths of the rock samples. However, during the 10th cycle, when the stress exceeded the peak strength, the stress–strain curve exhibited a rapid drop, indicating the typical brittle failure of the rock. The peak strength of the graded cyclic loading and unloading test on the rock sample was 98.8 MPa with an axial strain of 5.12, while the peak strength of the variable lower limit cyclic loading and unloading test was 99.87 MPa with an axial strain of 4.87. The rock exhibited elastic-plastic characteristics, with the unloading curve not coinciding with the loading curve, forming a hysteresis loop. As the number of cycles increased, the hysteresis loop gradually expanded and shifted towards increased strain. The slope of the stress–strain curve during each cycle of loading and unloading gradually increased, indicating that cyclic loading and unloading improved the elastic modulus of the rock.
The rock failure under different cyclic loading–unloading tests is illustrated in Figure 5. In the graded cyclic loading–unloading test, the sound emitted during rock failure is relatively minimal, and crack propagation on the macroscopic surface of the rock occurs from bottom to top. In contrast, violent rock failure is observed in the lower limit cyclic loading–unloading test, with significant macroscopic surface cracks indicating tensile failure. It is evident from Figure 5 that the rock failure under lower limit cyclic loading–unloading is relatively severe.

4. Study on the Evolutionary Patterns of Energy in Different Cyclic Loading and Unloading

4.1. Methods for Energy Calculation

From an energy perspective, the cyclic loading and unloading process of rock materials conforms to the first law of thermodynamics, which states that different forms of energy remain conserved during energy transfer and conversion [11]. In the cyclic loading and unloading process, the work applied by the testing machine on the rock is the total input energy. Part of this energy is converted into elastic strain energy stored internally within the rock, which can be fully released during the unloading process. Another portion of the energy is irreversibly dissipated, including hysteresis energy and plastic deformation energy [7]. Some researchers argue that hysteresis energy exists in both the loading and unloading stages of the rock and is a specific type of irreversible dissipation energy. The energy consumed for the expansion of internal cracks and macroscopic failure within the rock is known as plastic deformation energy. Each point on the stress–strain curve of the rock corresponds to a unique energy state, and the magnitude of hysteresis energy can be represented by the area enclosed by the i-th unloading curve and the i + 1-th loading curve. The energy consumed by rock failure during the loading process can be determined using Formula (1), while the plastic deformation energy during the loading process can be calculated using Formula (2). The total energy input to the rock, represented by the area enclosed by the stress-loading curve and the strain axis, can be obtained using Formula (3). The elastic strain energy of the rock can be calculated by the area enclosed by the unloading curve and the strain axis, utilizing Formula (4). The energy schematic is illustrated in Figure 6.
The area enclosed by the curve OABO in Figure 6 represents the magnitude of the total energy input to the rock. The area enclosed by the curve CABC represents the magnitude of elastic strain energy. The area enclosed by the curve OACO represents the magnitude of dissipative energy. The area enclosed by the curve OAEDCO represents the magnitude of plastic deformation energy. The area enclosed by the curve CDEC represents the magnitude of hysteresis energy. (This experiment excludes the influence of temperature and radiation).
Note: In the translation above, I assumed that the curve labels “OABO”, “CABC”, “OACO”, “OAEDCO”, and “CDEC” are labels specific to the diagram and are not common terms or acronyms. If they hold significant meaning beyond the diagram, please let me know, and I can adjust the translation accordingly.
The relationships between elastic strain energy, dissipative energy, total input energy, hysteresis energy, and plastic deformation energy are expressed by the following equations:
U = U d + U e
U e = U s e + U c
U = ε 0 ε 2 σ d ε
U d = ε 1 ε 2 σ d ε
In the above equations, U , U d , U e , U s e , and U c represent the total input energy, elastic strain energy, dissipative energy, hysteresis energy, and plastic deformation energy, respectively, in the cyclic loading and unloading process. To enhance computational efficiency, the energy values for each cycle can be obtained using the “Polygon Area” function within the Analysis feature of Origin software.

4.2. Analysis of Energy Calculation Results

Compute the energy results for two different cyclic loading and unloading scenarios using Equations (1)–(4) and plot the energy versus cycle number relationship curves as shown in Figure 7 and Figure 8.
From Figure 7, it can be concluded that in the graded cyclic loading and unloading process, elastic strain energy, dissipative energy, total energy, hysteresis energy, and plastic deformation energy are positively correlated with the number of cycles. In the graded cyclic loading and unloading path, the majority of the input energy is converted into elastic strain energy stored within the rock. Dissipative energy exists in the form of hysteresis energy, and the energy consumed by the rock’s plastic deformation is relatively small. As a result, there are few vertical cracks on the macroscopic surface of the rock, and its integrity is relatively good when it undergoes failure.
From Figure 8, it can be observed that in the variable lower-bound cyclic loading and unloading process, elastic strain energy, dissipative energy, total energy, and plastic deformation energy are positively correlated with the number of cycles. Along the variable lower-bound cyclic loading and unloading path, as the number of cycles increases, after 5 cycles, dissipative energy gradually exceeds the elastic strain energy. Hysteresis energy decreases gradually, while the plastic deformation of the rock increases. The internal cracks of the rock continue to expand, and numerous cracks appear on the macroscopic surface of the rock when it undergoes failure.

4.3. Comparative Analysis of Energy Calculation Results for Different Cyclic Lading and Unloading Scenarios

Studying the energy distribution patterns of rocks under different cyclic loading and unloading paths can provide a visual representation of the energy evolution patterns of rocks under different cycling paths. By utilizing the energy results calculated in the previous section, the energy storage rate and energy dissipation rate are plotted against the number of cycles on a dual Y-axis curve, as shown in Figure 9.
From Figure 9, it can be observed that in the graded cyclic loading and unloading path, the energy storage rate during the 9 cycles ranges between 81% and 85%, indicating that prior to rock failure, the majority of energy is stored in the rock as elastic strain energy. However, the variable lower-bound cyclic loading and unloading path exhibits a different pattern. The energy storage rate initially decreases and stabilizes at around 50%, while the energy dissipation rate increases initially and stabilizes at around 50%. This indicates that after the 5th cycle, the damage within the rock steadily increases, accompanied by a gradual increase in plastic deformation. Eventually, a large number of cracks appear on the rock surface. This suggests that the accumulation of dissipative energy is the primary cause of internal crack propagation in both types of cyclic loading and unloading processes.

4.4. Investigation of Damage Evolution Patterns under Different Cyclic Loading and Unloading Scenarios

Rock damage refers to the process where internal microcracks, initiation, and propagation gradually evolve to the macro surface of the rock due to external load, resulting in the deterioration of the rock’s mechanical properties. Based on the previous analysis of the energy evolution patterns of rocks during cyclic loading and unloading, it was found that the accumulation of dissipative energy is the main cause of rock damage and deformation. Some researchers have achieved certain results by studying the accumulation of rock damage based on the energy dissipation method. According to the method used in reference [20] to calculate the damage characteristics of rocks during different cyclic processes, the calculation formula is as follows:
U e ( i ) = k = 1 i U e k
In Equation (5), we use symbol to represent the accumulated dissipated energy for the -th cycle, and symbol to represent the dissipated energy for the k-th cycle.
U ( i ) = U e ( i ) + U d ( i )
In Equation (6), we use symbol to represent the accumulated total strain energy for the -th cycle, and symbol to represent the elastic strain energy for the -th cycle.
D ( i ) = U e ( i ) U ( t )
In Equation (7), we use symbol to represent the damage of the rock sample at the -th cycle, and symbol to represent the accumulated total strain energy of the rock sample during the last loading.
By calculating Equations (5)–(7), the total strain energy of the rock under graded cyclic loading and unloading is determined to be 141.82 J, while under variable lower cyclic loading and unloading, the total strain energy of the rock is found to be 53.55 J. Substituting these values into the above equation, the damage results for each cycle of loading and unloading in the rock are obtained, and the relationship between rock damage and cycle number is illustrated in Figure 10.
From Figure 10, it can be observed that the damage variation curves of the rock under both cyclic loading and unloading paths exhibit a concave shape, and the growth rate of the damage variable gradually accelerates with an increase in the number of cycles. The differences in damage values for the rock under different cyclic loading and unloading paths are 0.005, 0.01, 0.05, 0.09, 0.13, 0.19, 0.25, 0.32, and 0.39, respectively. This indicates that different loading paths have a certain influence on rock failure when the compressive strength of the rock exceeds 40%. The final damage for the rock under the variable lower cyclic loading and unloading path is 0.85, while for the graded cyclic loading and unloading path, it is 0.45. This suggests that the variable lower cyclic loading and unloading path has a greater impact on the accumulation of internal rock damage.

5. Acoustic Emission Characteristics under Different Cyclic Loading and Unloading Conditions

5.1. Acoustic Emission Ring Count and Energy Count Characteristics under Different Cyclic Loading and Unloading Conditions

This study investigated the relationship between the initiation, development, and propagation of internal fractures in rocks during the process of loading and unloading, and the characteristics of acoustic emission. Acoustic emission ring count and energy count were used as parameters to reflect the internal damage of the rock. Based on experimental data, we plotted the curves of acoustic emission ring count, energy count, and stress variation over time during different cyclic loading and unloading processes (refer to Figure 11 and Figure 12).
From Figure 11 and Figure 12, it can be observed that during the first four cycles of loading and unloading, the influence of internal defects in the rock resulted in the gradual closure of its internal voids. As a result, both acoustic emission energy count and acoustic emission ring count exhibited subtle characteristics. From the fifth cycle to the ninth cycle, during the initial loading phase of each cycle, the internal portion of the rock was compacted, leading to an increase in the acoustic emission ring count. When the rock was in the elastic stage, the acoustic emission ring count entered a brief stable period. As the load increased beyond the previous target stress level, the acoustic emission ring count showed an increasing trend and exhibited a pronounced Kaiser effect [10]. When the rock reached its peak strength, the acoustic emission signals became dense, with a maximum ring count of 3745 and an acoustic emission energy of 3.0 × 10⁸. During the unloading process, the acoustic emission signals remained weak.
The curves depicting the variation in acoustic emission ring count, energy count, and stress over time during the cyclic loading and unloading process with a lower limit are shown in Figure 13 and Figure 14.
Based on Figure 13 and Figure 14, it can be inferred that during the cyclic loading and unloading process with a decreasing lower limit, the acoustic emission ringdown count increases when the stress exceeds the previous target stress, exhibiting a significant Kaiser effect. Additionally, during the unloading process, there is a noticeable decrease in the acoustic emission ringdown count, indicating a transition into a weak state. Similar characteristics can be observed in the cyclic loading and unloading with the same stress level. When the rock reaches its peak strength, the acoustic emission ringdown count becomes more concentrated, reaching a maximum of 1755 counts, with an acoustic emission energy of 1.8 × 10⁹. This implies that damage occurs on the macroscopic surface of the rock, with penetrating fractures propagating from bottom to top.

5.2. Acoustic Emission Felicity Ratio

During the experimental loading process, it was observed that when the applied stress did not exceed the target stress from the previous loading stage, there were few acoustic emission signals. However, when the stress exceeded the target stress, there was a significant increase in acoustic emission signals, which is referred to as the acoustic emission Kaiser effect [21]. According to Equation (8), the Kaiser effect can be objectively expressed through the Felicity ratio. It is stated in reference [21] that the magnitude of the Felicity ratio can indicate the extent of internal damage within the rock. A smaller Felicity ratio implies more severe internal damage during the previous cyclic loading and unloading process.
Felicity ratio is defined as
R F ( i ) = σ i σ ( i - 1 ) max
In Equation (8): represents the stress corresponding to significant changes in acoustic emission during the cycle process; represents the target stress from the previous loading.
Calculate the Felicity results for graded cyclic loading–unloading and variable lower limit cyclic loading–unloading using Equation (8) and plot the curve of Felicity ratio against cycle number in Figure 14.
By looking at Figure 15, it can be observed that both types of cycles show a decreasing trend in Felicity ratio. In the graded cyclic loading–unloading, from the first to the sixth cycle, the Felicity ratio reduces from 1.8 to 1, exhibiting a significant Kaiser effect. After the sixth cycle, the Felicity ratio remains below 1 and slowly decreases, indicating the failure of the Kaiser effect. On the other hand, in the variable lower limit cyclic loading–unloading, from the first to the fifth cycle, the Felicity ratio decreases from 1.83 to 1.17, showing a noticeable Kaiser effect. After the fifth cycle, the Felicity ratio drops below 1, indicating the failure of the Kaiser effect. Through nine cycles of loading–unloading, it is observed that the rock undergoes severe damage in the variable lower limit cyclic loading–unloading, which aligns with the damage calculation using the energy dissipation method.

6. Conclusions

(1)
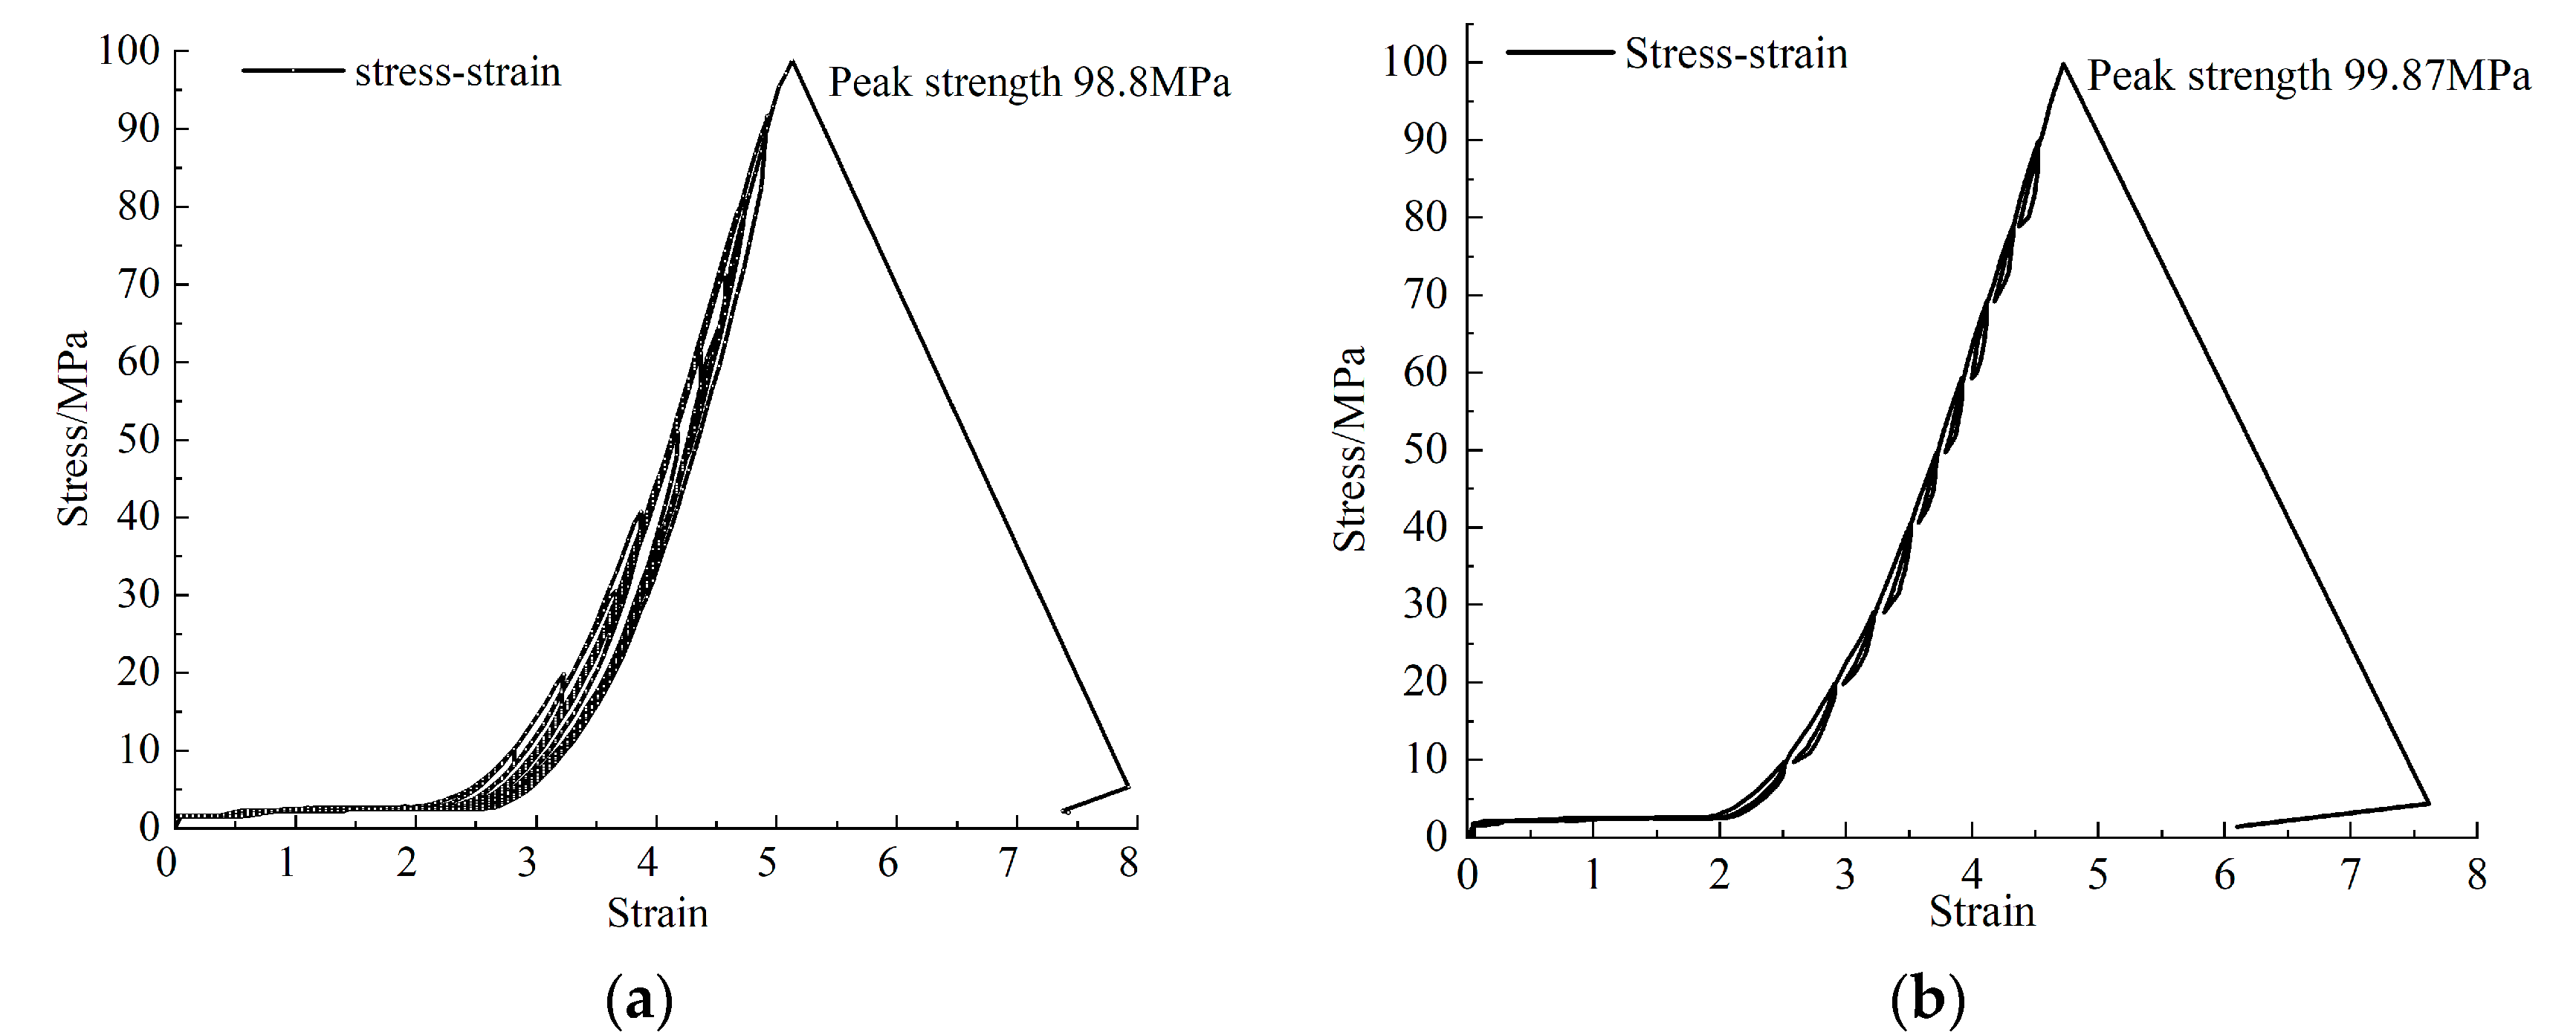
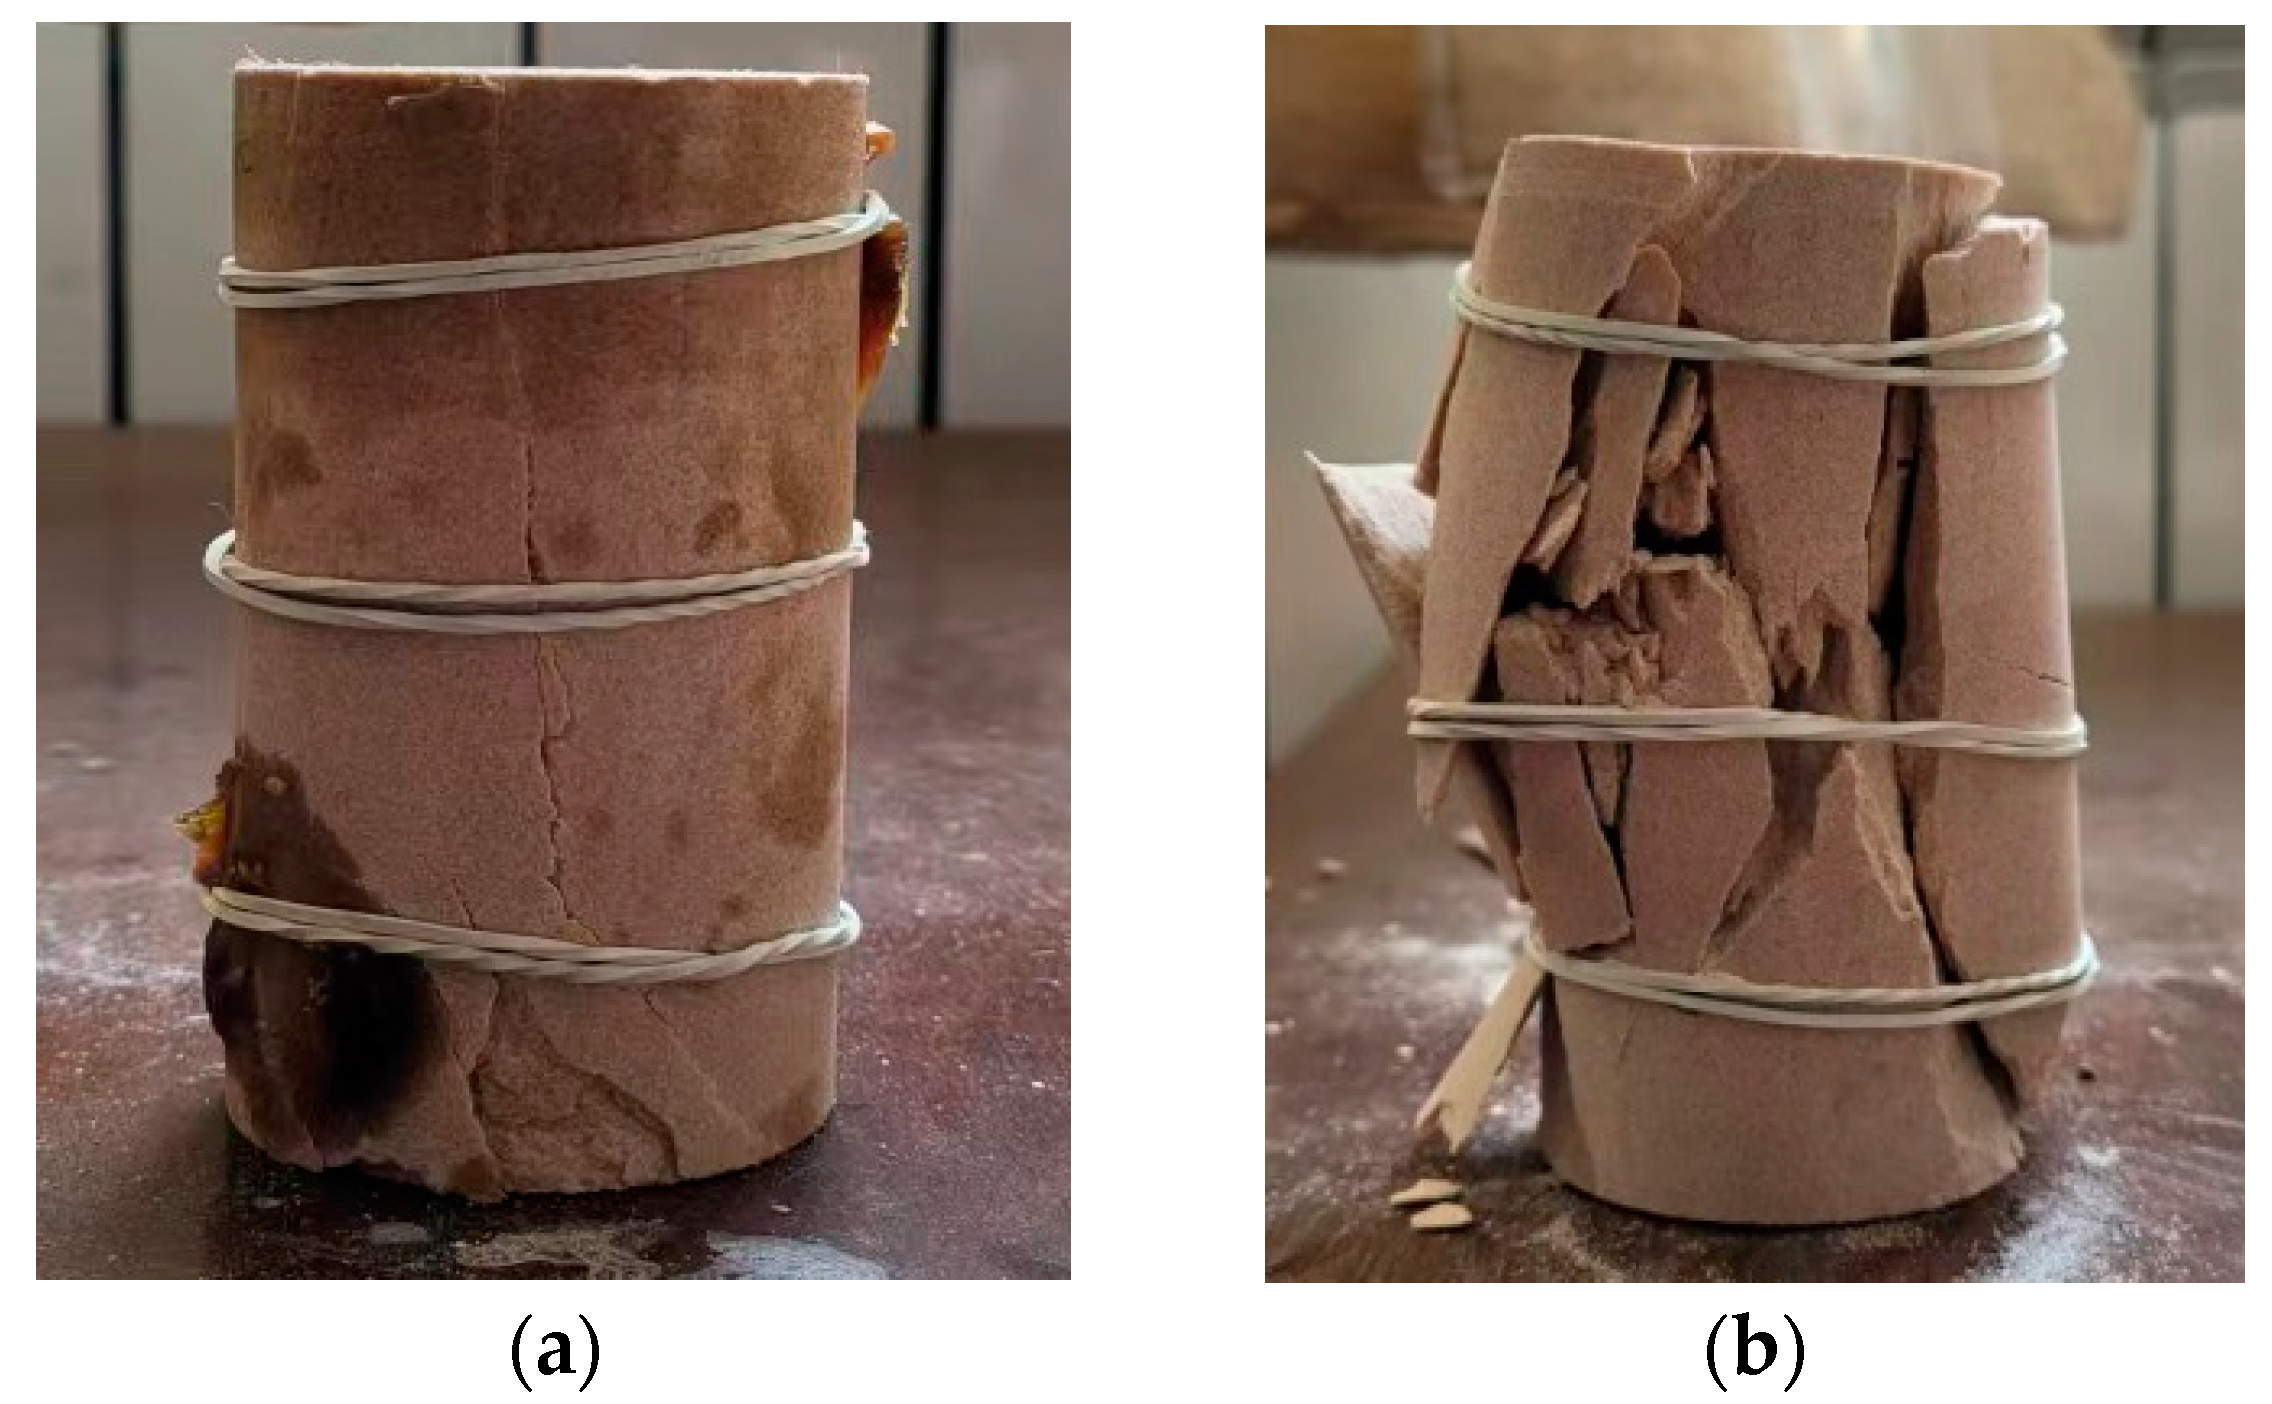
Under the conditions of graded cyclic loading–unloading, the compressive strength of the rock is 98.8 MPa. The rock exhibits through-going fractures from bottom to top during failure. On the other hand, under the conditions of variable lower limit cyclic loading–unloading, the compressive strength of the rock is 99.87 MPa. Numerous fractures are observed during rock failure, indicating the poor integrity of the rock. This suggests that the variable lower limit cyclic loading–unloading path has a significant influence on the instability and failure of the rock.
(2)
Under the graded cyclic loading–unloading path, the energy storage ratio of the rock ranges from 81% to 85%. This indicates that the internal damage accumulation in the rock is relatively small. The rock produces less sound during failure, and through-going cracks are observed on the macroscopic surface. On the other hand, under the variable lower limit cyclic loading–unloading path, the energy storage ratio gradually decreases, leading to an increasing energy dissipation ratio. Ultimately, both ratios approach 50%. The damage accumulation in the rock steadily increases, and the rock exhibits significant sound during loading and large cracks on the macroscopic surface. This represents a typical brittle failure.
(3)
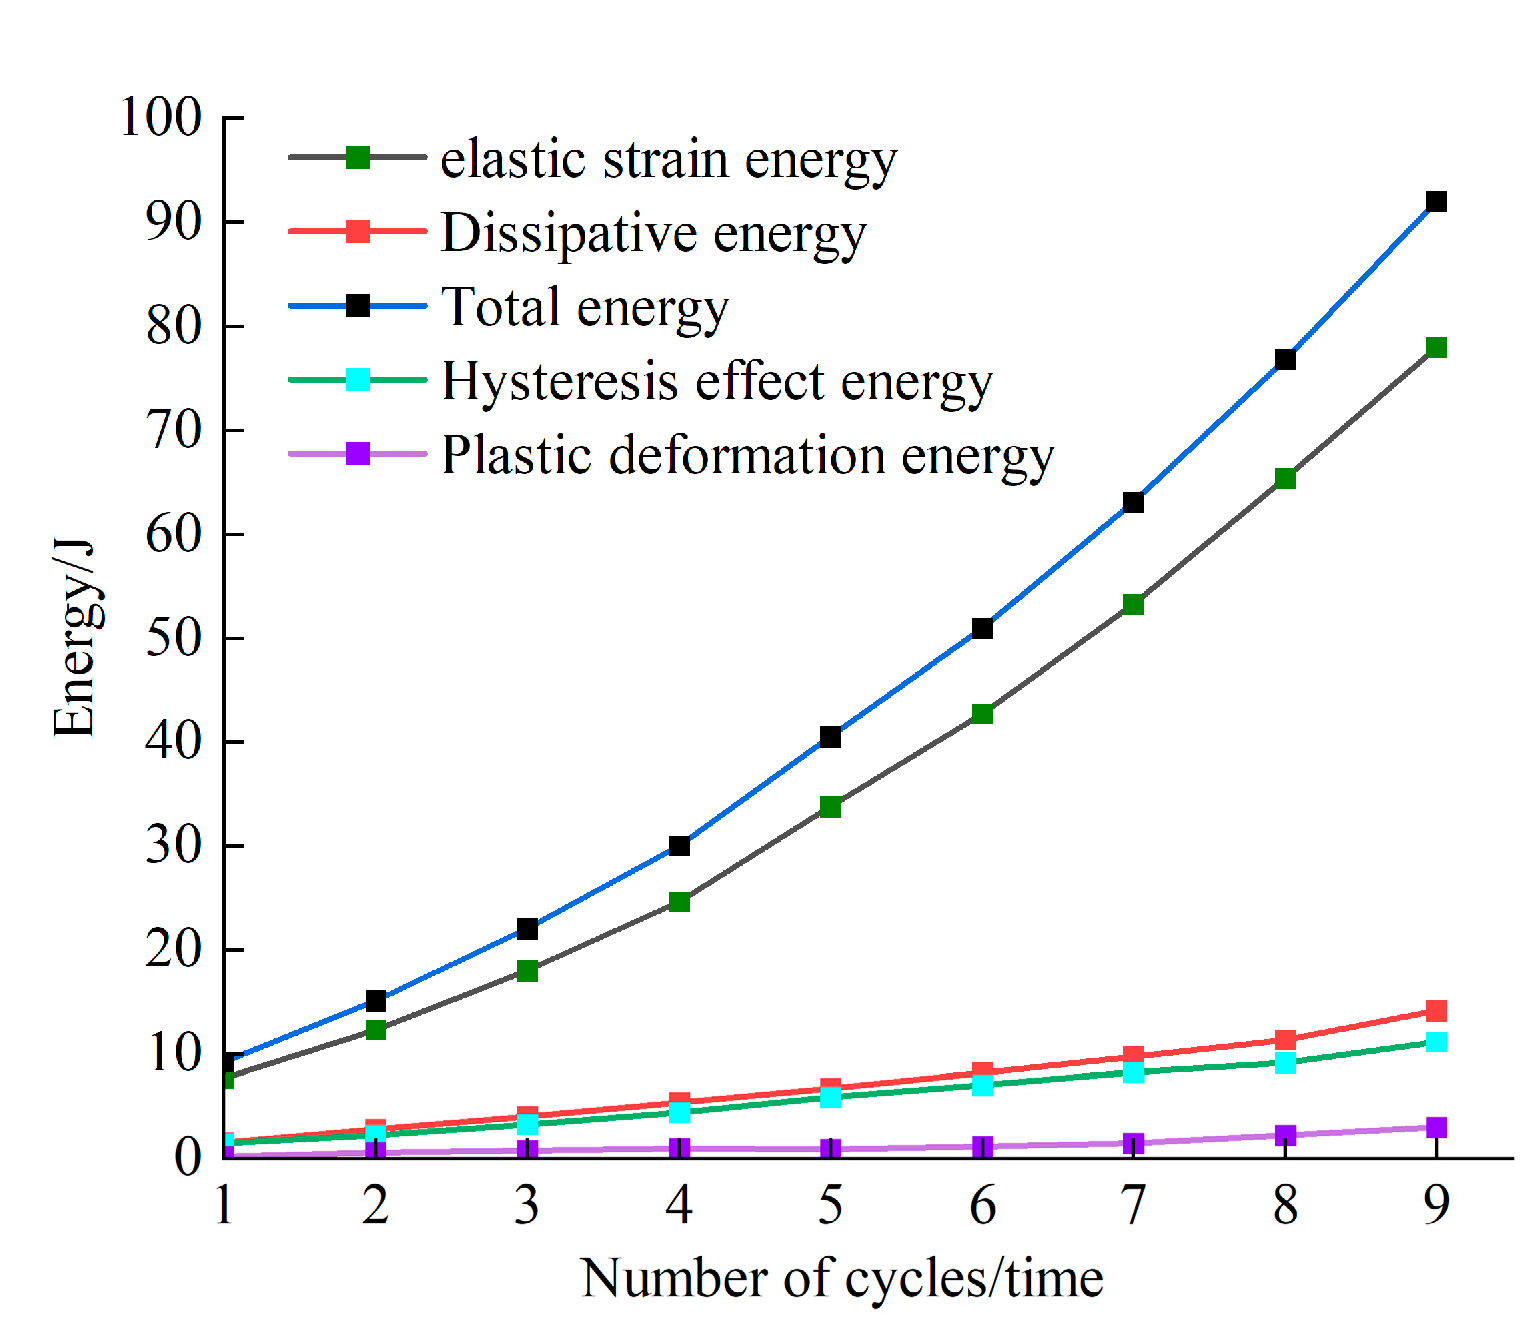
The elastic strain energy, dissipative energy, total energy, and plastic deformation energy of the rock exhibit similar trends and are positively correlated with the number of cycles under both graded and variable lower limit cyclic loading–unloading paths. By studying the damage accumulation in the rock using the energy dissipation method, it is found that the damage values for the graded and variable lower limit cyclic loading–unloading paths are 0.48 and 0.85, respectively. This indicates that the internal damage accumulation in the rock is more severe under the variable lower limit cyclic loading–unloading path.
(4)
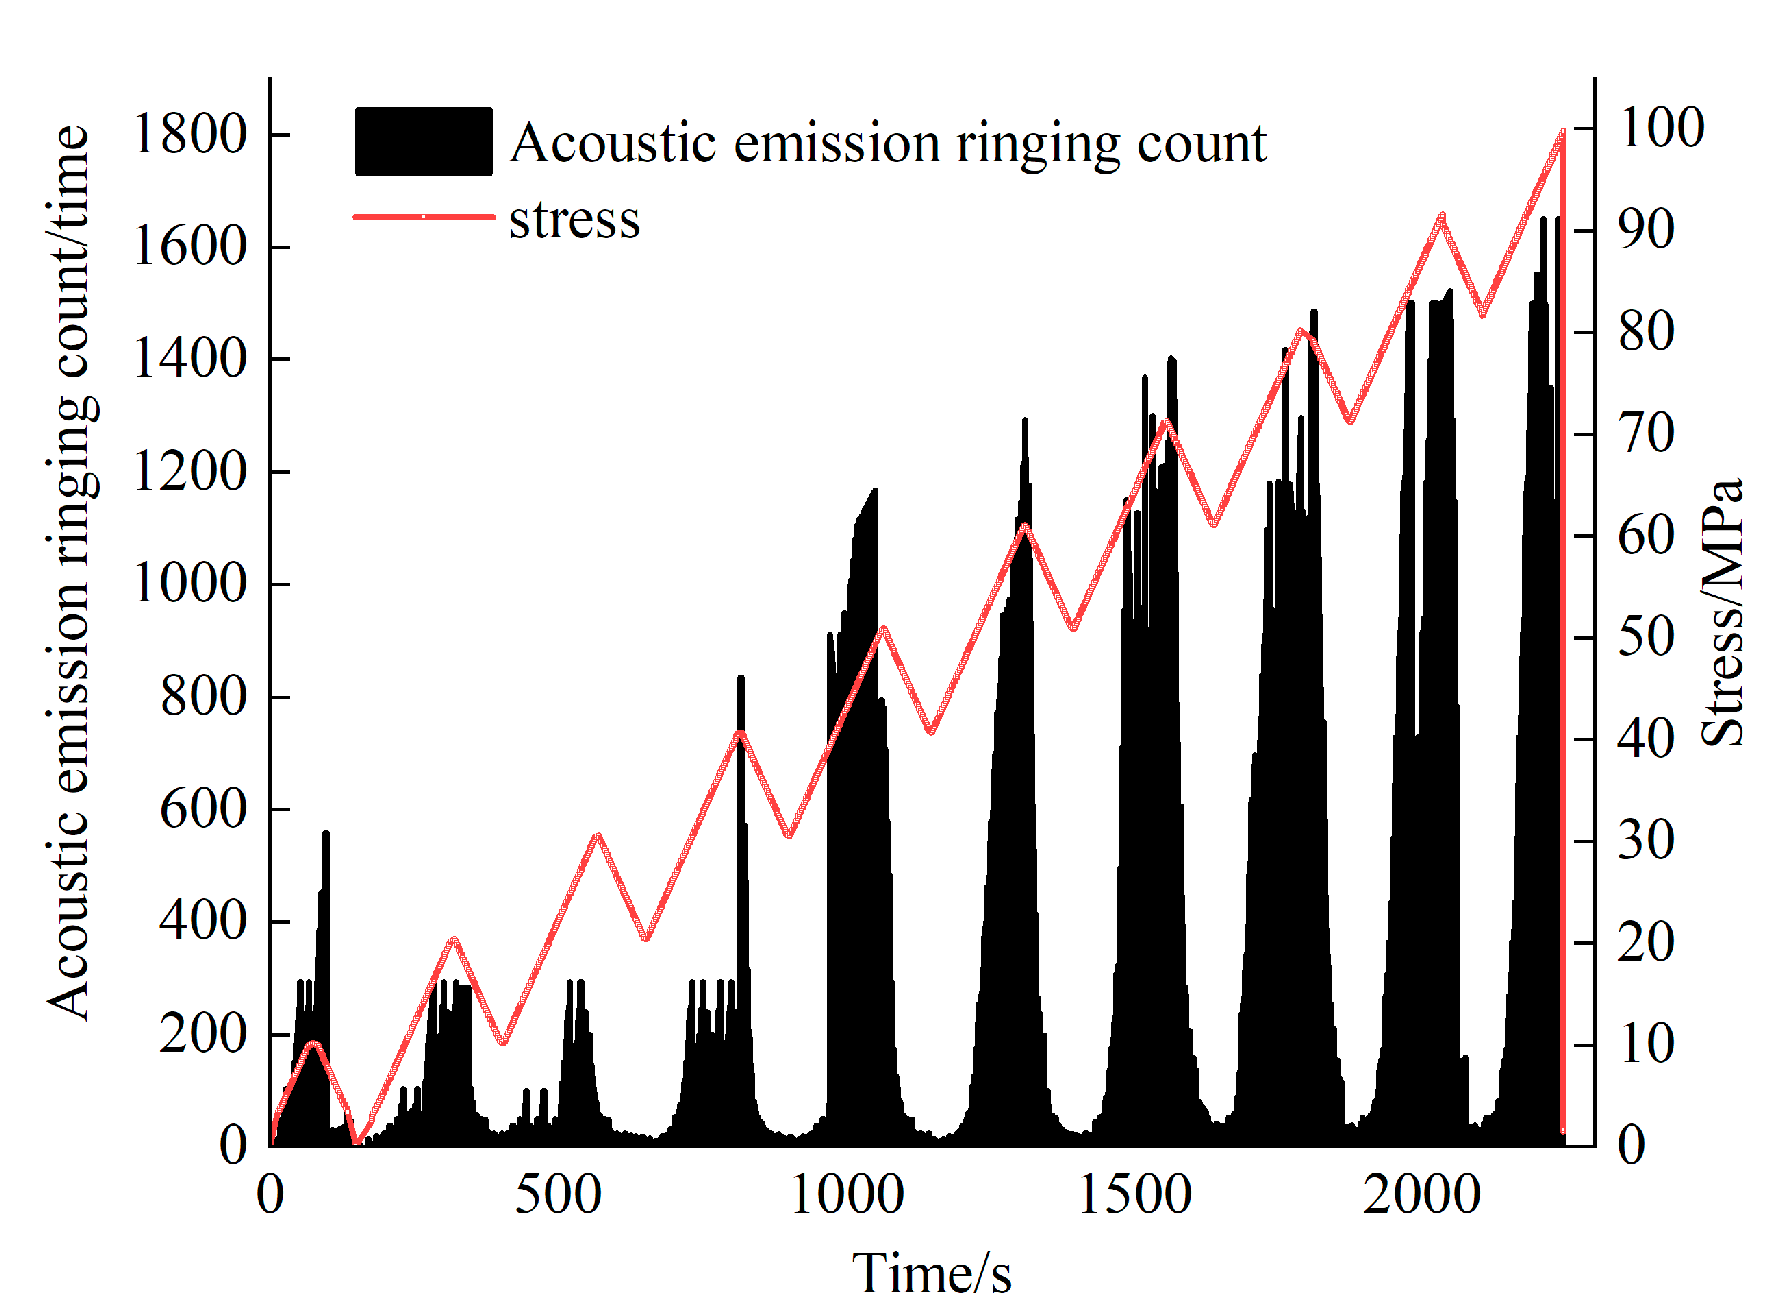
Under both types of cyclic loading–unloading paths, the early stages of acoustic emission characteristics exhibit the Kaiser effect, and the Felicity ratio is negatively correlated with the number of cycles. Under the graded cyclic loading–unloading path, when the applied stress exceeds 60% of the peak stress, the Felicity ratio is less than one, indicating the failure of the Kaiser effect. Similarly, under the variable lower limit cyclic loading–unloading path, when the applied stress exceeds 50% of the peak stress, a Felicity ratio less than one is observed, indicating the failure of the Kaiser effect. This phenomenon becomes more pronounced with an increasing number of cycles, indicating the gradual accumulation of internal damage in the rock.
Studying the evolutionary patterns of rock energy during cyclic loading and unloading, as well as the characteristics of acoustic emissions, holds significant scientific and engineering value in deepening our understanding of rock behavior, predicting rock damage and failure, and optimizing engineering designs.

Author Contributions

Conceptualization, Z.W. and Y.Y.; methodology, Z.W.; validation, Y.X., P.L. and N.G.; formal analysis, Z.W.; data curation, C.X.; writing—original draft preparation, N.G.; writing—review and editing, Z.W. All authors have read and agreed to the published version of the manuscript.

Funding

This research received no external funding.

Institutional Review Board Statement

Not applicable.

Informed Consent Statement

Not applicable.

Data Availability Statement

Not applicable.

Conflicts of Interest

The authors declare no conflict of interest.

References

  1. Wu, Z.H.; Song, C.Y.; Tan, J.; Zhang, Y.Z.; Qi, Z.J. Study on the Energy Evolution of Rocks under Different Graded Cyclic Loading and Unloading Modes. J. Min. Saf. Eng. 2020, 37, 836–844+851. [Google Scholar]
  2. Zhou, Y.C. Research on the Energy Evolution Law and Acoustic Emission Characteristics of Sandstone under Uniaxial Cyclic Loading and Unloading Conditions. Master’s Thesis, Shandong Agricultural University, Tai’an, China, 2019. [Google Scholar]
  3. Yang, Z.; Guo, A.W. Research on Mechanical Properties and Energy Evolution Law of Coal under Cyclic Loading. China Coal 2023, 49, 42–47. [Google Scholar]
  4. Jing, L.W.; Li, X.S.; Yan, Y.; Peng, S.C.; Li, S.W.; Jing, W. Analysis of energy evolution and damage characteristics of saturated rock materials under cyclic loading and unloading. Min. Res. Dev. 2022, 42, 113–119. [Google Scholar]
  5. Chen, X.; Lin, J.; Cao, G.Y.; Yang, Y.; Yin, J.C.; Fan, H. Energy evolution characteristics and damage characterization of sandstone under cyclic loading and unloading. Sci. Technol. Eng. 2022, 22, 5792–5799. [Google Scholar]
  6. Cao, L.H. A Study on the Acoustic Emission Characteristics and Kaiser Effect Characteristics of Rocks under Cyclic Loading and Unloading. Master’s Thesis, Yanshan University, Qinhuangdao, China, 2020. [Google Scholar]
  7. Liu, Z.X.; Wang, W.; Luo, J.A.; Miao, G.H. Energy evolution analysis method in uniaxial compression tests of rocks. J. Coal Sci. 2020, 45, 3131–3139. [Google Scholar]
  8. Wang, W.; Wang, T.; Xiong, D.F.; Chen, L.; Zhang, H.Y.; Zhu, Q.Z. Experimental study on fractal characteristics of acoustic emission from sandstone under triaxial cyclic loading and unloading. Eng. Sci. Technol. 2022, 54, 90–100. [Google Scholar]
  9. Liu, H.T.; Yang, X.H. Mechanical properties and energy evolution of sandstone under triaxial cyclic loading. J. Heilongjiang Univ. Sci. Technol. 2023, 33, 18–23+39. [Google Scholar]
  10. Qin, T.; Ren, K. Mechanical properties and acoustic emission characteristics of sandstone under cyclic loading and unloading. J. Heilongjiang Univ. Sci. Technol. 2022, 32, 275–279. [Google Scholar]
  11. Zou, Q.L.; Zhou, X.L.; Wang, R.Z.; Liu, H.; Liu, Y. Energy evolution law of hexagonal honeycomb under different graded cyclic loading and unloading modes. J. Chongqing Univ. Available online: http://kns.cnki.net/kcms/detail/50.1044.N.20221017.1821.002.html (accessed on 25 May 2023).
  12. Lu, W.K. Research on Strain Acoustic Emission Response Characteristics and Instability Precursor Information under Loading and Unloading of Coal and Rock. Master’s Thesis, China University of Mining and Technology, Beijing, China, 2021. [Google Scholar]
  13. Meng, Q.B.; Wang, C.K.; Huang, B.X.; Pu, H.; Zhang, Z.Z.; Sun, W.; Wang, J. Evolution and distribution law of rock energy under triaxial cyclic loading and unloading. J. Rock Mech. Eng. 2020, 39, 2047–2059. [Google Scholar]
  14. Sun, Z.K. A Study on the Mechanical Properties and Energy Evolution of Sandstone under Cyclic Loading and Unloading. Master’s Thesis, Shenyang Jianzhu University, Shenyang, China, 2021. [Google Scholar]
  15. Liu, J.; Lyu, X.; Liu, Y.; Zhang, P. Energy evolution and macro-micro failure mechanisms of frozen weakly cemented sandstone under uniaxial cyclic loading and unloading. Cold Reg. Sci. Technol. 2023, 214, 103947. [Google Scholar] [CrossRef]
  16. Sun, B.; Yang, H.; Fan, J.; Liu, X.; Zeng, S. Energy Evolution and Damage Characteristics of Rock Materials under Different Cyclic Loading and Unloading Paths. Buildings 2023, 13, 238. [Google Scholar] [CrossRef]
  17. Li, Z.; Dong, J.; Chen, H.; Wu, Z.; Feng, K.; Zhang, G.; Cheng, S.; Jiang, T. Mechanical behaviour and acoustic emission characteristics of basalt fibre mortar rubble under uniaxial cyclic compression. Constr. Build. Mater. 2023, 393, 132145. [Google Scholar] [CrossRef]
  18. Wang, L.; Xie, J.; Qiao, D.; Wang, J.; Huang, F. Damage evolution model of cemented tailing backfill based on acoustic emission energy. IOP Conf. Ser. Earth Environ. Sci. 2021, 631, 012071. [Google Scholar] [CrossRef]
  19. GB/T 23561.1-2009; Methods for Determining the Physical and Mechanical Properties of Coal and Rock—Part 7: Determination of Uniaxial Compressive Strength and Calculation of Softening Coefficient. China Standard Publishing House: Beijing, China, 2009.
  20. Hua, W. A Study on the Mechanical Properties and Damage Evolution Mechanism of Weakly Cemented Sandstone under Uniaxial Cyclic Loading and Unloading. Master’s Thesis, Anhui Jianzhu University, Hefei, China, 2021. [Google Scholar]
  21. Wang, T.Z.; Wang, C.L.; Xue, F.; Wang, L.X.; Xu, M.Y. Study on the evolution law of acoustic emission and strain field of red sandstone under different cyclic loading and unloading paths. J. Rock Mech. Eng. 2022, 41, 2881–2891. [Google Scholar]
Figure 1. WAW-300B testing machine and the AMSY-6 acoustic emission testing instrument.
Applsci 13 10453 g001
Figure 2. (a). Grading cycle loading and unloading test plan. (b). Variable lower limit cycle loading and unloading plan.
Applsci 13 10453 g002
Figure 3. Acoustic Emission Installation Diagram.
Applsci 13 10453 g003
Figure 4. (a). Stress–strain curve under graded cyclic loading. (b). Stress–strain curve under variable lower limit cyclic action.
Applsci 13 10453 g004
Figure 5. (a). Rock failure under graded cycling. (b). Rock failure under variable lower limit cyclic action.
Applsci 13 10453 g005
Figure 6. Energy schematic diagram.
Applsci 13 10453 g006
Figure 7. Grading Cycle Loading and Unloading Energy and Number of Cycles.
Applsci 13 10453 g007
Figure 8. Variable Lower Limit Cycle Loading and Unloading Energy and Number of Cycles.
Applsci 13 10453 g008
Figure 9. Energy storage rate, energy dissipation rate, and number of cycles.
Applsci 13 10453 g009
Figure 10. Relationship between rock damage and number of cycles under different cyclic loading and unloading paths.
Applsci 13 10453 g010
Figure 11. Grading Cycle Loading and Unloading Acoustic Emission Ringing Count and Time.
Applsci 13 10453 g011
Figure 12. Grading Cycle Loading and Unloading Energy Count and Time.
Applsci 13 10453 g012
Figure 13. Acoustic Emission Ringing Counts and Time Curve during Variable Lower Limit Cyclic Loading and Unloading Process.
Applsci 13 10453 g013
Figure 14. Energy Counting and Time Curve during Cycle Loading and Unloading with Variable Lower Limit.
Applsci 13 10453 g014
Figure 15. Depicts the juxtaposition of Felicity and the curve of iteration-count.
Applsci 13 10453 g015
Disclaimer/Publisher’s Note: The statements, opinions and data contained in all publications are solely those of the individual author(s) and contributor(s) and not of MDPI and/or the editor(s). MDPI and/or the editor(s) disclaim responsibility for any injury to people or property resulting from any ideas, methods, instructions or products referred to in the content.

