


Carbon Dioxide Uptake by Brazilian Cement-Based Materials
 , ,
, ,
Abstract
:Featured Application
Abstract
1. Introduction
1.1. International Climate Change Context
1.2. General Background on the Carbonation as a Stage in the Decarbonization Roadmaps
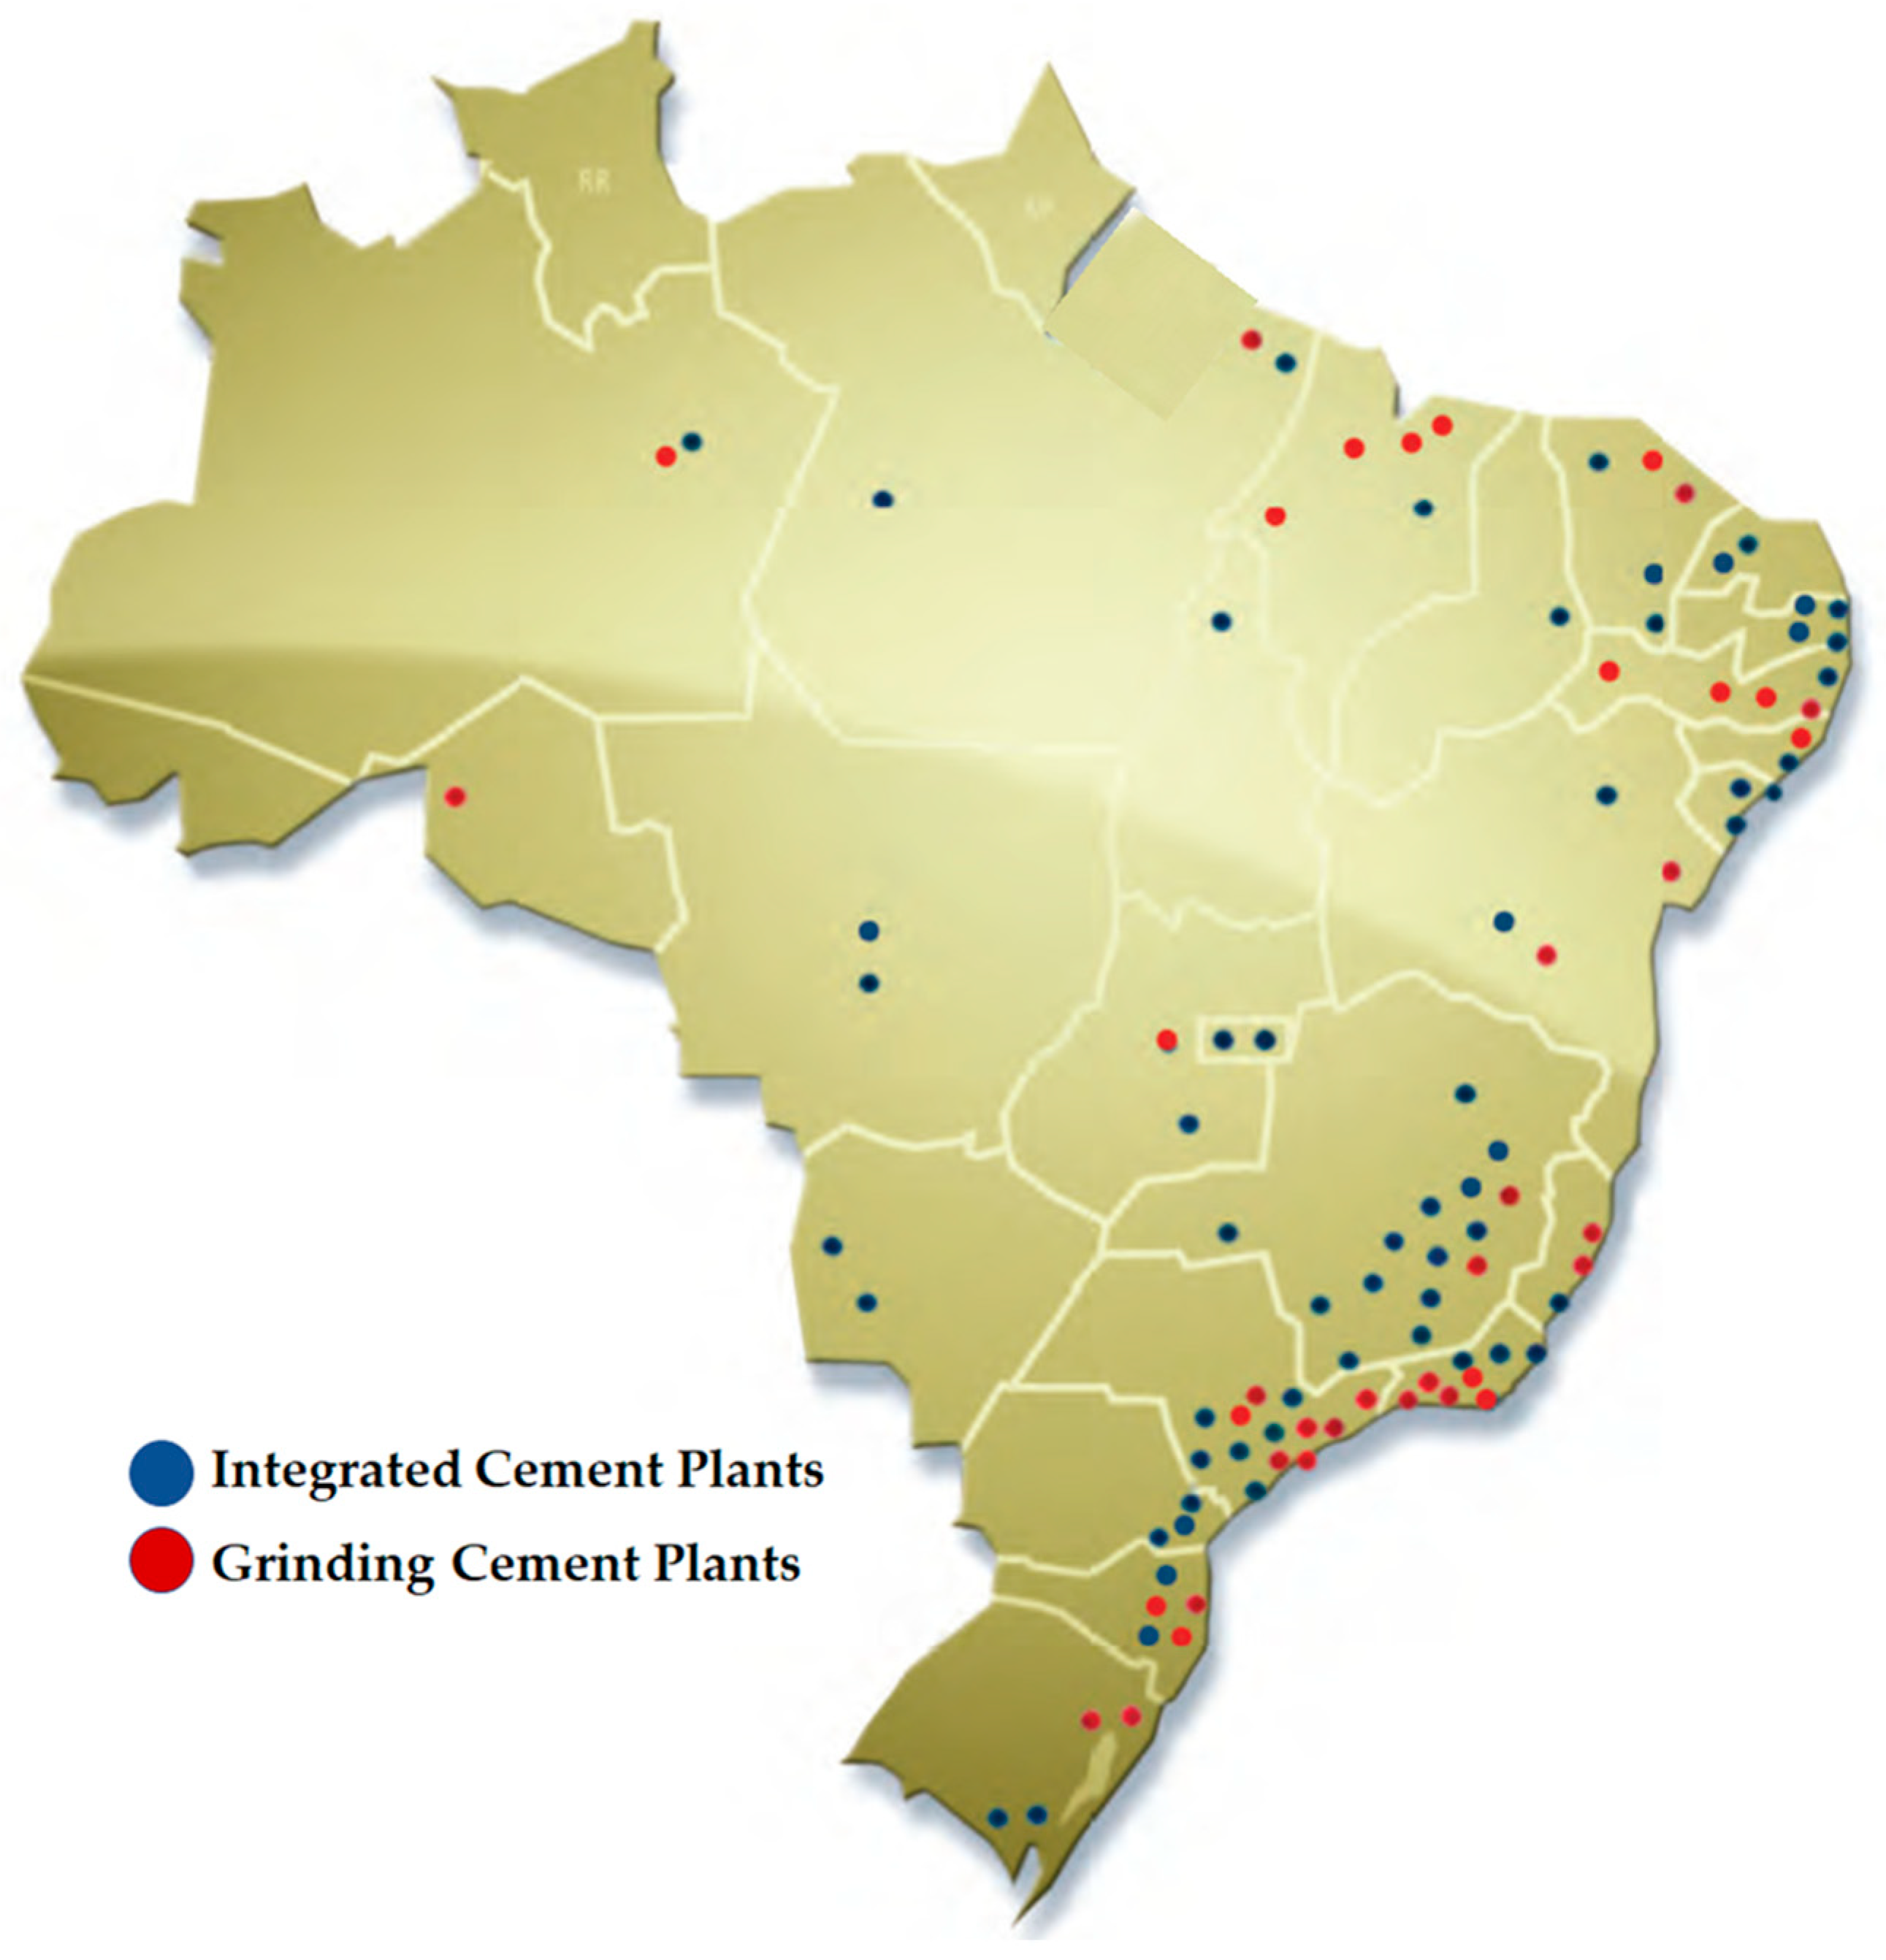
2. The Brazilian Cement Sector
2.1. The Brazilian Cement Industry’s Potential for Reducing Carbon Dioxide Emissions by 2050
2.2. The Brazilian Cement Sector Roadmap
3. Method to Estimate the Carbon Dioxide Removals Due to Carbonation
- Brazilian Portland cement clinker production
- Calcination emissions from Brazilian cement clinker production
- Imported cement/clinker (as ktonnes of clinker)
- Exported cement/clinker (as ktonnes of clinker)
- Percentage of Brazilian clinker used in mortar for rendering
4. Results and Discussion
5. Conclusions
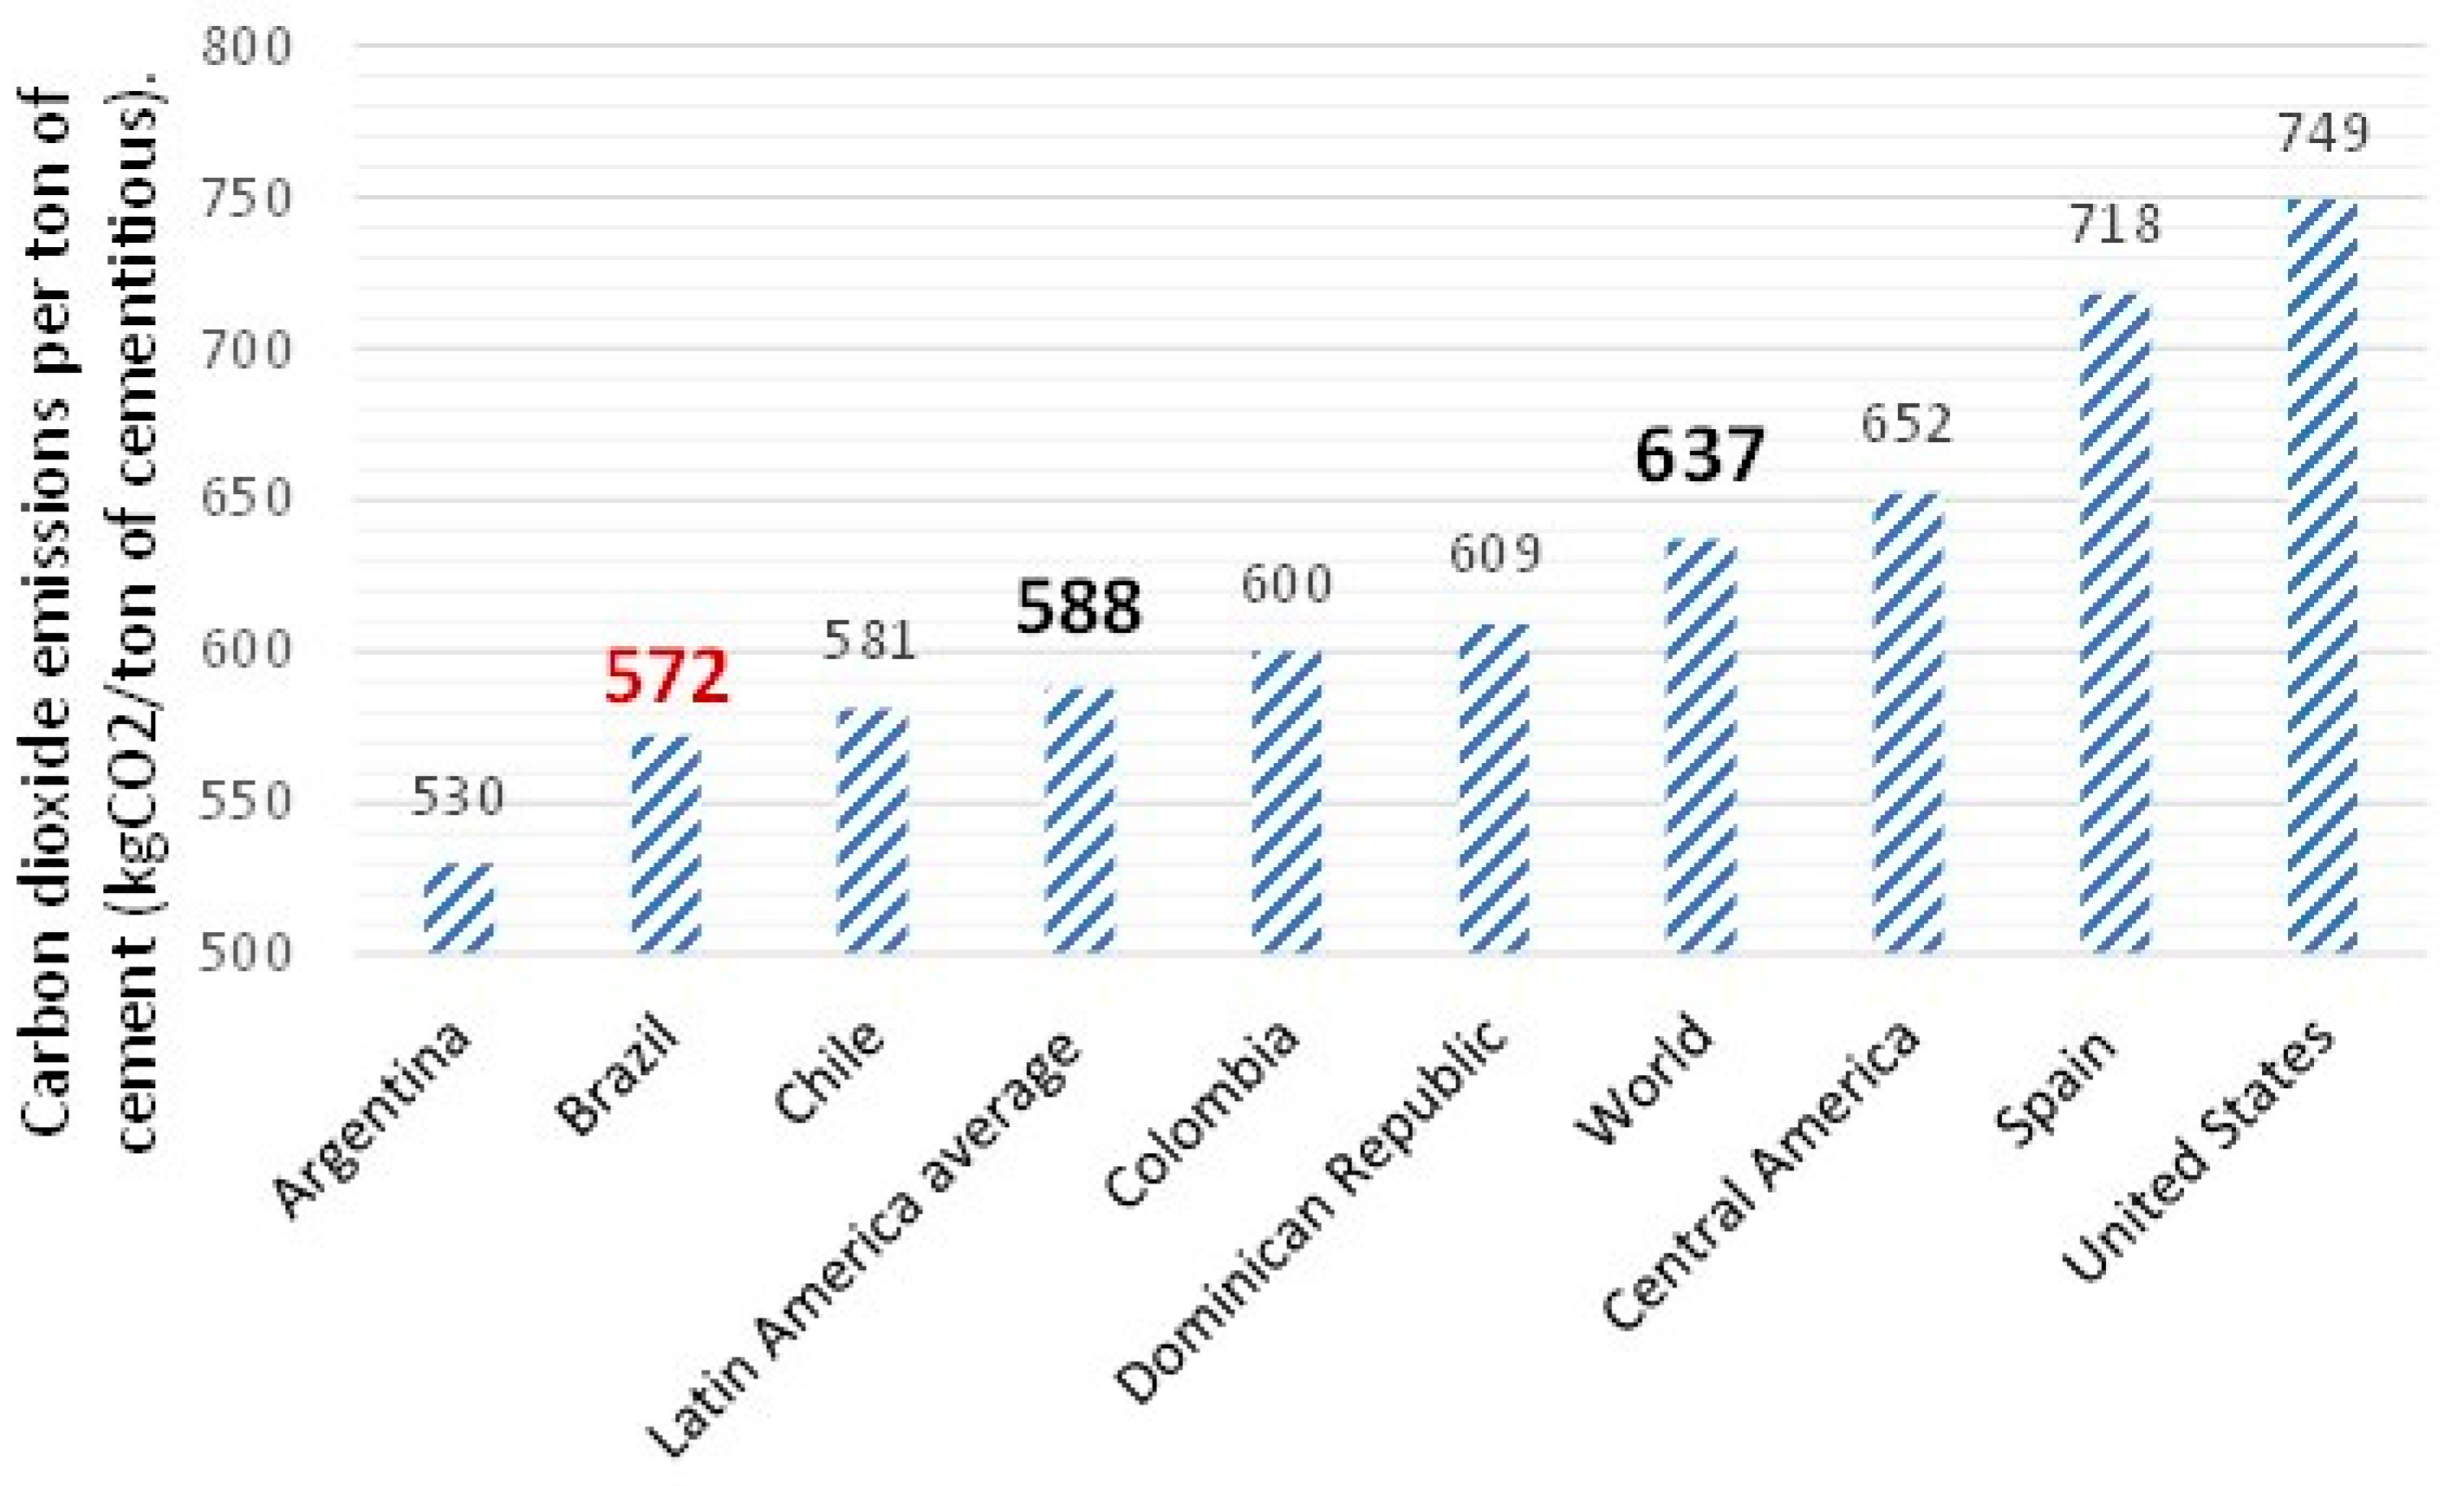
- Brazil is the seventh worldwide cement producer and is one with the lowest kgCO2/ton of cement ratio as a consequence of the low electrical impact (1%) in the cement production, low clinker factor (0.67 in 2014 and 0.59, data estimated for 2030), and alternative fuels usage (15% in 2014 and 35%, data estimated for 2030).
- The carbon dioxide uptake by mortar and concrete carbonation for 30 years (from 1990 to 2019) is about 140 million tons. Within this twenty-year period about 483 million tons have been released due to the calcination process.
- Based on this data, the carbon dioxide uptake during the service-life, end-of-life and secondary usage stages can be given as follows:
- 125 million tons during the service-life;
- 5 million tons during secondary use; and
- 10 million tons during end-of-life.
- These values correspond to the 20%, 2%, and 1% of the carbon dioxide emitted by the calcination, respectively.
Author Contributions
Funding
Institutional Review Board Statement
Informed Consent Statement
Data Availability Statement
Acknowledgments
Conflicts of Interest
References
- The Intergovernmental Panel on Climate Change. 2006 IPCC Guidelines for National Greenhouse Gas Inventories; IPCC Guidelines Volume 3. Chapter 3 Industrial Processes. IPCC Good Practice Guidance and Uncertainty Management in National Greenhouse Gas Inventories 3.1; Eggleston, H.S., Buendia, L., Miwa, K., Ngara, T., Tanabe, K., Eds.; IGES: Fukuoka, Japan. Available online: https://www.ipcc-nggip.iges.or.jp/public/gp/english/3_Industry.pdf (accessed on 15 February 2023).
- IPCC. Climate Change 2021: The Physical Science Basis. Contribution of Working Group I to the Sixth Assessment Report of the Intergovernmental Panel on Climate Change; Masson-Delmotte, V., Zhai, P., Pirani, A., Connors, S.L., Péan, C., Berger, S., Caud, N., Chen, Y., Goldfarb, L., Gomis, M.I., et al., Eds.; Cambridge University Press: Cambridge, UK; New York, NY, USA, 2021; p. 2391. Available online: https://report.ipcc.ch/ar6/wg1/IPCC_AR6_WGI_FullReport.pdf (accessed on 15 February 2023). [CrossRef]
- Intergovernmental Panel on Climate Change, 2023 (IPCC). AR6 Synthesis Report Climate Change 2023. Available online: https://www.ipcc.ch/assessment-report/ar6/ (accessed on 15 February 2023).
- Dinga, C.D.; Wen, Z. China’s green deal: Can China’s cement industry achieve carbon neutral emissions by 2060? Renew. Sustain. Energy Rev. 2022, 155, 111931. [Google Scholar] [CrossRef]
- Sanjuán, M.Á.; Andrade, C.; Mora, P.; Zaragoza, A. Carbon Dioxide Uptake by Mortars and Concretes Made with Portuguese Cements. Appl. Sci. 2020, 10, 646. [Google Scholar] [CrossRef]
- Zhang, G.-Y.; Wang, X.-Y. Carbon Peaking and Carbon Neutrality in the Cement-Based Materials. Materials 2023, 16, 4705. [Google Scholar] [CrossRef] [PubMed]
- Petroche, D.M.; Ramirez, A.D. The Environmental Profile of Clinker, Cement, and Concrete: A Life Cycle Perspective Study Based on Ecuadorian Data. Buildings 2022, 12, 311. [Google Scholar] [CrossRef]
- Lau, H.C. Decarbonization roadmaps for ASEAN and their implications. Energy Rep. 2022, 8, 6000–6022. [Google Scholar] [CrossRef]
- Karlsson, I.; Rootzén, J.; Toktarova, A.; Odenberger, M.; Johnsson, F.; Göransson, L. Roadmap for Decarbonization of the Building and Construction Industry—A Supply Chain Analysis Including Primary Production of Steel and Cement. Energies 2020, 13, 4136. [Google Scholar] [CrossRef]
- Karlsson, I.; Rootzén, J.; Johnsson, F.; Erlandsson, M. Achieving net-zero carbon emissions in construction supply chains—A multidimensional analysis of residential building systems. Dev. Built Environ. 2021, 8, 100059. [Google Scholar] [CrossRef]
- Kazemian, M.; Shafei, B. Carbon sequestration and storage in concrete: A state-of-the-art review of compositions, methods, and developments. J. CO2 Util. 2023, 70, 102443. [Google Scholar] [CrossRef]
- European Commission. HORIZON 2020. Work Programme 2014–2015. Annex G. Technology Readiness Levels (TRL). 2014. Available online: https://ec.europa.eu/research/participants/data/ref/h2020/wp/2014_2015/annexes/h2020-wp1415-annex-g-trl_en.pdf (accessed on 10 July 2023).
- Monteiro, J.; Roussanaly, S. CCUS scenarios for the cement industry: Is CO2 utilization feasible? J. CO2 Util. 2022, 61, 102015. [Google Scholar] [CrossRef]
- Sereng, M.; Djerbi, A.; Metalssi, O.O.; Dangla, P.; Torrenti, J.-M. Improvement of Recycled Aggregates Properties by Means of CO2 Uptake. Appl. Sci. 2021, 11, 6571. [Google Scholar] [CrossRef]
- Bretti, G.; Ceseri, M. Climate Change Effects on Carbonation Process: A Scenario-Based Study. Heritage 2023, 6, 236–257. [Google Scholar] [CrossRef]
- Guo, B.; Chu, G.; Yu, R.; Wang, Y.; Yu, Q.; Niu, D. Effects of sufficient carbonation on the strength and microstructure of CO2-cured concrete. J. Build. Eng. 2023, 76, 107311. [Google Scholar] [CrossRef]
- Silva, A.; Nogueira, R.; Bogas, A.; Wawrzyńczak, D.; Ściubidło, A.; Majchrzak-Kucęba, I. Parametric Study towards Optimization of a Short Duration Carbonation Process of Recycled Cement Paste. Materials 2022, 15, 6513. [Google Scholar] [CrossRef] [PubMed]
- Hu, L.; Chen, Z.; Hu, J. Carbon Sequestration, Mechanical Properties and Carbonation Kinetics of PP-Fiber-Reinforced Cement-Based Composites with CO2-Curing Treatment. Coatings 2022, 12, 1339. [Google Scholar] [CrossRef]
- Xuan, M.-Y.; Lin, R.-S.; Min, T.-B.; Wang, X.-Y. Carbonation treatment of eggshell powder concrete for performance enhancement. Constr. Build. Mater. 2023, 377, 130814. [Google Scholar] [CrossRef]
- Wang, Y.-S.; Wang, X.-Y. Multi-characterizations of the hydration, microstructure, and mechanical properties of a biochar–limestone calcined clay cement (LC3) mixture. J. Mater. Res. Technol. 2023, 24, 3691–3703. [Google Scholar] [CrossRef]
- Alimi, W.O.; Adekunle, S.K.; Ahmad, S.; Amao, A.O. Carbon dioxide sequestration characteristics of concrete mixtures incorporating high-volume cement kiln dust. Case Stud. Constr. Mater. 2022, 17, e01414. [Google Scholar] [CrossRef]
- Merino-Lechuga, A.M.; González-Caro, Á.; Fernández-Ledesma, E.; Jiménez, J.R.; Fernández-Rodríguez, J.M.; Suescum-Morales, D. Accelerated Carbonation of Vibro-Compacted Porous Concrete for Eco-Friendly Precast Elements. Materials 2023, 16, 2995. [Google Scholar] [CrossRef]
- AzariJafari, H.; Guo, F.; Gregory, J.; Kirchain, R. Carbon uptake of concrete in the US pavement network. Resour. Conserv. Recycl. 2021, 167, 105397. [Google Scholar] [CrossRef]
- Huovila, A.; Siikavirta, H.; Antuña-Rozado, C.; Rökman, J.; Tuominen, P.; Paiho, S.; Hedman, Å.; Ylén, P. Carbon-neutral cities: Critical review of theory and practice. J. Clean. Prod. 2022, 341, 130912. [Google Scholar] [CrossRef]
- Sanjuán, M.Á.; Morales, Á.; Zaragoza, A. Effect of Precast Concrete Pavement Albedo on the Climate Change Mitigation in Spain. Sustainability 2021, 13, 11448. [Google Scholar] [CrossRef]
- Sanjuán, M.Á.; Morales, Á.; Zaragoza, A. Precast Concrete Pavements of High Albedo to Achieve the Net “Zero-Emissions” Commitments. Appl. Sci. 2022, 12, 1955. [Google Scholar] [CrossRef]
- Younsi, A. Long-term carbon dioxide sequestration by concretes with supplementary cementitious materials under indoor and outdoor exposure: Assessment as per a standardized model. J. Build. Eng. 2022, 51, 104306. [Google Scholar] [CrossRef]
- EN 16757:2022; Sustainability of Construction Works—Environmental Product Declarations—Product Category Rules for Concrete and Concrete Elements. European Committee for Standardization (CEN): Brussels, Belgium, 2022.
- Younsi, A.; Turcry, P.; Aït-Mokhtar, A. Quantification of CO2 uptake of concretes with mineral additions after 10-year natural carbonation. J. Clean. Prod. 2022, 349, 131362. [Google Scholar] [CrossRef]
- Witkowski, H.; Koniorczyk, M. The influence of pozzolanic additives on the carbonation rate and Life Cycle Inventory of concrete. Constr. Build. Mater. 2020, 254, 119301. [Google Scholar] [CrossRef]
- Wang, X.-Y.; Lee, H.-S. Effect of global warming on the proportional design of low CO2 slag-blended concrete. Constr. Build. Mater. 2019, 225, 1140–1151. [Google Scholar] [CrossRef]
- Wang, X.-Y. Simulation for optimal mixture design of low-CO2 high-volume fly ash concrete considering climate change and CO2 uptake. Cem. Concr. Compos. 2019, 104, 103408. [Google Scholar] [CrossRef]
- The National Cement Industry Union (SNIC). Available online: http://snic.org.br/fabricas-localizacoes.php (accessed on 15 February 2023).
- ICR Newsroom. Brazilian Cement Consumption down 3% in 2022. 2023. Available online: https://www.cemnet.com/News/story/174147/brazilian-cement-consumption-down-3-in-2022.html (accessed on 15 February 2023).
- Sanjuán, M.A.; Argiz, C.; Mora, P.; Zaragoza, A. Carbon Dioxide Uptake in the Roadmap 2050 of the Spanish Cement Industry. Energies 2020, 13, 3452. Available online: https://doi.org/10.3390/en13133452 (accessed on 15 February 2023). [CrossRef]
- SNIC. Cement Technology Roadmap—Carbon Emissions Reduction Potential in the Brazilian Cement Industry by 2050/Coordinated by Gonzalo Visedo and Marcelo Pecchio; SNIC: Rio de Janeiro, Brazil, 2019; p. 64. Available online: http://snic.org.br/assets/pdf/roadmap/cement-technology-roadmap-brazil.pdf (accessed on 15 February 2023).
- IPCC. 2006 IPCC Guidelines for National Greenhouse Gas Inventories, Prepared by the National Greenhouse Gas Inventories Programme; Eggleston, H.S., Buendia, L., Miwa, K., Ngara, T., Tanabe, K., Eds.; IPCC National Greenhouse Gas Inventories Programme, Technical Support Unit; IGES: Fukuoka, Japan, 2006; Available online: https://www.ipcc.ch/report/2006-ipcc-guidelines-for-national-greenhouse-gas-inventories/ (accessed on 15 February 2023).
- Sanjuán, M.Á.; Andrade, C.; Mora, P.; Zaragoza, A. Carbon Dioxide Uptake by Cement-Based Materials: A Spanish Case Study. Appl. Sci. 2020, 10, 339. [Google Scholar] [CrossRef]
- Stripple, H.; Ljungkrantz, C.; Gustafsson, T. CO2 Uptake in Cement-Containing Products. In Background and Calculation Models for IPCC Implementation, 2nd ed.; Report Number: B 2309; IVL Swedish Environmental Research Institute: Stockholm, Sweden, 2021; pp. 1–77. Available online: https://www.ivl.se/download/18.34244ba71728fcb3f3f8f9/1622457897161/B2309.pdf (accessed on 15 February 2023).
- Leemann, A.; Nygaard, P.; Kaufmann, J.; Loser, R. Relation between carbonation resistance, mix design and exposure of mortar and concrete. Cem. Concr. Compos. 2015, 62, 33–43. [Google Scholar] [CrossRef]
- EN 206:2013+A1:2016; Concrete—Specification, Performance, Production and Conformity. CEN: Brussels, Belgium, 2016.
- EN 1992-1-1; Eurocode 2: Design of Concrete Structures—Part 1-1: General Rules and Rules for Buildings. European Committee for Standardization (CEN): Brussels, Belgium, 2004.
- Schießl, P.; Bamforth, P.; Baroghel-Bouny, V.; Corley, G.; Faber, M.; Forbes, J.; Gehlen, C.; Helene, P.; Helland, S.; Ishida, T.; et al. Model Code for Service Life Design, Fib Bulletin No. 34, 1st ed.; International Federation for Structural Concrete (FIB): Lausanne, Switzerland, 2006; p. 116. Available online: https://www.fib-international.org/publications/fib-bulletins/model-code-for-service-life-design-pdf-detail.html (accessed on 28 July 2023).
- ASTM C1329/C1329M-23; Standard Specification for Mortar Cement. ASTM International: West Conshohocken, PA, USA, 2023.
- EN 413-1:2011; Masonry Cement—Part 1: Composition, Specifications and Conformity Criteria. European Committee for Standardization (CEN): Brussels, Belgium, 2011.
- EN 197-1:2011; Cement—Part 1: Composition, Specifications and Conformity Criteria for Common Cements. European Committee for Standardization (CEN): Brussels, Belgium, 2011.
- Singh, N.; Sharma, B.; Rathee, M. Carbonation resistance of blended mortars and industrial by-products: A brief review. Clean. Mater. 2022, 4, 100058. [Google Scholar] [CrossRef]
- Gonen, T.; Yazicioglu, S. The influence of compaction pores on sorptivity and carbonation of concrete. Constr. Build. Mater. 2007, 21, 1040–1045. [Google Scholar] [CrossRef]
- Kim, G. New Advances in Cement and Concrete Research. Materials 2023, 16, 4162. [Google Scholar] [CrossRef]
- AL-Kharabsheh, B.N.; Arbili, M.M.; Majdi, A.; Ahmad, J.; Deifalla, A.F.; Hakamy, A. A Review on Strength and Durability Properties of Wooden Ash Based Concrete. Materials 2022, 15, 7282. [Google Scholar] [CrossRef]
- Isametova, M.E.; Nussipali, R.; Martyushev, N.V.; Malozyomov, B.V.; Efremenkov, E.A.; Isametov, A. Mathematical Modeling of the Reliability of Polymer Composite Materials. Mathematics 2022, 10, 3978. [Google Scholar] [CrossRef]
- Yelemessov, K.; Sabirova, L.B.; Martyushev, N.V.; Malozyomov, B.V.; Bakhmagambetova, G.B.; Atanova, O.V. Modeling and Model Verification of the Stress-Strain State of Reinforced Polymer Concrete. Materials 2023, 16, 3494. [Google Scholar] [CrossRef]
- Gaspes, E.; Landauer, S.; García, A.B.; Pauels, N. Towards Resource Efficiency and Decarbonising Building Materials in Argentina, 1st ed.; Concrete and Cement Industry Sector: Autonomous City of Buenos Aires, Argentina, 2022; p. 87. Available online: https://www.giz.de/en/downloads/giz2022-en-argentina-resource-efficiency.pdf (accessed on 8 September 2023).
- Carbon Pricing. Available online: https://ourworldindata.org/carbon-pricing (accessed on 15 February 2023).
- Wang, X.-Y. CO2 uptake of slag-blended concrete. Environ. Sci. Pollut. Res. 2021, 28, 48890–48904. [Google Scholar] [CrossRef] [PubMed]


| Company | Cement Plants | ||
|---|---|---|---|
| APODI | Pecém—CE | Quixeré—CE | |
| BRENNAND | Pitimbu—PB | Sete Lagoas—MG | |
| CARMOCAL | Pains—MG | ||
| CIMENTO BRAVO | São Luís—MA | ||
| CIMENTO FORTE | Cabo de Santo Agostinho—PE | ||
| CIMENTO VERDE DO BRASIL | Açaiândia—MA | ||
| CIMENTO ZUMBI | Marechal Deodoro—AL | ||
| CIMENTOS LIZ | Vespasiano—MG | ||
| CIPLAN | Sobradinho—DF | ||
| CRH * (Buzzi and Grupo Ricardo Brennand) | Arcos—MG | Matozinhos—MG | |
| Cantagalo—RJ | Santa Luzia—MG | ||
| CSN | Arcos—MG | Volta Redonda—RJ | |
| ELIZABETH | Alhandra—PB | ||
| ELO | Currais Novos—RN | ||
| ICIBRA | Bacabeira—MA | ||
| INTERCEMENT ** (Former Camargo Corrêa Cimentos) | Apiaí—SP | Brumado—BA | Cabo de Santo Agostinho—PE |
| Cajati—SP | Campo Formoso—BA | Candiota—RS | |
| Cezarina—GO | Cubatão—SP | Ijaci—MG | |
| Jacareí—SP | João Pessoa—PB | Nova Santa Rita—RS | |
| Pedro Leopoldo—MG | Santana do Paraíso—MG | São Miguel dos Campos—AL | |
| Bodoquena—MS | |||
| ITAMBÉ | Balsa Nova—PR | ||
| JOÃO SANTOS | Barbalha—CE | Capanema—PA | Cachoeiros de Itapemirim—ES |
| Codó—MA | Fronteiras—PI | Goiana—PE | |
| Itaituba—PA | Ituaçu—BA | Manaus—AM | |
| Mossoró—RN | Nossa Senhora do Socorro—SE | ||
| HOLCIM (CSN) *** | Barroso—MG | Caaporã—PB | Candeias—BA |
| Cantagalo—RJ | Cocalzinho de Goiás—GO | Itapeva—SP | |
| Montes Claros—MG | Pedro Leopoldo—MG | Rio de Janeiro—RJ | |
| Santa Luzia—MG | Serra—ES | Sorocaba—SP | |
| MIZU | Baraúna—RN | Manaus—AM | Mogi das Cruzes—SP |
| Pacatuba—SE | Rio de Janeiro—RJ | Vitória—ES | |
| PETRIBÚ | Carnaíba—PE | ||
| POZOSUL | Capivari de Baixo—SC | ||
| SUPREMO SECIL | Adrianopolis—PR | Pomerode—SC | |
| TUPI | Carandaí—MG | Mogi das Cruzes—SP | Volta Redonda—RJ |
| VOTORANTIM CIMENTOS | Cantagalo—RJ | Corumbá—MS | Cubatão—SP |
| Cuiabá—MT | Edealina—GO | Esteio—RS | |
| Imbituba—SC | Itajaí—SC | Itaú de Minas—MG | |
| Laranjeiras—SE | Nobres—MT | Paulista—PE | |
| Pecém—CE | Pinheiro Machado—RS | Porto Velho—RO | |
| Primavera—PA | Ribeirão Grande—SP | Rio Branco do Sul—PR | |
| Salto de Pirapora—SP | Santa Cruz—RJ | São Luis—MA | |
| Sobradinho—DF | Sobral—CE | Vidal Ramos—SC | |
| Votorantim—SP | Xambioá—TO | ||
| Indicator | 2014 | 2030 | 2050 |
|---|---|---|---|
| Clinker factor (clinker/cement ratio) | 0.67 | 0.59 | 0.52 |
| Thermal consumption (GJ/t clinker) | 3.50 | 3.47 | 3.20 |
| Electrical consumption (kWh/t cement) | 113 | 106 | 91 |
| Alternative fuels (% of thermal substitution) | 14.8% | 35% | 55 |
| Global carbon dioxide emissions (Mt CO2/year) | 40 | 42 | 44 |
| Carbon dioxide emissions intensity (kg CO2/t cement) | 564 | 485 | 375 |
Disclaimer/Publisher’s Note: The statements, opinions and data contained in all publications are solely those of the individual author(s) and contributor(s) and not of MDPI and/or the editor(s). MDPI and/or the editor(s) disclaim responsibility for any injury to people or property resulting from any ideas, methods, instructions or products referred to in the content. |
© 2023 by the authors. Licensee MDPI, Basel, Switzerland. This article is an open access article distributed under the terms and conditions of the Creative Commons Attribution (CC BY) license (https://creativecommons.org/licenses/by/4.0/).
Share and Cite
da Silva Rego, J.H.; Sanjuán, M.Á.; Mora, P.; Zaragoza, A.; Visedo, G. Carbon Dioxide Uptake by Brazilian Cement-Based Materials. Appl. Sci. 2023, 13, 10386. https://doi.org/10.3390/app131810386
da Silva Rego JH, Sanjuán MÁ, Mora P, Zaragoza A, Visedo G. Carbon Dioxide Uptake by Brazilian Cement-Based Materials. Applied Sciences. 2023; 13(18):10386. https://doi.org/10.3390/app131810386
Chicago/Turabian Styleda Silva Rego, Joao Henrique, Miguel Ángel Sanjuán, Pedro Mora, Aniceto Zaragoza, and Gonzalo Visedo. 2023. "Carbon Dioxide Uptake by Brazilian Cement-Based Materials" Applied Sciences 13, no. 18: 10386. https://doi.org/10.3390/app131810386