Article

The Influences of Self-Introspection and Credit Evaluation on Self-Organized Flocking

1
Marine Engineering College, Dalian Maritime University, Dalian 116026, China
2
College of Mechanical and Control Engineering, Baicheng Normal University, Baicheng 137000, China
3
State Key Laboratory for Turbulence and Complex Systems, Intelligent Biomimetic Design Lab, College of Engineering, Peking University, Beijing 100871, China
4
College of Mechanical Engineering, Jilin Communications Polytechnic, Changchun 130012, China
5
National Engineering Research Center of Software Engineering, Peking University, Beijing 100871, China
6
Institute of Ocean Research, Peking University, Beijing 100871, China
*
Authors to whom correspondence should be addressed.
Appl. Sci. 2023, 13(18), 10361; https://doi.org/10.3390/app131810361
Submission received: 20 August 2023 / Revised: 13 September 2023 / Accepted: 14 September 2023 / Published: 16 September 2023

Abstract

:
For biological groups, the behaviors of individuals will have an impact on the alignment efficiency of the collective movement. Motivated by Vicsek’s pioneering research on self-organized particles and other related works about flocking behaviors, we propose two mathematical models based on the local information of individuals to include more realistic details in the interaction mechanism between individuals and the rest of the group during the flocking process. The local information of the individual refers to the local consistency, representing the degree of alignment with its neighbors. These two models are the self-introspection model, where the process of orientation adjustment of one individual is ruled by the degree of local consistency with the neighborhood, and the credit evaluation model, where the average orientation of the neighborhoods is weighed using the local consistency of the interacting individuals. Different metrics are calculated to analyze the effects of the model parameters and flocking parameters on groups. Simulation calculations indicate that the two improved models have certain advantages in terms of alignment efficiency for the group. Finally, the optimal model parameters are determined, and the effects of random noise on groups with a single behavior and mixed behaviors are analyzed. The results confirm that individuals with mixed behaviors still possess robustness against noise. This research would contribute to the further interdisciplinary cooperation that involves biology, ethology, and multi-agent complex systems.

1. Introduction

Collective behavior occurs throughout real biological systems, from cells [1] and bacteria [2] to fish [3], birds [4], mammals [5], and even humans [6]. The amazement of the collective motion is that the simple interactions between neighbors result in a variety of collective behaviors with coordinated patterns. Self-organized flocking is one of the most common collective behaviors of animals, which helps animals to escape from unsuitable climates [7], avoid predators [8], and reduce the hesitation time of individuals so as to win more foraging opportunities and rest time [9]. The collective motion of biological entities has garnered attention from experts across various fields, underscoring the paramount importance of studying individual behaviors.
Over the years, the research on collective behavior in nature mainly focus on two aspects: tracking experiments and theoretical modeling. Experts who pay attention to tracking experiments are generally committed to finding or explaining the collective characteristics of specific biological species at the macro level [10,11,12], while the study of local microscopic interactions between individuals is still a great challenge. For the research on the interaction mechanism between individuals and neighbors in a group, theoretical modeling provides an effective way to capture this interactive behavior in detail [13,14]. In particular, there are many similarities between the amazing collective behavior in nature and that in statistical physics, which greatly inspired researchers to describe collective behavior in biology within the conceptual framework of statistical physics [15,16]. From the perspective of statistical physics, theoretical modeling also obtains the global characteristics from the local interaction of individuals.
However, it needs to be pointed out that the interaction between individuals in theoretical modeling does not originate from physical laws but should follow complex biological processes. Most tracking experiments and theoretical modeling in the past believed that the local interaction behaviors between individuals in a group are identical [17,18]. In the well-known Vicsek model proposed in 1995 [17], the system can be seen as a complex network with interactions between individuals [19,20] in which individuals are represented by nodes, and the edges between nodes represent interactions between individuals. The interactions between individuals are assumed to follow an identical simple rule. Although the interaction rule follows such a relatively simple assumption, the Vicsek model is definitely a pioneering work that provides a framework for research on heterogeneous individuals and interaction mechanisms. Over the past several decades, there has been a diverse exploration from the viewpoint of statistical physics on how to accelerate the alignment of particles. Mishel George et al. [18] proposed two improved Vicsek models, namely the overcorrected Vicsek model (OVM) and the gradient-adjusted Vicsek model (GAVM). It has been validated that these improved models have certain advantages in terms of convergence efficiency. Building on this research, Zhao et al. [21] further enriched the model’s content. Zou et al. [22] studied a self-propelled multi-agent system, emphasizing the influence of the visual angle between neighbors and the central individual on collective behavior. Through simulation calculations, they found that optimal parameters exist to achieve consistency in the self-driven system. Strategies for adaptively adjusting speed have also attracted widespread attention. Zhang [23] and Zhao [24] improved the original model to be variable in speed and, compared with the original model, concluded that the convergence time has a certain advantage. Previous research has mostly focused on improving the system’s convergence time, often overlooking the role of the mathematical model itself in describing the behavior of biological entities. Actually, in recent years, it has become widely acknowledged that most biological individuals in a group may have different cognitive abilities when interacting with neighbors [25]. Individual heterogeneity represented by nodes with different properties can affect collective behavior, and previous studies have shown that collective systems with heterogeneous individuals can improve the performance of collective motion [26,27,28]. Similarly, from the perspective of complex networks [29,30], social interaction represented by edges between nodes is also heterogeneous; that is, there are differences in interaction mechanisms [31], which also conform to real biological behavior. Some research on theoretical modeling considers that the interaction behavior between individuals and neighbors should be variable with time [32]. Therefore, the social networks of real biological groups should be weighted, which is reflected in the different levels of attention of individuals to their neighbors [33,34], thus leading to different interaction strengths. Such an interaction mode has been proven to have an important impact on collective movement, and it is even closely related to effective information transmission between natural creatures [35,36].
From the above considerations and inspiration, more detailed models are still needed to depict the interaction behaviors of real biological individuals. To this end, in this paper, we propose a framework consisting of two novel mathematical models to study the flocking behavior under different interaction mechanisms. Our two proposed models, the self-introspection model (SIM) and the credit evaluation model (CEM), focus on two different interaction mechanisms: self-introspection and credit evaluation, respectively.
The self-introspection mechanism is motivated by the fact that some biological individuals can recognize the difference in orientations between themselves and neighbors within the scope of perception due to empirical learning [34,37] and thus make an appropriate adjustment based on their own states. In our first model, the SIM, self-introspection is reflected in the orientation adjustment of the individual. If the local alignment perceived by individuals is relatively poor, then the adjustment of an individual orientation should be more significant. As the group gradually tends to be highly aligned, the smaller adjustment of an individual orientation is enough to achieve group stability. On the other hand, the second mechanism we focused on, the credit evaluation mechanism, also comes from the observations of biological groups in nature. As the literature reveals, individuals are capable of evaluating the reliability or credibility of their neighbors through long-term group life and experience [38]. In some scenarios, some individuals’ orientations maybe not be beneficial to achieving orientation consistency in groups. Therefore, the individual’s evaluation of neighbors needs to be weighted according to their credibility, and the orientations of the neighbors with high credibility should be more valuable [39]. In our second model, the CEM, credit evaluation refers to the individual’s evaluation of the credibility of his or her neighbor’s orientation, where credibility characterizes the alignment between the neighbor and his or her neighbors.
In both models, a common and key parameter is the alignment degree between individuals and their neighbors, which we call local consistency. Local consistency is one of the state attributes of individuals, and our proposed models, the SIM and CEM, are able to describe well the two interaction mechanisms of self-introspection and credit evaluation, respectively. We provide a detailed analysis of the two proposed models and determine the optimal parameters through numerical simulations. It is proven that both the group with the SIM and the group with the CEM achieve global consistency of the orientations more quickly than the group with the well-known Vicsek model (VM) and also have better performance against uncertain noise. Furthermore, mixed groups with these two different interaction mechanisms show better performance than that with a single behavior represented by the SIM in achieving the consistency of collective orientation. This is consistent with a common conclusion in nature, which is that behavioral differences between individuals play a fundamental role in promoting the movement and function of animal groups [40].
The rest of this paper is organized as follows. In Section 2, after introducing the well-known Vicsek model, we propose two novel mathematical models corresponding to two interaction mechanisms based on local consistency. Then, Section 3 carries out simulation calculation and analysis of the flocking, while Section 4 concludes this paper.

2. Models

In this section, we first briefly review the original Vicsek model. Then, the concept of local consistency is introduced, and two mathematical models, the SIM and CEM, which correspond to two interaction mechanisms are proposed.

2.1. Vicsek Model (VM)

The original Vicsek model [17] is a multi-particle swarm model, where N particles are initially distributed randomly within an L × L square with a periodic boundary. All particles have the same magnitude of velocity, and for every particle, its orientation is determined by the average orientation of all the particles in its neighborhood, which is defined by a circle with a radius r around this particle. Thus, the position of the ith particle x i is updated according to
x i t + Δ t = x i t + Δ t · v i t , i = 1 , 2 , , N ,
where Δ t > 0 represents the time step increment and  v i = v 0 cos θ i , sin θ i T is the velocity of the ith particle at time t. It has a constant speed v 0 > 0 and an orientation θ i ( t ) , which is updated according to the following rule:
θ i t + Δ t = arctan j D i ( t ) v j sin ( θ j ( t ) ) j D i ( t ) v j cos ( θ j ( t ) ) + Δ θ i ,
where D i ( t ) = N i ( t ) + { i } and  N i ( t ) represents the set of neighbors of the ith particle at time t; that is, D i ( t ) refers to the set of i’s neighbors together with the ith particle itself. Δ θ i is the noise randomly distributed in the interval [ η / 2 , η / 2 ] , whose amplitude is determined by η > 0 . In particular, in Equation (2), if  η = 0 , then the system is regarded as noiseless.
In the original Vicsek model, global consistency is used to measure the alignment degree of all particles [17]. The specific expression can be expressed as
ϕ = i = 1 N v i i = 1 N v i , 0 ϕ 1 .
It can be seen from Equation (3) that if all the individuals are moving in the same orientation, then ϕ goes to one, and if the orientations of all the individuals are randomly distributed, like at the beginning, then ϕ tends toward zero. In ref. [17], Vicsek et al., concluded that, through the rule in Equation (2), all the individuals driven by Equation (1) will move in the same orientation (i.e., ϕ 1 ) after a period of time under the condition of high density (quantity divided by area) and insignificant noise. In other words, in the original Vicsek model, the consistency of orientation is achieved through the simple rule of average orientation.

2.2. Two Models Based on Local Consistency

Based on the original Vicsek model and the inspiration of biological behavior, we introduce two interaction mechanisms among individuals, according to which we propose two mathematical models to describe the individuals’ behaviors in flocking.

2.2.1. Interaction Mechanisms under Local Consistency

Generally, individuals in a group cannot observe the global situation. Therefore, individuals need to rely on perceiving surrounding environments to make decisions that suit the orientation of the group. The Vicsek model skillfully describes this process, which can achieve group alignment only through a simple interaction mechanism between individuals. Each individual tries to achieve alignment with the neighbors via Equation (2), and finally, global consistency is achieved; in other words, this is a transition process from local consistency to global consistency. Therefore, the achievement of local consistency is the premise for the group to achieve global consistency. Considering this, we define a specific metric of local consistency as
ϕ i t = j D i t v j j D i t v j , i = 1 , 2 , , N .
It is clear that ϕ i ( t ) indicates the consistency degree of the ith individual with all the individuals in its neighborhood within a radius r. Obviously, this value is between 0 and 1 ( 0 ϕ i ( t ) 1 ).
In fact, local consistency will also have an impact on the individual’s update rule. Biologists have confirmed that local consistency will directly affect the information transmitted between individuals and the synergistic benefits [41]. Local consistency can not only be used to measure the differences between individuals and their neighbors for making decisions but can also be regarded as a measure of credibility to evaluate neighbors. In order to investigate the roles of local consistency in the interaction mechanisms between individuals and then analyze how the interaction mechanisms affect the flocking behaviors, we introduce two interaction mechanisms with local consistency as the key factor, which are self-introspection and credit evaluation.
The first type is self-introspection, in which the individual constantly measures the difference in orientation between him or herself and the surrounding neighbors. The difference is not only used to generate the expected orientation but also as a key factor to decide how much effort the individual should take. Such differences are accurately depicted by local consistency in our work. The significance of the self-introspection mechanism allows the individual to adjust his or her orientation according to the local environment instead of blindly following the average rule. Specifically, under the self-introspection mechanism, when the consistency between the individual and its neighbors is high, the individual just makes smaller changes compared with the average orientation to make the group more stable, whereas if the consistency is poor, then the individual intends to make larger changes to obtain the best orientation in the sense of speeding up the progress of group alignment.
While another type is based on credit evaluation, where the individual evaluates his or her neighbors and then decides how much he or she can believe them, Giorgio Parisi et al. [42,43,44] conducted extensive research on the impact of predators on collective behavior, encompassing both quantitative and qualitative descriptions of the formation of wave systems within flocks of birds. Their work also emphasizes that the behavior of a group is based on individual models, even though studying individual behavior can be both challenging and intricate. While the cognitive capabilities of an individual were understood well, the evaluative abilities were intricate. Collective behavior is the result of interactions between individuals, and such interactions may include mimicking the forward tendency of neighbors and gauging the distance with neighbors to avoid collisions. By the same token, the evaluative capability possessed by an individual can also be understood as the heterogeneity in the interaction between the individual and its neighbors (i.e., the sensitivity to changes in the neighbor’s direction and speed) [45]. For instance, the capability for credit evaluation can also be perceived as the individual being more sensitive to neighbors with better alignment and being more inclined to mimic their speed tendencies. As such, this behavior is more conducive to aligning the group’s direction. According to different measurements, individuals evaluate their neighbors in various ways. For example, biological individuals are generally more willing to imitate the behaviors of their closer neighbors, which is a way to evaluate neighbors based on distance. Aside from that, biologists have found that individuals in a swarm have varying strengths of interaction with their neighbors [46]. In animal groups, some individuals are more skillful and talented, and thus others prefer to believe in and imitate them. In the scenario considered in this work, where individuals in a flock want to keep the same orientation, it is natural to evaluate the credibility of an individual by its local consistency; that is, the local consistency of an individual is an effective index for showing the individual’s credit. Since local consistency reflects the degree of alignment between an individual and its neighbors, the better the local consistency of an individual, the more credible and valuable the orientation of this individual, whereas if the local consistency of an individual is poor, then the orientation of the individual is not worth referring to for the one who wants to be aligned with all other individuals. This kind of credit evaluation interaction mechanism encourages individuals to accurately identify the information of their neighbors and thus to try to follow the orientation that may be most correct.

2.2.2. Two Models

To fully explore the roles of local consistency in the above two interaction mechanisms, we propose two novel models, the self-introspection model (SIM) and credit evaluation model (CEM), which endow two interaction mechanisms between individuals. These two models both exploit local consistency as the local information for individuals to take action.
(1) 
Self-introspection model (SIM)  
In the original Vicsek model, the orientation of the individual is obtained by averaging the orientations of all neighbors within the interaction radius. Based on this rule, we introduce the key factor of local consistency and consider a weighted model for adjusting the orientation; that is, individuals need to make real-time judgments based on their alignment with their neighbors (i.e., local consistency) to make suitable decisions. Therefore, we propose the self-introspection model (SIM):
θ i t + 1 = θ i t + e 1 2 1 ϕ i α t θ ^ i t θ i t + Δ θ i ,
where θ i ( t ) is the orientation of the ith individual at time t, θ ^ i ( t ) is the average orientation of its neighbors, and  Δ θ i is the noise randomly distributed in the interval [ η / 2 , η / 2 ] , whose amplitude is determined by η > 0 . Additionally, ϕ i ( t ) is the local consistency defined in Equation (4), and α 0 is an adjusted index. It is worth pointing out that if α = 0 , then the self-introspection model (SIM) degenerates into the original Vicsek model, while if α + , then this model is a fixed-weight model, and the characteristics of this type of model can be found in [18]. The specific relationship among these orientations in Equation (6) is shown in Figure 1.
One can conclude from the model that, at the initial stage of flocking where the local consistency is usually poor, individuals must make great efforts to cooperate with the group behavior. But along with the stabilization of the flocking orientation, the changes in individuals’ orientations will be gradually decreased until the group moves forward steadily in the same direction. When the group is gradually stablized, smaller changes in orientations are more conducive to the formation of this steady state, while larger changes, at this time, may drive the system to deviate from the steady state.
On the other hand, when an individual is a neighbor of others, his or her influences will also vary with the local consistency. In this sense, the local consistency of the individual can be regarded as his or her credibility. An example is shown in Figure 2, where j and k are two neighbors of individual i. From the perspective of the degree of alignment within their own neighborhood, namely the local consistency, for individual i, neighbor j is more reliable than neighbor k on the orientation. The SIM is equivalent to the traditional Vicsek model with uniform weights, while the CEM uses varying weights.
(2) 
Credit Evaluation Model (CEM)  
Considering these, we take the local consistency as credibility and integrate it into the original Vicsek model in the form of weight. If the credibility of the neighbor is better, then the weight of the impact on the individual is greater.
Now, we propose the second model, which is the credit evaluation model:
θ i ( t + 1 ) = arctan j D i t ( W i j × sin ( θ j ( t ) ) j D i t ( W i j × cos ( θ j ( t ) ) + Δ θ i ,
where W i j is the weight of the jth individual in the average orientation algorithm of the ith individual and  D i ( t ) the set of i’s neighbors together with the ith individual him or herself. If individual i has no neighbor at time t (i.e.,  D i ( t ) = { i } ), then the orientation does not change. When employing local consistency, W i j is obtained according to the following formula:
W i j = ϕ j β ( t ) j D i ( t ) ϕ j β ( t ) ,
where ϕ j ( t ) is the local consistency of individual j and is given by Equation (4), β 0 is the exponential adjustment index of the local consistency, and  j D i ( t ) ϕ j β ( t ) is used to make a normalization of the weight. In this paper, β < 0 is not taken into consideration because the system in this case is no longer convergent after calculation verification. In addition, β = 0 means each neighbor has the same weight, and at this time, the model in Equation (6) degenerates to the original Vicsek model.
The significance of this model is that if one neighbor of an individual has better local consistency, then this neighbor contributes more to the average orientation of the individual, rather than all of the neighbors contributing identically. As previously mentioned, in biological swarms, interactions between individuals are diverse. The intensity or sensitivity of interactions depends on the behavior of the neighbors. If a neighbor’s behavior is beneficial to the collective behavior (such as alignment), then an individual is more sensitive to such a neighbor. In the CEM model, we represent whether or not this is conducive to group alignment through the local consistency. Overall, using terms related to local consistency to represent the interaction strength between individuals and their neighbors (i.e., the weight of the reference direction for velocity updates) will contribute to efficient alignment of the group. This mechanism is more consistent with natural biological law.
The above two models depict two different interaction mechanisms, which may have different effects on flocking behaviors. To make it clear, we refer to α and β in these two models as model parameters and refer to ( v , r , N , η ) as flocking parameters. Next, the models are analyzed in depth based on different metrics.

3. Simulations and Discussions

To investigate the effects of our proposed two models, the SIM and CEM, on flocking, we carried out numerical simulations without and with noise and compared them with the original Vicsek model. Furthermore, we investigated the performance of the mixed group consisting of two types of individuals using the SIM and CEM.
In each scenario, N individuals moved in the two-dimensional L × L plane with a periodic boundary. Their initial positions and orientations were randomly assigned, and the individuals’ speeds were fixed and identical. In this paper, we characterize the collective behaviors in the simulations using the following four metrics:
The global consistency ϕ, as defined in Equation (3), was used to evaluate the degree of consistency of all individuals’ orientations within the system.
The convergence time T is the time required for the global consistency ϕ of all individuals’ orientations to reach the critical threshold ϕ thre , which was set to judge whether the system converges or not.
Cumulative global consistency S is defined as the accumulation of the area between global consistency and discrete time throughout the flocking process. This metric was used to measure the convergence efficiency of the flocking throughout the process and was calculated as follows:
S ( Γ ) = 1 2 t = 1 T max ( ϕ ( Γ , t 1 ) + ϕ ( Γ , t ) Δ t ,
where T max is the maximum simulation time, Γ = ( α , β , v , r , N , η ) T represents the model parameters ( α , β ) and flocking parameters ( v , r , N , η ) that affect the global consistency ϕ , α and β are derived from Equations (5) and (7), respectively, v and r are the speed and the interaction radius of the individual, respectively, N is the total number of individuals, and  η is the noise of the system. If the flocking motion converges faster during the same time period, then S ( Γ ) will be larger.
The final global consistency ϕ η is the average value in the last period of time of a simulation, and it was used to indicate the final performance of the group with noise, since the group with noise usually could not achieve ϕ 1 like the one without noise. We calculated the final global consistency in t [ 2 3 T max , T max ] as follows:
ϕ η = 3 T max t = 2 3 T max T max ϕ ( t ) .
To obtain the above four metrics, we carried out many simulations with different initial configurations. Specifically, we first generated various initial configurations of N individuals and packed them into a set P. Then, for every simulation, we assigned a set of initial positions and orientations to N individuals and started the simulation. The positions and orientations of the individuals were updated using different models (i.e., the VM, SIM, and CEM), and  ϕ was calculated at every time step. If  ϕ < ϕ thre , then the simulation iteration would continue, and if ϕ ϕ thre , then the simulation was terminated, and the convergence time was recorded as the time of this moment T. If  ϕ < ϕ thre until the maximum simulation step, then the maximum simulation step ( T max ) was taken as the convergence time. The specific algorithm is shown in Algorithm 1.
Algorithm 1:
Step 1. Randomly assign the position (xi, yi) and velocity (vi, θi) for ith individual, i = 1, 2, ⋯, N, with (xi, yi, θi) ∈ P, vi = v is a constant.
Applsci 13 10361 i001
Step 3. Set T = t.

3.1. Noise-Free Calculation and Analysis

Our two proposed mathematical models mainly include two types of parameters, namely model parameters ( α , β ) and flocking parameters ( v , r , N ), which together affect the collective behavior. Using different metrics, the VM, SIM, and CEM without noise are analyzed comprehensively. We first investigate the influence of these parameters on the performance of the proposed models. Then, we explore the optimal model parameters of the two proposed models under different metrics. Finally, we illustrate the different influences of different interaction mechanisms on flocking behaviors by comparing these three models using different metrics.

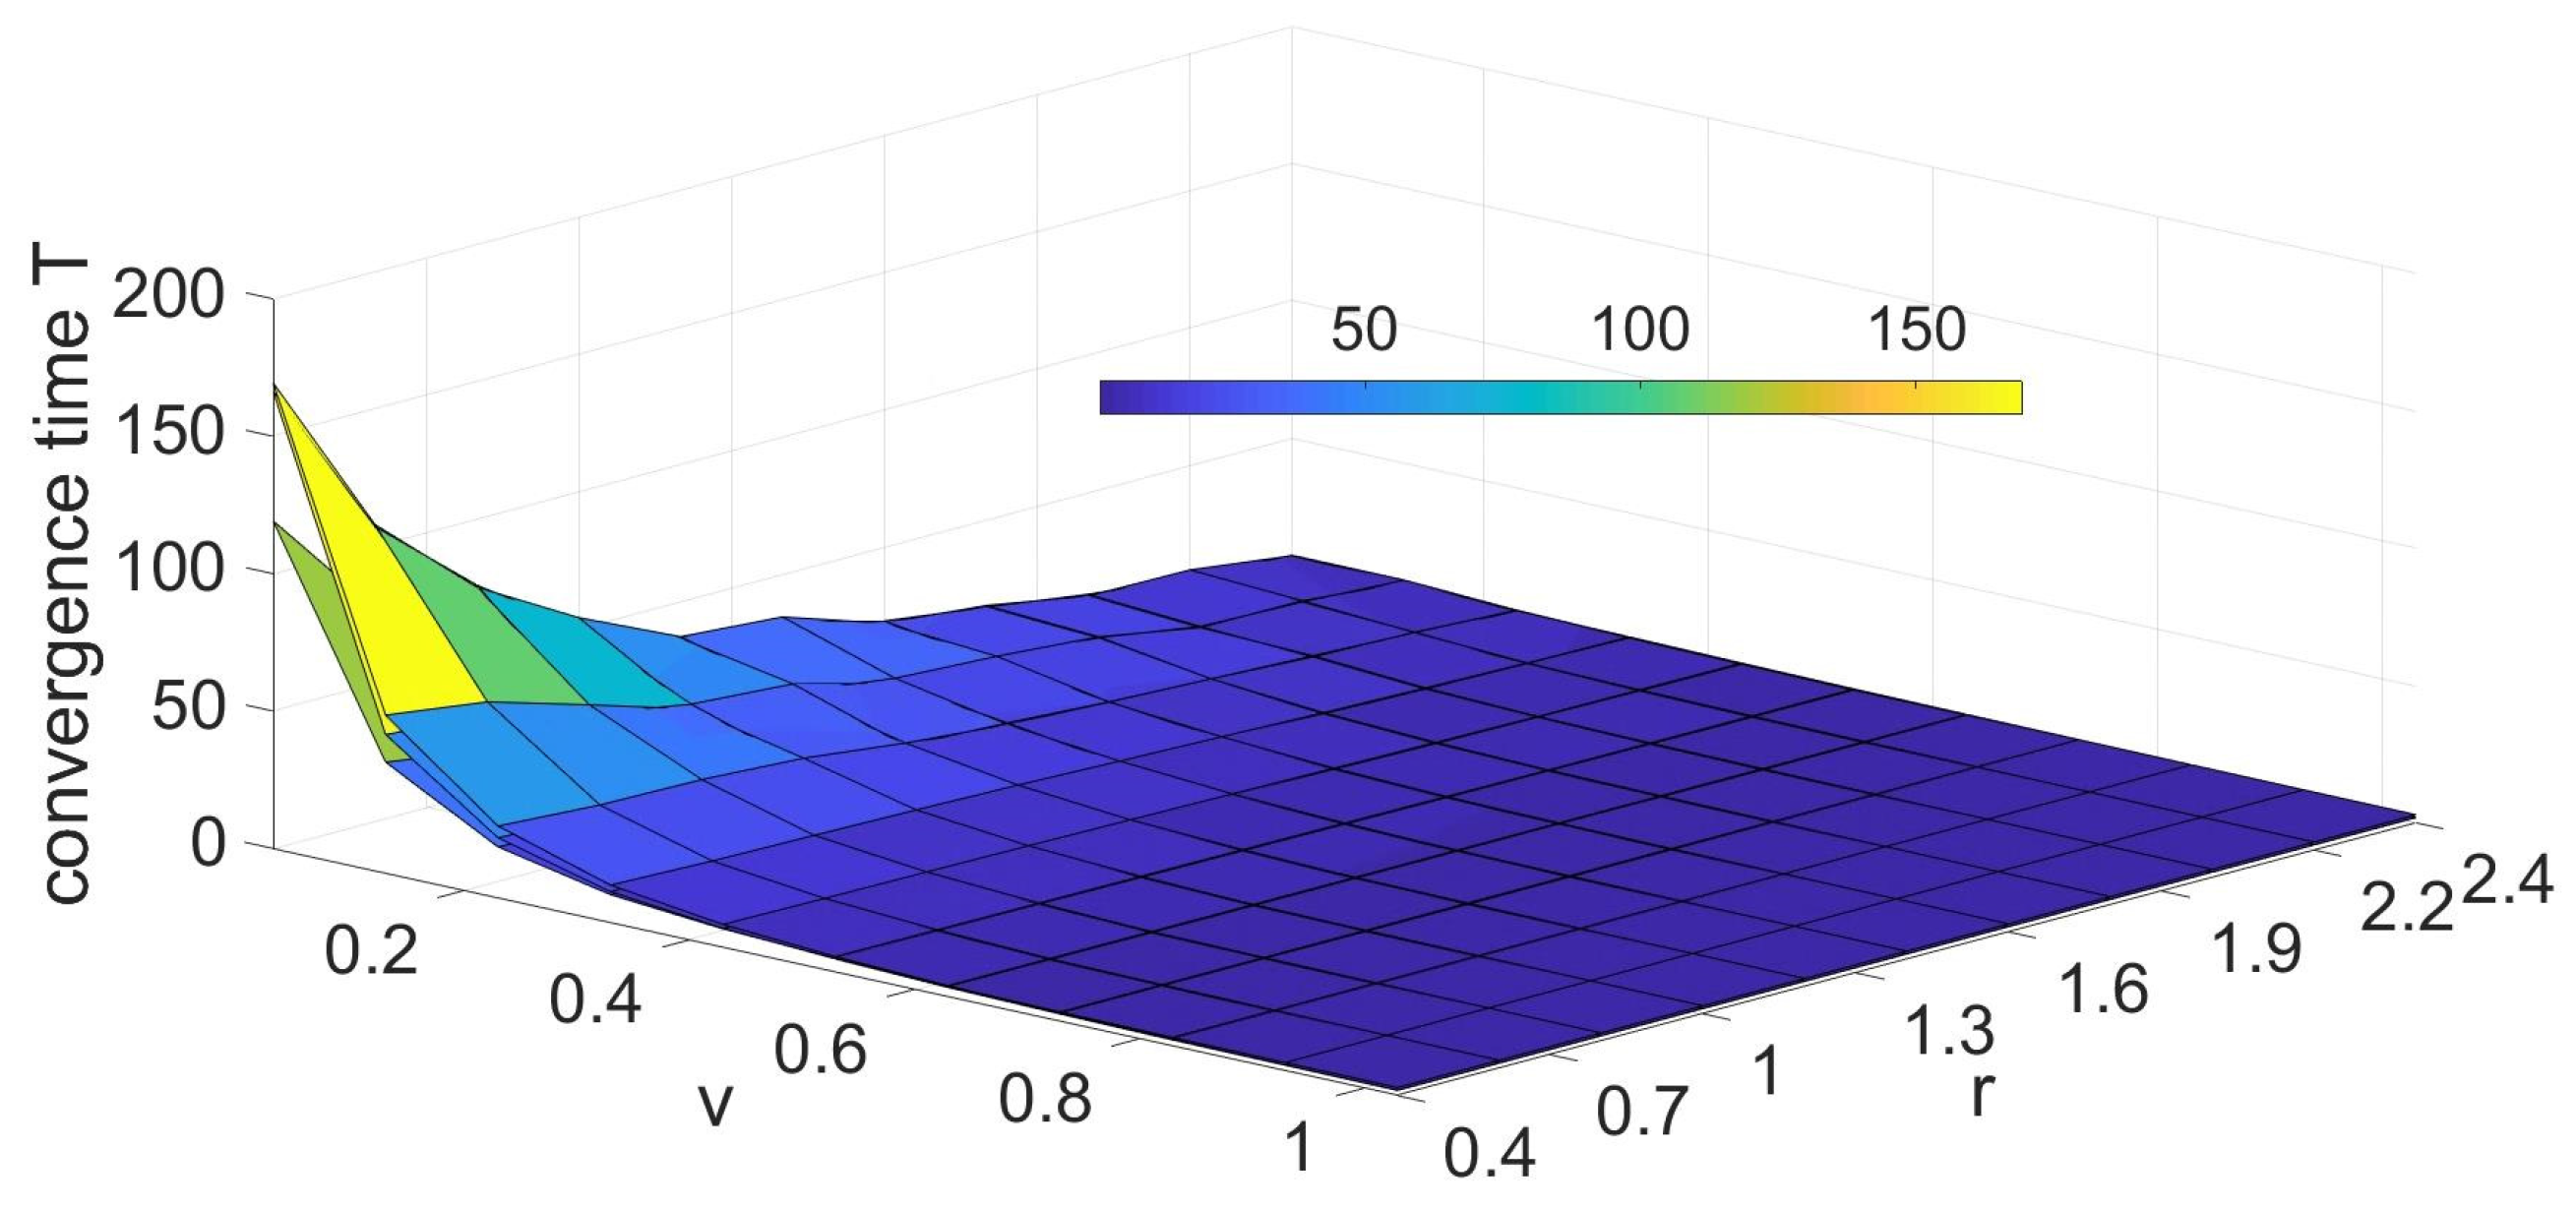
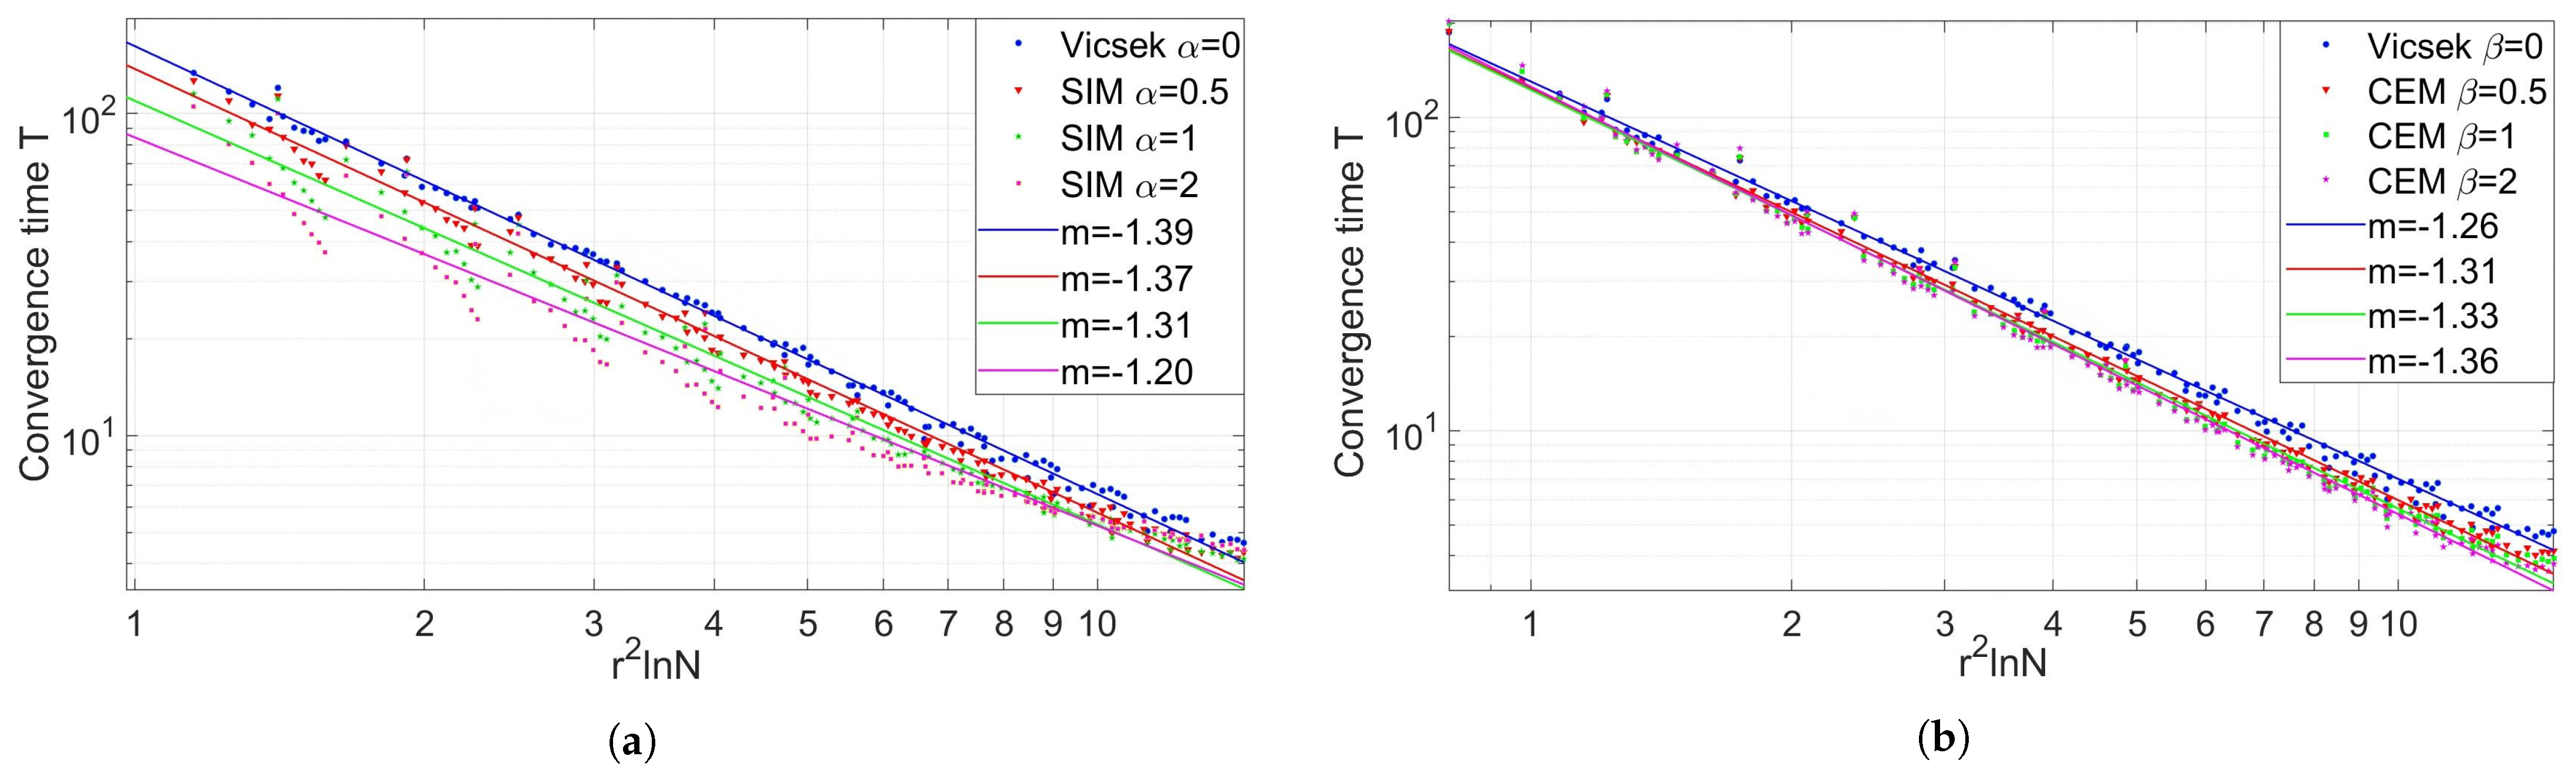
3.1.1. Influence of Parameters on the Convergence Time T

The collective system can be seen as a complex social network, where the flocking parameters r and N under a fixed speed v directly affect the connectivity of the network. Otherwise, different speeds of individuals affect the frequency of information exchange in complex networks. Therefore, the flocking parameters ( v , r , N ) and model parameters ( α , β ) jointly determine the interaction mechanisms of individuals. The impact of the model parameters and flocking parameters on the collective behavior were analyzed qualitatively and quantitatively with the convergence time T as the metric. We kept L fixed and changed N to change the density ρ , where ρ = N / L 2 . The convergence time T has been described before, and we set a threshold of ϕ thre = 0.95 .
We first kept the speed of flocking individuals fixed as a constant and analyzed the influence of the density in the system and the interaction radius r on the convergence time T. It can be seen from Figure 3 that the convergence time of the two models decreased as the interaction radius and density increased, which is similar to the original Vicsek model.
The main reason for this is ρ and r are not only the main parameters affecting the local consistency ϕ i but also the main factors of the topology network of the group. If the flocking density ρ is kept as a constant, then increasing the interaction radius r within a certain range is equivalent to increasing the connectivity of the network, thus adding more references (neighbors) to each individual. Therefore, the time from disorder to order of the collective will be greatly reduced. On the other hand, if the interaction radius r is fixed, and the density ρ is increased, then the connectivity of the local network will be increased, the local information obtained by the individual will be more valuable, and the convergence time of the group will also be reduced. It is obvious that reducing the flocking density or the interaction radius will gradually lead to a less connected network, and thus the convergence time will increase. To sum up, the density and interaction radius are both the main flocking parameters that affect the complex network of a group.
Next, the speed was selected as the main parameter and combined with the interaction radius to further analyze the impact of the flocking parameters on collective movement. Through the simulation analysis, we found that the amplitude of the individual speed also affected the convergence time of the flocking. Figure 4 shows a comparison of the convergence times T for the VM, SIM, and CEM under different flocking parameters (v, r). Within a certain range, increasing the speed can significantly reduce the convergence time of flocking, as shown in Figure 4. This is because increasing the speed is equivalent to increasing the frequency of information exchange between individuals.
Through the above analysis, it can be known that the flocking parameters ( v , r , N ) determined the convergence time T of the group, given that the model parameter α = β = 1 . In order to further explore the quantitative relationship between the two parameters r and N that affected the connectivity of the topology network, the model parameters ( α , β ), and the convergence time T, extensive numerical simulations were performed with a fixed velocity amplitude ( v = 0.03 ). The results are shown in Figure 5, and the relationship between them was found to be
T r 2 ln N m ,
where m is the slope of the double logarithmic linear fitting, which is mainly determined by the model parameter α or β . However, as the model parameters increased, this linearity became worse, especially when α > 3 and β > 3 . Meanwhile, we also verified the above conclusion from Figure 5 again that the convergence time will decrease along with the increase in the number of individuals N and their interaction radius r.
It can also be seen from Figure 5a,b that within a certain range, if the flocking parameters were fixed, then the convergence time decreased with the increase in model parameters α or β . However, the fitting slope shows different trends. The fitting slope in Figure 5a increases with the increase in α , while the variation shown in Figure 5b is exactly the opposite, and the fitting slope decreases with the increase in β . This is because the increase in α weakened the effect of local consistency in the SIM, gradually tending toward a change in orientation with a fixed weight, as well as weakening the influence of parameters N and r on the convergence time. In sharp contrast to the SIM, as the model parameter β of the CEM increased, the effect of local consistency would not be weakened due to the introduction of weight normalization in Equation (7), and thus the fitted slope merely decreased slightly.
To show the relationship between m and α and β more clearly, further numerical simulations were performed, and the results are shown in Figure 6. Based on the metric of the convergence time, there were linear relationships between the model parameters and m in Equation (10); that is, m = 0.0714 α , and m = 0.0417 β . Therefore, Equation (10) can be rewritten as Equations (11) and (12) to represent the relationships among the convergence time T, flocking parameters (r, N), and model parameters ( α , β ) of the SIM and CEM, respectively.
T r 2 ln N 0.0714 α ,
T r 2 ln N 0.0417 β .
However, as the individual’s speed increased, these relationships were no longer valid. The relationships between m and α , β are nonlinear and irregular when v is large.
In summary, the model parameters and flocking parameters affected the flocking behavior together in a certain range of parameters. Specifically, the connectivity of the network whose main parameters were the interaction radius and density as well as the interaction mechanisms of individuals jointly affected flocking.

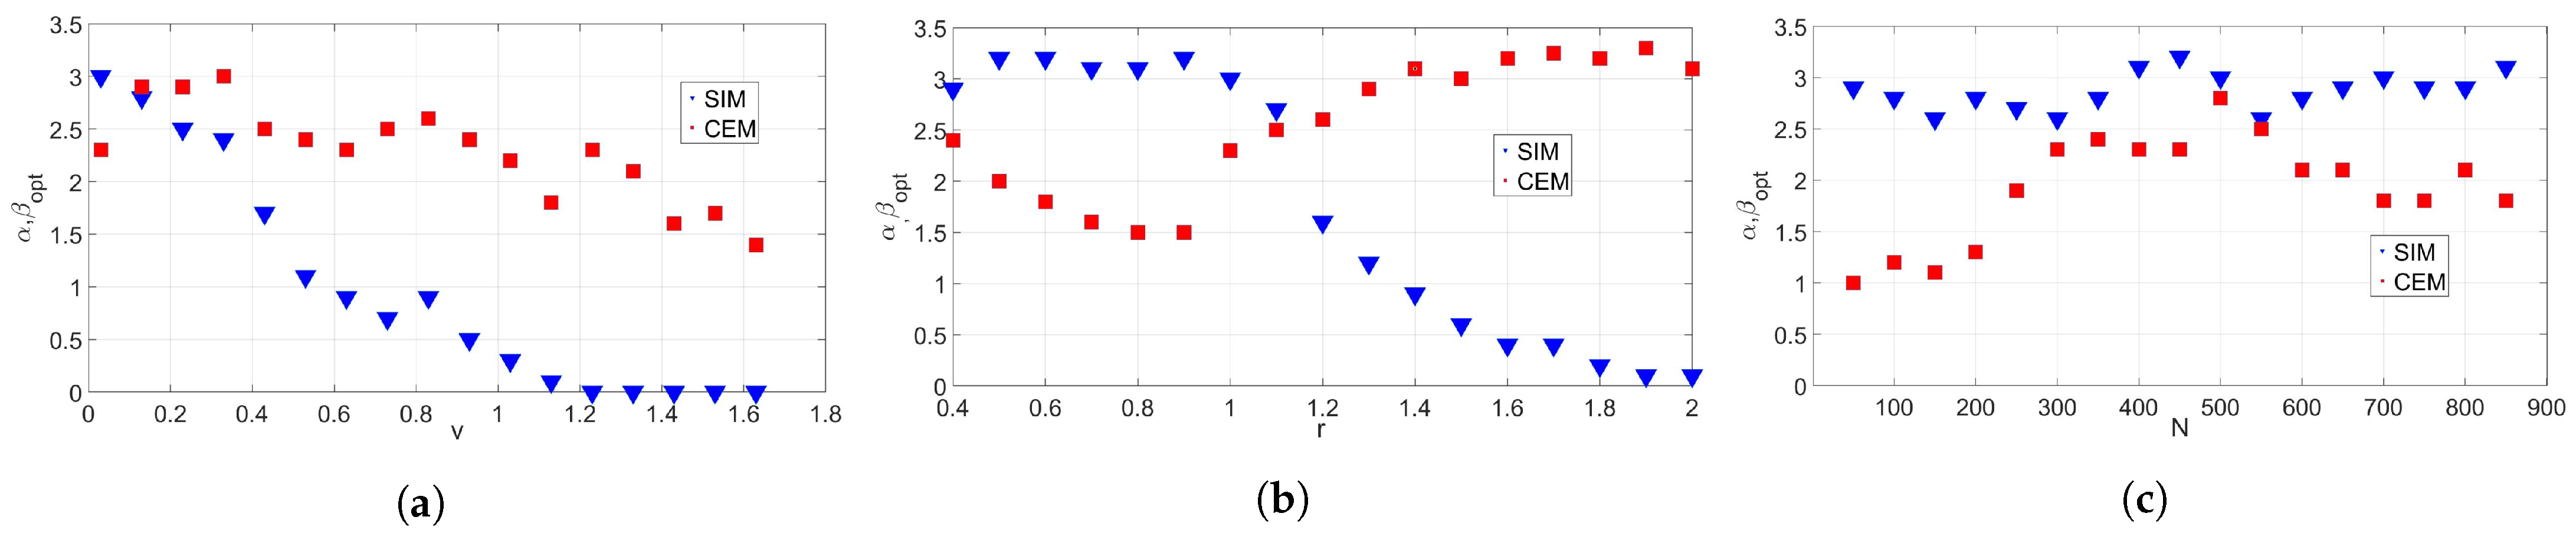
3.1.2. Optimal Values of the Model Parameters

Although the quantitative relationship among the parameters in the models was explored from the perspective of the convergence time, Figure 5 also shows that the convergence times for specific flocking parameters and model parameters did not always follow such a quantitative relationship.
In order to find the optimal values of α and β , we carried out simulations with different values of α and β in the range of [ 0 , 5 ] using the SIM and CEM respectively. By comparing the convergence time T and cumulative global consistency S, the optimal values of α and β , denoted by α opt and β opt , respectively, were determined under different flocking parameters.
We first investigated the optimal values under the metric T. Figure 7a shows that under the constant density and interaction radius of the group, the optimal model parameter α opt of the SIM gradually decreased as the individual speed v increased. In particular, the optimal parameter α = 0 when the speed v 1.2 , which is exactly the same as the VM. This means that the Vicsek model has more advantages in terms of convergence time when the speed v is higher, while the model parameter β opt of the CEM slightly decreased with the increase in v.
The interaction radius of an individual also affects the optimal value of the model, which can be drawn from Figure 7b. When the density and speed of the group were constant, the optimal model parameter α of the SIM increased first and then decreased with the growth of the individual interaction radius r. Conversely, the optimal parameter β of the CEM decreased first and then increased with the increase in the interaction radius r. We tried to understand these two different trends from the perspective of the mechanisms of the two models. Under the condition of a small interaction radius, the interaction mechanism of self-introspection (SIM) made the individual have fewer neighbors to refer to, and the average orientation of the neighbors was not particularly reliable. Therefore, it is not necessary for the individual to use the interaction mechanism of self-introspection to move; instead, individuals adopt a fixed-weight interaction mechanism, which means α is large. A larger interaction radius increased the number of neighbors, and reliable information about the neighbors made individuals interact with neighbors in a more introspective way ( α opt became smaller). Especially when r increased to a certain extent (r > 1.8), individuals were more inclined to the average orientation of the neighbors ( α = 0, Vicsek model). For β opt of the CEM, when r was small, there were fewer neighbors, and an individual could not give much credit to a neighbor even if he or she was more reliable, and thus β opt was usually under two. In the case of larger r values, this means that the increase in neighbors would make individuals pay more attention to the neighbors with better alignment, and thus β opt was large and usually around three. As for the density of the individuals, as shown in Figure 7c, if the speed v and the interaction radius r of flocking were fixed, then the increase in density would barely affect the optimal parameters of the SIM, which only fluctuated around 2.5∼3.5. However, the optimal parameter β opt of the CEM would increase first and then decrease slightly.
On the other hand, the optimal parameters of the proposed models were measured by the cumulative global consistency S, as shown in Figure 8. By comparing Figure 7 and Figure 8, it can be seen that the optimal parameters of the models were slightly different, but the change trends were similar. Figure 8a shows that the optimal values of α and β decreased overall, which is similar to Figure 7a. The trends between the results of Figure 7b and Figure 8b are similar as well. The most obvious difference is the influence of the density on the optimal model parameters. Compared with Figure 7c, the optimal parameters of the SIM in Figure 8c slightly decreased, while β opt for the CEM in Figure 8c was a little different in terms of amplitude and change trend from Figure 7c. Therefore, the optimal parameters α opt and β opt of the two models obtained by the two metrics behaved similarly in the relationship with the flocking parameters ( v , r , N ), which also verifies the reliability of the results.
In summary, the optimal values of α and β changed under different flocking parameters (v, r, N). Using different metrics T and S, the overall trends of α opt and β opt were similar, although some slight differences existed. The studies in this subsection will be used to select the optimal parameters of the two models, the SIM and CEM, according to different flocking parameters.

3.1.3. Model Comparison

Our two proposed models not only depict the interaction mechanisms of individuals in detail but also show advantages in the convergence efficiency. In the absence of noise, the convergence time T, global consistency ϕ , and cumulative global consistency S are discussed to compare the proposed models with the Vicsek model.
As shown in Figure 5, there is the remarkable fact that within a certain parameter range, both of the proposed models were superior to the original Vicsek model in terms of the convergence time when the number of individuals and their interaction radius were the same; that is, by using the SIM or CEM, the convergence was accelerated.
This conclusion can also be drawn from the previous discussion of the relationship between the optimal parameters of the models and the flocking parameters. For instance, Figure 7a and Figure 8a show that the two proposed models had more advantages in terms of convergence time and the cumulative global consistency than the original Vicsek model ( α = β = 0 ), except for v 1.2 . Figure 7b and Figure 8b can also lead to similar conclusions. In particular, as shown in Figure 7c and Figure 8c, the advantages of the proposed model can be reflected in the case of a fixed speed and interaction radius, regardless of the density of the group.
In order to compare the convergence efficiency of different models more intuitively, we carried out specific simulations of different models under a set of flocking parameters, where the SIM and CEM were under their optimal model parameters, and the global consistency ϕ was used as the metric. The flocking parameters v = 0.03 , N = 300 , and r = 1 were selected, and then the optimal model parameters of the SIM and CEM were α = 1.7 and β = 1.4 , which could be obtained from Figure 8. The result is shown in Figure 9. This result shows that under the above parameter conditions, the two proposed interaction mechanisms were superior to the Vicsek model in terms of global consistency ϕ , and the self-introspection was superior to that of the credit evaluation.
Here, we want to emphasize the changes in the convergence efficiency of the three models in Figure 9. In the first 3∼4 s, the convergence efficiency of the CEM was the highest, and that of the SIM was the lowest. However, the SIM caught up with the other two models after 4 s, which is one of the reasons why the model had different performance under the two metrics T and S. The threshold ϕ thre obviously not only determined the convergence time but also affected the value of the cumulative global consistency. Therefore, the convergence time T reflects the final performance of a model, while the cumulative global consistency S focuses on the comprehensive performance of the whole process.
From Figure 9, it can be seen that the individuals with self-introspection (SIM) could not find a superior way of adjusting the orientation for themselves in the early stage, but with the narrowing of the difference between the movement orientation and the average orientation of their neighbors, they gradually adapted to the orientation consistency of the group and effectively corrected the orientation. The individuals with credit evaluation (CEM) chose to refer to the orientations of the neighbors efficiently, and thus the convergence efficiency was excellent in the first 3∼4 s. In the later stage, with the convergence of the group orientation, the effect of this evaluation mechanism was no longer obvious, and thus it was slightly inferior to that of the self-introspection (SIM) individual.
In order to provide a clearer exposition of the impact of the SIM and CEM on the cluster system, a comparative analysis was conducted between these two models and the original model, as depicted in Table 1. The individual speed for the cluster system was chosen to be v = 0.03, and the convergence time was obtained from the average over 500 independent simulations. The outcomes aligned with those presented in Figure 9.
From the perspective of the convergence time, in cases with smaller interaction radii ( r 1 ), the SIM model had certain advantages, and as the interaction radius increased, and the number of individuals grew, the convergence time of the swarm was reduced. However, in situations with larger interaction radii ( r = 1.5 ), the CEM model exhibited the shortest convergence time. From this, it can be inferred that individuals with a larger perception range are better suited to models with varying weights, which facilitates alignment within the swarm. Conversely, individuals with a smaller perception range tend to adjust their directions continuously from their own perspectives.
In summary, only under a specific parameter configuration (such as v > 1.2 and r > 1.9 , shown in Figure 7 and Figure 8) can the Vicsek model have certain advantages in terms of the convergence efficiency or convergence time, while in most cases, the proposed models are more advantageous.

3.2. Simulations with Noise

All the previous simulation calculations were based on the noise-free case. The group would eventually achieve global consistency, and the value of the global consistency ϕ would be close to one. However, groups are generally influenced by noise from individuals, which reflects the uncertainty and the errors of the individuals’ motions. In order to show the robustness of the two proposed models, noise was taken into account for further analysis.
For the purpose of testing the performances of the proposed models and comparing them to that of the Vicsek model, noise with the same amplitude, where Δ θ [ η / 2 , η / 2 ] , was added to Equations (2), (5), and (6). The noise was selected to be as strong as η = 0 4.5 to test the stability of these models. Using Equation (9), the final global consistency values ϕ η of the VM, SIM, and CEM are shown in Figure 10.
In the noise-free case, it can be known from the above discussions that the flocking would eventually achieve a global consistency ϕ = 1 . However, after adding noise, the final global consistency would be less than one. Figure 10 shows the effects of different noise amplitudes on ϕ η with different densities for the three models (VM, SIM, and CEM). Here, we chose the flocking parameters ( v = 0.03 , r = 1 ), and the model parameters here ( α , β ) were selected from the results in Figure 8c. In the case of lower noise, the global consistency could be maintained between 0.9 and 1. As discussed above, the SIM has advantages in terms of convergence time in the noise-free case, but it can be seen from Figure 10 that the final global consistency ϕ η of the SIM with noise was somewhat poor. In particular, when the noise was larger (e.g., η = 2 4.8 ), the ability of the SIM to resist noise was significantly weaker than the VM and CEM, regardless of the number of individuals. For a large number of individuals (Figure 10c,d), in the case with more noise, the performances of the VM and CEM against the noise were similar.
As mentioned above, individuals in a group may have heterogeneous features. We now investigate the case where the individuals in the group behave differently. We assumed that the group included two kinds of individuals behaving according to the SIM and CEM, whose numbers were N I and N N I , respectively. We focused on the global consistencies and stabilities against noise for the groups with different N I values under specific parameters. We set the flocking parameters to v = 0.03 , r = 1 , and N = 300 , and the model parameters were α = β = 1 . The noise amplitude increased from 0 to 4.8 in the simulation. Numerical simulations were performed based on the above parameters, and the final global consistency ϕ η was recorded.
The flocking behavior showed characteristics different from those of a single type of group under the influence of noise, as shown in Figure 11. Meanwhile, the groups with different proportions of behaviors showed different noise resistance abilities. Although the given model parameters were not optimal, the trend of the final global consistency of the group system was similar to Figure 10 in that when the amplitude of the noise was identical, the final global consistency of the group containing only the SIM ( N I / N = 1 ) was slightly lower than that of the group containing the CEM ( N I / N = 0 ). When under the lower amount of noise ( η < 1 ), the final global consistency ϕ η of the mixed group could be maintained at about 0.9∼1. With the increase in the number of introspective individuals, the stability of the group system against noise would decrease. This is because the interaction mechanism of credit evaluation represented by the CEM is more inclined to refer to the orientations of neighbors in a weighted way, which will weaken the influence of noise on an individual orientation. This result is also shown in Figure 10. As the number of individuals under the interaction mechanism of self-introspection represented by the SIM increased, the robustness of the group became weaker, and the final global consistency ϕ η became smaller.

4. Conclusions

In this paper, we explored two mechanisms that are ubiquitous in natural herds and human society. The mechanism of self-introspection reveals that an individual will take different efforts to catch up with others according to different gaps, while the mechanism of credit evaluation reflects the fact that an individual may assign different credits to different neighbors based on its evaluation. To evaluate these two mechanisms, we took the Vicsek model as the raw model and proposed two novel models, the SIM and CEM, by introducing the concept of local consistency. Using the SIM, the individuals decide the degree of effort to make turns according to their own local consistency. Using the CEM, the individuals determine the reference orientation by assigning different weights to their neighbors’ orientations.
In order to show the effectiveness of the two proposed models, numerical simulations were carried out for different models in both noise-free and noisy environments. We designed three metrics—the convergence time, the global consistency, and the cumulative global consistency—to evaluate the proposed models. It was found that there exists a quantitative relationship between the convergence time and the flocking parameters, and we further investigated the relationship between them and the model parameters. Based on the selected flocking parameters, the convergence time and cumulative global consistency were used as metrics to determine the optimal model parameters of the two proposed models. Then, under the optimal model parameters, the advantages of the two proposed models in terms of convergence efficiency were analyzed from the perspective of global consistency. However, when there was noise, the two models both showed poorer performance than that of the original Vicsek model. Furthermore, it was found through numerical simulations that the groups with mixed behaviors of the two proposed models had better performance compared with the groups with the single behavior of self-introspection.
The findings obtained from this research may be valuable for the study of the mechanisms of individuals’ behaviors in flocking in biology communities. Furthermore, this conclusion could also be applied to a distributed cluster of robots. Robotic swarms represent a distinct domain of entities. Both robotic swarms and biological swarms exhibit collective behaviors that self-organize through local perception among individuals, sharing many similarities in formation and behavior. While biological systems display higher complexity across multiple levels (from molecules to organ systems) and possess a certain evolutionary capacity, robots can mimic the behaviors of biological entities, responding to and making decisions based on the surrounding individuals or the environment. The individual behavior model proposed in this study can also be applied to robots, allowing the group to exhibit enhanced adaptability and robustness when adapting to their environment. Future work will concentrate on the more effective ways to combine these two mechanisms together to simulate flocking behaviors.

Author Contributions

Conceptualization, Q.Z.; data curation, Y.L.; formal analysis, Y.L. and S.L.; funding acquisition, M.X. and G.X.; investigation, S.L. and G.W.; methodology, Q.Z. and Y.L.; supervision, G.W.; writing—original draft, Q.Z. and S.L.; writing—review and editing, Q.Z., S.L. and C.W. All authors have read and agreed to the published version of the manuscript.

Funding

This work was supported in part by the National Natural Science Foundation of China (Grant Nos. 51879022, 51979045, 51906029, 61973007, 12272008, and U22A2062), the Dalian Youth Star of Science and Technology (Grant No. 2018RQ12), the Beijing Natural Science Foundation (No. L222084), the Fundamental Research Funds for the Central Universities (Grants Nos. 3132019037 and 3132019197), and the Natural Science Foundation of Jilin Province (Grant Nos. 20220101138JC and YDZJ202301ZYTS420).

Institutional Review Board Statement

Not applicable.

Informed Consent Statement

Not applicable.

Data Availability Statement

Not applicable.

Acknowledgments

The authors would like to acknowledge and thank Junpeng Wang for the contributions during the early stages of the work on this manuscript.

Conflicts of Interest

The authors declare no conflict of interest.

References

  1. Debets, V.E.; Janssen, L.; Storm, C. Enhanced persistence and collective migration in cooperatively aligning cell clusters. Biophys. J. 2021, 120, 1483–1497. [Google Scholar] [CrossRef] [PubMed]
  2. Vourc’h, T.; Léopoldès, J.; Peerhossaini, H. Clustering of bacteria with heterogeneous motility. Phys. Rev. E 2020, 101, 022612. [Google Scholar] [CrossRef] [PubMed]
  3. Larrieu, R.; Quilliet, C.; Dupont, A.; Peyla, P. Collective orientation of an immobile fish school and effect on rheotaxis. Phys. Rev. E 2021, 103, 022137. [Google Scholar] [CrossRef] [PubMed]
  4. Ling, H.; Mclvor, G.E.; van der Vaart, K.; Vaughan, R.T.; Thornton, A.; Ouellette, N.T. Local interactions and their group-level consequences in flocking jackdaws. Proc. R. Soc. B 2019, 286, 20190865. [Google Scholar] [CrossRef] [PubMed]
  5. Torney, C.J.; Lamont, M.; Debell, L.; Angohiatok, R.J.; Leclerc, L.M.; Berdahl, A.M. Inferring the rules of social interaction in migrating caribou. Philos. Trans. R. Soc. B Biol. Sci. 2018, 373, 20170385. [Google Scholar] [CrossRef]
  6. Helbing, D.; Farkas, I.; Vicsek, T. Simulating dynamical features of escape panic. Nature 2000, 407, 487–490. [Google Scholar] [CrossRef]
  7. Gu, Z.; Pan, S.; Lin, Z.; Hu, L.; Zhan, X. Climate-driven flyway changes and memory-based long-distance migration. Nature 2021, 591, 259–264. [Google Scholar] [CrossRef]
  8. Janosov, M.; Virágh, C.; Vásárhelyi, G.; Vicsek, T. Group chasing tactics: How to catch a faster prey? New J. Phys. 2017, 19, 053003. [Google Scholar] [CrossRef]
  9. Abdi, H.; Pishkenari, H.N. Controlled swarm motion of self-propelled microswimmers for energy saving. J. Micro-Bio Robot. 2021, 17, 23–33. [Google Scholar] [CrossRef]
  10. Hughey, L.F.; Hein, A.M.; Strandburg-Peshkin, A.; Jensen, F.H. Challenges and solutions for studying collective animal behaviour in the wild. Philos. Trans. R. Soc. B Biol. Sci. 2018, 373, 20170005. [Google Scholar] [CrossRef]
  11. Papageorgiou, D.; Farine, D.R. Group size and composition influence collective movement in a highly social terrestrial bird. Elife 2020, 9, e59902. [Google Scholar] [CrossRef] [PubMed]
  12. Sarfati, R.; Hayes, J.C.; Peleg, O. Self-organization in natural swarms of Photinus carolinus synchronous fireflies. Sci. Adv. 2021, 7, eabg9259. [Google Scholar] [CrossRef] [PubMed]
  13. Olfati-Saber, R. Flocking for multi-agent dynamic systems: Algorithms and theory. IEEE Trans. Autom. Control 2006, 51, 401–420. [Google Scholar] [CrossRef]
  14. Giardina, I. Collective behavior in animal groups: Theoretical models and empirical studies. HFSP J. 2008, 2, 205–219. [Google Scholar] [CrossRef]
  15. Ariel, G.; Ayali, A. Locust collective motion and its modeling. PLoS Comput. Biol. 2015, 11, e1004522. [Google Scholar] [CrossRef]
  16. Deutsch, A.; Theraulaz, G.; Vicsek, T. Collective motion in biological systems. Interface Focus 2012, 2. [Google Scholar] [CrossRef]
  17. Vicsek, T.; Czirók, A.; Ben-Jacob, E.; Cohen, I.; Shochet, O. Novel type of phase transition in a system of self-driven particles. Phys. Rev. Lett. 1995, 75, 1226. [Google Scholar] [CrossRef]
  18. George, M.; Ghose, D. Reducing convergence times of self-propelled swarms via modified nearest neighbor rules. Phys. A Stat. Mech. Its Appl. 2012, 391, 4121–4127. [Google Scholar] [CrossRef]
  19. Aldana, M.; Dossetti, V.; Huepe, C.; Kenkre, V.; Larralde, H. Phase transitions in systems of self-propelled agents and related network models. Phys. Rev. Lett. 2007, 98, 095702. [Google Scholar] [CrossRef]
  20. Baglietto, G.; Albano, E.V.; Candia, J. Complex network structure of flocks in the Standard Vicsek Model. J. Stat. Phys. 2013, 153, 270–288. [Google Scholar] [CrossRef]
  21. Zhao, Q.; Li, S.; Wang, G.; Wang, C.; Xie, G. A Local Consistency Algorithm to Shorten the Convergence Time and Improve the Robustness of Self-propelled Swarms. In Proceedings of the Chinese Automation Congress (CAC), Shanghai, China, 6–8 November 2020; pp. 4153–4157. [Google Scholar]
  22. Zou, Y.; Zhang, H.; Li, Y.; Wang, B. Accelerating consensus of self-driven swarm via a weighted model. Phys. A Stat. Mech. Its Appl. 2013, 392, 3329–3334. [Google Scholar] [CrossRef]
  23. Zhang, J.; Zhao, Y.; Tian, B.; Peng, L.; Zhang, H.; Wang, B.; Zhou, T. Accelerating consensus of self-driven swarm via adaptive speed. Phys. A Stat. Mech. Its Appl. 2009, 388, 1237–1242. [Google Scholar] [CrossRef]
  24. Zhao, M.; Su, H.; Wang, M.; Wang, L.; Chen, M.Z. A weighted adaptive-velocity self-organizing model and its high-speed performance. Neurocomputing 2016, 216, 402–408. [Google Scholar] [CrossRef]
  25. Shang, Y.; Bouffanais, R. Influence of the number of topologically interacting neighbors on swarm dynamics. Sci. Rep. 2014, 4, 4184. [Google Scholar] [CrossRef] [PubMed]
  26. Wang, C.; Xie, G. Lazy workers benefit group performance in circle formation tasks. IFAC-PapersOnLine 2017, 50, 10383–10388. [Google Scholar] [CrossRef]
  27. del Mar Delgado, M.; Miranda, M.; Alvarez, S.J.; Gurarie, E.; Fagan, W.F.; Penteriani, V.; di Virgilio, A.; Morales, J.M. The importance of individual variation in the dynamics of animal collective movements. Philos. Trans. R. Soc. B Biol. Sci. 2018, 373. [Google Scholar] [CrossRef]
  28. Aguilar, J.; Monaenkova, D.; Linevich, V.; Savoie, W.; Dutta, B.; Kuan, H.S.; Betterton, M.; Goodisman, M.; Goldman, D. Collective clog control: Optimizing traffic flow in confined biological and robophysical excavation. Science 2018, 361, 672–677. [Google Scholar] [CrossRef]
  29. Albert, R.; Barabási, A.L. Statistical mechanics of complex networks. Rev. Mod. Phys. 2002, 74, 47. [Google Scholar] [CrossRef]
  30. Bode, N.W.; Wood, A.J.; Franks, D.W. Social networks and models for collective motion in animals. Behav. Ecol. Sociobiol. 2011, 65, 117–130. [Google Scholar] [CrossRef]
  31. Ojer, J.; Pastor-Satorras, R. Flocking dynamics mediated by weighted social networks. arXiv 2022, arXiv:2205.07533. [Google Scholar] [CrossRef]
  32. Eriksson, A.; Nilsson Jacobi, M.; Nyström, J.; Tunstrøm, K. Determining interaction rules in animal swarms. Behav. Ecol. 2010, 21, 1106–1111. [Google Scholar] [CrossRef]
  33. LaChance, J.; Suh, K.; Clausen, J.; Cohen, D.J. Learning the rules of collective cell migration using deep attention networks. PLoS Comput. Biol. 2022, 18, e1009293. [Google Scholar] [CrossRef] [PubMed]
  34. Wang, W.; Escobedo, R.; Sanchez, S.; Sire, C.; Han, Z.; Theraulaz, G. The impact of individual perceptual and cognitive factors on collective states in a data-driven fish school model. PLoS Comput. Biol. 2022, 18, e1009437. [Google Scholar] [CrossRef] [PubMed]
  35. Miguel, M.C.; Parley, J.T.; Pastor-Satorras, R. Effects of heterogeneous social interactions on flocking dynamics. Phys. Rev. Lett. 2018, 120, 068303. [Google Scholar] [CrossRef] [PubMed]
  36. Demartsev, V.; Gersick, A.S.; Jensen, F.H.; Thomas, M.; Roch, M.A.; Manser, M.B.; Strandburg-Peshkin, A. Signalling in groups: New tools for the integration of animal communication and collective movement. Methods Ecol. Evol. 2022, 14, 1852–1863. [Google Scholar] [CrossRef]
  37. Cook, C.N.; Lemanski, N.J.; Mosqueiro, T.; Ozturk, C.; Gadau, J.; Pinter-Wollman, N.; Smith, B.H. Individual learning phenotypes drive collective behavior. Proc. Natl. Acad. Sci. USA 2020, 117, 17949–17956. [Google Scholar] [CrossRef]
  38. Tang, W.; Davidson, J.D.; Zhang, G.; Conen, K.E.; Fang, J.; Serluca, F.; Li, J.; Xiong, X.; Coble, M.; Tsai, T.; et al. Genetic control of collective behavior in zebrafish. iScience 2020, 23, 100942. [Google Scholar] [CrossRef]
  39. Cucker, F.; Huepe, C. Flocking with informed agents. Math. Action 2008, 1, 1–25. [Google Scholar] [CrossRef]
  40. Jolles, J.W.; Boogert, N.J.; Sridhar, V.H.; Couzin, I.D.; Manica, A. Consistent individual differences drive collective behavior and group functioning of schooling fish. Curr. Biol. 2017, 27, 2862–2868. [Google Scholar] [CrossRef]
  41. Cavagna, A.; Del Castello, L.; Giardina, I.; Grigera, T.; Jelic, A.; Melillo, S.; Mora, T.; Parisi, L.; Silvestri, E.; Viale, M.; et al. Flocking and turning: A new model for self-organized collective motion. J. Stat. Phys. 2015, 158, 601–627. [Google Scholar] [CrossRef]
  42. Procaccini, A.; Orlandi, A.; Cavagna, A.; Giardina, I.; Zoratto, F.; Santucci, D.; Chiarotti, F.; Hemelrijk, C.K.; Alleva, E.; Parisi, G.; et al. Propagating waves in starling, Sturnus vulgaris, flocks under predation. Anim. Behav. 2011, 82, 759–765. [Google Scholar] [CrossRef]
  43. Cavagna, A.; Cimarelli, A.; Giardina, I.; Parisi, G.; Santagati, R.; Stefanini, F.; Viale, M. Scale-free correlations in starling flocks. Proc. Natl. Acad. Sci. USA 2010, 107, 11865–11870. [Google Scholar] [CrossRef] [PubMed]
  44. Ballerini, M.; Cabibbo, N.; Candelier, R.; Cavagna, A.; Cisbani, E.; Giardina, I.; Orlandi, A.; Parisi, G.; Procaccini, A.; Viale, M.; et al. Empirical investigation of starling flocks: A benchmark study in collective animal behaviour. Anim. Behav. 2008, 76, 201–215. [Google Scholar] [CrossRef]
  45. Dill, L.M.; Holling, C.; Palmer, L.H. Predicting the three-dimensional structure of animal aggregations from functional considerations: The role of information. In Animal Groups in Three Dimensions; Cambridge University Press: Cambridge, UK, 1997; pp. 207–224. [Google Scholar]
  46. Wolf, M.; Weissing, F.J. Animal personalities: Consequences for ecology and evolution. Trends Ecol. Evol. 2012, 27, 452–461. [Google Scholar] [CrossRef] [PubMed]
Figure 1. Illustration of the self-introspection model (SIM), where R represents the interaction radius of the ith individual, θ i ( t ) is the orientation of the ith individual at this moment, θ i ( t + 1 ) is the orientation of the ith individual at the next moment, and e 1 2 [ 1 ϕ i α ( t ) ] is the weight of the difference between the average orientation θ ^ i ( t ) and the current orientation θ i ( t ) .
Applsci 13 10361 g001
Figure 2. Illustration of interactive relationships between individuals in the credit evaluation model (CEM). D i ( t ) represents the set of neighbors of the ith individual at time t, while j and k are two neighbors of i in D i ( t ) .
Applsci 13 10361 g002
Figure 3. Convergence times T under different individual numbers N and interaction radii r for (a) SIM ( α = 1 ) and (b) CEM ( β = 1 ). N individuals move into the square 2D area ( L = 5 ). The number of individuals N increases from 50 to 550, and the interaction radii r increases from 0.5 to 1.5. The convergence time T is obtained from the average of 500 independent noise-free runs.
Applsci 13 10361 g003
Figure 4. Convergence times under different speeds v and interaction radii r for three models. From top to bottom are the VM, CEM ( β = 1 ), and SIM ( α = 1 ). Here, 300 individuals move into the square 2D area ( L = 5 ). The speed v of individuals increases from 0.03 to 1.03, and the interaction radius r increases from 0.4 to 1.4. The convergence time was obtained from the average of 500 independent noise-free runs.
Applsci 13 10361 g004
Figure 5. Convergence time T as a function of r 2 ln N . The different parameters α of the (a) SIM and β of the (b) CEM can be fitted well in the double logarithmic coordinate. Speed is fixed at v = 0.03 , and control parameters r and N vary from 0.5 to 1.5 and from 50 to 550, respectively. Each point is obtained from the average of 500 independent noise-free runs.
Applsci 13 10361 g005
Figure 6. Exponent m as a function of model parameters α and β . The range of model parameters is from 0∼5, and other parameters are the same as in Figure 5. Each point was obtained from the average of 500 independent noise-free runs.
Applsci 13 10361 g006
Figure 7. Variation in α opt , β opt measured by convergence time T against N, v, and r. Selected flocking parameters: N = 300 , v = 0.03 , and r = 1 . In the subgraph, two parameters are fixed, and another parameter changes within a certain range. Each point was obtained from the average of 500 independent noise-free runs.
Applsci 13 10361 g007
Figure 8. Variation in α opt , β opt measured by cumulative global consistency S against N, v, and r. Selected flocking parameters: N = 300 , v = 0.03 , and r = 1 . In the subgraph, two parameters are fixed, and another parameter changes within a certain range. Each point was obtained from the average of 500 independent noise-free runs.
Applsci 13 10361 g008
Figure 9. Global consistency ϕ evolves with t for three models with different parameters without noise. Initial speed v = 0.03 , number of individuals N = 300 , and interaction radius r = 1 . Global consistency ϕ was obtained from the average of 500 independent runs, and the convergence threshold is 0.95.
Applsci 13 10361 g009
Figure 10. Final global consistency ϕ η evolves with η for three models of optimal parameters with noise added. Initial speed v = 0.03 , interaction radius r = 1 , while number of individuals (a) N = 50 , α = 2.5 ,   β = 1.6 , (b) N = 100 , α = 2.3 ,   β = 2 , (c) N = 300 , α = 1.7 ,   β = 1.4 , and (d) N = 850 , α = 1.6 ,   β = 2.8 . Final global consistency ϕ η was obtained from the average of 500 independent runs.
Applsci 13 10361 g010
Figure 11. Final global consistency ϕ evolves with noise η and individual faction of self-introspection N I / N . N = 300 individuals move in a 2 D plane with L = 5 , with a fixed speed of v = 0.03 and interaction radius of r = 1 . Final global consistency ϕ η was obtained from the average of 500 independent runs.
Applsci 13 10361 g011
Table 1. Comparison of model convergence effects.
Simulation Settings Convergence Time T
Number of Individuals NModels r = 0 . 5 r = 1 r = 1 . 5
100VM139.0818.805.42
SIM112.8114.385.18
CEM135.2215.604.35
300VM93.8214.164.74
SIM57.399.074.30
CEM86.1210.783.75
500VM84.9312.934.70
SIM43.658.334.38
CEM78.5110.453.82
Disclaimer/Publisher’s Note: The statements, opinions and data contained in all publications are solely those of the individual author(s) and contributor(s) and not of MDPI and/or the editor(s). MDPI and/or the editor(s) disclaim responsibility for any injury to people or property resulting from any ideas, methods, instructions or products referred to in the content.

