
Automatic Facial Aesthetic Prediction Based on Deep Learning with Loss Ensembles


Abstract
:1. Introduction
- Leveraging the Log-cosh loss function within the context of FBP to enhance the learning process; to the best of our knowledge, we are the first to use it in quantifying the beauty in facial images.
- Refining the performance of three distinct pretrained CNNs, namely AlexNet, VGG16, and FIAC-Net, for the purpose of estimating the beauty score within facial images. This enhancement is achieved through the process of tuning and retraining these networks on separate regression-loss functions, namely L1 loss, L2 loss, and Log-cosh, on an individual basis for each network.
- Proposing a new ensemble average cost function that effectively combines L2, L1, and Log-cosh loss functions to enhance the model’s generalization and robustness in predicting the beauty scores across subjects with diverse gender, age, and ethnic characteristics, and further integrating this ensemble cost function with diverse CNN models demonstrate its efficacy in enhancing the capabilities of various deep-learning architectures for the FBP task.
- Utilizing distinct FBP benchmarks with the aim of comparing the performance of the proposed models in both restricted environments, represented by the SCUT-FBP and SCUT-FBP5500 datasets, and wild facial images captured under unconstrained conditions, as represented by the MEBeauty dataset.
2. Related Work
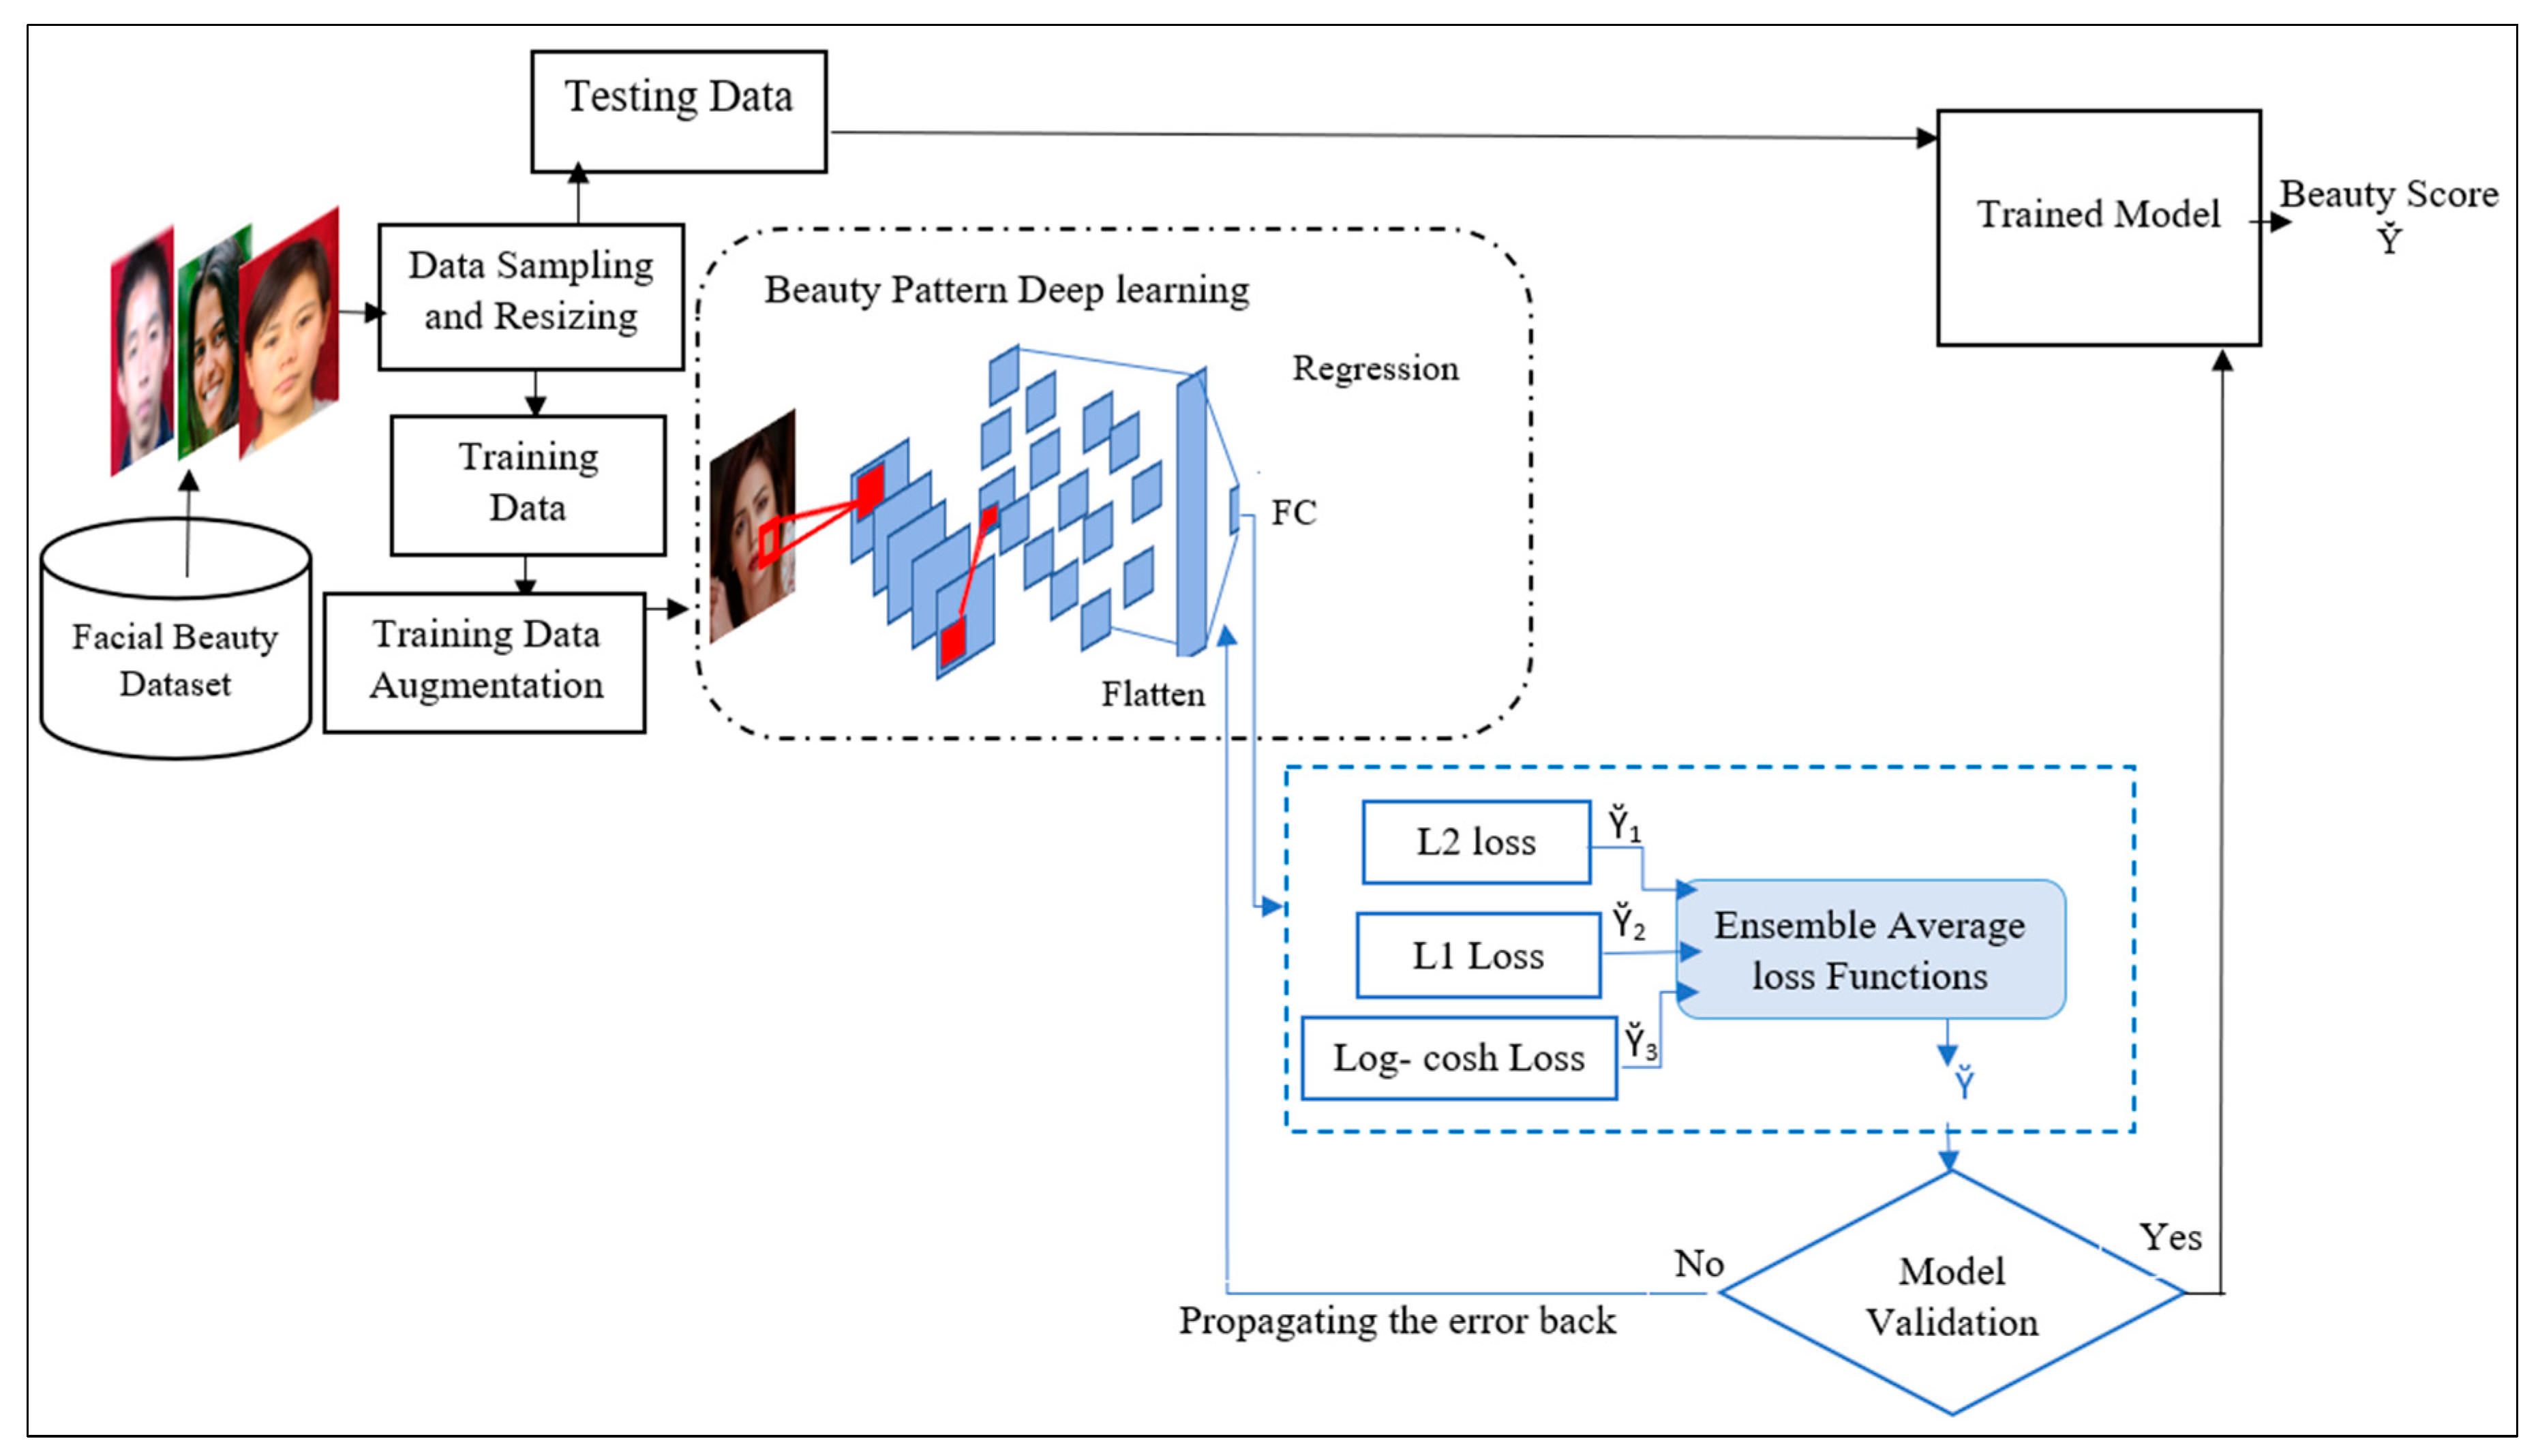
3. Methodology
3.1. Image Preprocessing
3.2. The Loss Functions
3.2.1. L2 Loss
3.2.2. L1 Loss
3.2.3. Log-cosh Loss
3.3. The Proposed Ensemble Cost Function
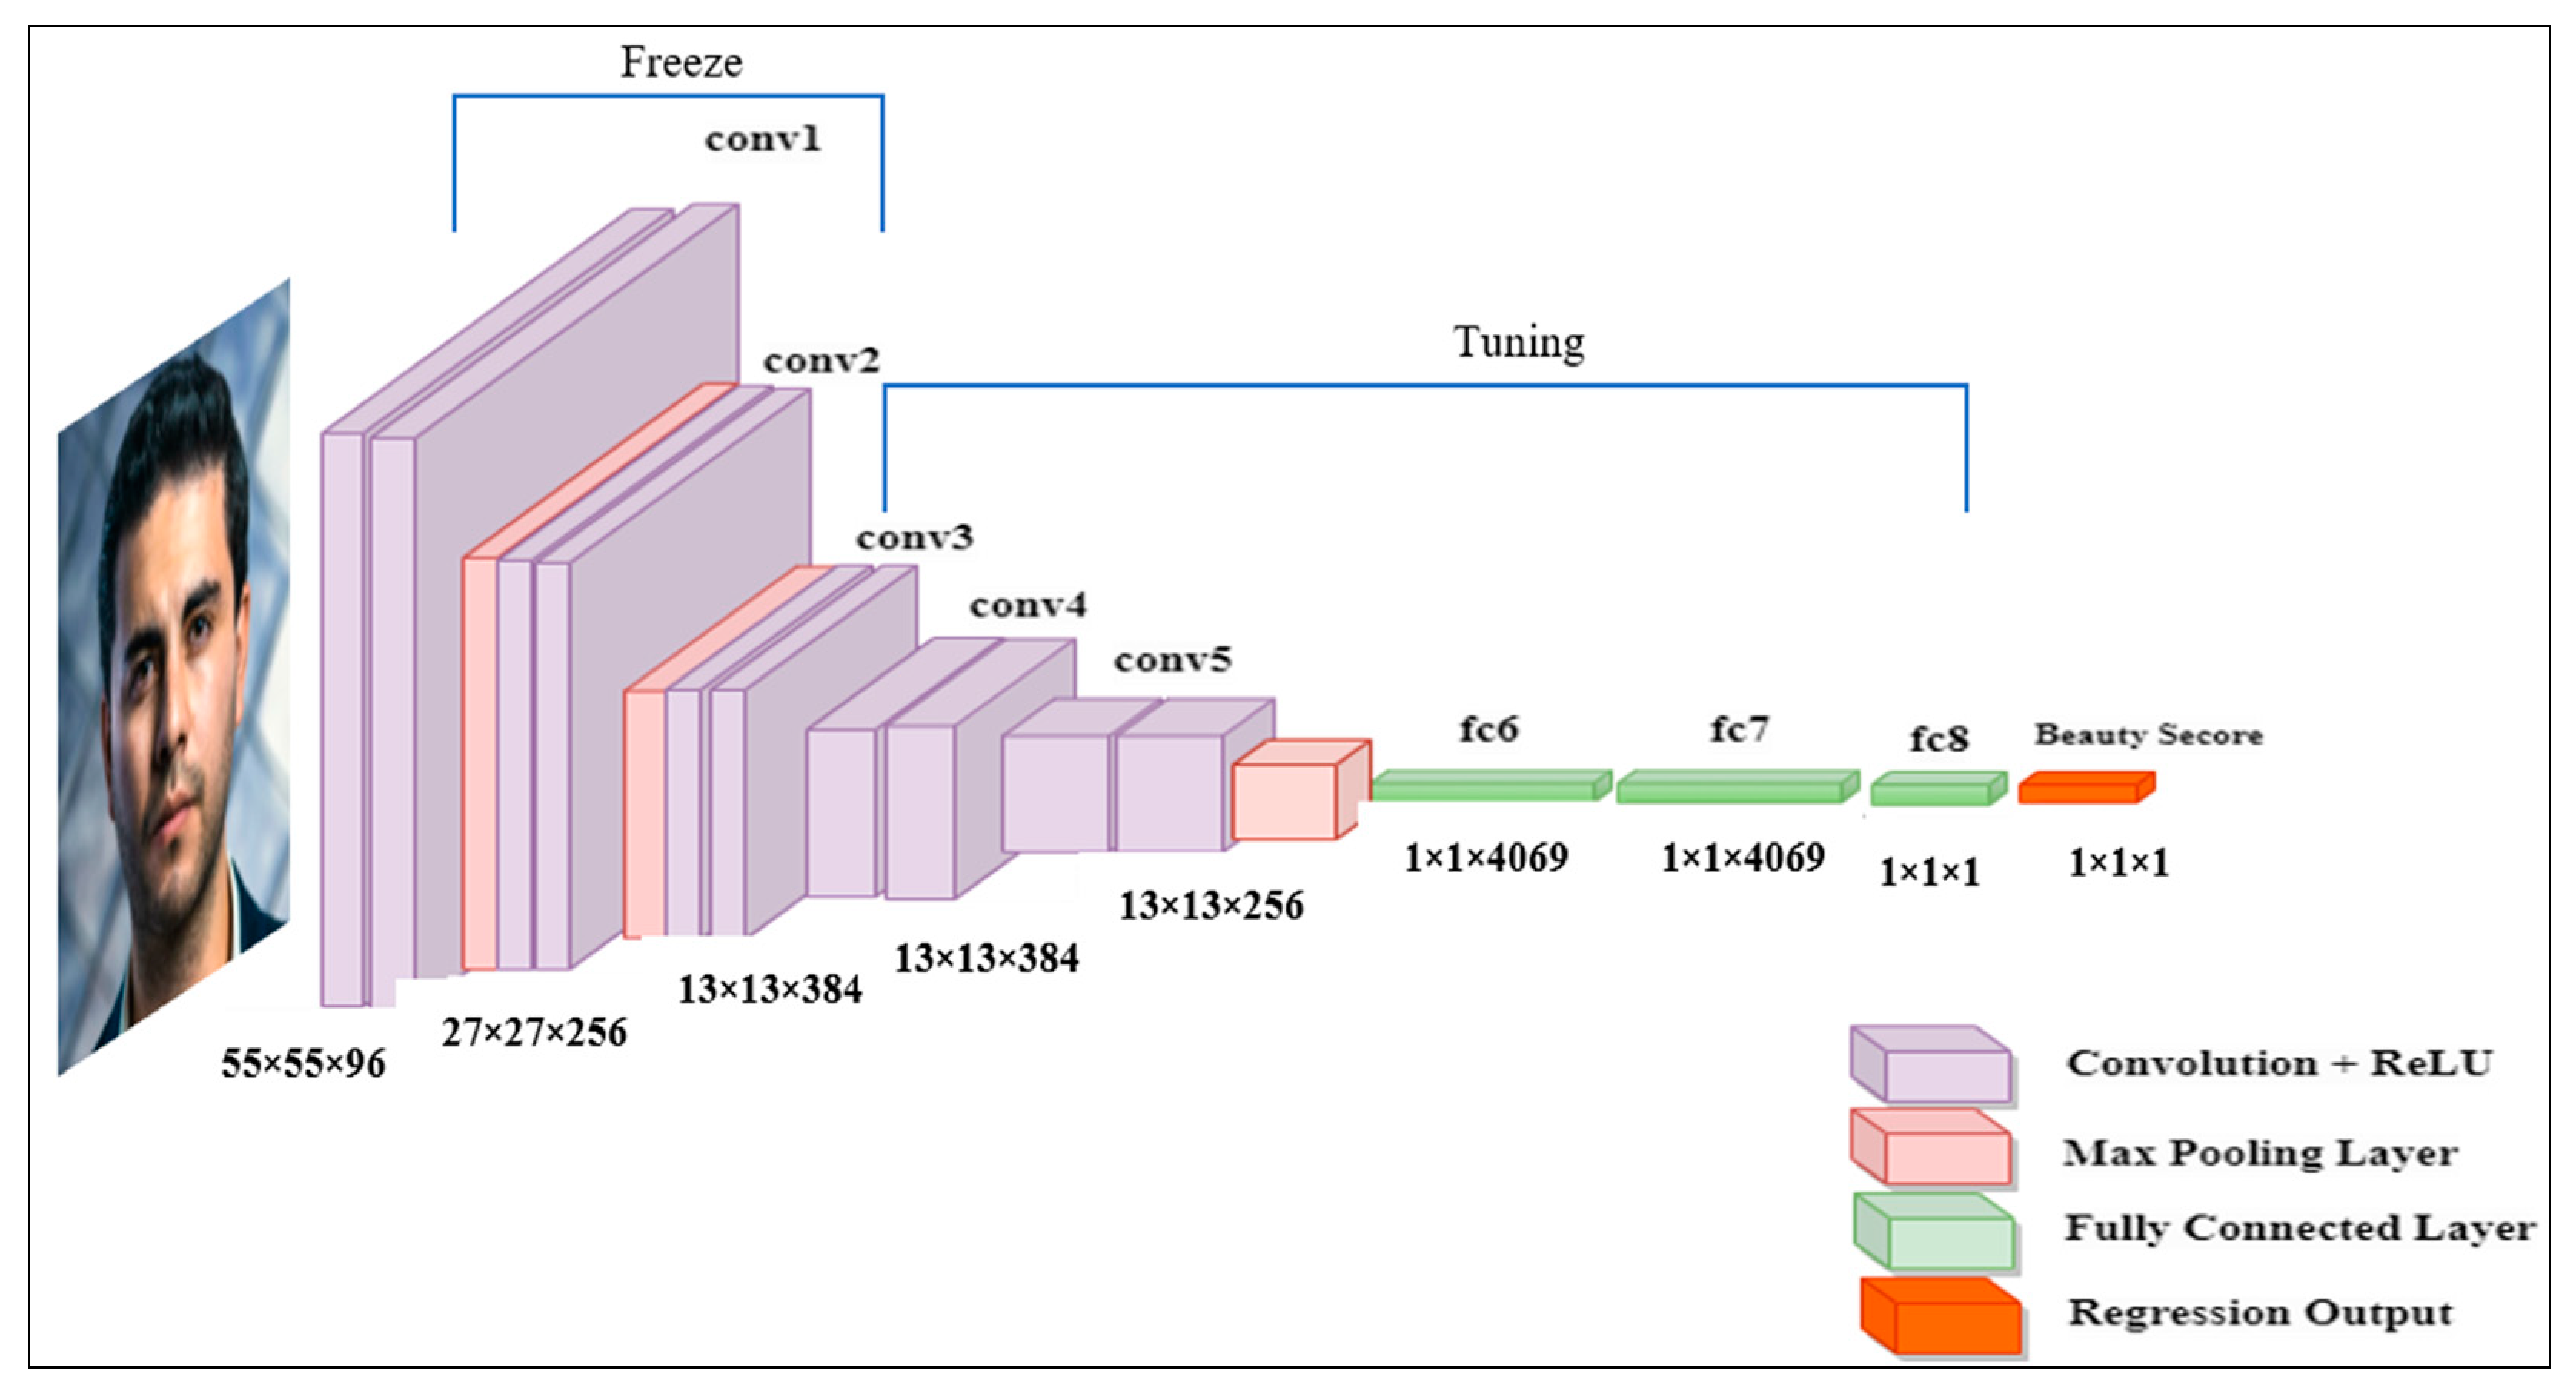
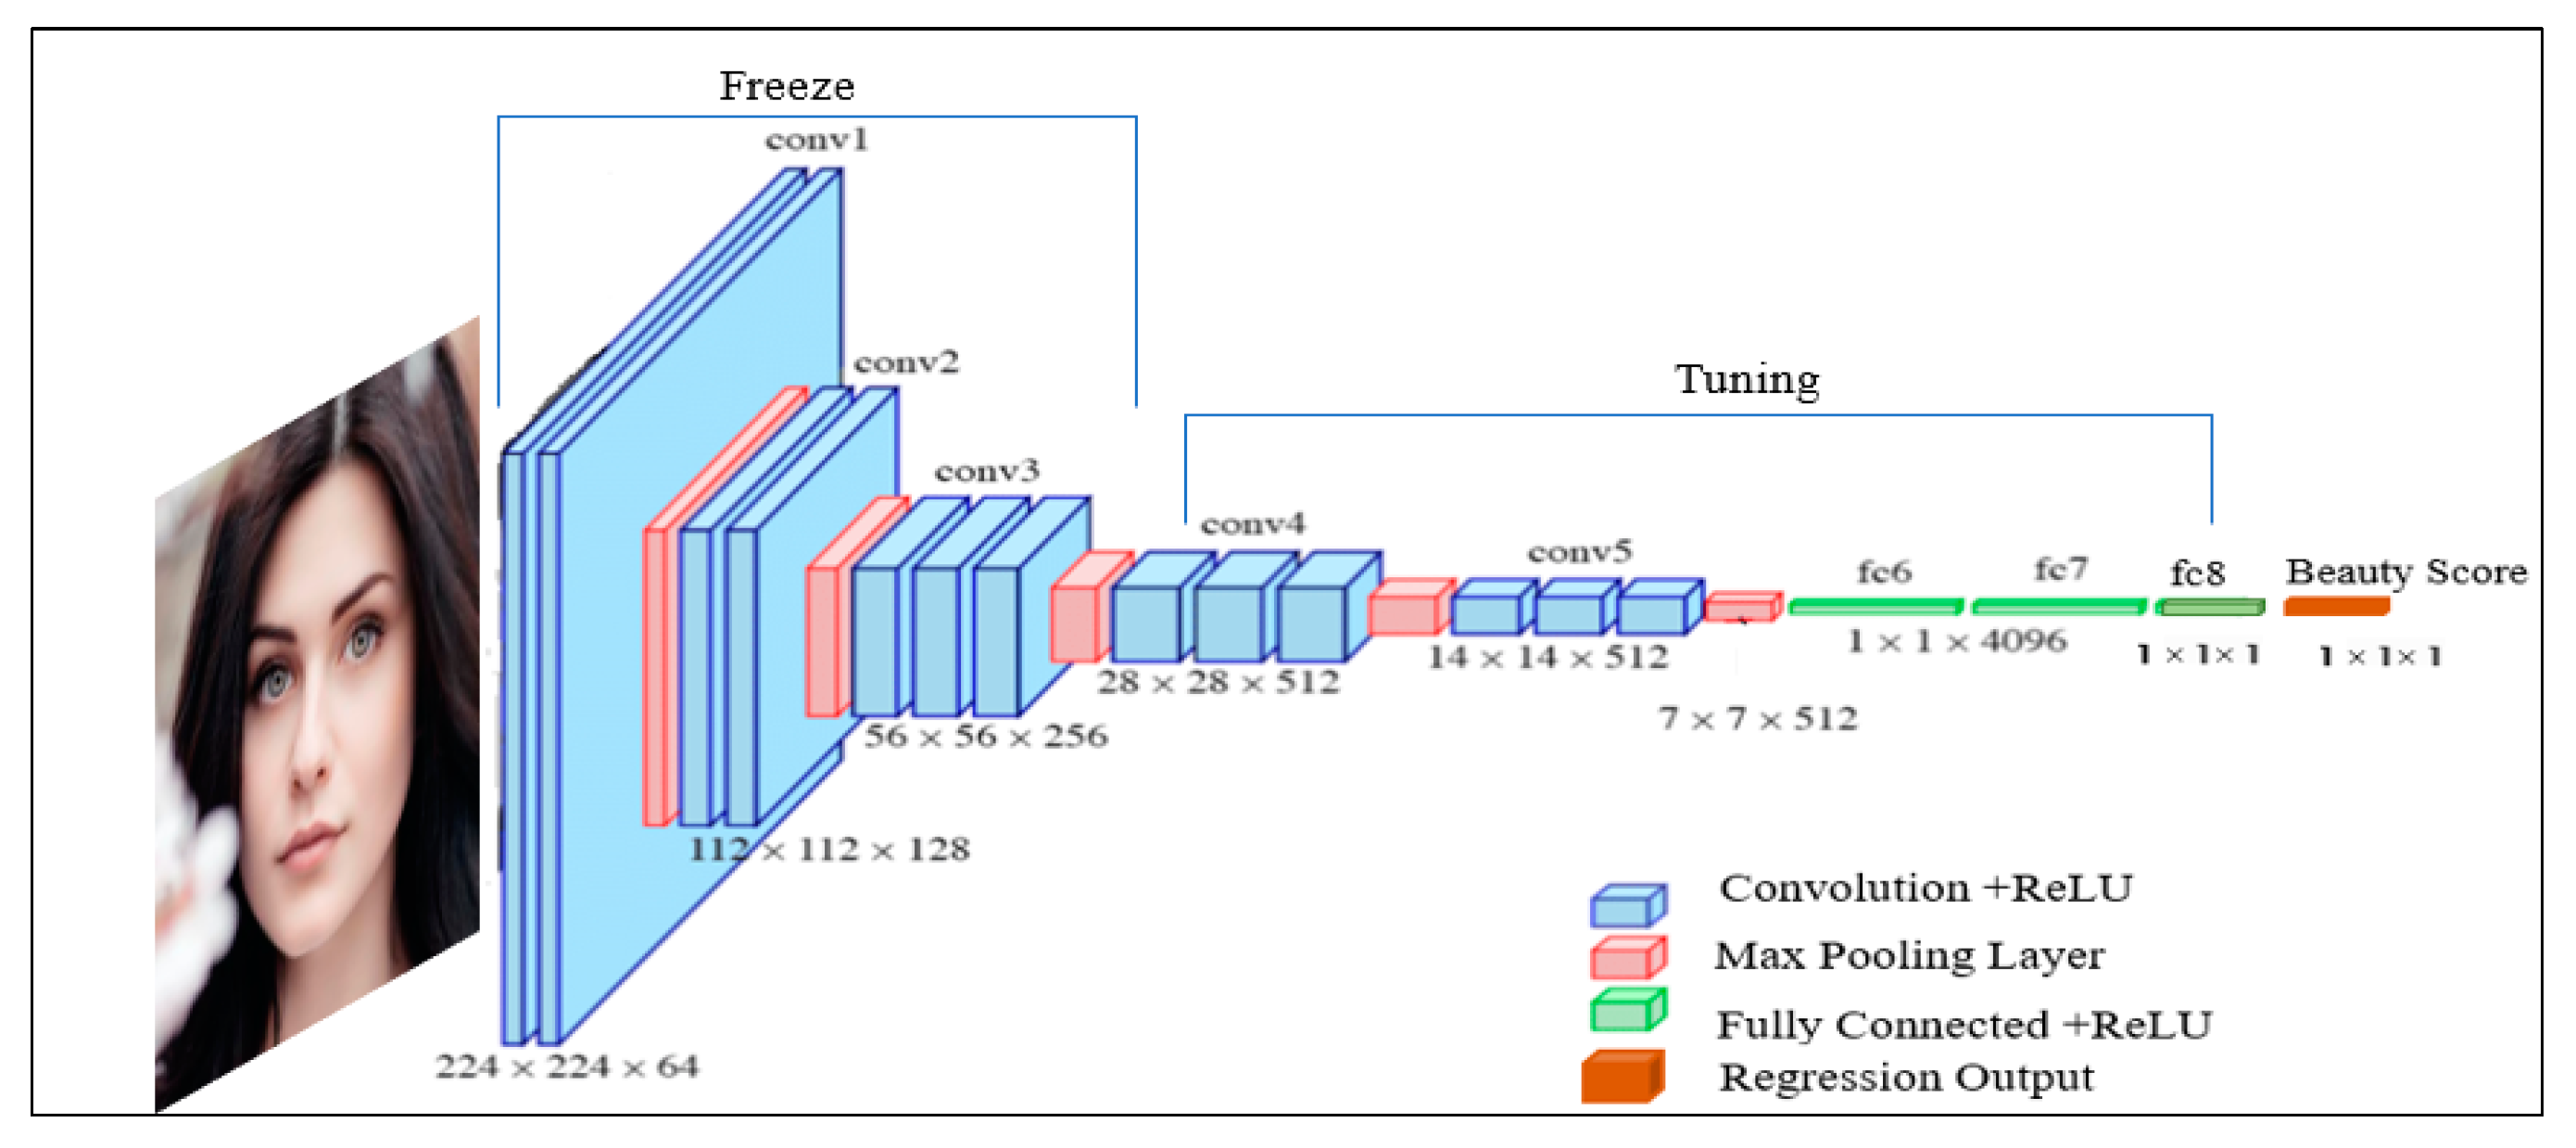
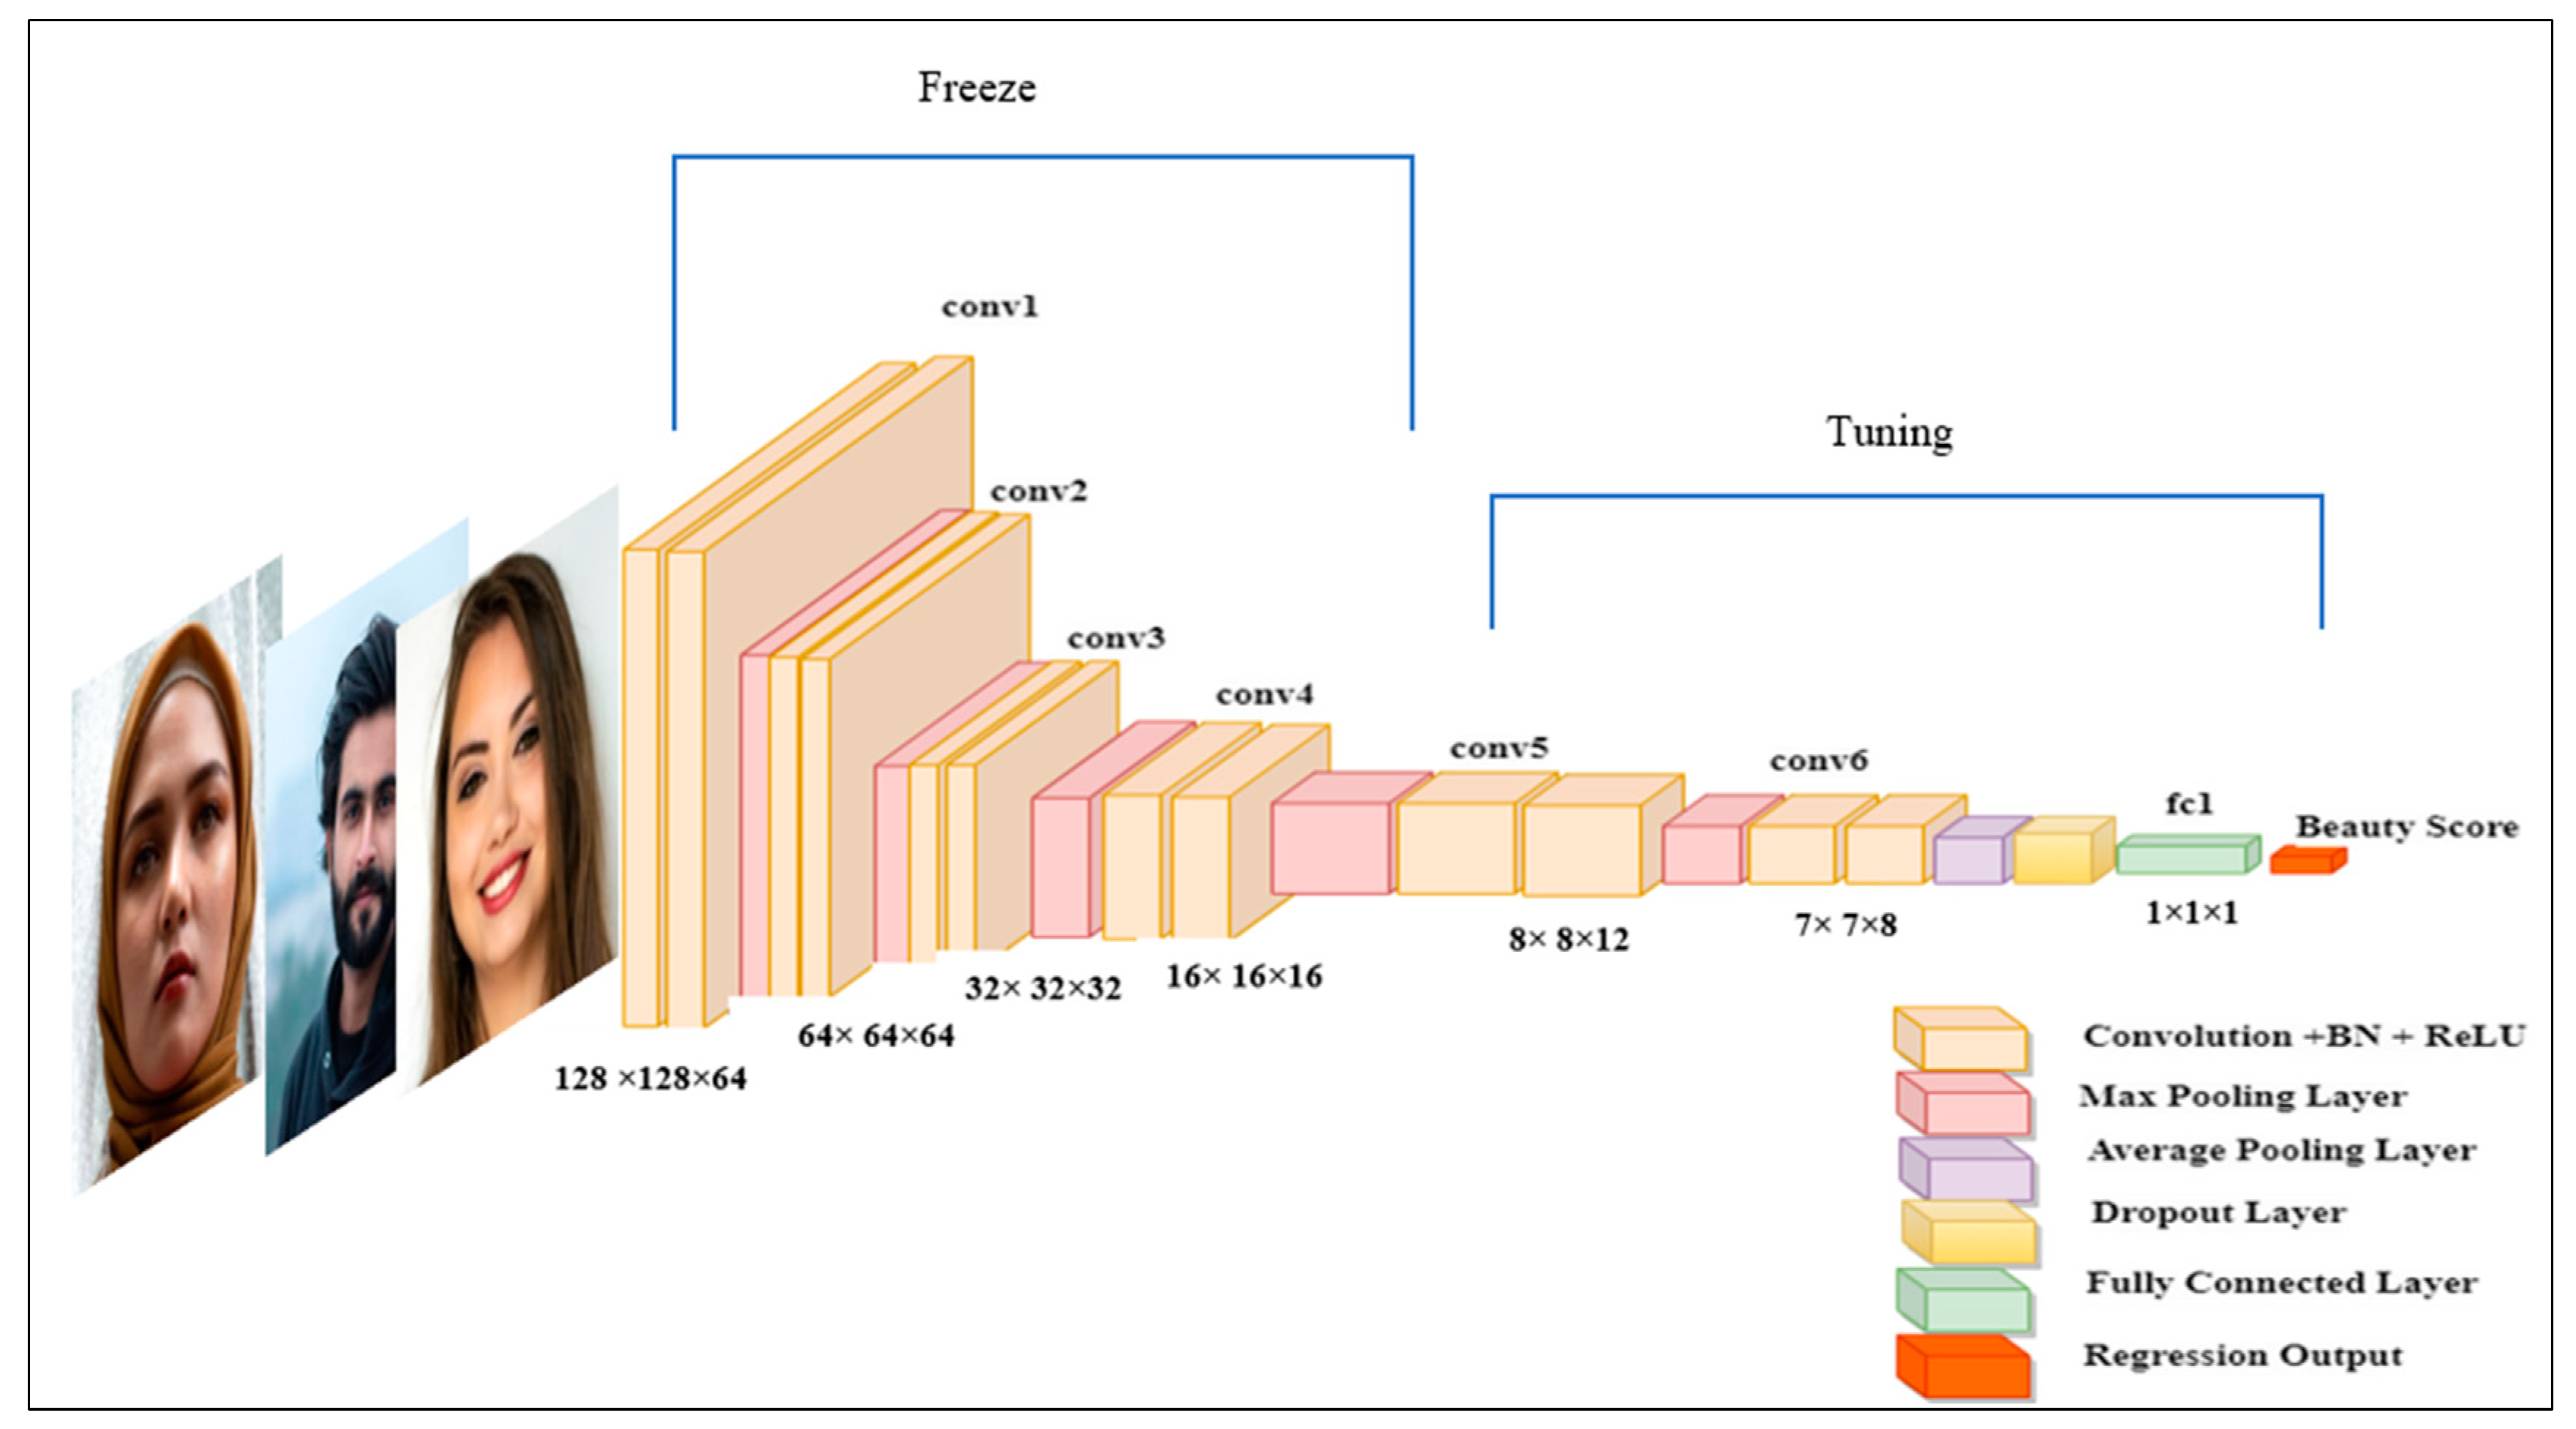
3.4. Beauty Pattern Deep Learning and Knowledge Transfer
| Algorithm 1: The pseudocode of the knowledge-transfer implementation for the proposed models |
| Input: Training, validation sample sets: (Xtrain, y train), and (Xvalidation, y validation). Output: Predicted facial beauty score r: y.
net = pretrainedNetwork; 2. Freeze the required number of layers based on the network’s architecture and its initial task design: numFrozenLayers = desiredNumFrozenLayers; for i = 1:numFrozenLayers net.Layers(i).Trainable = false; End. 3. Remove fully connected layers: net = removeLayers(net, {‘ClassificationLayer_softmax’, ‘fc’}). 4. Replace Softmax and classification layer with a regression-loss function: outputLayer = regressionLayer(‘Name’, ‘regressionLayer’). 5. Add a new fully connected layer for beauty score prediction: numOutputNodes = 1; fc = fullyConnectedLayer(numOutputNodes, ‘Name’, ‘fc’). 6. Adjust hyperparameters and training options. 7. Train the model with 5-fold cross-validation (tuning the rest of the unfrozen layers): numFolds = 5; partitionedData = cvpartition(numSamples, ‘KFold’, numFolds); for fold = 1:numFolds trainingIdx = training(partitionedData, fold); trainingDataFold = augmentedData(trainingIdx).
8. Evaluate model performance on testing data: predictions = predict(trainedModel, validationData); pc = calculatePearsonCorrelation(predictions, validationScores); mae = calculateMeanAbsoluteError(predictions, validationScores); mse = calculateMeanSquaredError(predictions, validationScores).
|
3.4.1. FBP Based on AlexNet
3.4.2. FBP Based on VGG16-Net
3.4.3. FBP Based on FIAC-Net
4. Experimental Results
4.1. Metrics of Evaluation
4.2. Dataset
4.2.1. SCUT-FBP
4.2.2. SCUT-FBP5500
4.2.3. MEBeauty
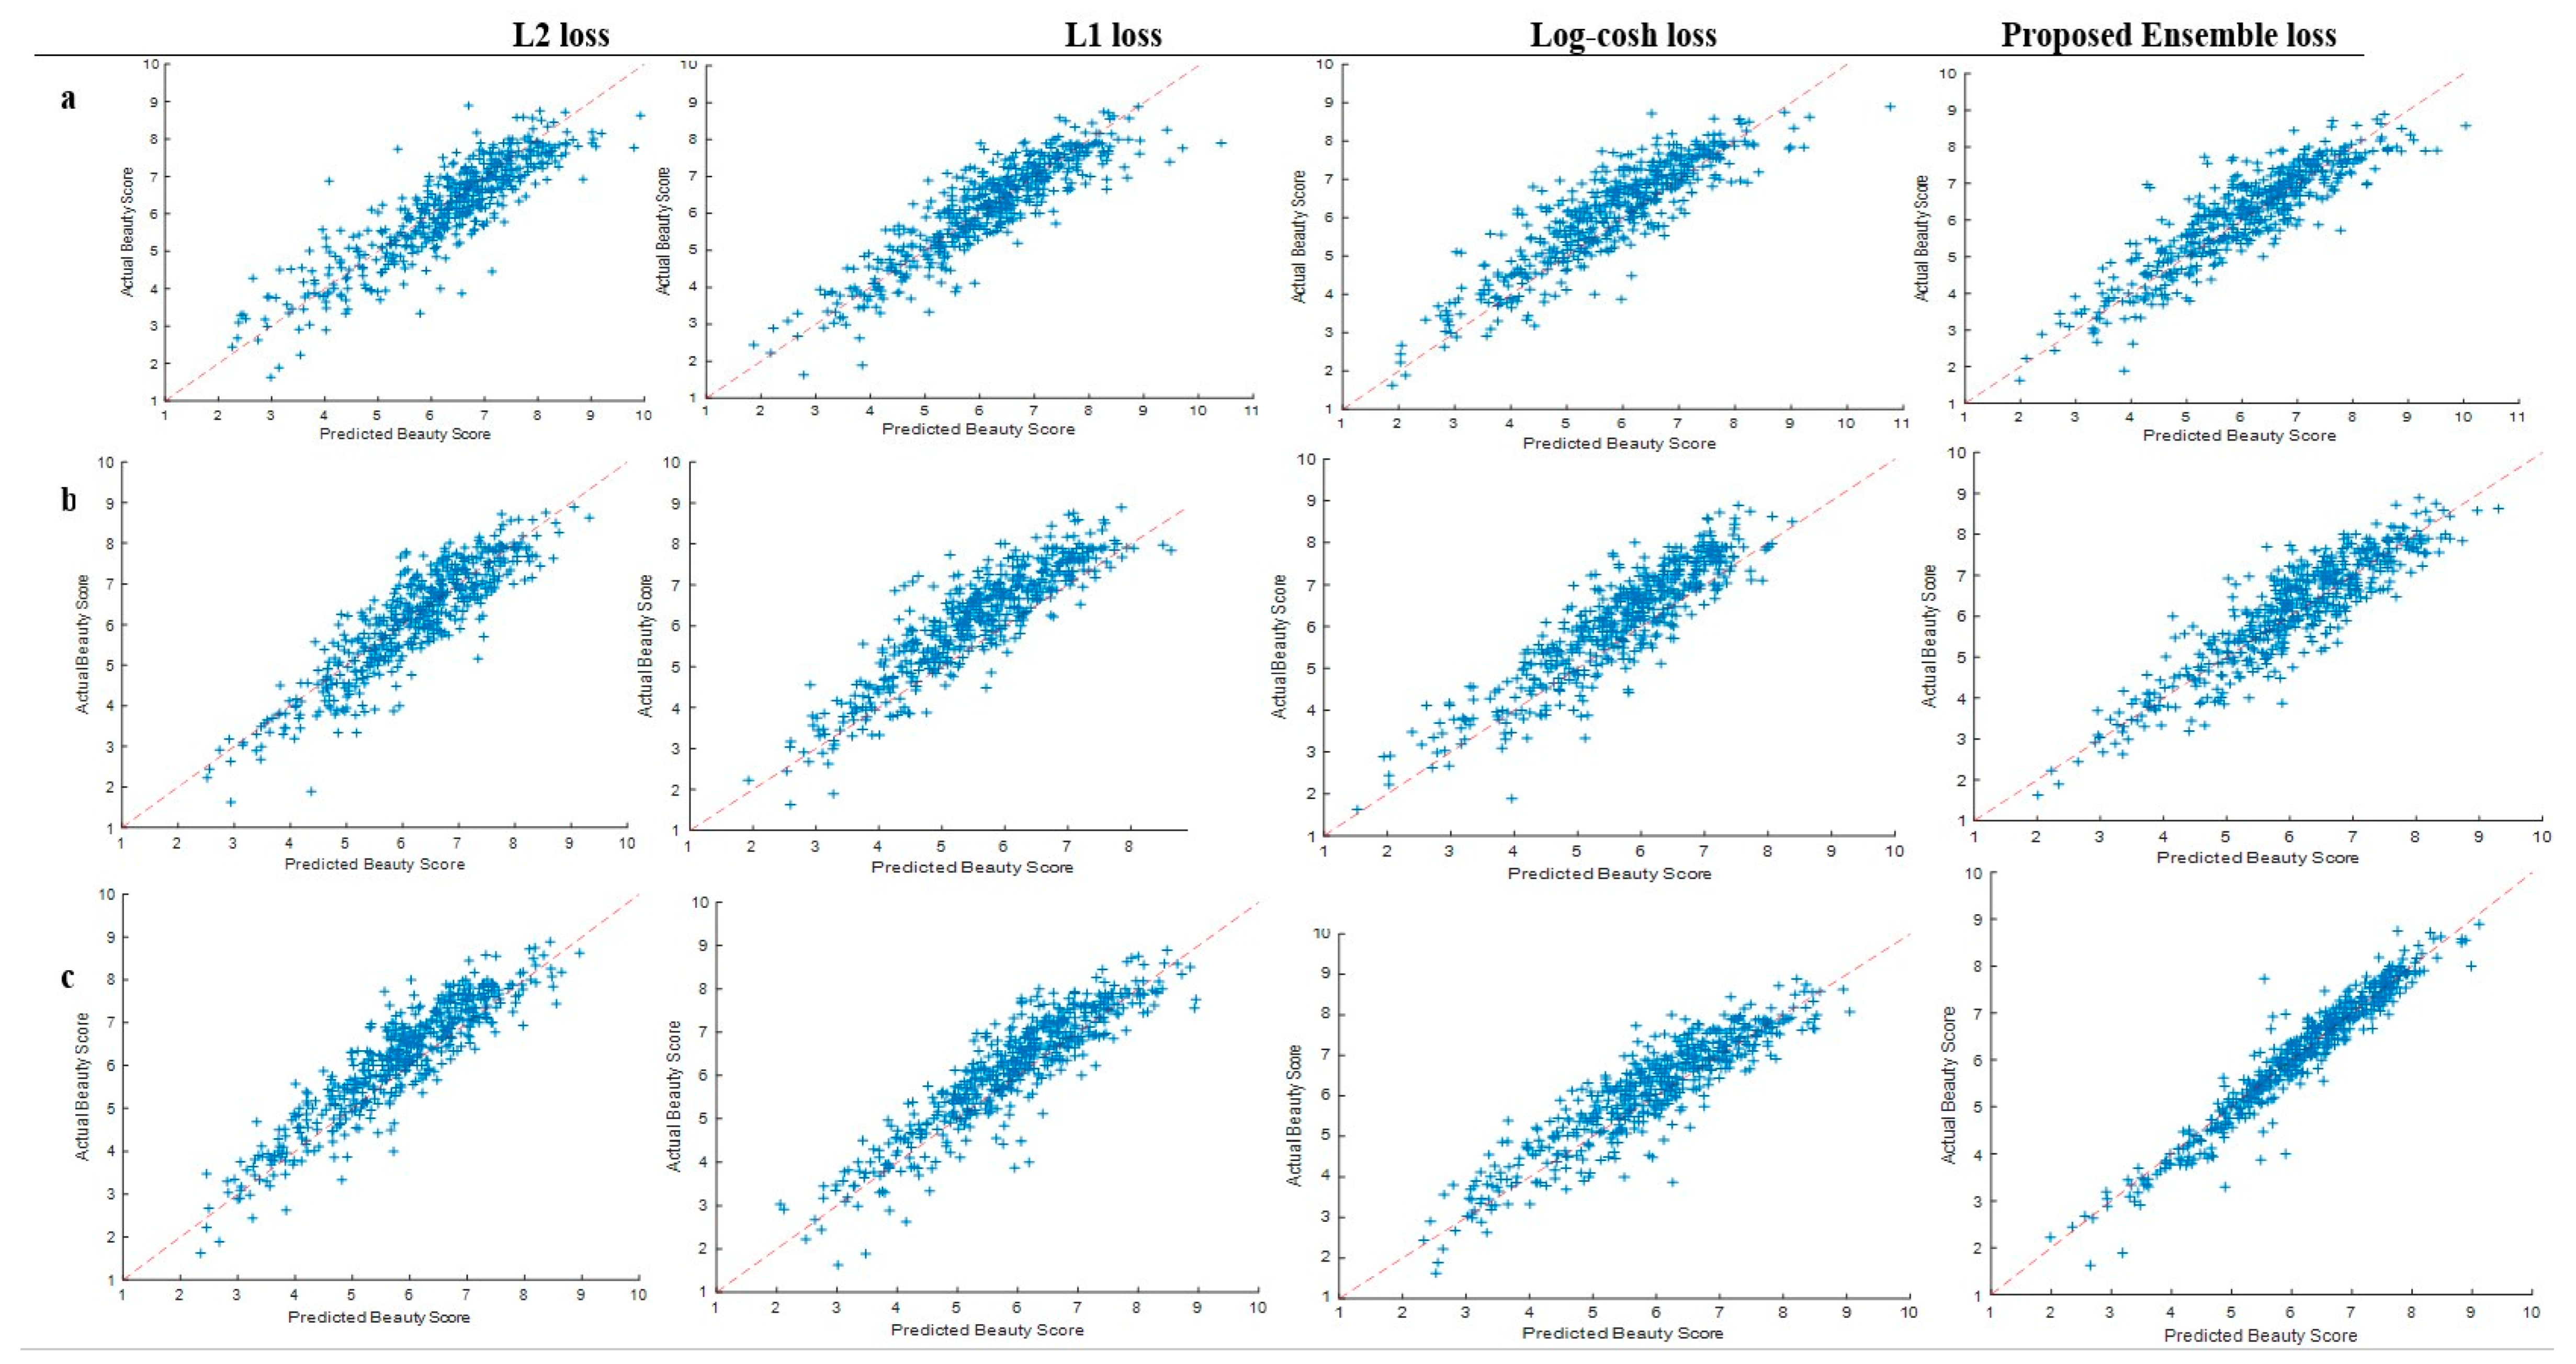
4.3. Performance Evaluation and Discussion
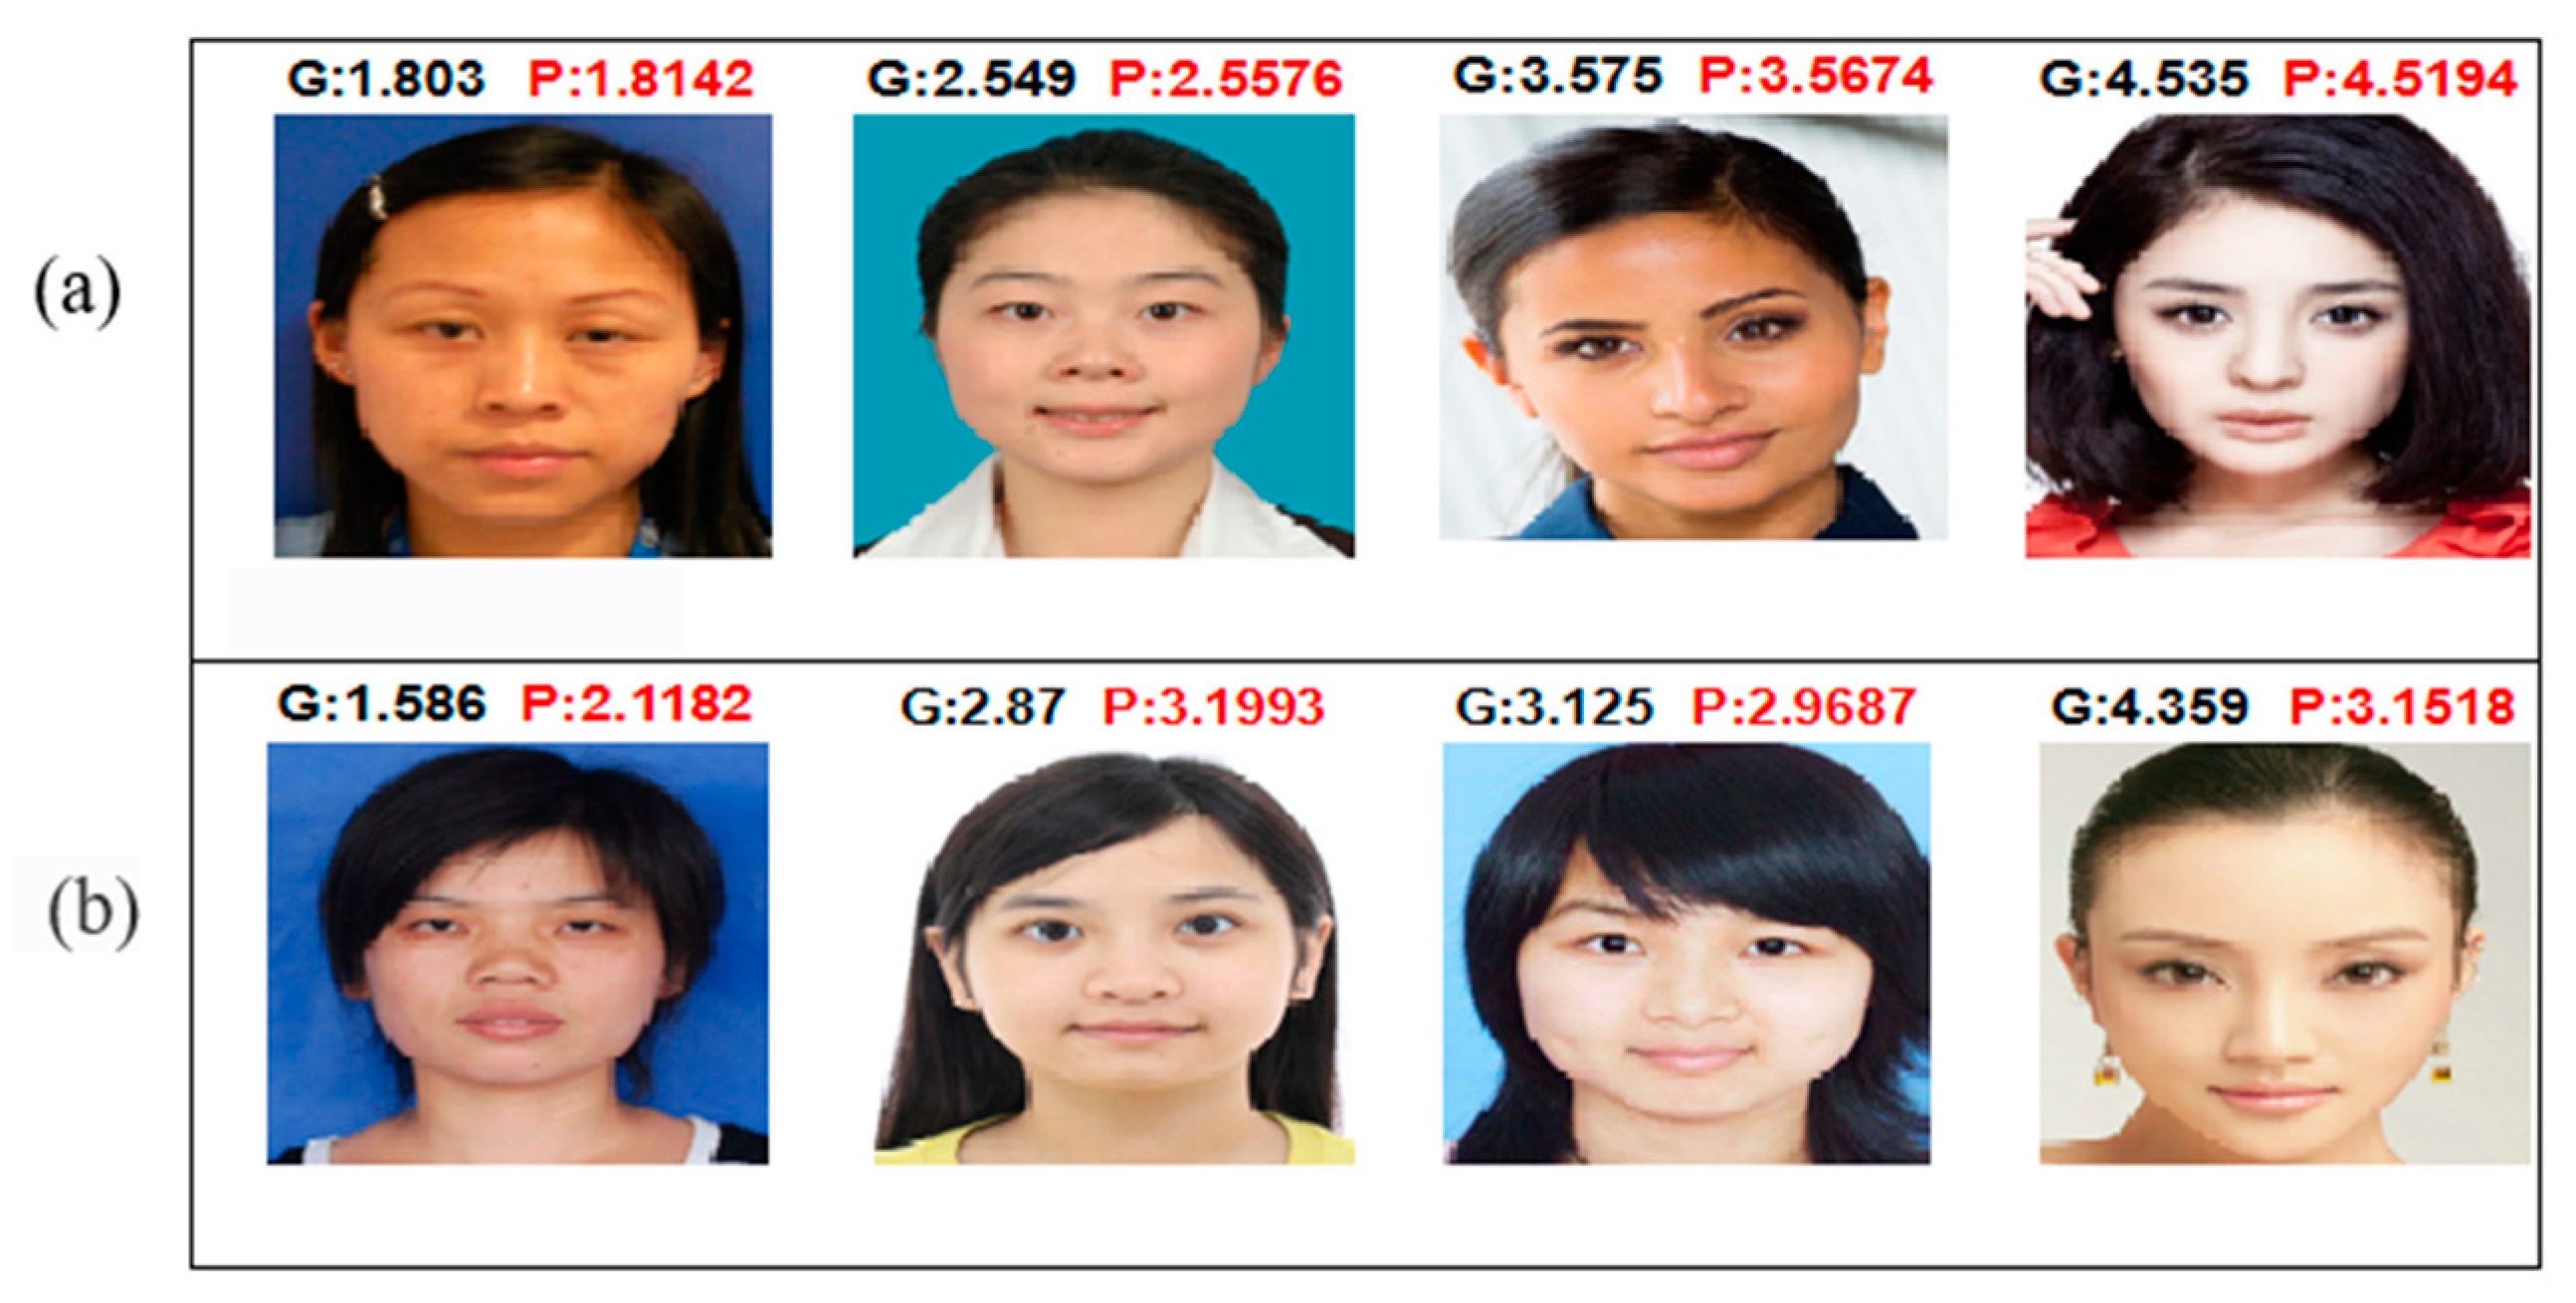
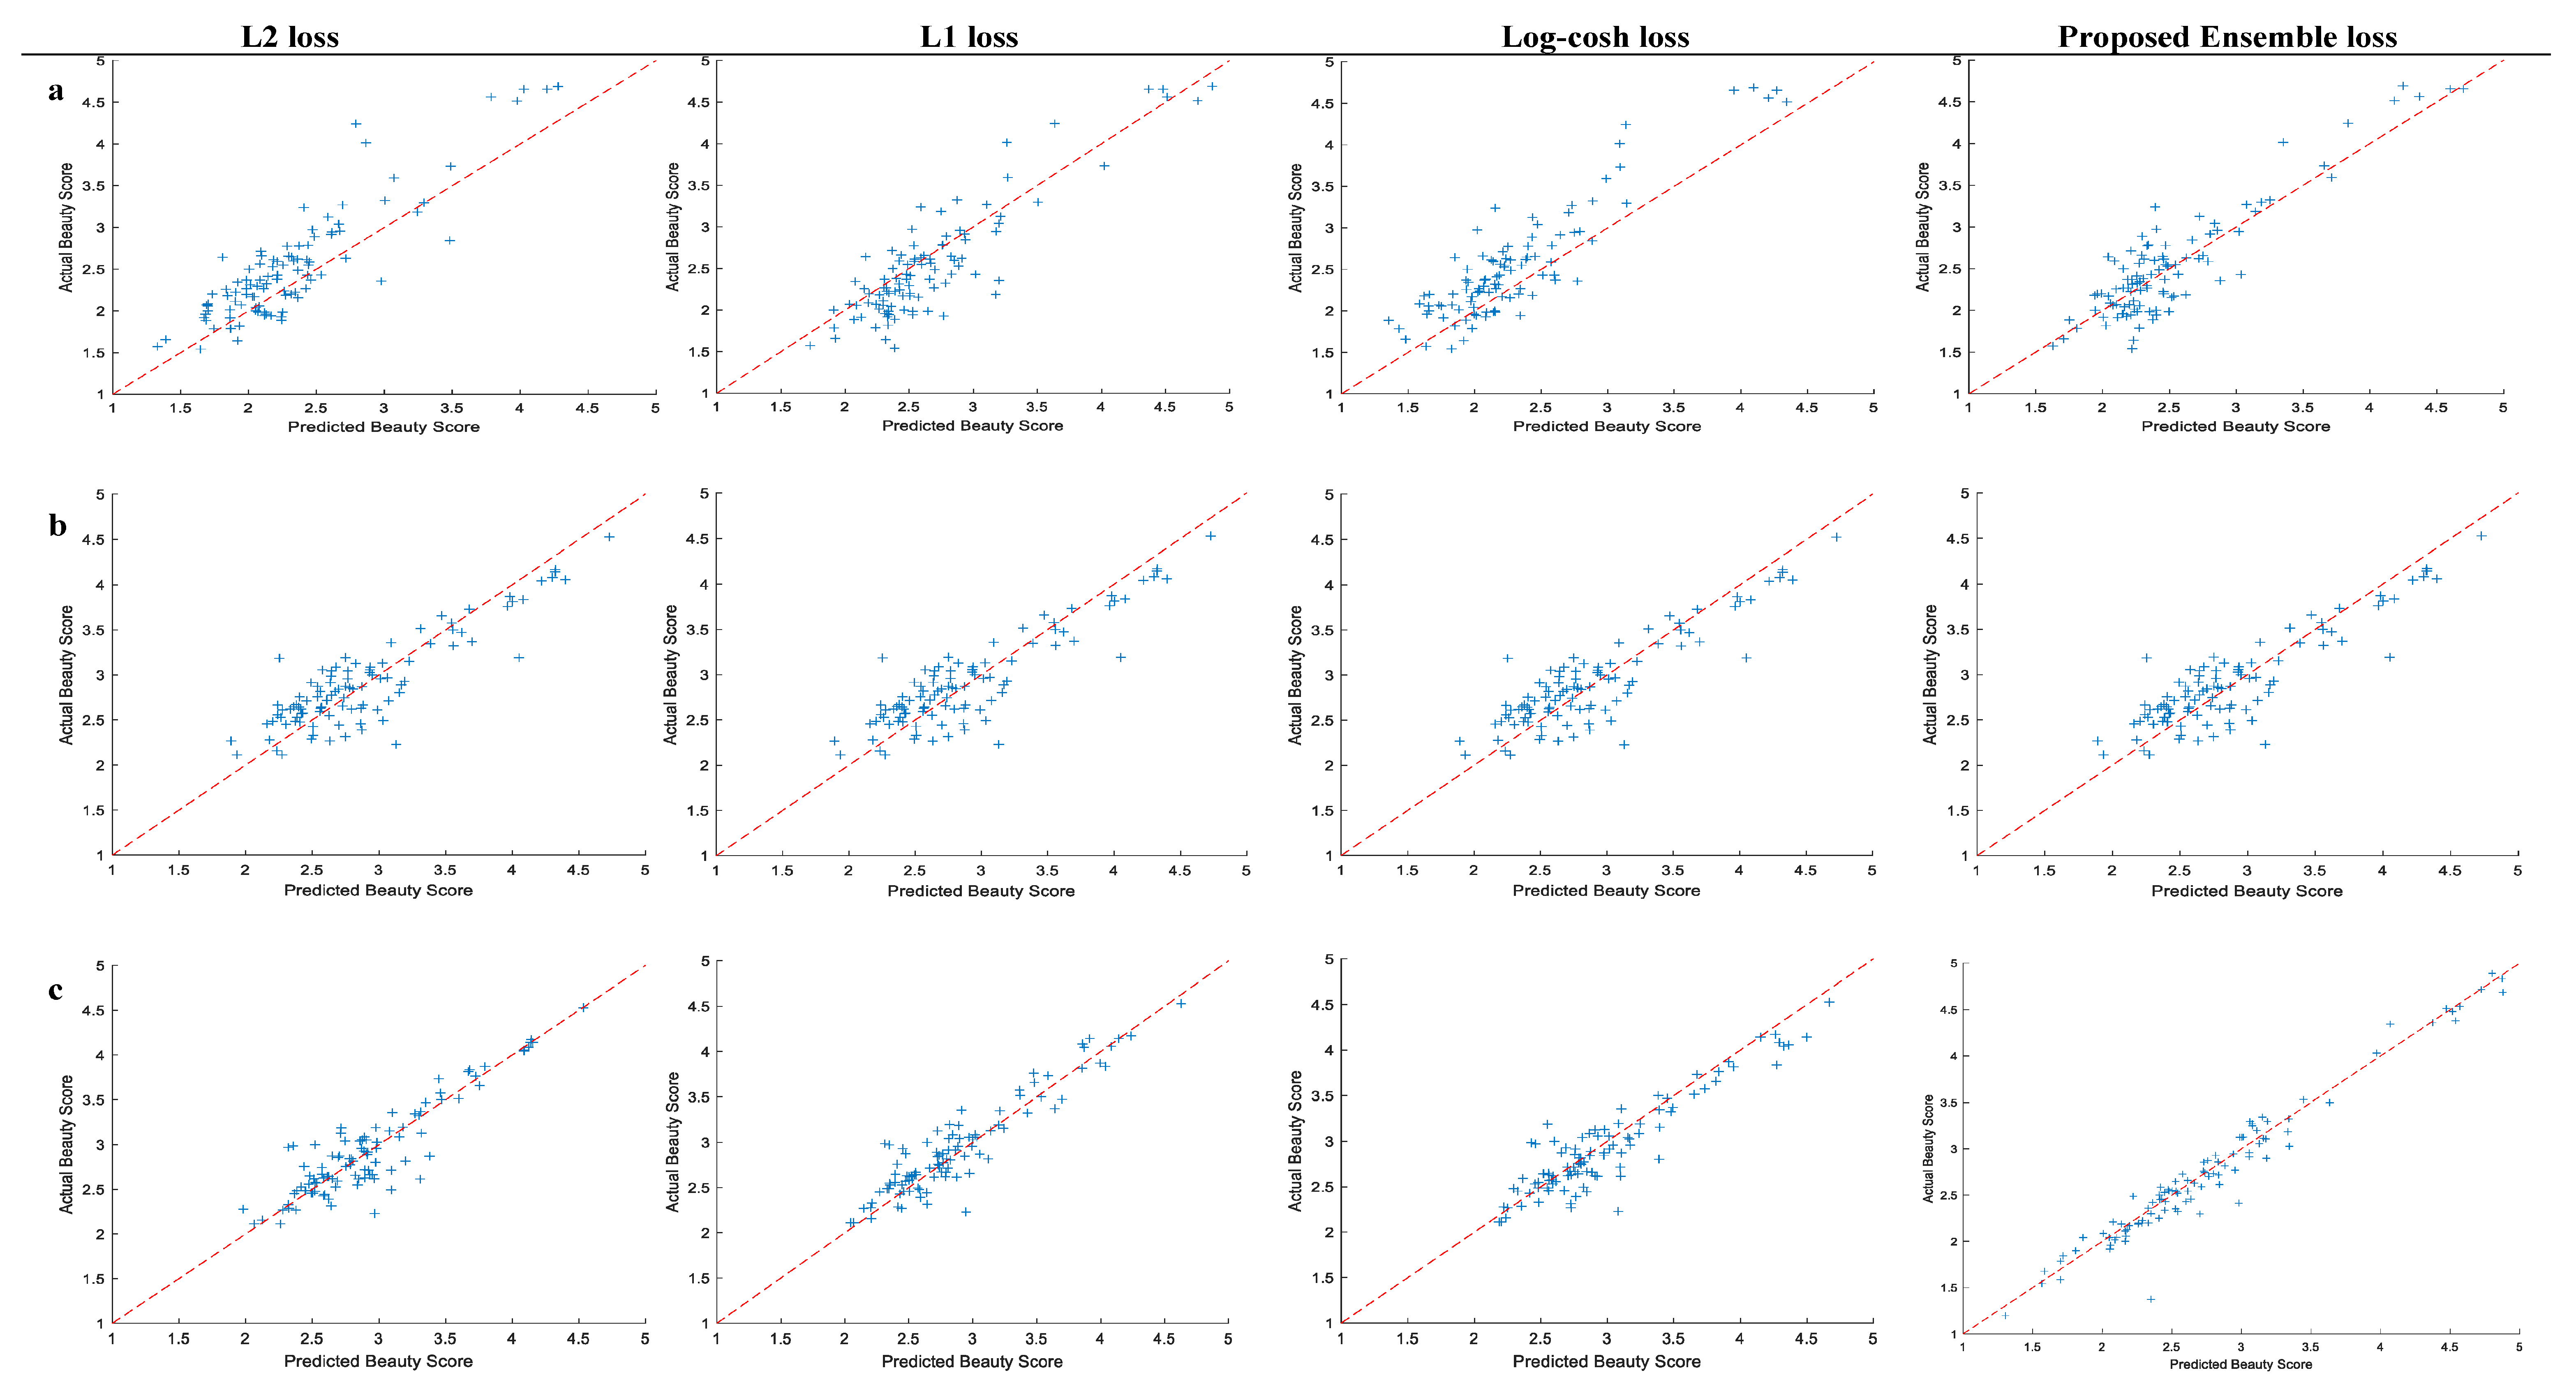
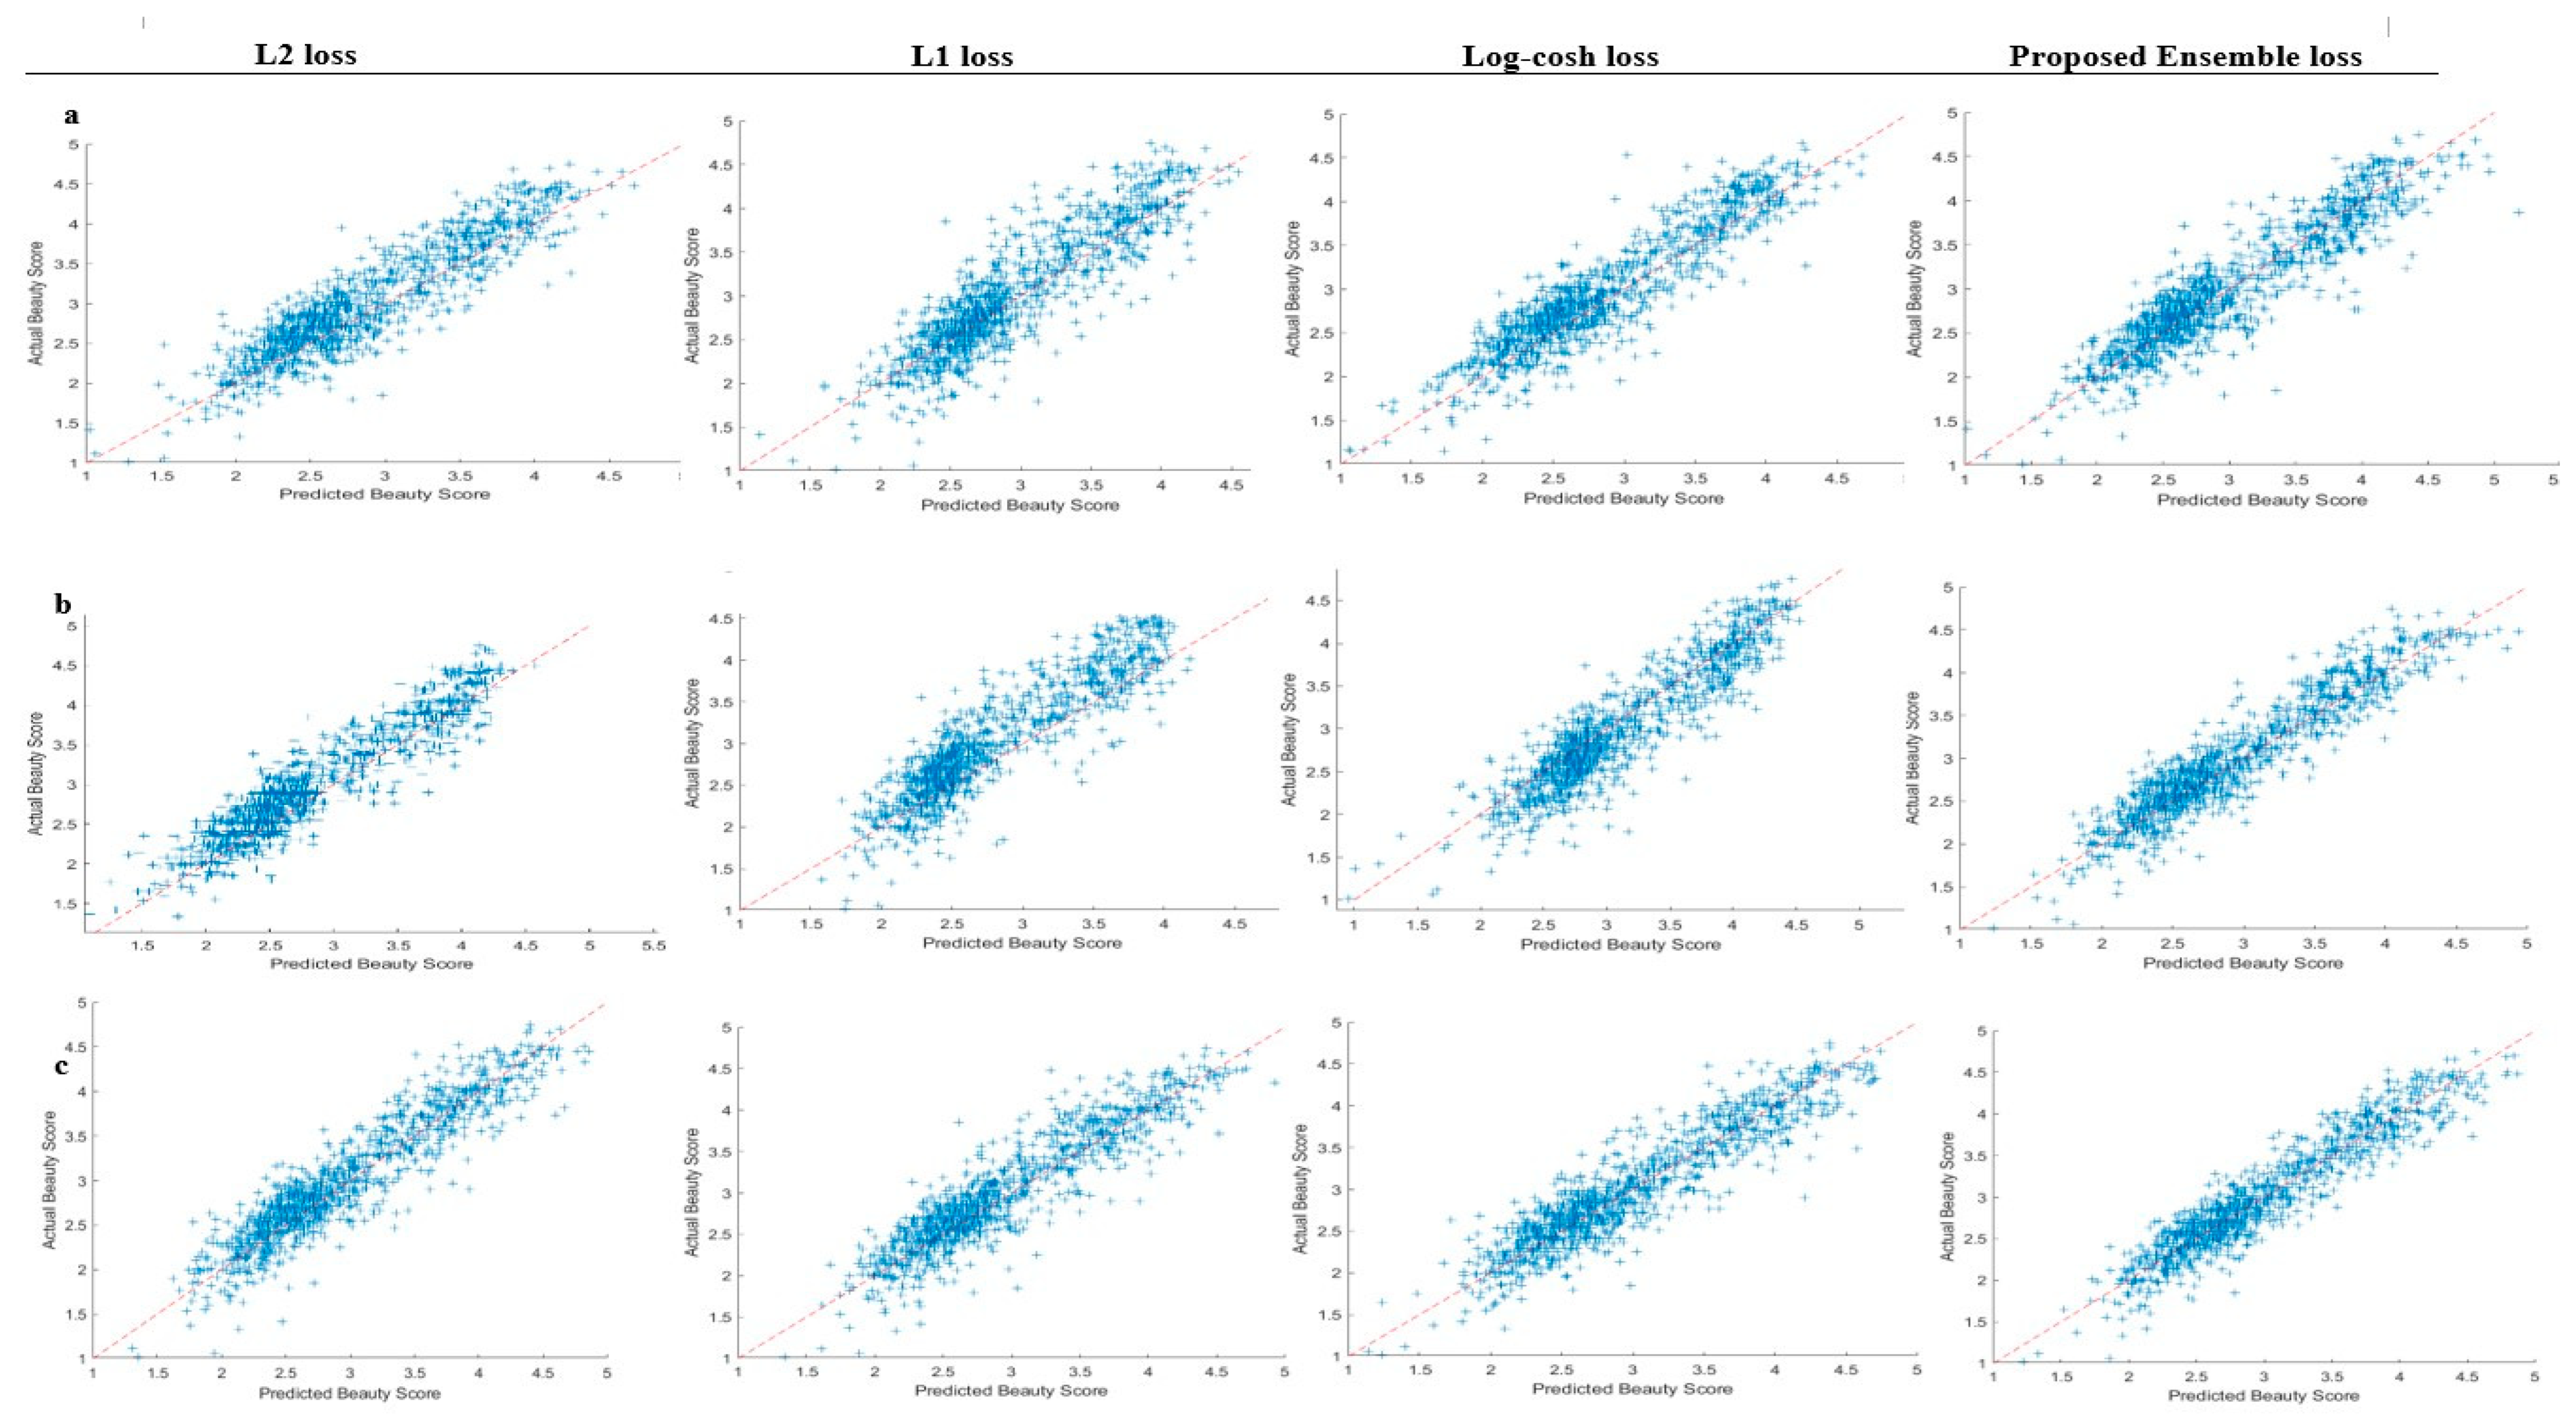
4.3.1. Performance Evaluation on SCUT-FBP
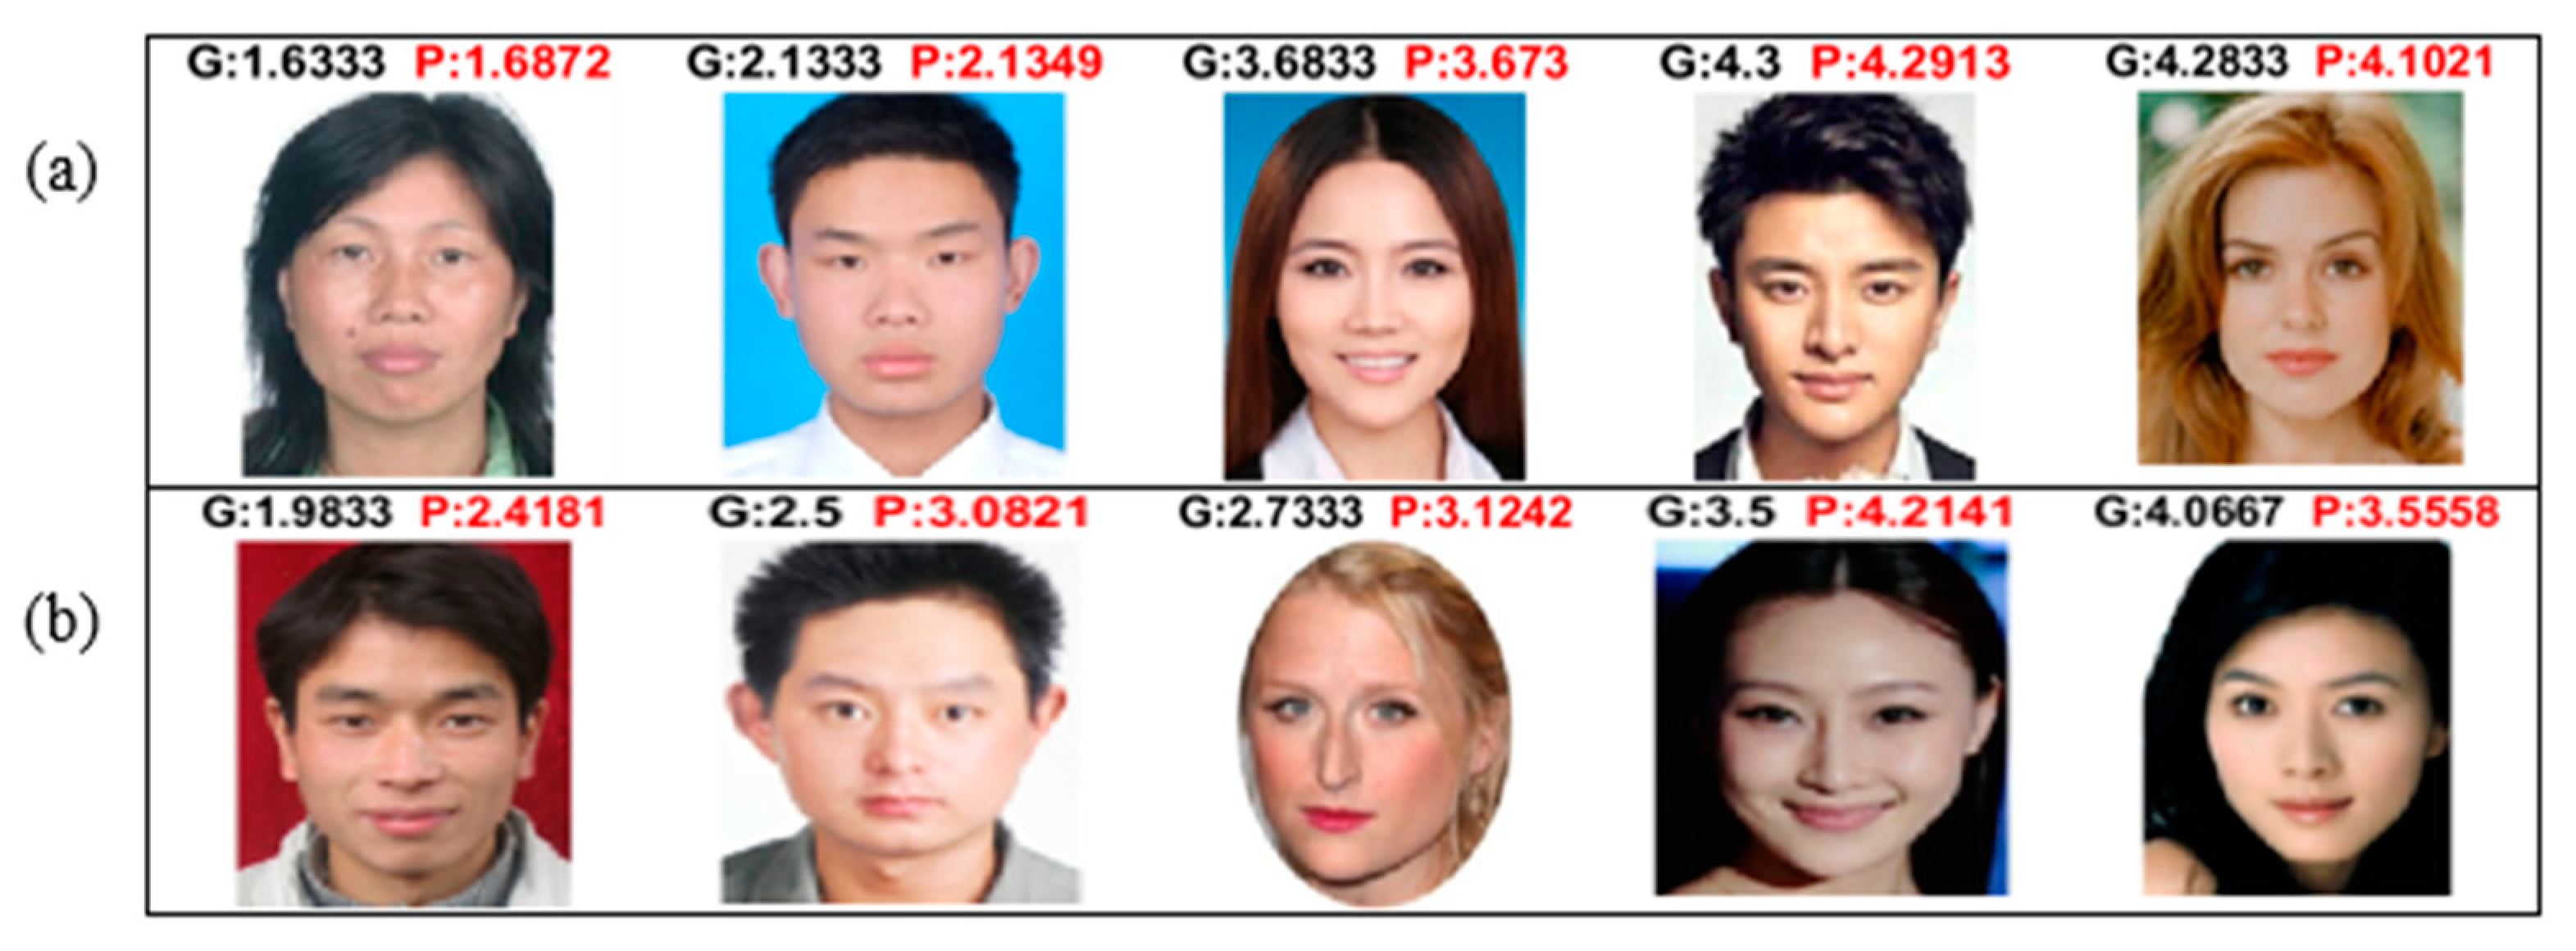
4.3.2. Performance Evaluation on SCUT-FBP5500
4.3.3. Performance Evaluation on MEBeauty
4.4. A Comparison to Other FBP-Related Work
5. Conclusions
Author Contributions
Funding
Data Availability Statement
Conflicts of Interest
References
- Yang, C.-T.; Wang, Y.-C.; Lo, L.-J.; Chiang, W.-C.; Kuang, S.-K.; Lin, H.-H. Implementation of an Attention Mechanism Model for Facial Beauty Assessment Using Transfer Learning. Diagnostics 2023, 13, 1291. [Google Scholar] [CrossRef] [PubMed]
- Gan, J.; Xie, X.; Zhai, Y.; He, G.; Mai, C.; Luo, H. Facial beauty prediction fusing transfer learning and broad learning system. Soft Comput. 2022, 27, 13391–13404. [Google Scholar] [CrossRef]
- Chen, H.; Li, W.; Gao, X.; Xiao, B. Novel Multi-feature Fusion Facial Aesthetic Analysis Framework. IEEE Trans. Big Data 2023, 1–18. [Google Scholar] [CrossRef]
- Moridani, M.K.; Jamiee, N.; Saghafi, S. Human-like evaluation by facial attractiveness intelligent machine. Int. J. Cogn. Comput. Eng. 2023, 4, 160–169. [Google Scholar] [CrossRef]
- Saeed, J.; Abdulazeez, A.M. Facial Beauty Prediction and Analysis Based on Deep Convolutional Neural Network: A Review. J. Soft Comput. Data Min. 2021, 2, 1–12. [Google Scholar] [CrossRef]
- Liao, Y.; Deng, W. Deep Rank Learning for Facial Attractiveness. In Proceedings of the 2017 4th IAPR Asian Conference on Pattern Recognition (ACPR), Nanjing, China, 26–29 November 2017. [Google Scholar]
- Belagiannis, V.; Rupprecht, C.; Carneiro, G.; Navab, N. Robust optimization for deep regression. In Proceedings of the IEEE International Conference on Computer Vision, Santiago, Chile, 7–13 December 2015. [Google Scholar]
- Moshagen, T.; Adde, N.A.; Rajgopal, A.N. Finding hidden-feature depending laws inside a data set and classifying it using Neural Network. arXiv 2021, arXiv:2101.10427. [Google Scholar]
- Karal, O. Maximum likelihood optimal and robust support vector regression with lncosh loss function. Neural Netw. 2017, 94, 1–12. [Google Scholar] [CrossRef]
- Huber, P.J. Robust estimation of a location parameter. In Breakthroughs in Statistics: Methodology and Distribution; Springer: Berline, Germany, 1992; pp. 492–518. [Google Scholar]
- Black, M.J.; Rangarajan, A. On the unification of line processes, outlier rejection, and robust statistics with applications in early vision. Int. J. Comput. Vis. 1996, 19, 57–91. [Google Scholar] [CrossRef]
- Merentitis, A.; Debes, C.; Heremans, R. Ensemble learning in hyperspectral image classification: Toward selecting a favorable bias-variance tradeoff. IEEE J. Sel. Top. Appl. Earth Obs. Remote Sens. 2014, 7, 1089–1102. [Google Scholar] [CrossRef]
- BenTaieb, A.; Kawahara, J.; Hamarneh, G. Multi-loss convolutional networks for gland analysis in microscopy. In Proceedings of the 2016 IEEE 13th International Symposium on Biomedical Imaging (ISBI), Prague, Czech Republic, 13–16 April 2016. [Google Scholar]
- Hajiabadi, H.; Molla-Aliod, D.; Monsefi, R. On extending neural networks with loss ensembles for text classification. arXiv 2017, arXiv:1711.05170. [Google Scholar]
- Xu, L.; Xiang, J. Comboloss for facial attractiveness analysis with squeeze-and-excitation networks. arXiv 2020, arXiv:2010.10721. [Google Scholar]
- Anderson, R.; Gema, A.P.; Isa, S.M. Facial attractiveness classification using deep learning. In Proceedings of the 2018 Indonesian Association for Pattern Recognition International Conference (INAPR), Jakarta, Indonesia, 7–8 September 2018. [Google Scholar]
- Dornaika, F.; Moujahid, A.; Wang, K.; Feng, X. Efficient deep discriminant embedding: Application to face beauty prediction and classification. Eng. Appl. Artif. Intell. 2020, 95, 103831. [Google Scholar] [CrossRef]
- Xu, L.; Xiang, J.; Yuan, X. CRNet: Classification and regression neural network for facial beauty prediction. In Pacific Rim Conference on Multimedia; Springer: Berlin/Heidelberg, Germany, 2018. [Google Scholar]
- Chen, F.; Zhang, D.; Wang, C.; Duan, X. Comparison and fusion of multiple types of features for image-based facial beauty prediction. In Chinese Conference on Biometric Recognition; Springer: Berlin/Heidelberg, Germany, 2017. [Google Scholar]
- Dantcheva, A.; Dugelay, J.-L. Assessment of female facial beauty based on anthropometric, non-permanent and acquisition characteristics. Multimed. Tools Appl. 2014, 74, 11331–11355. [Google Scholar] [CrossRef]
- Altwaijry, H.; Belongie, S. Relative ranking of facial attractiveness. In Proceedings of the 2013 IEEE Workshop on Applications of Computer Vision (WACV), Clearwater Beach, FL, USA, 15–17 January 2013. [Google Scholar]
- Lin, L.; Liang, L.; Jin, L. Regression guided by relative ranking using convolutional neural network (R3CNN) for facial beauty prediction. IEEE Trans. Affect. Comput. 2019, 13, 122–134. [Google Scholar] [CrossRef]
- Hong, Y.-J.; Nam, G.P.; Choi, H.; Cho, J.; Kim, I.-J. A Novel Framework for Assessing Facial Attractiveness Based on Facial Proportions. Symmetry 2017, 9, 294. [Google Scholar] [CrossRef]
- Xu, J.; Jin, L.; Liang, L.; Feng, Z.; Xie, D. A new humanlike facial attractiveness predictor with cascaded fine-tuning deep learning model. arXiv 2015, arXiv:1511.02465. [Google Scholar]
- Chen, F.; Xiao, X.; Zhang, D. Data-driven facial beauty analysis: Prediction, retrieval and manipulation. IEEE Trans. Affect. Comput. 2016, 9, 205–216. [Google Scholar] [CrossRef]
- Zhai, Y.; Yu, C.; Qin, C.; Zhou, W.; Ke, Q.; Gan, J.; Labati, R.D.; Piuri, V.; Scotti, F. Facial Beauty Prediction via Local Feature Fusion and Broad Learning System. IEEE Access 2020, 8, 218444–218457. [Google Scholar] [CrossRef]
- Iyer, T.J.; Nersisson, R.; Zhuang, Z.; Joseph Raj, A.N.; Refayee, I. Machine Learning-Based Facial Beauty Prediction and Analysis of Frontal Facial Images Using Facial Landmarks and Traditional Image Descriptors. Comput. Intell. Neurosci. 2021, 2021, 4423407. [Google Scholar] [CrossRef]
- Saeed, J.N.; Abdulazeez, A.M.; Ibrahim, D.A. An Ensemble DCNNs-Based Regression Model for Automatic Facial Beauty Prediction and Analyzation. Trait. Signal 2023, 40, 55–63. [Google Scholar] [CrossRef]
- Xu, L.; Xiang, J.; Yuan, X. Transferring rich deep features for facial beauty prediction. arXiv 2018, arXiv:1803.07253. [Google Scholar]
- Lebedeva, I.; Guo, Y.; Ying, F. Deep facial features for personalized attractiveness prediction. SPIE 2021, 11878, 72–80. [Google Scholar]
- Gao, L.; Li, W.; Huang, Z.; Huang, D.; Wang, Y. Automatic facial attractiveness prediction by deep multi-task learning. In Proceedings of the 2018 24th International Conference on Pattern Recognition (ICPR), Beijing, China, 20–24 August 2018. [Google Scholar]
- Xu, L.; Fan, H.; Xiang, J. Hierarchical multi-task network for race, gender and facial attractiveness recognition. In Proceedings of the 2019 IEEE International Conference on Image Processing (ICIP), Taipei, Taiwan, 22–25 September 2019. [Google Scholar]
- Lebedeva, I.; Guo, Y.; Ying, F. MEBeauty: A multi-ethnic facial beauty dataset in-the-wild. Neural Comput. Appl. 2022, 34, 14169–14183. [Google Scholar] [CrossRef]
- Zhai, Y.; Huang, Y.; Xu, Y.; Gan, J.; Cao, H.; Deng, W.; Labati, R.D.; Piuri, V.; Scotti, F. Asian female facial beauty prediction using deep neural networks via transfer learning and multi-channel feature fusion. IEEE Access 2020, 8, 56892–56907. [Google Scholar] [CrossRef]
- Dornaika, F.; Bougourzi, F.; Taleb-Ahmed, A.; Distante, C. Facial Beauty Prediction Using Hybrid CNN Architectures and Dynamic Robust Loss Function. In Proceedings of the International Conference on Pattern Recognition Workshop: Deep Learning for Visual Detection and Recognition, Montreal, QC, Canada, 21 August 2022. [Google Scholar]
- Hajiabadi, H.; Monsefi, R.; Yazdi, H.S. relf: Robust regression extended with ensemble loss function. Appl. Intell. 2019, 49, 1437–1450. [Google Scholar] [CrossRef]
- Muthukumar, V.; Narang, A.; Subramanian, V.; Belkin, M.; Hsu, D.; Sahai, A. Classification vs regression in overparameterized regimes: Does the loss function matter? J. Mach. Learn. Res. 2021, 22, 10104–10172. [Google Scholar]
- Jadon, A.; Patil, A.; Jadon, S. A Comprehensive Survey of Regression Based Loss Functions for Time Series Forecasting. arXiv 2022, arXiv:2211.02989. [Google Scholar]
- Motepe, S.; Hasan, A.N.; Shongwe, T. Forecasting the Total South African Unplanned Capability Loss Factor Using an Ensemble of Deep Learning Techniques. Energies 2022, 15, 2546. [Google Scholar] [CrossRef]
- Russakovsky, O.; Deng, J.; Su, H.; Krause, J.; Satheesh, S.; Ma, S.; Huang, Z.; Karpathy, A.; Khosla, A.; Bernstein, M.; et al. Imagenet large scale visual recognition challenge. Int. J. Comput. Vis. 2015, 115, 211–252. [Google Scholar] [CrossRef]
- Saeed, J.N.; Abdulazeez, A.M.; Ibrahim, D.A. FIAC-Net: Facial Image Attractiveness Classification Based on Light Deep Convolutional Neural Network. In Proceedings of the 2022 Second International Conference on Computer Science, Engineering and Applications (ICCSEA), Gunupur, India, 8 September 2022. [Google Scholar]
- Liu, Z.; Luo, P.; Wang, X.; Tang, X. Deep learning face attributes in the wild. In Proceedings of the IEEE International conference on Computer Vision, Santiago, Chile, 7–13 December 2015. [Google Scholar]
- Krizhevsky, A.; Sutskever, I.; Hinton, G.E. Imagenet classification with deep convolutional neural networks. Adv. Neural Inf. Process. Syst. 2012, 25, 1097–1105. [Google Scholar] [CrossRef]
- Simonyan, K.; Zisserman, A. Very deep convolutional networks for large-scale image recognition. arXiv 2014, arXiv:1409.1556. [Google Scholar]
- Xie, D.; Liang, L.; Jin, L.; Xu, J.; Li, M. Scut-fbp: A benchmark dataset for facial beauty perception. In Proceedings of the 2015 IEEE International Conference on Systems, Man, and Cybernetics, Kowloon Tong, Hong Kong, 9–12 October 2015. [Google Scholar]
- Liang, L.; Lin, L.; Jin, L.; Xie, D.; Li, M. Scut-fbp5500: A diverse benchmark dataset for multi-paradigm facial beauty prediction. In Proceedings of the 2018 24th International Conference on Pattern Recognition (ICPR), Beijing, China, 20–24 August 2018. [Google Scholar]
- Dornaika, F.; Wang, K.; Arganda-Carreras, I.; Elorza, A.; Moujahid, A. Toward graph-based semi-supervised face beauty prediction. Expert Syst. Appl. 2020, 142, 112990. [Google Scholar] [CrossRef]
- Lin, L.; Liang, L.; Jin, L.; Chen, W. Attribute-Aware Convolutional Neural Networks for Facial Beauty Prediction. In Proceedings of the IJCAI, Macao, China, 10–16 August 2019. [Google Scholar]
- Bougourzi, F.; Dornaika, F.; Taleb-Ahmed, A. Deep learning based face beauty prediction via dynamic robust losses and ensemble regression. Knowl. -Based Syst. 2022, 242, 108246. [Google Scholar] [CrossRef]
- Vahdati, E.; Suen, C.Y. Female facial beauty analysis using transfer learning and stacking ensemble model. In Proceedings of the Image Analysis and Recognition: 16th International Conference, ICIAR 2019, Waterloo, ON, Canada, 27–29 August 2019; Proceedings, Part II 16. Springer: Berlin/Heidelberg, Germany, 2019. [Google Scholar]


| Parameter | Description |
|---|---|
| Input image | |
| Target ground truth of beauty score | |
| The average of the ground-truth scores | |
| Predicted beauty score | |
| The average of the predicted scores | |
| n | Number of data samples |
| f() | Learning function or algorithm |
| Weight of the input data | |
| Loss function | |
| Number of loss functions | |
| L1 | L1 loss |
| L2 | L1 loss |
| Log-cosh | Hyperbolic cosine h |
| Parameter | Setting |
|---|---|
| Initial learning rate | 1 × 10⁻⁴ |
| Batch size | 32 |
| MaxEpochs | 150 |
| Optimizer | Adam |
| Layer Name | Kernels | Size | Stride |
|---|---|---|---|
| Input | 227 × 227 × 3 | ||
| Convolutional_1 + BN + ReLU | 96 | 11 × 11 | 4 |
| Max pooling_1 | 3 × 3 | 2 | |
| Convolutional_2 + BN + ReLU | 256 | 5 × 5 | 1 |
| Max pooling_2 | 3 × 3 | 2 | |
| Convolutional_3 + ReLU | 384 | 3 × 3 | 1 |
| Convolutional_4 + ReLU | 384 | 3 × 3 | 1 |
| Convolutional_5 + ReLU | 256 | 3 × 3 | 1 |
| Max pooling_3 | 3 × 3 | 2 | |
| Fully Connected fc6 | |||
| Fully Connected fc7 | |||
| Fully Connected fc8 | |||
| The proposed ensemble loss with response | |||
| Regression |
| Layer Name | Kernels | Size | Stride |
|---|---|---|---|
| Input | 224 × 224 × 3 | ||
| Convolutional1_1 + ReLU1_2 | 64 | 3 × 3 | 1 |
| Convolutional1_2 + ReLU1_2 | 64 | 3 × 3 | 1 |
| Max pooling_1 | 2 × 2 | 1 | |
| Convolutional2_1 + ReLU2_1 | 128 | 3 × 3 | 1 |
| Convolutional2_2 + ReLU2_2 | 128 | 3 × 3 | 1 |
| Max pooling_2 | 2 × 2 | 1 | |
| Convolutional3_1 + ReLU3_1 | 256 | 3 × 3 | 1 |
| Convolutional3_2 + ReLU3_2 | 256 | 3 × 3 | 1 |
| Convolutional3_3 + ReLU3_3 | 256 | 3 × 3 | 1 |
| Max pooling_3 | 2 × 2 | 1 | |
| Convolutional4_1 + ReLU4_1 | 512 | 3 × 3 | 1 |
| Convolutional4_2 + ReLU4_2 | 512 | 3 × 3 | 1 |
| Convolutional4_3 + ReLU4_3 | 512 | 3 × 3 | 1 |
| Max pooling_4 | 2 × 2 | 1 | |
| Convolutional5_1 + ReLU5_1 | 512 | 3 × 3 | 1 |
| Convolutional5_2 + ReLU5_2 | 512 | 3 × 3 | 1 |
| Convolutional5_3 + ReLU5_3 | 512 | 3 × 3 | 1 |
| Max pooling_5 | 2 × 2 | 1 | |
| Fully Connected fc6 + ReLU + Dropout | |||
| Fully Connected fc7 + ReLU + Dropout | |||
| Fully Connected fc8 | |||
| The proposed ensemble loss with response | |||
| Regression |
| Layer Name | Kernels | Size | Stride |
|---|---|---|---|
| Input | - | 128 × 128 × 3 | - |
| Convolutional-1 (BN + ReLU) | 64 | 11 × 11 | 1 |
| Max pooling | 2 × 2 | 2 | |
| Convolutional-2 (BN + ReLU) | 64 | 9 × 9 | 1 |
| Max pooling | 2 × 2 | 2 | |
| Convolutional-3 (BN + ReLU) | 32 | 7 × 7 | 1 |
| Max pooling | 2 × 2 | 2 | |
| Convolutional-4 (BN + ReLU) | 16 | 5 × 5 | 1 |
| Max pooling | 2 × 2 | 2 | |
| Convolutional-5 (BN + ReLU) | 12 | 3 × 3 | 1 |
| Max pooling | 2 × 2 | 2 | |
| Convolutional-6 (BN + ReLU) | 8 | 3 × 3 | 1 |
| Average pooling | 2 × 2 | 1 | |
| Fully Connected + Dropout | |||
| The proposed ensemble loss with response | |||
| Regression |
| AlexNet | VGG16-Net | FIAC-NET | ||||||||
|---|---|---|---|---|---|---|---|---|---|---|
| Loss | Fold # | PC ↑ | MAE ↓ | RMSE ↓ | PC ↑ | MAE ↓ | RMSE ↓ | PC ↑ | MAE ↓ | RMSE ↓ |
| L2 | Fold 1 | 0.886792 | 0.309923 | 0.387405 | 0.885873 | 0.233409 | 0.288079 | 0.902156 | 0.159987 | 0.229707 |
| Fold 2 | 0.890809 | 0.387383 | 0.461403 | 0.900324 | 0.272331 | 0.364368 | 0.894374 | 0.30578 | 0.462875 | |
| Fold 3 | 0.894072 | 0.327179 | 0.398048 | 0.896106 | 0.27479 | 0.33756 | 0.900172 | 0.158858 | 0.224796 | |
| Fold 4 | 0.88454 | 0.277123 | 0.360177 | 0.893316 | 0.286573 | 0.358064 | 0.893911 | 0.272233 | 0.359504 | |
| Fold 5 | 0.89616 | 0.237447 | 0.35655 | 0.887568 | 0.251615 | 0.349024 | 0.893666 | 0.174137 | 0.232828 | |
| Average | 0.890475 | 0.325402 | 0.392717 | 0.892637 | 0.263744 | 0.339419 | 0.8968558 | 0.214199 | 0.301942 | |
| L1 | Fold 1 | 0.886594 | 0.268403 | 0.344794 | 0.891489 | 0.188005 | 0.253954 | 0.913914 | 0.179596 | 0.244818 |
| Fold 2 | 0.898972 | 0.29734 | 0.399723 | 0.909594 | 0.273945 | 0.334632 | 0.89788 | 0.285959 | 0.426164 | |
| Fold 3 | 0.897251 | 0.3151 | 0.389115 | 0.89499 | 0.206798 | 0.265649 | 0.901024 | 0.150231 | 0.221037 | |
| Fold 4 | 0.89355 | 0.291143 | 0.369973 | 0.900606 | 0.28731 | 0.361998 | 0.882645 | 0.250829 | 0.360831 | |
| Fold 5 | 0.905704 | 0.299369 | 0.398775 | 0.885381 | 0.28123 | 0.396568 | 0.890992 | 0.18624 | 0.244834 | |
| Average | 0.896414 | 0.294271 | 0.380476 | 0.896412 | 0.247458 | 0.32256 | 0.897291 | 0.210571 | 0.299537 | |
| Log-cosh | Fold 1 | 0.883631 | 0.313012 | 0.388109 | 0.904711 | 0.236537 | 0.287591 | 0.917584 | 0.168858 | 0.231028 |
| Fold 2 | 0.908497 | 0.239261 | 0.343423 | 0.9077 | 0.282616 | 0.352005 | 0.900933 | 0.263164 | 0.345673 | |
| Fold 3 | 0.89916 | 0.294613 | 0.358759 | 0.901113 | 0.162906 | 0.221393 | 0.90517 | 0.141968 | 0.216695 | |
| Fold 4 | 0.896872 | 0.256079 | 0.339267 | 0.900411 | 0.2745 | 0.362309 | 0.896621 | 0.246203 | 0.355604 | |
| Fold 5 | 0.89441 | 0.254158 | 0.369783 | 0.904146 | 0.226115 | 0.303307 | 0.893336 | 0.160434 | 0.236355 | |
| Average | 0.896514 | 0.271425 | 0.359868 | 0.903616 | 0.236535 | 0.305321 | 0.902729 | 0.196125 | 0.277071 | |
| Proposed loss | Fold 1 | 0.91087 | 0.277514 | 0.349938 | 0.906243 | 0.177149 | 0.242459 | 0.910428 | 0.16176 | 0.221287 |
| Fold 2 | 0.909427 | 0.236772 | 0.339803 | 0.911665 | 0.269073 | 0.344907 | 0.918538 | 0.230674 | 0.315015 | |
| Fold 3 | 0.899448 | 0.293994 | 0.344505 | 0.903421 | 0.173957 | 0.226531 | 0.913071 | 0.126127 | 0.199258 | |
| Fold 4 | 0.897148 | 0.297535 | 0.390668 | 0.902068 | 0.258518 | 0.334192 | 0.900512 | 0.259396 | 0.345144 | |
| Fold 5 | 0.901899 | 0.211583 | 0.316417 | 0.905859 | 0.236074 | 0.312052 | 0.907742 | 0.15179 | 0.215078 | |
| Average | 0.903758 | 0.26348 | 0.348266 | 0.905851 | 0.222954 | 0.292028 | 0.9100582 | 0.185949 | 0.259156 | |
| AlexNet | VGG16-Net | FIAC-NET | ||||||||
|---|---|---|---|---|---|---|---|---|---|---|
| Loss | Fold # | PC ↑ | MAE ↓ | RMSE ↓ | PC ↑ | MAE ↓ | RMSE ↓ | PC ↑ | MAE ↓ | RMSE ↓ |
| L2 | Fold1 | 0.907345 | 0.240533 | 0.307498 | 0.923767 | 0.213235 | 0.272778 | 0.921218 | 0.208841 | 0.267048 |
| Fold2 | 0.907436 | 0.284240 | 0.353902 | 0.918951 | 0.240099 | 0.303619 | 0.923606 | 0.203690 | 0.263316 | |
| Fold3 | 0.914046 | 0.292779 | 0.359794 | 0.929376 | 0.243384 | 0.300318 | 0.922841 | 0.215686 | 0.274935 | |
| Fold4 | 0.910866 | 0.253034 | 0.313157 | 0.933455 | 0.234888 | 0.290986 | 0.930924 | 0.200899 | 0.258841 | |
| Fold5 | 0.923891 | 0.206978 | 0.263612 | 0.932358 | 0.203312 | 0.260058 | 0.927243 | 0.211036 | 0.270286 | |
| Average | 0.9127168 | 0.2555128 | 0.3195926 | 0.9275814 | 0.2269836 | 0.2855518 | 0.9251664 | 0.2080304 | 0.2668852 | |
| L1 | Fold1 | 0.897638 | 0.279448 | 0.351358 | 0.897066 | 0.248373 | 0.315218 | 0.907323 | 0.224207 | 0.295496 |
| Fold2 | 0.897693 | 0.233345 | 0.308535 | 0.903645 | 0.227187 | 0.304121 | 0.913023 | 0.207325 | 0.27959 | |
| Fold3 | 0.898183 | 0.239692 | 0.313157 | 0.923759 | 0.223212 | 0.283766 | 0.901157 | 0.229243 | 0.301759 | |
| Fold4 | 0.890245 | 0.243618 | 0.320583 | 0.899807 | 0.293189 | 0.368715 | 0.918057 | 0.212381 | 0.280385 | |
| Fold5 | 0.888500 | 0.240513 | 0.315462 | 0.929065 | 0.247787 | 0.302772 | 0.922134 | 0.203054 | 0.267709 | |
| Average | 0.8944518 | 0.2473232 | 0.321819 | 0.9106684 | 0.2479496 | 0.3149184 | 0.9123388 | 0.215242 | 0.284987 | |
| Log-cosh | Fold1 | 0.906932 | 0.231047 | 0.296844 | 0.916811 | 0.221005 | 0.282706 | 0.916166 | 0.215914 | 0.279431 |
| Fold2 | 0.909971 | 0.258805 | 0.324433 | 0.912169 | 0.220701 | 0.283236 | 0.922908 | 0.207376 | 0.265653 | |
| Fold3 | 0.908483 | 0.242075 | 0.305146 | 0.932647 | 0.225791 | 0.282773 | 0.928752 | 0.208598 | 0.266964 | |
| Fold4 | 0.912021 | 0.291740 | 0.359610 | 0.916201 | 0.229308 | 0.297403 | 0.922272 | 0.208786 | 0.272133 | |
| Fold5 | 0.921644 | 0.209866 | 0.268154 | 0.931253 | 0.229251 | 0.295928 | 0.929894 | 0.216112 | 0.269370 | |
| Average | 0.9118102 | 0.2467066 | 0.3108374 | 0.9218162 | 0.2252112 | 0.2884092 | 0.9239984 | 0.2113572 | 0.2707102 | |
| Proposed loss | Fold1 | 0.909468 | 0.234892 | 0.295199 | 0.931563 | 0.206476 | 0.272374 | 0.932550 | 0.195362 | 0.248635 |
| Fold2 | 0.910616 | 0.227180 | 0.297651 | 0.928253 | 0.239862 | 0.307400 | 0.922096 | 0.204956 | 0.272749 | |
| Fold3 | 0.910364 | 0.227177 | 0.292339 | 0.931084 | 0.220507 | 0.279881 | 0.935712 | 0.199025 | 0.255806 | |
| Fold4 | 0.912465 | 0.243282 | 0.312587 | 0.925647 | 0.225874 | 0.284645 | 0.925991 | 0.227766 | 0.287912 | |
| Fold5 | 0.927530 | 0.291501 | 0.350512 | 0.938053 | 0.198880 | 0.251496 | 0.936200 | 0.186978 | 0.241975 | |
| Average | 0.9140886 | 0.2448064 | 0.3096576 | 0.93092 | 0.2183198 | 0.2791592 | 0.9305098 | 0.2028174 | 0.2614154 | |
| AlexNet | VGG16-Net | FIAC-NET | ||||||||
|---|---|---|---|---|---|---|---|---|---|---|
| Loss | Fold # | PC ↑ | MAE ↓ | RMSE ↓ | PC ↑ | MAE ↓ | RMSE ↓ | PC ↑ | MAE ↓ | RMSE ↓ |
| L2 | Fold1 | 0.874151 | 0.539646 | 0.679715 | 0.9149 | 0.657429 | 0.788001 | 0.908299 | 0.446347 | 0.569966 |
| Fold2 | 0.890606 | 0.483732 | 0.617635 | 0.89946 | 0.53349 | 0.671474 | 0.913656 | 0.440536 | 0.567868 | |
| Fold3 | 0.885824 | 0.543017 | 0.688969 | 0.903028 | 0.494082 | 0.619434 | 0.919398 | 0.429767 | 0.5439 | |
| Fold4 | 0.878471 | 0.50383 | 0.640299 | 0.901086 | 0.525557 | 0.658758 | 0.909376 | 0.469771 | 0.590058 | |
| Fold5 | 0.878958 | 0.528132 | 0.687316 | 0.889669 | 0.477722 | 0.613175 | 0.907632 | 0.487113 | 0.614645 | |
| Average | 0.881602 | 0.519671 | 0.662787 | 0.901629 | 0.537656 | 0.670168 | 0.911672 | 0.454707 | 0.577287 | |
| L1 | Fold1 | 0.876628 | 0.484963 | 0.651704 | 0.893344 | 0.588461 | 0.735082 | 0.898483 | 0.507801 | 0.640425 |
| Fold2 | 0.880223 | 0.499715 | 0.639342 | 0.908924 | 0.500534 | 0.714772 | 0.907686 | 0.505487 | 0.638085 | |
| Fold3 | 0.888857 | 0.471078 | 0.619127 | 0.881992 | 0.555658 | 0.689619 | 0.899946 | 0.410486 | 0.549805 | |
| Fold4 | 0.881179 | 0.578539 | 0.744373 | 0.884385 | 0.49881 | 0.634568 | 0.915355 | 0.458133 | 0.589622 | |
| Fold5 | 0.87822 | 0.471296 | 0.649191 | 0.877244 | 0.514752 | 0.662075 | 0.908439 | 0.480193 | 0.612392 | |
| Average | 0.881021 | 0.501118 | 0.660747 | 0.889178 | 0.531643 | 0.687223 | 0.905982 | 0.47242 | 0.606066 | |
| Log-cosh | Fold1 | 0.888677 | 0.483999 | 0.620113 | 0.904497 | 0.593918 | 0.72576 | 0.916462 | 0.425651 | 0.535359 |
| Fold2 | 0.897537 | 0.469122 | 0.600731 | 0.907009 | 0.483545 | 0.606491 | 0.918844 | 0.454527 | 0.576362 | |
| Fold3 | 0.885437 | 0.456751 | 0.580649 | 0.887036 | 0.466082 | 0.605073 | 0.915077 | 0.41715 | 0.525493 | |
| Fold4 | 0.871824 | 0.514141 | 0.669348 | 0.920185 | 0.532153 | 0.662263 | 0.916048 | 0.438528 | 0.547494 | |
| Fold5 | 0.880027 | 0.573935 | 0.740608 | 0.893962 | 0.502262 | 0.630416 | 0.920189 | 0.443971 | 0.570682 | |
| Average | 0.8847 | 0.49959 | 0.64229 | 0.9025378 | 0.515592 | 0.6460006 | 0.917324 | 0.435965 | 0.551078 | |
| Proposed loss | Fold1 | 0.898394 | 0.462036 | 0.606094 | 0.910804 | 0.486603 | 0.602119 | 0.92504 | 0.422594 | 0.5347 |
| Fold2 | 0.908921 | 0.451912 | 0.573237 | 0.919966 | 0.44634 | 0.560829 | 0.925186 | 0.422061 | 0.532776 | |
| Fold3 | 0.906027 | 0.466733 | 0.58976 | 0.900498 | 0.542547 | 0.673791 | 0.927617 | 0.428647 | 0.533562 | |
| Fold4 | 0.887227 | 0.504793 | 0.636339 | 0.910808 | 0.616375 | 0.74905 | 0.9295 | 0.413832 | 0.515335 | |
| Fold5 | 0.887787 | 0.496496 | 0.643109 | 0.897337 | 0.468702 | 0.595801 | 0.922544 | 0.444453 | 0.566857 | |
| Average | 0.8976712 | 0.476394 | 0.6097078 | 0.907883 | 0.512113 | 0.636318 | 0.925977 | 0.426317 | 0.536646 | |
| Method | SCUT-FBP | SCUT-FBP 5500 | ME Beauty | ||||||
|---|---|---|---|---|---|---|---|---|---|
| ↑ PC | ↓ MAE | ↓ RMSE | ↑ PC | ↓ MAE | ↓ RMSE | ↑ PC | ↓ MAE | ↓ RMSE | |
| VGG16 + Bayesian Ridge Regression [29] | 0.857 | 0.2595 | 0.3397 | N/A | N/A | N/A | N/A | N/A | N/A |
| ResNeXt-50-based R3CNN [22] | 0.95 | 0.2314 | 0.2885 | 0.9055 | 0.2236 | 0.2954 | N/A | N/A | N/A |
| HMTNet [32] | 0.8977 | N/A | N/A | 0.8783 | 0.2501 | 0.3263 | N/A | N/A | N/A |
| ResNet-18 based P-AaNet [48] | 0.9103 | 0.2224 | 0.2816 | 0.9055 | 0.2236 | 0.2954 | N/A | N/A | N/A |
| Cascade fine-tuned CNN [24] | 0.88 | N/A | N/A | N/A | N/A | N/A | N/A | N/A | N/A |
| REX-INCEP [35] | N/A | N/A | N/A | 92.18 | 0.2052 | 0.2698 | N/A | N/A | N/A |
| CNN-ER [49] | N/A | N/A | N/A | 0.9250 | 0.2009 | 0.2650 | N/A | N/A | N/A |
| VGGFace2+ Ensemble Stack [50] | 0.8898 | 0.2409 | 0.3105 | 0.9112 | 0.2304 | 0.2951 | N/A | N/A | N/A |
| Ensemble CNN [28] | 0.8795 | 0.226 | 0.330 | 0.886 | 0.242 | 0.320 | 0.888 | 0.365 | 0.600 |
| AlexNet + proposed ensemble loss | 0.9038 | 0.2635 | 0.3482 | 0.9141 | 0.2449 | 0.3097 | 0.8977 | 0.4764 | 0.6097 |
| VGG16-Net + proposed ensemble loss | 0.9059 | 0.2229 | 0.2920 | 0.9309 | 0.2183 | 0.2792 | 0.9079 | 0.5121 | 0.6363 |
| FIAC-Net + proposed ensemble loss | 0.9101 | 0.1859 | 0.2591 | 0.9305 | 0.2028 | 0.2614 | 0.9260 | 0.4263 | 0.5366 |
Disclaimer/Publisher’s Note: The statements, opinions and data contained in all publications are solely those of the individual author(s) and contributor(s) and not of MDPI and/or the editor(s). MDPI and/or the editor(s) disclaim responsibility for any injury to people or property resulting from any ideas, methods, instructions or products referred to in the content. |
© 2023 by the authors. Licensee MDPI, Basel, Switzerland. This article is an open access article distributed under the terms and conditions of the Creative Commons Attribution (CC BY) license (https://creativecommons.org/licenses/by/4.0/).
Share and Cite
Saeed, J.N.; Abdulazeez, A.M.; Ibrahim, D.A. Automatic Facial Aesthetic Prediction Based on Deep Learning with Loss Ensembles. Appl. Sci. 2023, 13, 9728. https://doi.org/10.3390/app13179728
Saeed JN, Abdulazeez AM, Ibrahim DA. Automatic Facial Aesthetic Prediction Based on Deep Learning with Loss Ensembles. Applied Sciences. 2023; 13(17):9728. https://doi.org/10.3390/app13179728
Chicago/Turabian StyleSaeed, Jwan Najeeb, Adnan Mohsin Abdulazeez, and Dheyaa Ahmed Ibrahim. 2023. "Automatic Facial Aesthetic Prediction Based on Deep Learning with Loss Ensembles" Applied Sciences 13, no. 17: 9728. https://doi.org/10.3390/app13179728