1. Introduction
Recently, many efforts in the energy field aim to develop sustainable and renewable energy sources [
1]. Indeed, renewable energies can be considered as an inexhaustible, pollution-free and clean source of energy. One of these sources that may be used extensively in the generation of electricity utilizing photovoltaics is solar energy. In reality, the price of photovoltaic systems depends on both the difficulty of industrial production and the efficiency of the cells themselves [
2]. The limited efficiency of the photovoltaic (PV) cells or panels is essentially due to the non-absorption of sunlight with energy below the bandgap as well as the thermalization effect due to the absorption of sun effect due to the absorption of sunlight with energy exceeding the semiconductor’s band gap [
3], which lead to a theoretical efficiency limit of approximately 30% for silicon based solar cells [
4]. One of the keys to overcoming these losses and to obtain higher efficiency is by improving the spectral matching between the broad spectrum of the sun and the band gap of the semiconductor used in PV cells. In order to exploit the whole or maximum solar spectrum, two major solutions were envisaged [
5]. The first solution uses multijunction solar cells [
6] with several semiconductors having different band gaps which selectively absorb each part of the solar spectrum. The second solution is based on the modification of the solar spectrum to fit the gap of the cell by using down-conversion (DC) and up-conversion (UC) processes (
Figure 1). Multi-junction cells can be considered as the most advanced approach since the conversion efficiency of these cells can reach more than 46% [
7,
8]. Despite its numerous advantages, this approach has a few drawbacks related to the extremely high manufacturing costs [
9], tracking problems caused by the sun tracking system [
10,
11], optical device losses, and concentration problems [
12]. Therefore, the use of down- and up-conversion layers offers several advantages, avoiding or reducing these drawbacks [
13]. Indeed, the related materials are relatively cheap and can be simply combined with the cell without any radical modification of their architecture, in front for the DC system and in rear for the UC system. For instance, in the DC process, photons in the UV/VIS spectrum are converted into photons with energy appropriate for the solar cell’s bandgap or 1.1 eV for silicon-based solar cells.
Several methods have been used to implement the DC/UC solution, such as using quantum dots, nanocrystals, and rare-earth based optical layers. Of these, rare-earth ions have been found to be particularly effective for DC devices because of their diverse energy band structures. The down-conversion process results in a quantum efficiency that is higher than 100%, as theorized by Dexter et al. [
14] and observed by other researchers using
,
, and
doped host matrices [
15]. Recently, high quantum efficiencies approaching 200% have been achieved by Wegh et al. [
16] on a
:
-
phosphor system, which has renewed interest in the development of efficient Quantum-cutting layers. Another system based on double co-doping
-
-
has also been studied, but a system using Yb
3+ seems to be more promising because it only has one level available in excitation, the level
. This level is well located for use in the silicon photovoltaic field because the relaxation
→
between the excited level and the fundamental level of Yb
3+ emits a photon with a wavelength of 980 nm which is located just at the silicon bandgap’s edge. The
ion is employed as a sensitizer ion, with absorption in both the UV and blue regions at 488 nm via level
and cooperative transfer to
from level
(
Figure 2). In this work, the Tb
3+-Yb
3+ couple is used, with Yb
3+ as the emitter and Tb
3+ as the sensitizer. The matrix in which the rare-earth ions are embedded is also important; a comparison of glass and glass ceramics will be discussed below. Based on previous studies of our group, the binary composition 70SiO
2-30HfO
2 (silica hafnia) has been demonstrated to be an optimal matrix for the Tb
3+-Yb
3+ couple.
Glass-ceramic samples, in particular, are characterized by low-energy phonons which significantly reduce non-radiative transitions.
It has been observed that DC layers have been tested on PV cells, but the results have been contrasting. In one study, Florêncio et al. reported a 7% improvement in efficiency for a silicon solar cell covered with 1% Tb
3+ doped tellurite (Te
-ZnO) glass layer [
17]. However, an enhancement of only 1% was observed for a GaP solar cell covered with the same Te
-ZnO glass but co-doped with 1% Tb
3+-5% Yb
3+. For a phosphate glass doped with 0.5% Tb
3+- 0.5% Yb
3+, the reported PV cell efficiency improvement was 0.34% [
18]. Some studies have shown that the efficiency increases when using samples doped with Tb
3+ only but decreases when increasing the concentration of Tb
3+. However, the purpose of this process is to enhance the efficiency of solar cells. This decrease in efficiency is attributed to either self-absorption and energy transfer between
ions [
17] or to the concentration quenching of Yb
3+ ions for a molar concentration higher than 2% [
19].
Figure 1.
Solar spectrum indicating the bandgap and twice the band gap of silicon. High energy and low energy photons are converted, respectively, by down-conversion and up-conversion processes in order to fit the absorption band of silicon. Reproduced from [
20].
Figure 1.
Solar spectrum indicating the bandgap and twice the band gap of silicon. High energy and low energy photons are converted, respectively, by down-conversion and up-conversion processes in order to fit the absorption band of silicon. Reproduced from [
20].
Figure 2.
Energy band diagram of
and
ions. After the absorption of a blue photon by
, the process of energy transfer between a
ion and two
ions can produce two NIR photons suitable for silicon bandgap of 1.1 eV [
21].
Figure 2.
Energy band diagram of
and
ions. After the absorption of a blue photon by
, the process of energy transfer between a
ion and two
ions can produce two NIR photons suitable for silicon bandgap of 1.1 eV [
21].
In order to reach a high quantum efficiency of down-conversion (η QE), we investigate the efficient NIR down-conversion using the couple
embedded in the 70SiO
2-30HfO
2 matrix. Two 70SiO
2-30HfO
2 samples with the same molar concentration of rare earths (3%
and 12%
) grown at 900 °C for glass and at 1000 °C for glass-ceramic were investigated via photoluminescence emission (PL), photoluminescence excitation (PLE), as well as time resolved photoluminescence (TRPL) with calculation of the decay lifetimes as a function of the
concentration in our previous studies [
20,
22]. The decay lifetime allowed us to calculate the effective quantum efficiency for these samples which ranges from 123% to 179%.
2. Solar Cells Efficiency Improvement
The Shockley–Queisser limit sets the upper bound for the conversion efficiency of a single junction solar cell at 33.7% for a bandgap of 1.3 eV in AM 1.5 G conditions. However, in a research paper, Trupke and colleagues [
23] proposed a method to surpass this theoretical limit by applying a downconverter (DC) material on the front or rear surface of a solar cell. They presented an equivalent circuit model of a solar cell combined with a DC layer, which is shown in
Figure 3A. The downconverter absorbs high energy photons and is modeled as three solar cells (
,
, and
) that are connected in series. The solar cells
,
, and
represent the band-band transitions and two intermediate transitions, respectively.
is the actual solar cell.
A solar cell’s power conversion efficiency can be increased to 39.63% by applying a downconverter (DC) layer on the rear surface of a solar cell with a bandgap of 1.1 eV. If the DC layer is placed on the front of the solar cell, the power conversion efficiency is slightly lower at 36.8% for the same bandgap. In both cases, the efficiency surpasses the Shockley–Queisser limit of 33.7%. The maximum efficiency of solar cells with different bandgaps is plotted in
Figure 3B. According to a theoretical analysis by Taybjee and colleagues [
24], the use of a DC layer can significantly improve the efficiency limit, reaching up to 43.5% and 40.5% when applied to the rear and front of a solar cell, respectively. Although the front surface is the optimal design for integration with any existing solar cell [
23], the advantage of this position is that photons with energies between 2
and
that are not downconverted are transmitted through the DC layer to the solar cell.
3. Experimental
Using the sol-gel method and the dip-coating technique, two sets of compositions, denoted as 70SiO
2-30HfO
2-xTb
3+-yYb
3+ with molar ratios of x/y = 1.8/7.2 and 3/12, were synthesized. As shown in
Table 1, the ratio [Yb]/[Tb] was maintained at a constant value of 4. The films were deposited on cleaned SiO
2-fused silica substrates and stabilized by a 5 min treatment in air at 900 °C, yielding transparent, crack-free films (labeled G for glass). Additional heat treatment at 1000 °C for 30 min was performed to nucleate hafnia nanocrystals within the film, thereby producing samples of glass-ceramic. This resulted in 70SiO
2-30HfO
2 glass-ceramic samples doped with rare-earth ions. The details of the fabrication process can be found in our previous work [
20].
The visible and near-infrared (NIR) photoluminescence (PL) of the samples was acquired using different excitation methods and detection techniques. For the visible emission, the sample was excited using a third harmonic of a pulsed Nd:YAG laser with a wavelength of 488 nm from an Ar laser. The emission was then analyzed using a single grating monochromator connected to a Si/InGaAs photodiode, and the standard lock-in technique was applied. To record the photoluminescence excitation (PLE) spectra, an Edinburgh Instruments FLS980 Photoluminescence Spectrometer was used. For steady-state measurements, a continuous-wave xenon lamp served as the excitation source, which was coupled to a double-grating monochromator for precise wavelength selection. Time-resolved PL emission data was collected in Multi Channel Scaling (MCS) mode. The sample was excited using a microsecond xenon flashlamp with a pulse duration of 1–2 μs and a repetition frequency of 10 Hz. The emitted light from the sample was gathered using a double-grating monochromator and detected using a photon counting R928P photomultiplier tube maintained at −20 °C. Luminescence decay measurements of the state of Tb3+ ions were also conducted using the third harmonic of a pulsed Nd-YAG laser for excitation. The visible emission resulting from this excitation was collected using a double monochromator, and the signal was analyzed using a photon-counting system. Decay curves were recorded by a multichannel analyzer Stanford SR430.
Current-voltage (J-V) measurements were conducted using a decade resistance box (1Ω–700 KΩ) by varying the impedance in the electric circuit while monitoring and recording the point with the aid of an ammeter and a multimeter (Agilant 34,420 A). The photocurrent was measured by placing two series of samples activated by the same molar concentrations of RE [Tb + Yb]/[Si + Hf] = 4% on top of the solar cell and exposing it to the incident light of a halogen lamp, which was applied perpendicularly to the sample.
4. Results and Discussion
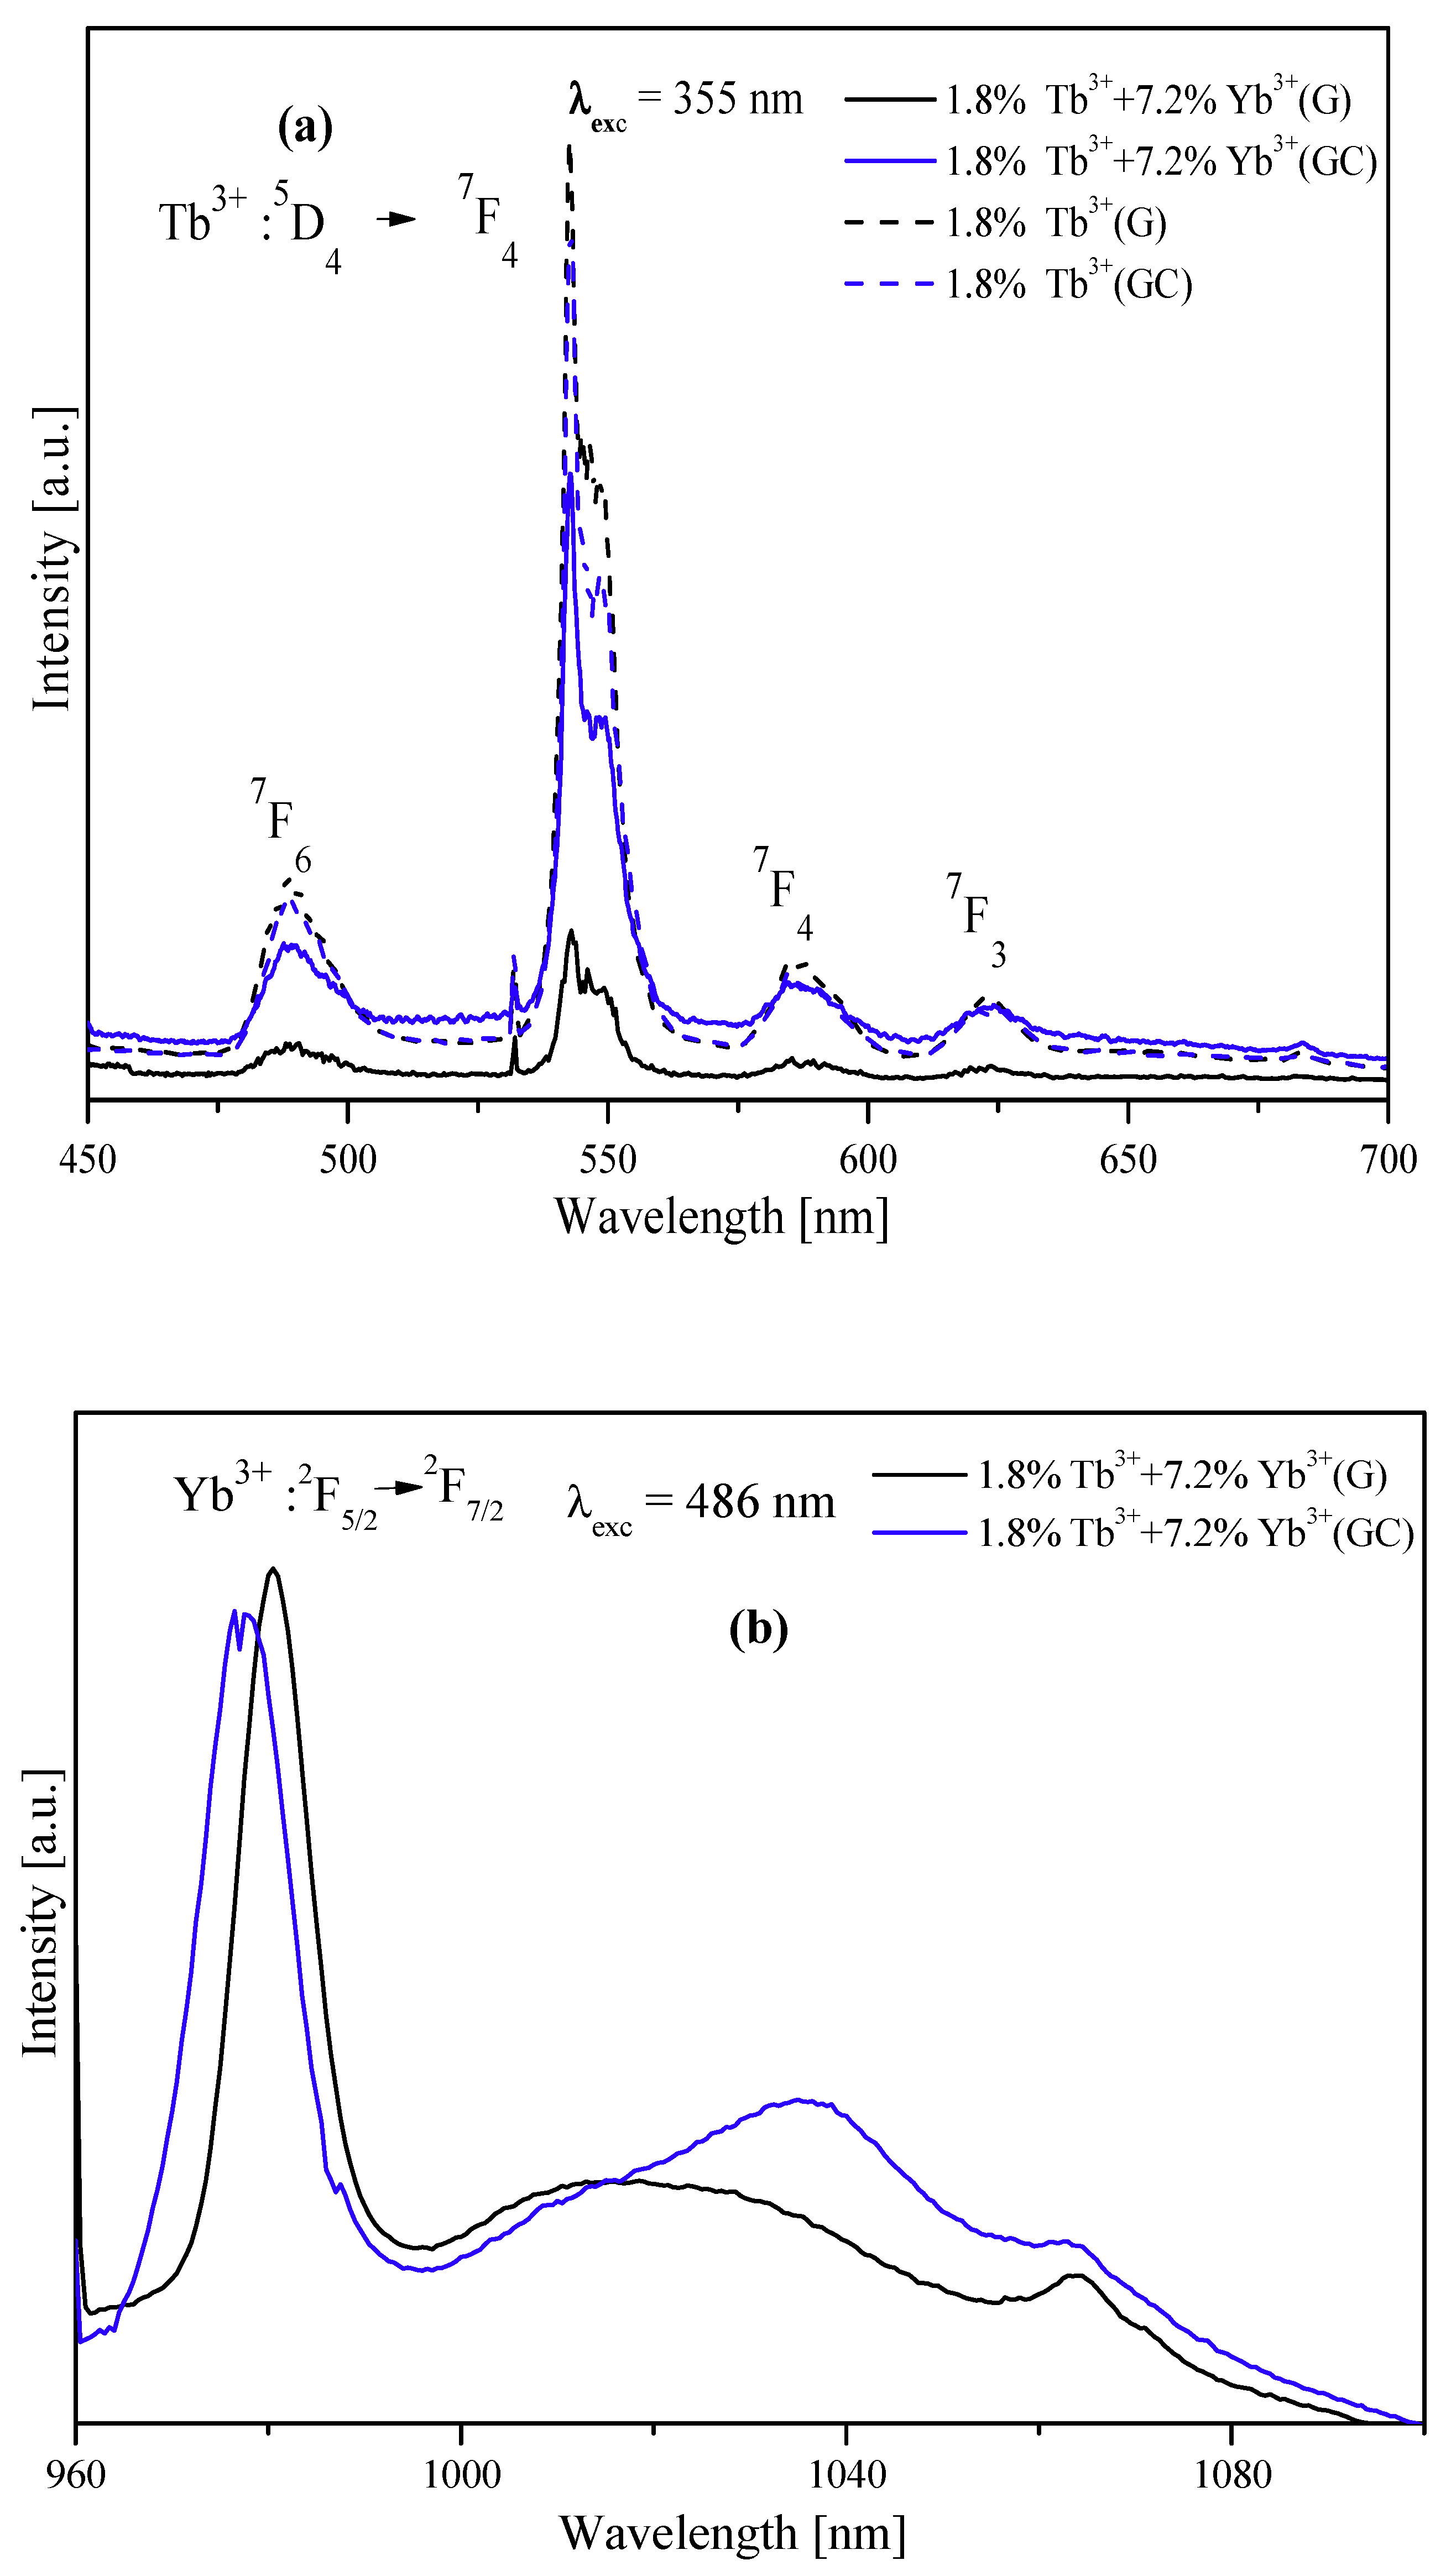
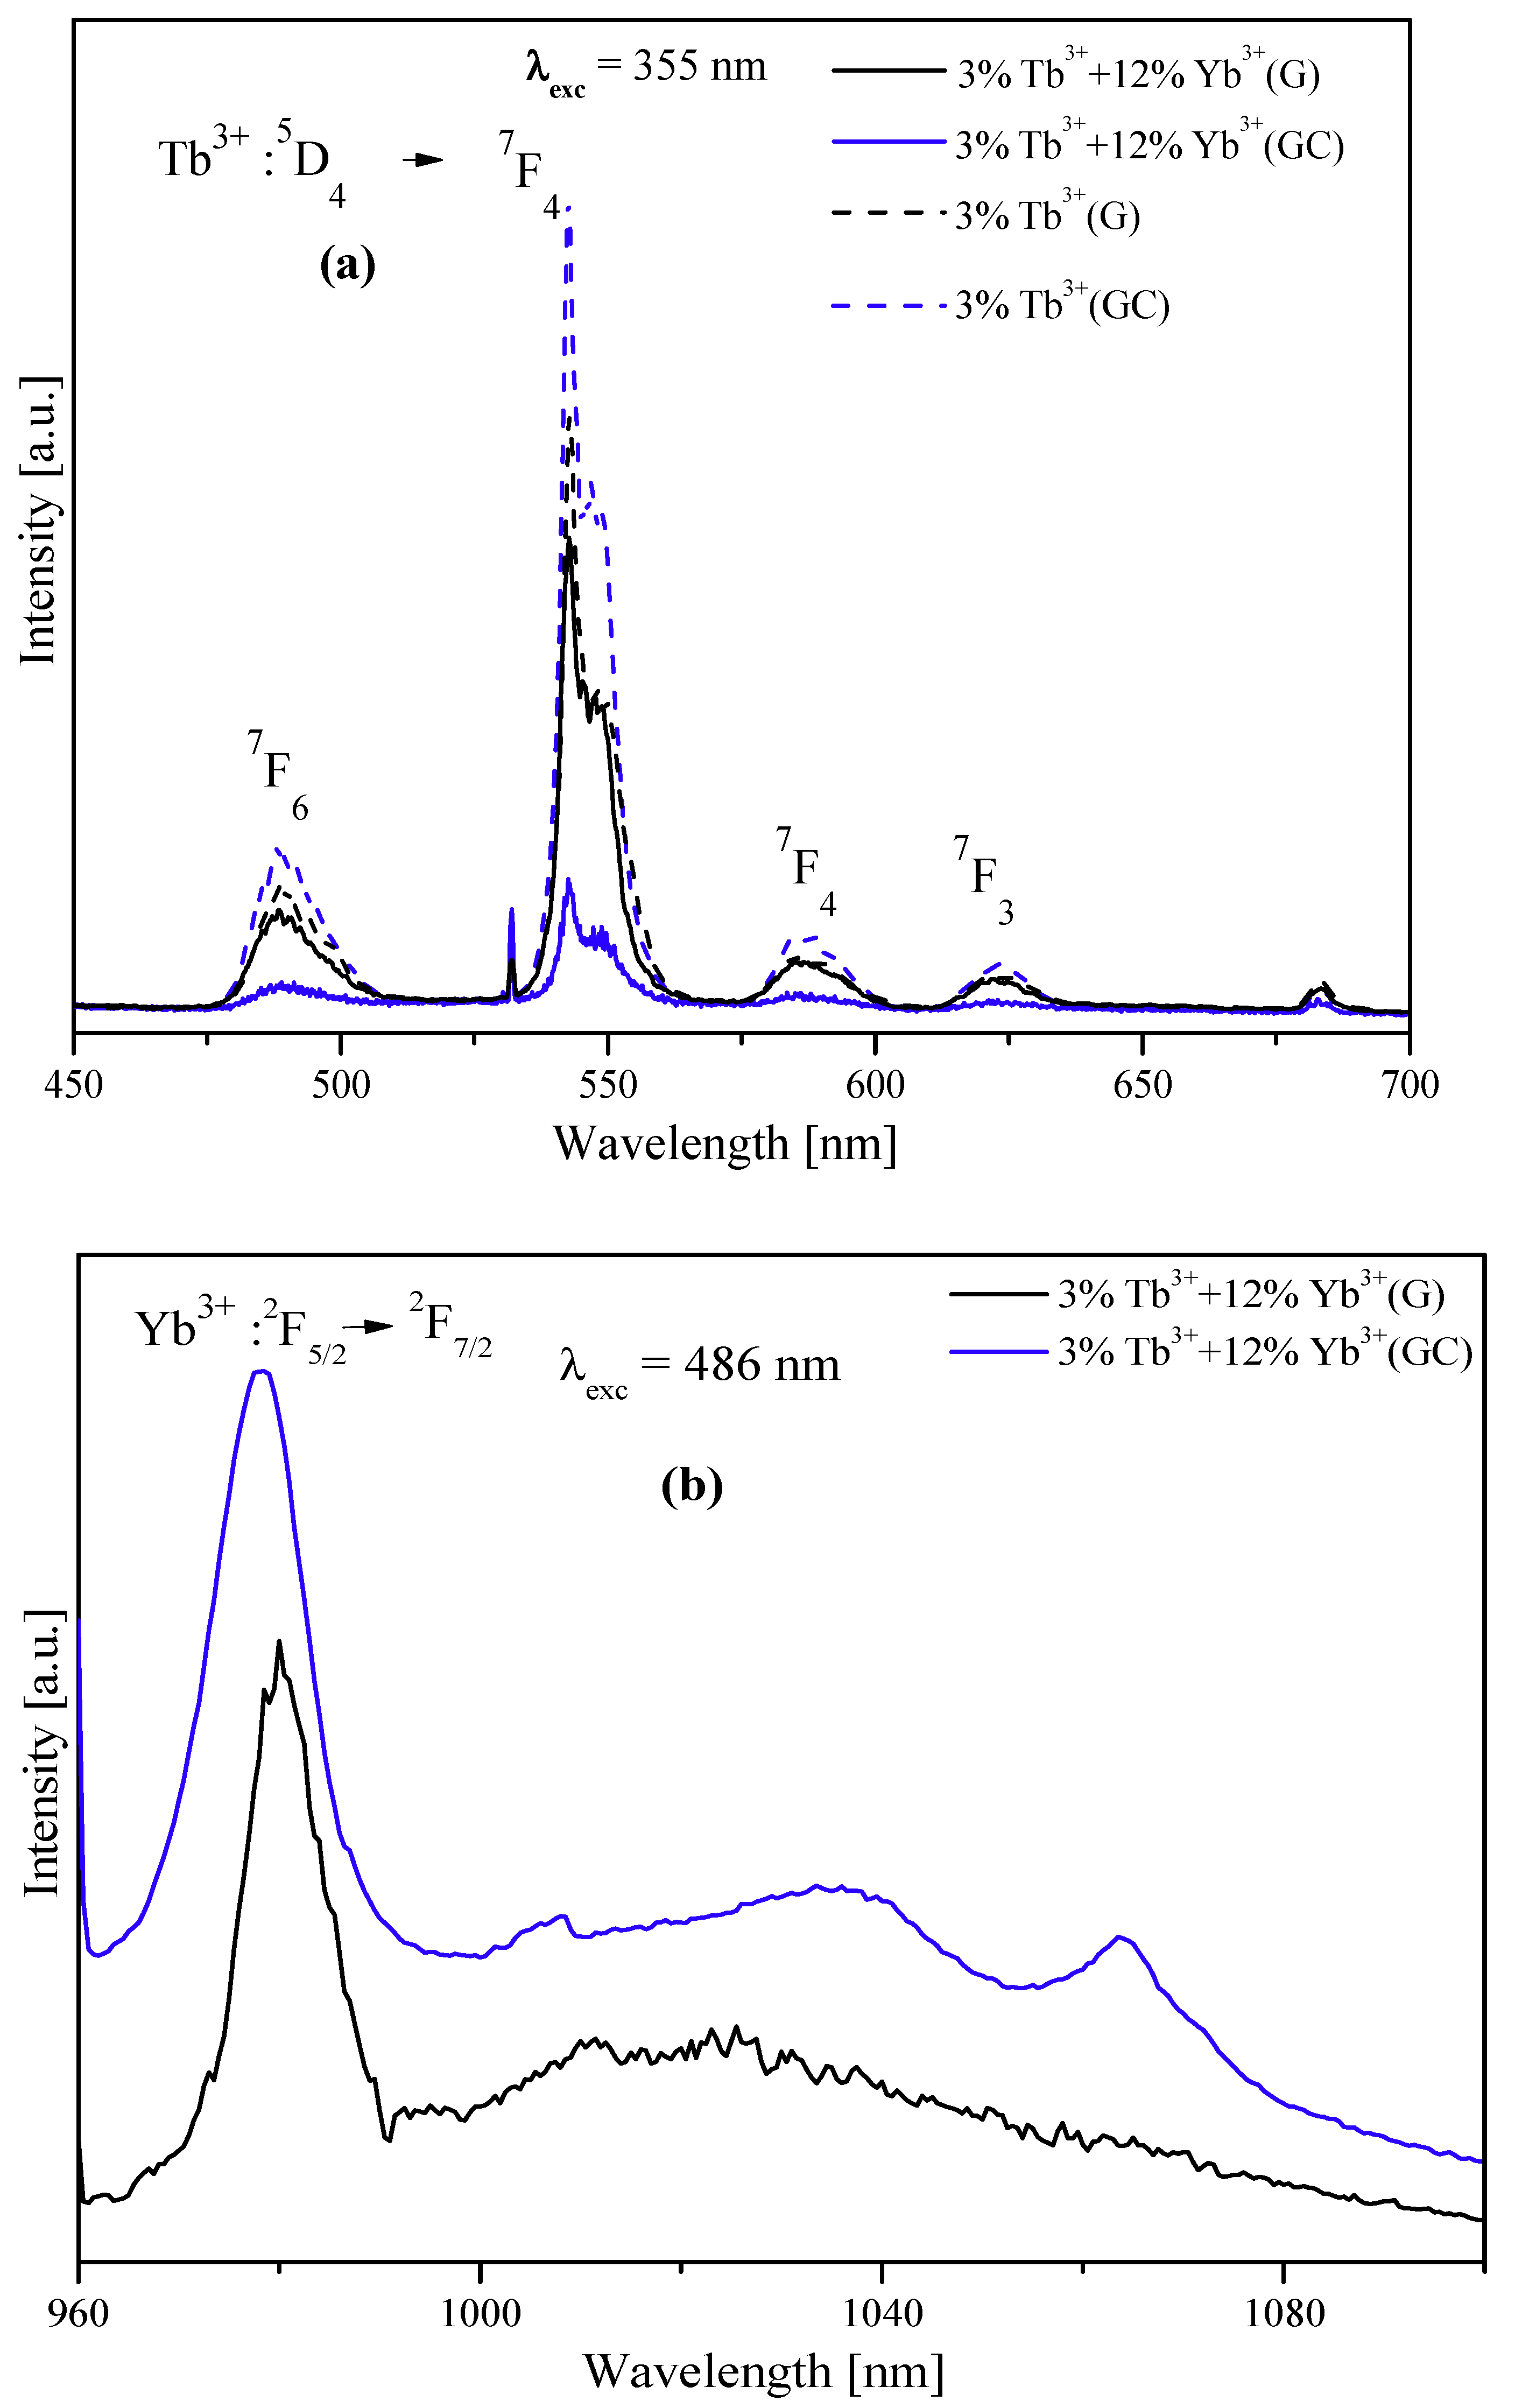
Figure 4 and
Figure 5 show the emission spectra of samples G and GC doped with 9% and 15%, respectively, both with and without
doping. Analyzing
Figure 4a and
Figure 5a, we observe emission in the wavelength range of 450–700 nm, attributed to the electronic transitions
of
ions. The peak of maximum emission is around 543 nm, specifically corresponding to the transition
. It is noteworthy that after
co-doping, the intensity decreases significantly, indicating the presence of a down-conversion process. Some authors [
25] suggest that this process is quantum cutting in glasses co-doped with
and
, resulting from a cooperative energy transfer that converts a photon absorbed by
ions into two photons emitted by
ions (
. The co-doped samples G and GC exhibit a broad emission band in the near-infrared range, located between 960 and 996 nm, attributed to the
transition of
, (
Figure 4b and
Figure 5b). Interestingly, the maximum emission peak for GC samples is at 978 nm, whereas for G samples, it is at 981 nm. This spectral difference between G and GC samples is more pronounced in the infrared region, suggesting a change in the environment surrounding the rare-earth ions after the temperature increase during the heat treatment, attributed to the appearance of HfO
2 nanocrystals after annealing at 1000 °C.
However, it is not possible to determine the conversion efficiency based only on photoluminescence spectra. The evaluation of the energy transfer efficiency between terbium and ytterbium is achieved by estimating the degree of energy transfer between these two ions. This assessment can be carried out by comparing the luminescence decay of terbium with and without ytterbium ion co-doping. The decay curves of Tb
3+ ions in the investigated system are illustrated in
Figure 6.
Almost exponential luminescent decay is observed for the samples without
, whereas a faster luminescent decay with non-exponential behavior is commonly observed for the co-doped samples. This reduction in lifetime is attributed to the energy transfer from
to
, where the non-exponential behavior of the decay aligns perfectly with the Inokuti–Hirayama model [
26]. From a graphical observation (
Figure 6a,d), it is noteworthy that the GC samples exhibit a much more significant reduction in lifetime compared to the G samples. This behavior is caused by the presence of rare-earth ions in HfO
2 nanocrystals, which reduces non-radiative losses. The energy transfer efficiency denoted as
can be determined experimentally by dividing the integrated intensity of the decay curves observed in Tb
3+-Yb
3+ co-doped samples by the integrated intensity of the decay curve in Tb
3+ single-doped samples [
22]:
In certain research studies, the effective quantum efficiency is described as the ratio of emitted photons to absorbed photons in a material. Ideally, an optimal down-conversion system would emit two photons for each absorbed photon, resulting in an effective quantum efficiency of 200%. The relationship between transfer efficiency and effective quantum efficiency is linear and can be expressed as follows:
Here,
represents the quantum efficiency for Tb
3+ ions and is assumed to be equal to 1. From the decay curves obtained in our previous works [
22,
27] the energy transfer efficiency and effective quantum efficiency have been calculated. The resulting energy transfer efficiency and effective quantum efficiency for two samples glass and glass ceramic
co-doped with 3%
and 12%
are listed in
Table 1. These results demonstrate that the effective quantum efficiency values for GC samples are greater than the ones obtained in the G samples. This is attributed to the glass-ceramic matrix’s low phonon energy (700
), which effectively minimizes non-radiative transitions and enhances luminescence, as indicated in our previous research [
22].
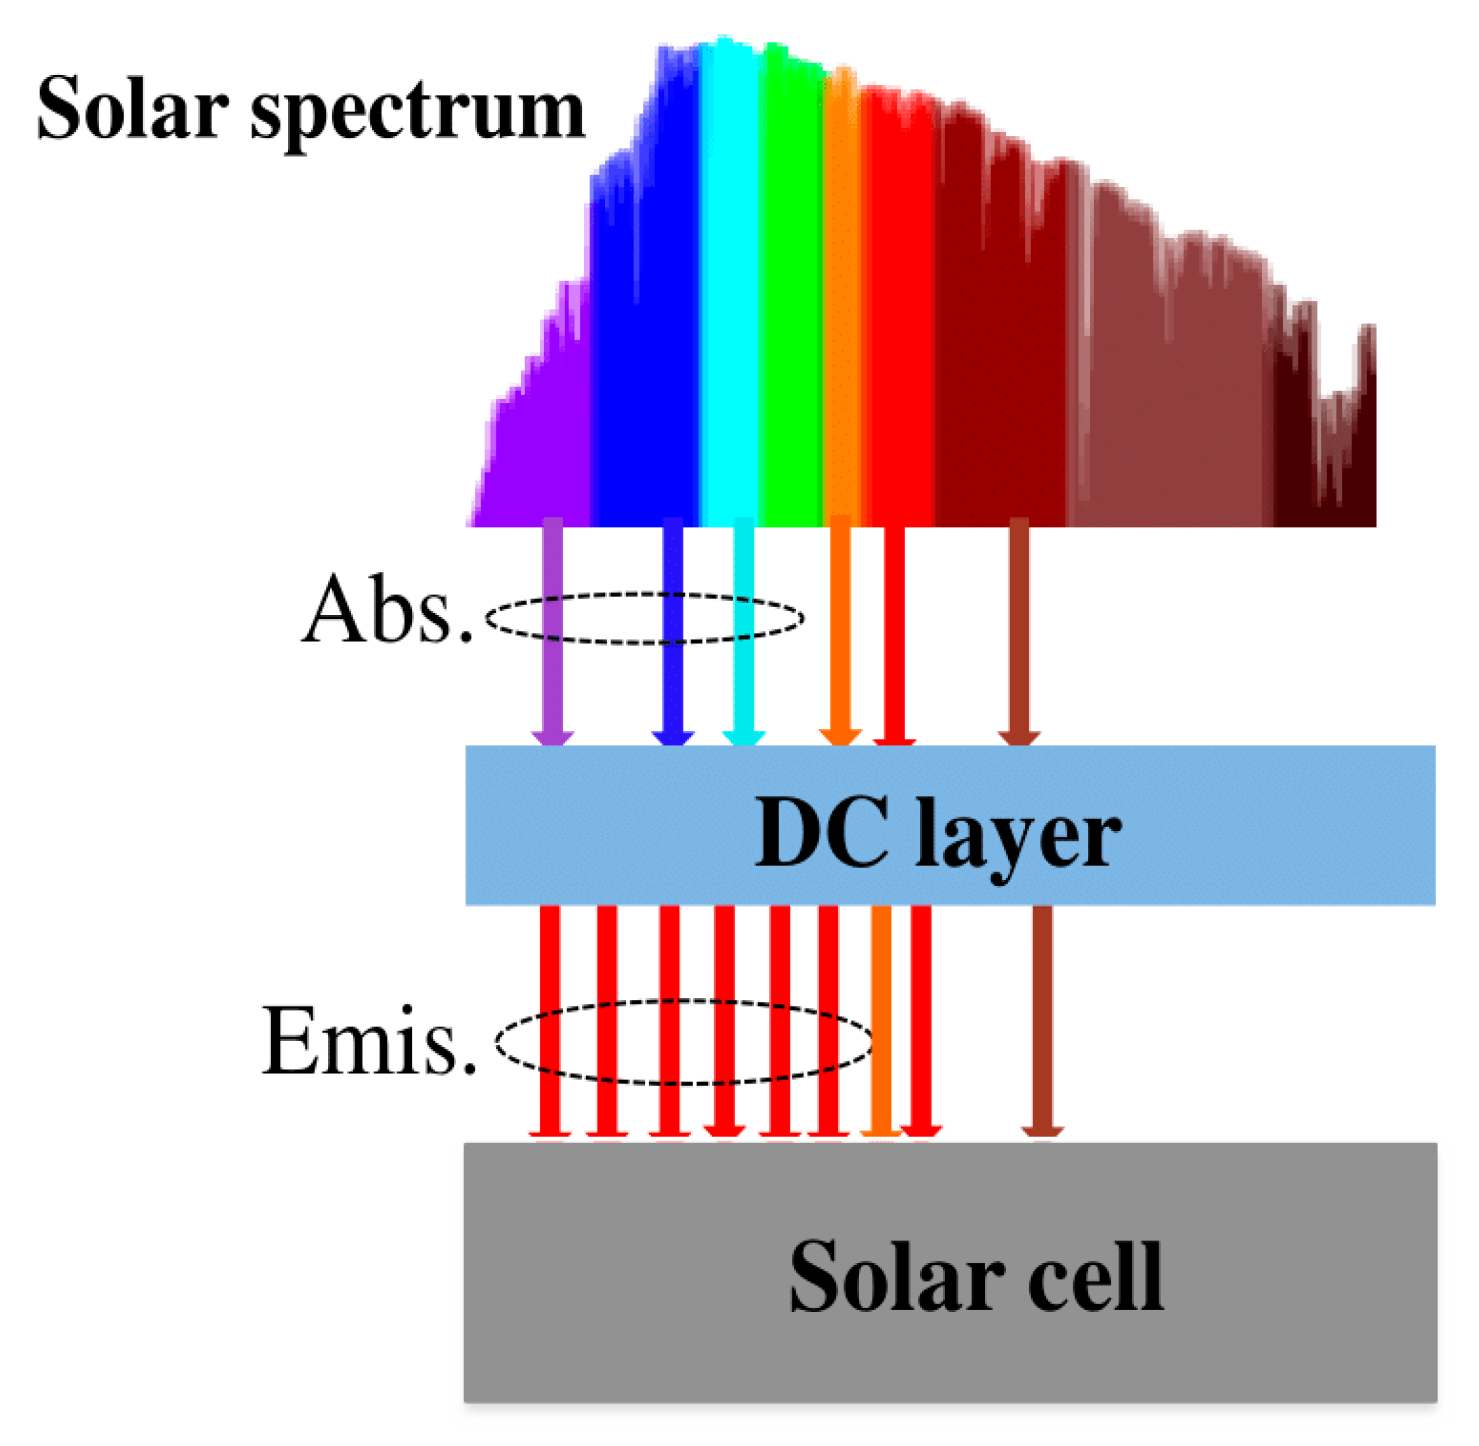
In
Figure 7, a schematic of a silicon solar cell (SC) coated with DC layer is shown, along with an explanation of how this material can downshift, or absorb and reemit, certain wavelengths of light in the solar spectrum to understand the mechanism behind the improvement in solar cell performance. In order to study the effect of the DC layer coating on the solar cell’s performance, the DC layer was applied directly to the surface of textured silicon solar cells (area: 0.8 × 2.5
). The I-V and P-V characteristics of a solar cell with and without a DC layer under three different conditions, a bare solar cell, a solar cell covered with G films, and a solar cell covered with GC films, are shown in
Figure 8. The electrical measurements (
) were obtained from these curves, and the efficiency of conversion (η), filling factor (FF), and enhancement of efficiency (Δη) were calculated based on these results as follows:
where:
A is the solar cell area; I is the incident irradiance; and is the bare solar cell efficiency.
The short circuit current for the devices with G and GC down-conversion layers was improved to 49.7 mA and 50.3 mA, respectively, compared to 49.5 mA for the bare solar cell. The improvement in light absorption of the devices did not impact the Voc and FF values. The parameters of the devices are provided in
Table 2. The energy conversion efficiency of the devices with glass and glass-ceramic downconverter layer was 10.78 and 10.68, respectively, which represented increases of 5.26% and 4.19% compared to the efficiency of a bare solar cell. It is worth noting that the efficiency of the solar cell covered with glass is slightly higher than that of the solar cell covered with glass ceramic. This increase in efficiency may be due to the optical properties of the host matrix, as previously suggested by Bouajaj et al. [
20]. The integration of a downconverter material appears to effectively enhance the photoresponse of silicon solar cells in the UV-blue wavelength range. This is achieved through the efficient downshifting of high-energy photons beyond 2.5 eV and enhancing the utilization of photons in the process. These results suggest that DC layer integration is a promising approach for improving the photoresponse of silicon solar cells in this spectral range.
5. Assessment of Additional External Quantum Efficiency
The efficiency of a solar cell that includes a downconverter (DC) layer can be measured by its Additional External Quantum Efficiency (AEQE)
. This parameter, introduced by [
28], compares the External Quantum Efficiency (EQE) of a solar cell with a DC layer to the EQE of a solar cell without a DC layer. The EQE of a standard solar cell with a DC film is represented as
. To calculate the AEQE, the loss of EQE caused by the partial occlusion of the solar cell by the DC layer
must be taken into account. The AEQE can be determined using Equation (1).
The first term in Equation (1)
is related to the external quantum efficiency of solar cell combined with downconverter layer, which can be defined as the measure of the ratio between the flux of photons converted by the DC layer which is transmitted to the cell at 980 nm (Eg) and the incoming flux from the sun in the wavelength range of the DC layer (250–500 nm). This ratio is then multiplied by the conversion efficiency of the solar cell at 980 nm, as shown in the equation:
To calculate the
, we will define the flux conversion process, as illustrated in
Figure 9; in this system, the flux coming from the sun
is transmitted through the DC layer, which will then be absorbed by the latter
and is converted to 980 nm
to directly reach the solar cell
.
Therefore, the
is given by the product of several efficiencies:
In Equation (4),
is the efficiency of a 1.26 eV band gap silicon solar cell (with a wavelength of 980 nm) calculated using the Shockley–Queisser detailed balance model. This represents an efficiency of approximately 32.9%.
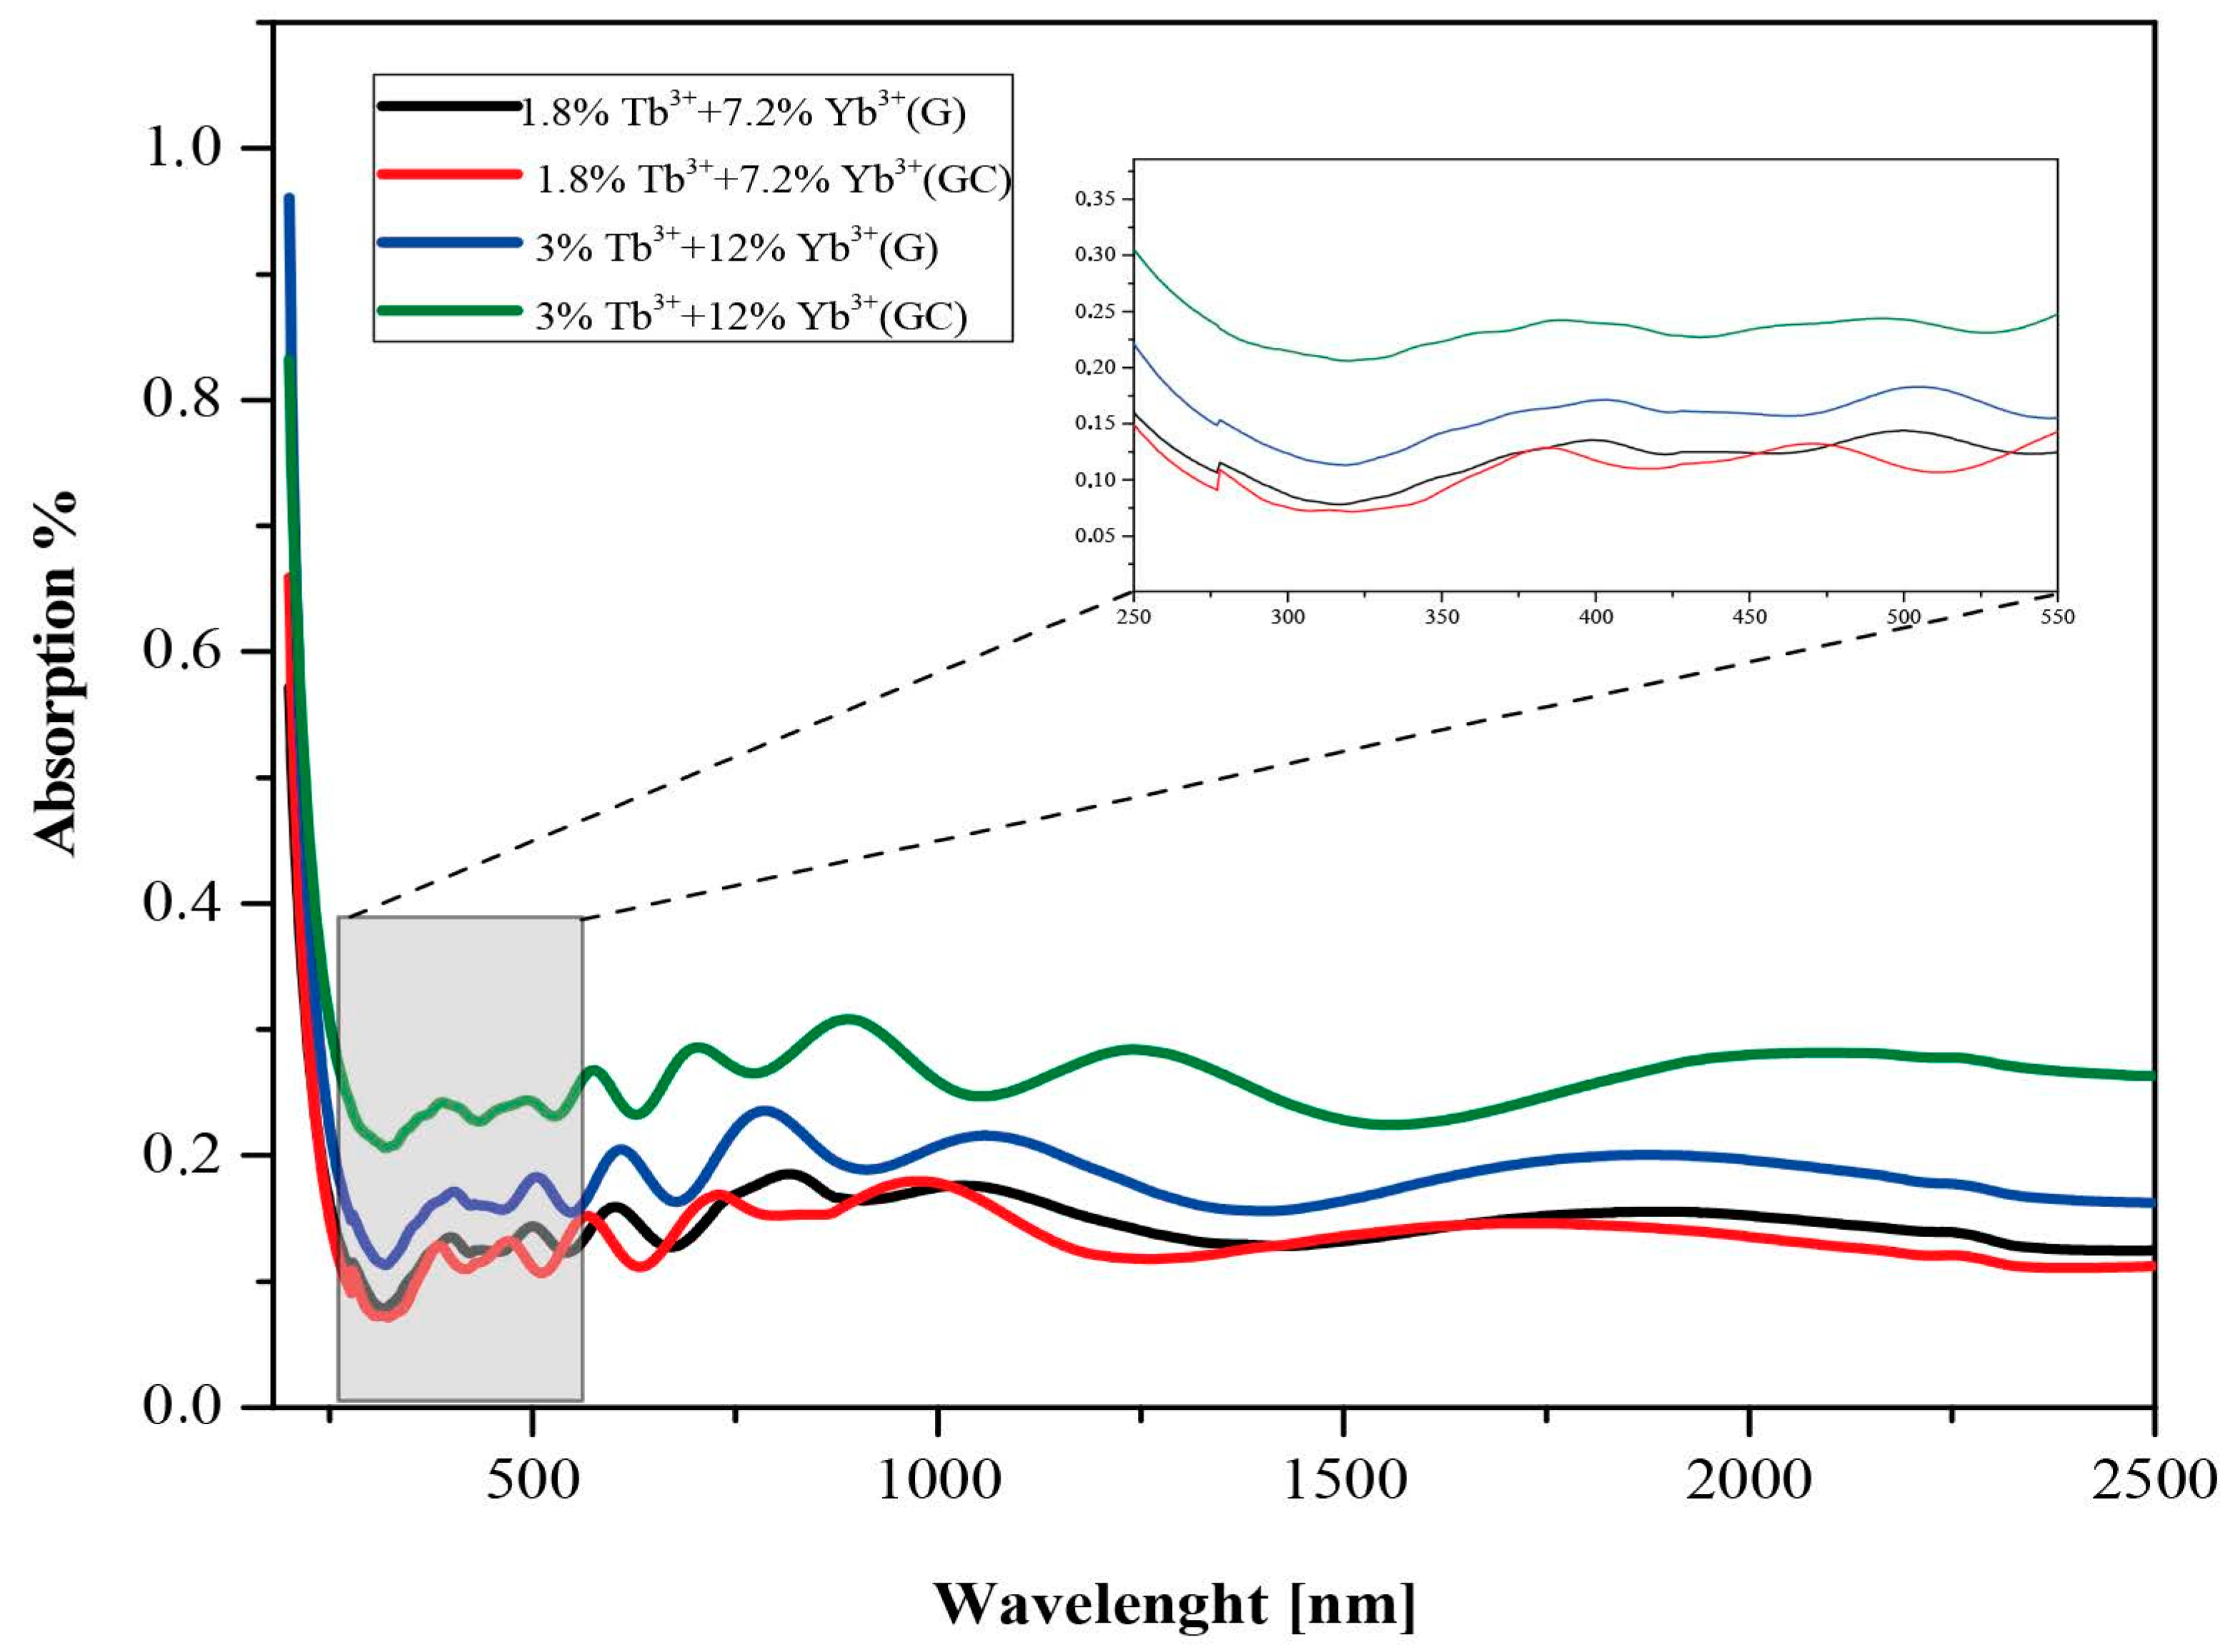
is the absorption efficiency of the downconverter layer, defined as the ratio of the absorbed intensity to the incident intensity, which is determined by the absorption spectrum of the DC layer (
Figure 10).
is the product of the energy transfer efficiency from the host matrix to
(
and the effective quantum efficiency
. It assumes that
= 100%, meaning that all photons absorbed by the host matrix are transmitted to
to participate in the downconversion process.
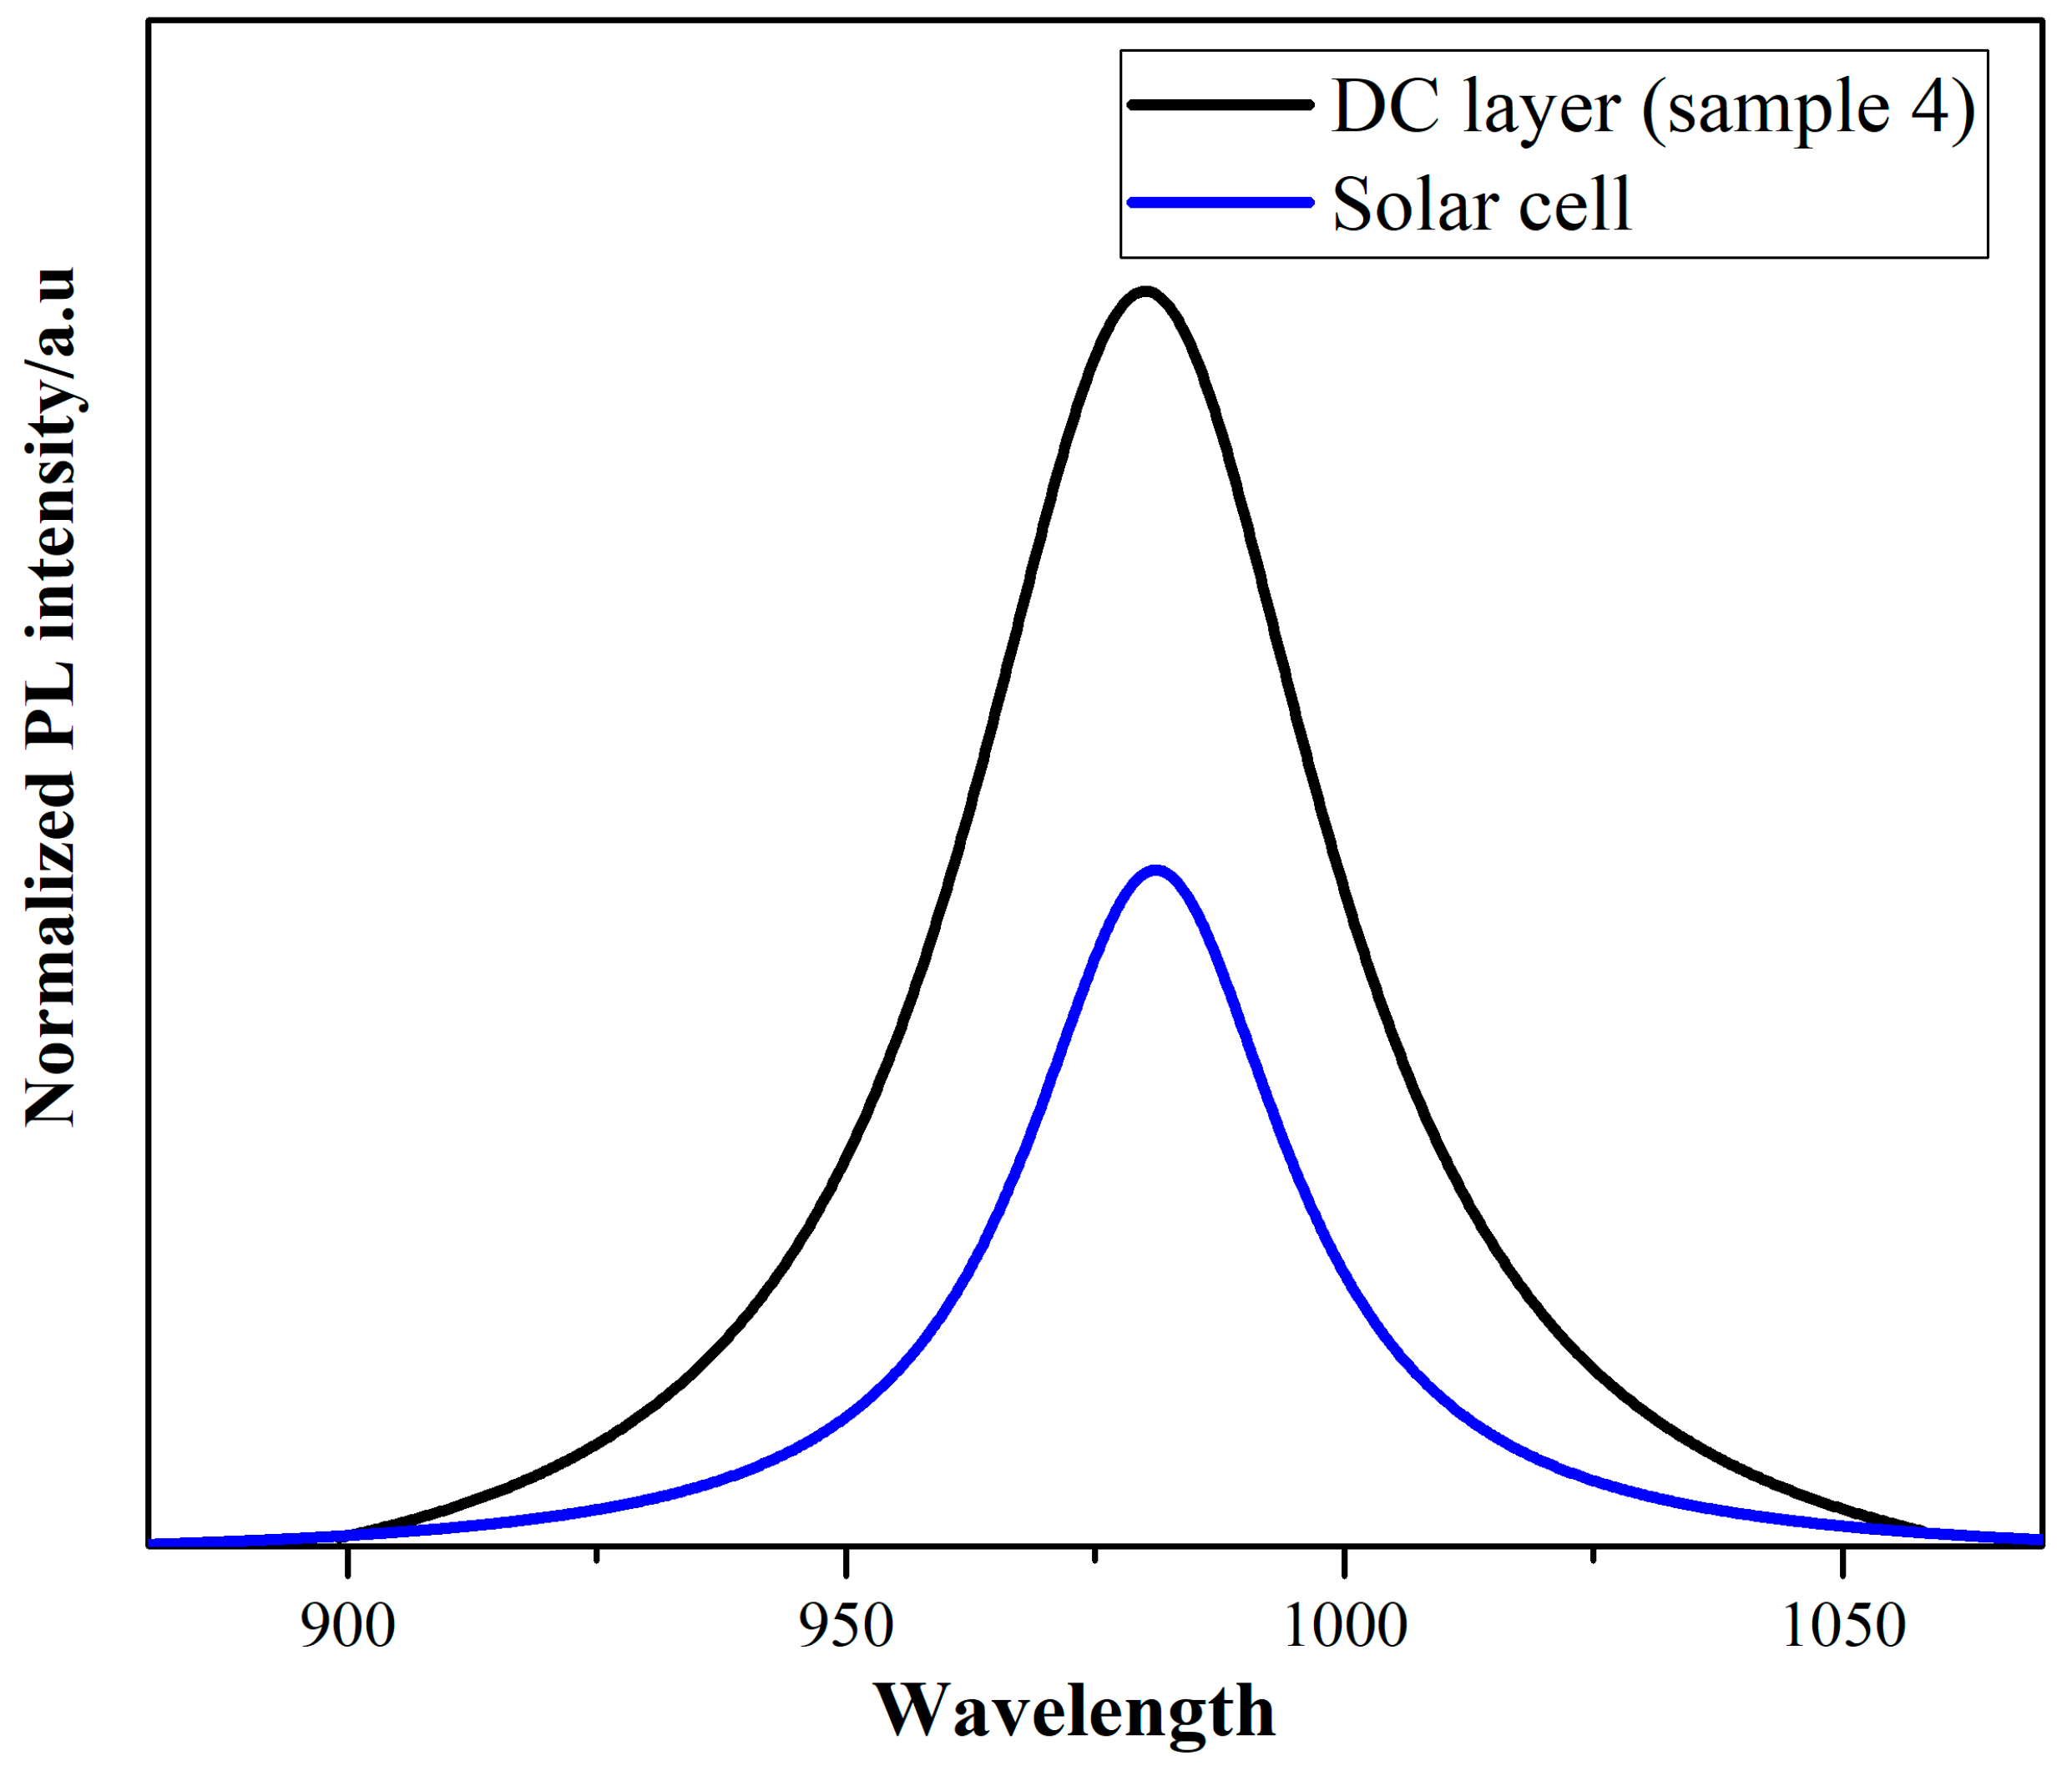
takes into account the extraction of low-energy photons that are confined within a layered medium formed by the down-converted (DC) layer stacked on the solar cell (SC). It was assumed that the Yb
3+ spectral line could be described by a Lorentzian function centered at 980 nm, having FWHM of 52 nm. The photoluminescence (PL) spectra were acquired by integrating emission angles in both the down-converted (DC) and solar cell (sc) materials, as illustrated in
Figure 11. Through numerical calculations, the extraction efficiency
was determined to be 53%.
The detailed expression of the term
in Equation (5) is:
where
corresponds to DC wavelength range (250–500 nm).
The second term
in Equation (1) is the loss of the external quantum efficiency of the solar cell caused by the presence of the downconverter layer, which partially occults the cell and can be expressed as follows:
where:
is the efficiency obtained at the middle of down-conversion range (250–550 nm) calculated in the detailed balance model by Shockley–Queisser. Assuming that the DC layer has no effect on the efficiency () and that all downconverted photons are fully extracted by the solar cell (. The absorption efficiency, , is determined using Equation (5) using the same method.
In
Table 3, the results clearly highlight the significant advantage of incorporating a DC layer, resulting in an approximate 2% to 3% increase in external quantum efficiency (EQE) compared to a bare solar cell. To properly interpret these findings, it is crucial to compare them with previous studies. Trupke et al. estimated a maximum EQE of approximately 9% [
23], whereas Abrams et al. reported a value of 7% [
29]. In contrast, our study achieved an EQE that is approximately four times lower, indicating the need for further improvements. Nonetheless, it is worth noting that the EQE can be enhanced by optimizing various technical processes.
By adjusting the size and shape of nanocrystals, the number of emission centers in the material can be increased, leading to higher light output. The dielectric constant of the silica hafnia can also be increased to promote energy transfer between the dopants, thus increasing its efficiency. Finally, optimizing the fabrication process can help decrease non-radiative recombination processes, thus improving the overall efficiency of the co-doped material.
6. Conclusions
In summary, our prototype system has successfully demonstrated that the addition of a DC layer composed of silica hafnia glass and glass-ceramic doped with Tb3+ and Yb3+ can enhance the performance of a crystalline silicon (c-Si) solar cell. The electrical characterization results show an improvement in photocurrent generation, as well as an increase in short circuit current density and external quantum efficiency (EQE). The effect is particularly remarkable, with an improvement of 10.79% and 10.78% when the solar cell is, respectively, coated with 70SiO2-30HfO2- glass and glass-ceramic. Furthermore, by combining a DC layer with the c-Si solar cell, the system exhibits an additional EQE ranging from 2.64% to 3.44%.
Overall, these results demonstrate that incorporating a layer of silica hafnia glass and glass-ceramic doped Tb3+ and Yb3+ as a down-cutting material significantly improves the performance of a crystalline silicon (c-Si) solar cell in terms of energy production and efficiency.

 and
and 


