1. Introduction
Due to the advantages of it being clean, efficient, easy to deploy, and cost-effective, wind energy has become one of the primary technologies for energy generation in most countries around the world [
1]. However, with the increase in installed capacity, the daily maintenance, defect detection, and fault prevention of wind turbines have become more urgent and important. Due to factors such as remote deployment locations, high altitude, and severe climate change [
2,
3], the daily maintenance and fault detection of wind turbines is often more challenging than other traditional power generation technologies. Among the complex structures of wind turbines, the gearbox is often one of the components with the highest failure rates. Moreover, the gearbox is usually installed at the top of a tower, 60 to 70 m or even higher, and the internal space of the wind turbine is very narrow. Once a fault occurs, maintenance is difficult to perform. These unfavorable factors pose challenges and difficulties to gearbox fault detection and also become a huge obstacle to wind turbine fault prevention [
4,
5].
The main faults in gear operation include gear wear and aging, tooth surface adhesion and abrasion, tooth surface contact fatigue, and tooth breakage. Among the common components of gearbox failures, abnormal bearing status often accounts for a large proportion. Therefore, gearbox fault diagnosis is mainly aimed at bearing fault diagnosis and prevention. In the early days, the processing and analysis of bearing signals were mainly achieved through the classical fast Fourier transform (FFT) [
6,
7]. However, FFT has shortcomings, such as low component resolution, spectral distortion, and non-smooth peak signals. To solve the shortcomings of the FFT method, researchers have proposed methods such as maximum entropy estimation [
8], autoregressive spectrum analysis [
9], and wavelet analysis [
10]. Although these methods have improved the fault detection rate of FFT, when gear faults occur the observed vibration signals are often non-stationary and contain significant noise interference. The robustness of these methods is often low, making it difficult to apply them in the complex deployment environment of wind turbines.
Recently, with the high parallelism, associative memory, efficient representation, and high fault tolerance of deep learning technology, gear fault diagnosis methods based on deep learning have emerged. The goal is to efficiently decouple and model the interrelated, high-dimensional, and noisy signal features, to identify the operating state of the gearbox from complex bearing status signals, and to achieve high-precision fault identification and prediction. In [
11] the gearbox signal was first transformed into a time-frequency spectrogram using wavelet transform, and then a fault health classification model based on a convolution neural network (CNN) was proposed. Meanwhile, [
12] designed a Bayesian state classifier based on CNNs and applied it to planetary gearbox fault detection. Ref. [
13] collected a large-scale gearbox bearing wear signal dataset and proposed a neural fuzzy prediction model based on Mamdani compositional inference. Although neural networks have strong feature extraction and signal analysis capabilities, gear signals are actually typical non-stationary and time-varying time series data, and CNNs often perform well on data types with significant spatial structures, such as images and videos, but cannot effectively model the time correlation of gear signal data [
14]. Ref. [
15] studied a deep model based on empirical mode decomposition (EMD) and recurrent neural networks (RNNs) and applied it to the state monitoring and fault diagnosis of wind turbine bearings, achieving some performance improvement. From a theoretical analysis, the effectiveness of this method is mainly due to the fact that for gearbox bearing signals, each signal component in the time and frequency domains often has its own advantages for the related tasks, and EMD can effectively decompose an unknown time series signal according to its inherent hierarchy, without human intervention, allowing RNNs to preserve the hierarchical signals that are helpful for fault diagnosis [
16,
17]. In [
18] a novel method was proposed that included ResDenIncepNet-CBAM with principal component analysis (PCA). PCA was utilized to reduce data dimensionality before extracting the wind turbine features. In [
19] Uppal et al. used genetic-algorithm-based ensemble learning for anomaly detection of wind turbines using SCADA data. The proposed ensemble method consisted of XGBoost, a random forest, and an extra tree model. XGBoost was used as a meta-model. A genetic algorithm was used for the selection of optimal features. In [
20] a novel fault prediction method based on the pair copula model was proposed. First, the conditional mutual information method was introduced, to screen out useful variables from a number of variables. Then, aiming at the limitation that the conventional copula model can only deal with two-dimensional variables, the pair copula model was introduced. In [
21] a back propagation (BP) neural network was used to train the system, taking into account the volatility and uncertainty of wind turbine parameters, and a regression prediction model with a support vector regression (SVR) algorithm was also used for training. In [
22,
23,
24] a combined principal component analysis (PCA) and convolutional neural network (CNN) was employed as the fault detection method through the optimal vibration measurements. In [
25] through the residuals between gearbox oil temperature predicted by the proposed model and monitored by the SCADA, whether the gearbox faults existed could be diagnosed. In [
26] a pre-training algorithm was proposed that could shorten the overall training time, especially for training multiple models simultaneously. However, for time series bearing signals, not every moment’s state is effective for fault detection. In other words, in the process of neural network modeling, those moments that have a positive effect on fault prediction should be adaptively assigned greater weight. Conversely, noise, interference, and task-irrelevant signals should be assigned smaller weights. This is obviously not achievable by RNN networks, so this method often performs poorly in practical applications.
To solve the above problems, this paper proposes a gearbox fault prediction method based on a soft attention mechanism and long short-term memory (LSTM) for wind turbines. For convenience, the proposed method is named “Attention Weight-LSTM” (AW-LSTM). Specifically, AW-LSTM first designs a time–frequency decomposition algorithm based on EMD, and hierarchically decomposes the non-stationary and nonlinear bearing signal data into corresponding intrinsic mode functions (IMFs) according to its inherent pattern hierarchy, obtaining different local feature signals of the original signal at different timescales. Secondly, an LSTM network adaptively extracts the temporal modes contained in the decomposed signal. However, for adjacent frames, LSTM can only linearly input the previous hidden state and cell state to the next cell unit, without distinguishing the importance of different time points for current signal modeling. For bearing signals, the contribution of different time points to the current frame is often different. However, the standard LSTM network can only treat all data frames equally, without explicitly modeling the differences in contribution between different frames for signal analysis. To solve this problem, an attention-weighted strategy is proposed, to assign different weights to the hidden states of different frames, through the attention mechanism, achieving the goal of distinguishing the contribution of different frames. Through extensive experiments, the proposed AW-LSTM is verified, to further improve the fault prediction accuracy of time series bearing signals.
2. Attention-Weighted Long Short-Term Memory Network (AW-LSTM)
2.1. Empirical Mode Decomposition (EMD)
Empirical mode decomposition (EMD) is an effective method for processing non-linear and uncertain time series signals. The basic idea is to transform a waveform with irregular frequencies into a form of the accumulation of multiple single-frequency waves. In theory, EMD can be applied to any type of time series data decomposition. Therefore, it can decompose non-stationary, nonlinear, irregular, time-varying, and noisy multi-frequency bearing signals into independently layered data representations at different frequencies, through intrinsic mode functions (IMFs).
For a given original time series , for each , the specific steps of EMD decomposition are as follows:
- (1)
Calculate the instantaneous peak value and average value of the envelope of the function
at all data points, and then use cubic interpolation to fit the envelope lines
and
of the original data separately. Finally, calculate the average value
of the envelope line:
- (2)
Subtract the mean envelope line
from all data points in the original signal
, to obtain a new data sequence
:
- (3)
Check if
satisfies the IMF constraint. If it does not, treat it as a new input sequence, and repeat steps (1) to (2) until the constraint is met. If it does,
is the first IMF component. Record it as
, separate the IMF component
from the original sequence
, and obtain the residual component
:
- (4)
The residual component is treated as a new sequence, and the above steps are repeated multiple times until cannot be further decomposed, thus obtaining all IMF components , where .
Using EMD decomposition, it is possible to decompose the bearing fault signal from the wind turbine gearbox into different trend components and time-domain signals with different frequencies, forming a series of subsequence components of different timescales. Compared to the original data, these subsequence components have stronger stability, making them more suitable for normalization. Additionally, they facilitate the analysis of effective data in the bearing signal by LSTM, while ignoring the interference caused by irrelevant component signals.
2.2. Long Short-Term Memory (LSTM) Networks
LSTM, also known as long short-term memory neural networks, has been successfully applied to various time series analysis tasks, such as natural language processing, machine translation, and human pose analysis. As the bearing signal in the gearbox is also a special type of time series data, LSTM can be naturally transferred to the gear fault signal prediction task. Structurally, RNN has a single structured hidden layer state, which is good at processing short-term input information, while LSTM adds a memory unit that can process and store long-term information. Therefore, theoretically, it can alleviate the gradient disappearance problem of traditional RNN and has better performance in extracting context information and long-distance dependency relationships of bearing signals.
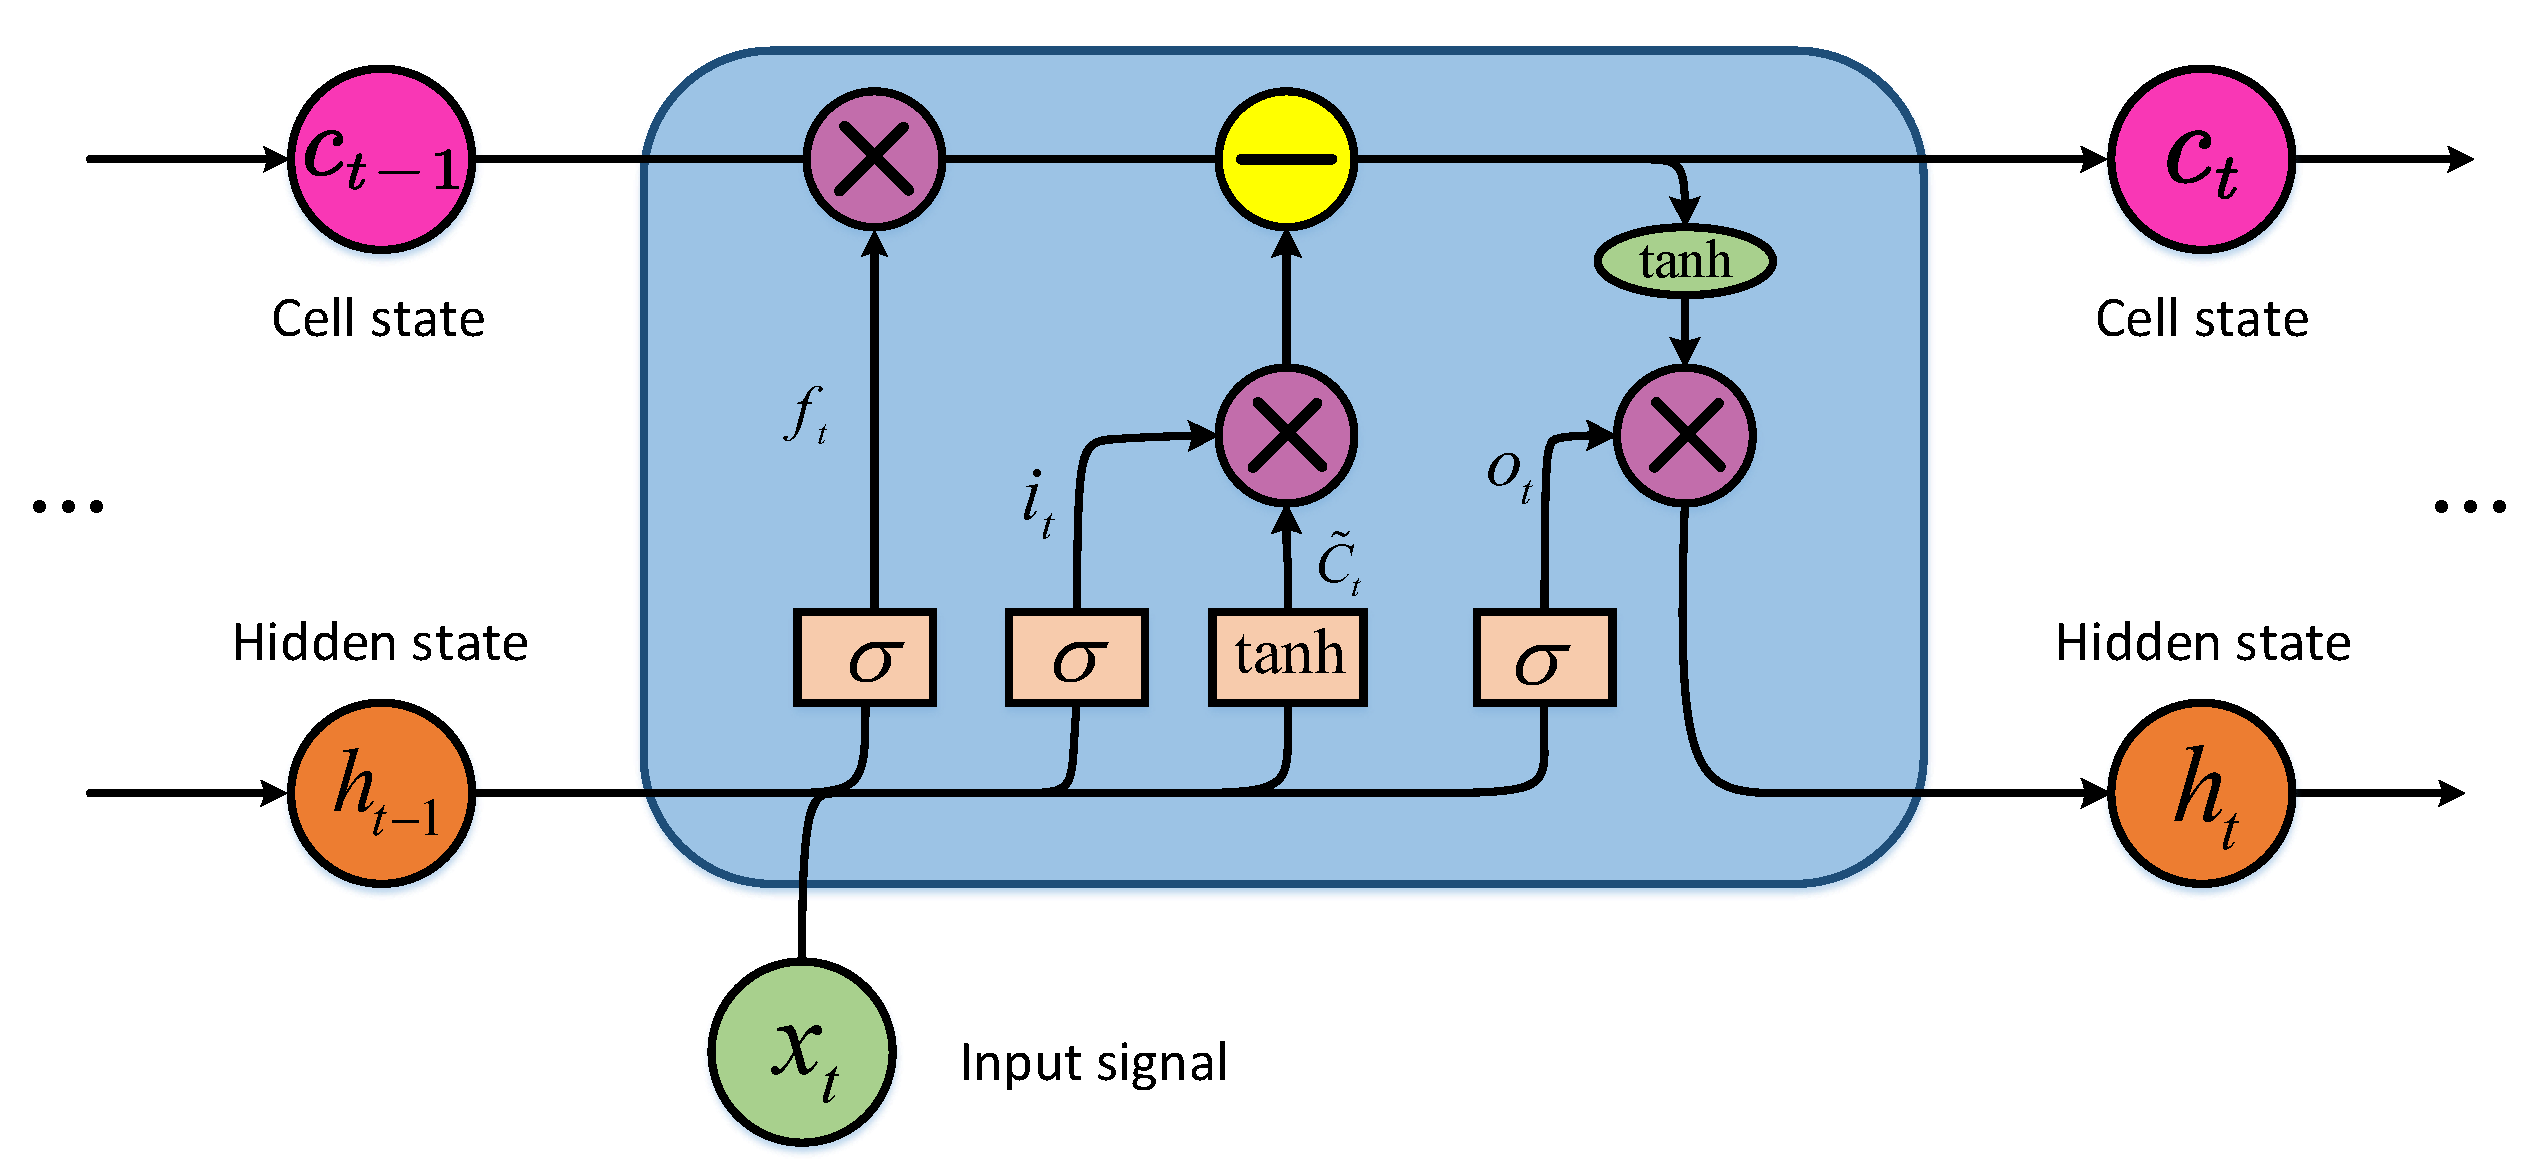
Figure 1 shows the internal structure diagram of a single LSTM unit.
Compared to the classical RNN-based temporal analysis model, LSTM contains three gates: the input gate
, the forget gate
, and the output gate
. The input gate is used to control the amount of information updated in the memory unit. The forget gate is used to control the amount of information that can be used from the previous hidden state at the current time. The output gate is used to control the amount of information outputted to the next memory unit. Given the current time
t and the previous hidden state
the LSTM unit can update the current hidden state memory state
through the internal neural network, to obtain the output vector
at the current time:
Here, , , and denote the input gate, forget gate, and output gate, respectively. The parameter set represents the weight matrix corresponding to different gates, and the parameter set represents the corresponding bias terms. The sigmoid activation function is . The symbol ⨂ represents element-wise multiplication.
Generally speaking, due to the advantages of the gate mechanism, LSTM often has a strong modeling ability for long-term dependency relationships in time series data compared to RNN networks, and has a certain fault tolerance. Moreover, EMD can effectively decompose high-frequency, low-frequency, and irrelevant components in data signals, which has natural effectiveness for processing nonlinear and non-stationary time series data. Therefore, combining EMD and LSTM, and applying them to gearbox bearing fault signal analysis, can achieve higher fault prediction accuracy. This was also one of the main starting points of this research. Unfortunately, LSTM can only treat data at all time steps equally, and cannot explicitly distinguish the importance and contribution of different data frames to fault prediction. Therefore, the performance improvement achieved by simply applying LSTM is often very limited.
2.3. Attention-Weighted LSTM Fault Detection Model
For bearing signal analysis, there is a significant temporal correlation between adjacent data frames. Moreover, the impact of previous data frames on the current frame is often different. In addition, different frames theoretically contribute differently to fault prediction in the entire time series signal. For example, signals at peaks and valleys often accompany data anomalies, making them more important for fault prediction. On the other hand, the importance of unrelated, noisy signals is lower. Therefore, if an algorithm can distinguish the importance of different data frames, it can improve the final bearing fault detection rate.
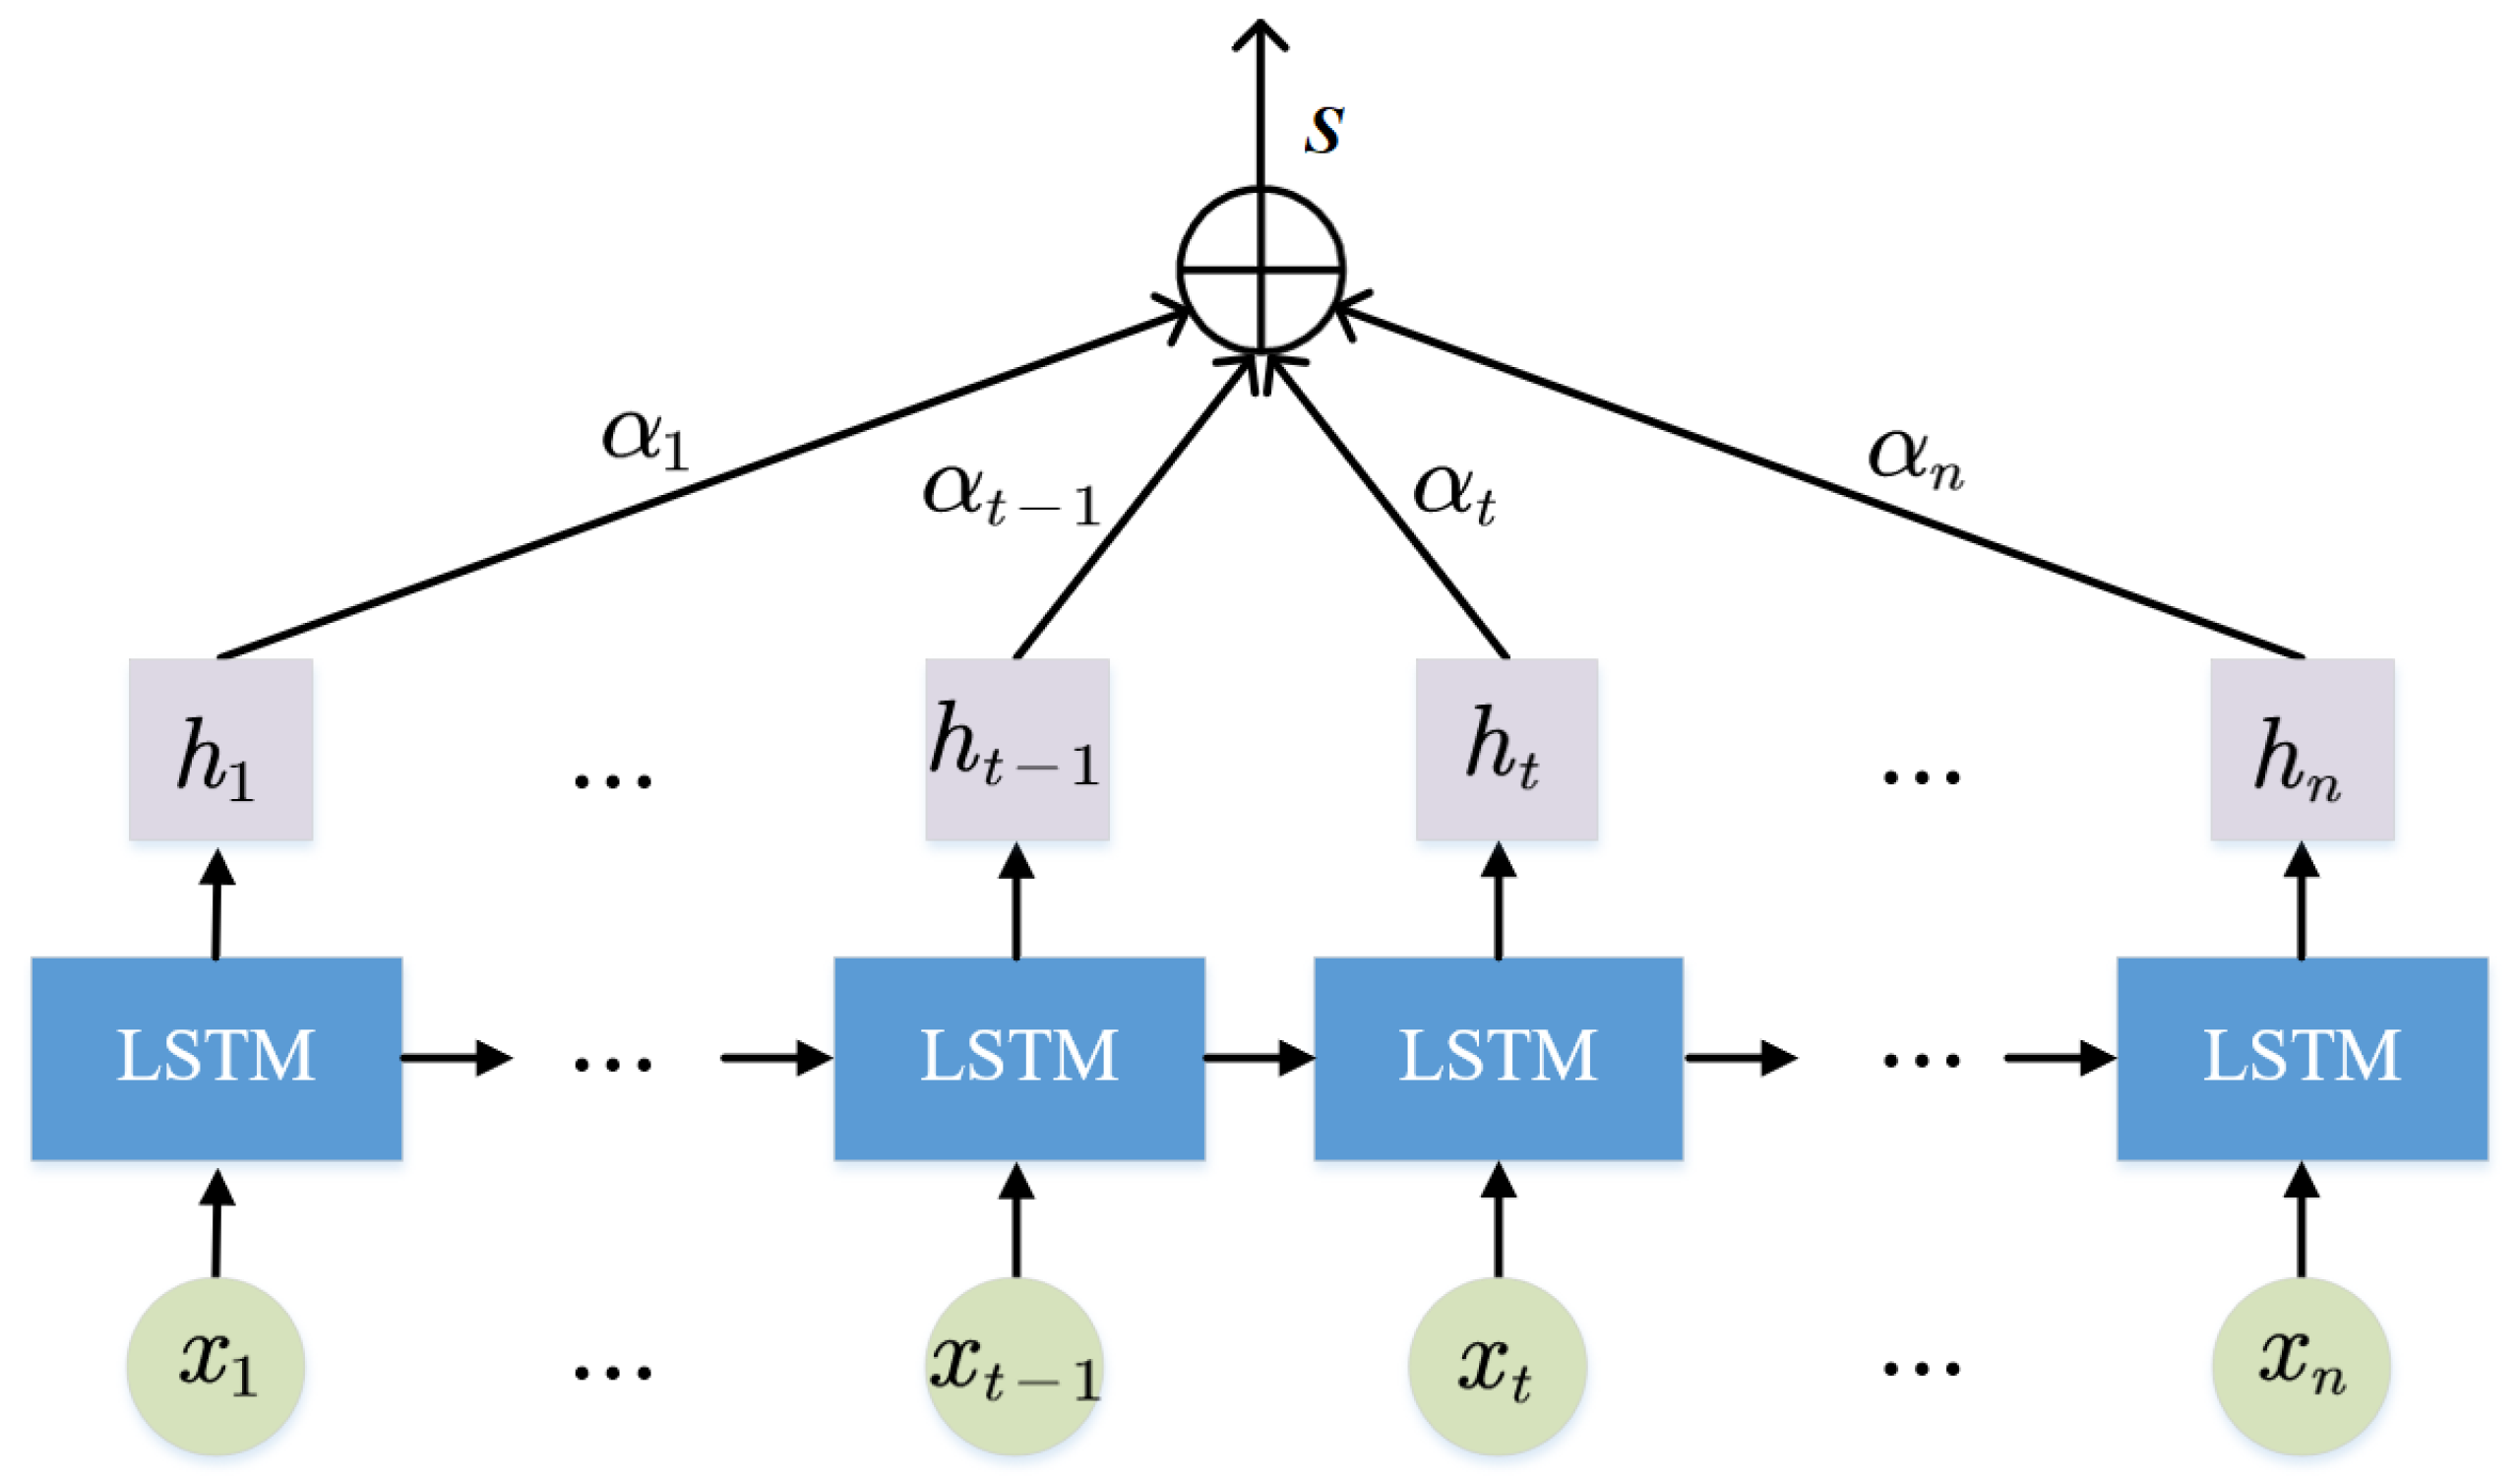
Attention mechanism is a good probability weight allocation mechanism that calculates the attention probability weights at different times. It can allow nodes that are highly relevant to the fault prediction target to receive more attention and be assigned larger probability weights, thereby improving the quality of the hidden layer feature vector and helping to improve fault prediction accuracy. The model structure of the attention-weighted long short-term memory network proposed in this paper is shown in
Figure 2.
In the attention operation combined with LSTM, for the original data signal
, with
,
is input to the LSTM network, and the output hidden state is denoted as
. Then, after attention re-weighting, the new hidden state
is obtained by jointly operating on the initially hidden state vectors
from each time step. The calculation steps include
where
is the intermediate energy value of the fourth hidden state, obtained from a full connection to the network,
and
represent the trainable weight matrices,
denotes the bias vector, and exp represents the natural exponential function. The resulting
is the attention weight, which reflects other moments’ hidden states for the present impact of the moment: if it is larger, it indicates that the
i-th frame is more important and should be focused, and vice versa, by calculating the correlation between LSTM states and the resulting attention matrix and the final re-weighted feature representation.
As shown in
Figure 3, the AW-LSTM model proposed in this paper mainly consists of three parts: a data processing module, a feature extraction layer, and a data output layer. The data processing module decomposes the original data signal into
D IMF components
through EMD. The feature extraction layer is composed of four layers of LSTM and attention operations. The data output layer is implemented through an additional fully connected network.
The implementation details are as follows.
Data processing module. The original bearing vibration signals usually contain anomalies generated during the data acquisition process, so the isolated forest algorithm is used to eliminate the high anomalies in the data. In addition, in order to help the downstream neural network layer focus more explicitly on the high-frequency response in the data and ignore irrelevant terms, such as noise interference, this paper uses EMD to decompose the signal into IMF components and residuals at different frequencies, which contains a total of components.
Feature extraction layer. The goal of the feature extraction layer is to efficiently analyze the IMF components of the bearing signal and to extract effective information, so as to achieve high-precision fault detection. This is mainly achieved through the following three steps.
Step 1: For the
d-th IMF component, assuming the current output vector of the current step is
and the previous hidden state
, calculate the current hidden state. For simplicity, the update of the long short-term memory network in Formula (4) is simplified as
where the data dimension of the hidden unit is 256, and where
and
are the hidden states of the previous and current steps.
Step 2: Allocate attention weights
to the LSTM hidden state according to the attention operation, and calculate the new hidden layer state vector
, as shown in Equation (
5). It is worth noting that the dimension of the obtained attention hidden feature
is consistent with the initial hidden state. Since the attention weights at each time point are different, the initial hidden state at each time point also plays a different role in fault prediction. Moments that are helpful for fault prediction are assigned larger weights, while those that are not important are assigned correspondingly smaller weights.
Step 3: Stack layers of attention-weighted long short-term memory networks (AW-LSTM), to increase the model’s robustness and expressive power, and use different IMF components as inputs to the neural network in parallel.
Data output layer. The function softmax is used to calculate the label distribution probability of different IMF components on annotated data at each time point, and the outputs corresponding to
D IMF components are averaged to obtain the final result
:
where
is the weight matrix between the attention hidden layer and the output layer,
is the bias term, and
represents the probability of a fault occurring in the current bearing signal. If
, a fault is considered to exist; otherwise, the gearbox is fault-free. The structure diagram of the proposed AW-LSTM gearbox fault detection model is shown in
Figure 3.
3. Experimental Analysis
3.1. Description of Gearbox Data
The gearbox is the core component in improving the speed of fan blades: its failure can easily to lead to wind turbine shutdown and other serious conditions. The gearbox is mainly composed of four parts: bearing, gear, transmission, and drive shaft. The mechanical energy generated by blade rotation is passed through the spindle to the gearbox, to increase the speed of the gears, which accelerate in order to provide more mechanical energy to drive the wind turbine. After the transmission is put into use, its load is unable to maintain a stable state, coupled with its long-term maintenance in a harsh environment, so that the gear in the transmission can easily break. In the process of manufacturing, gear tooth shape and tooth gap and error can easily occur, coupled with wear and tear in the process of transportation and installation. These are important reasons for the failure of gearbox. Combined with the theory of vibration dynamics, a simple vibration model of gearbox vibration can be established, to analyze the phenomenon of gear modulation, the time-frequency characteristics of the vibration signal when the gear fails, and the common vibration signal analysis methods of the gearbox.
For this paper, two types of wind turbine gearbox datasets were used for experimentation: the SCADA (supervisory control and data acquisition) dataset and the OWT (offshore wind turbine) dataset. The wind turbine experimental platform mainly included five components: (1) magnetic particle loader, (2) gear accelerator, (3) torque sensor and speed detection, (4) three-axis accelerometer, and (5) three-phase asynchronous AC motor. The wind turbine gearbox speed was 1500 rpm, and the sampling frequency was 10 KHz. The vibration signal was collected through two accelerometers. The two bearing models were NJ210 and NJ405.
3.2. Description of Comparison Methods
To fully validate the effectiveness of the proposed algorithm, this paper used four fault detection models that have emerged in recent years as comparison methods: (1) EMD–GRU (gated recurrent unit with empirical mode decomposition); (2) LSTM (long short-term memory network); (3) CNN (convolutional neural network); (4) FFT (fast Fourier transform).
3.3. Analysis of Gearbox Fault Signal Characteristics
Based on the analysis of the vibration signal characteristics of the gearbox fault, it is known that in the actual rotation process, when the gear produces a vibration signal, the amplitude and frequency will affect one other [
12]. The author summarized the gear failure operation and vibration signal modulation phenomenon, and detailed information can be found in
Table 1 and
Table 2.
From the above two tables, it can be seen that the time-domain and frequency-domain characteristics of the vibration signals of the gear in the fault state show a variable state. Due to the interference of wind power size, the load of the mechanical transmission system cannot maintain a stable state, especially in the mountainous and hilly areas of China, where the complex terrain will have different degrees of impact on the airflow changes, resulting in wind power instability.
Therefore, when diagnosing the gearbox fault, the unstable data of the signal of the faulty gearbox should be removed, to maximize the accuracy of the fault diagnosis.
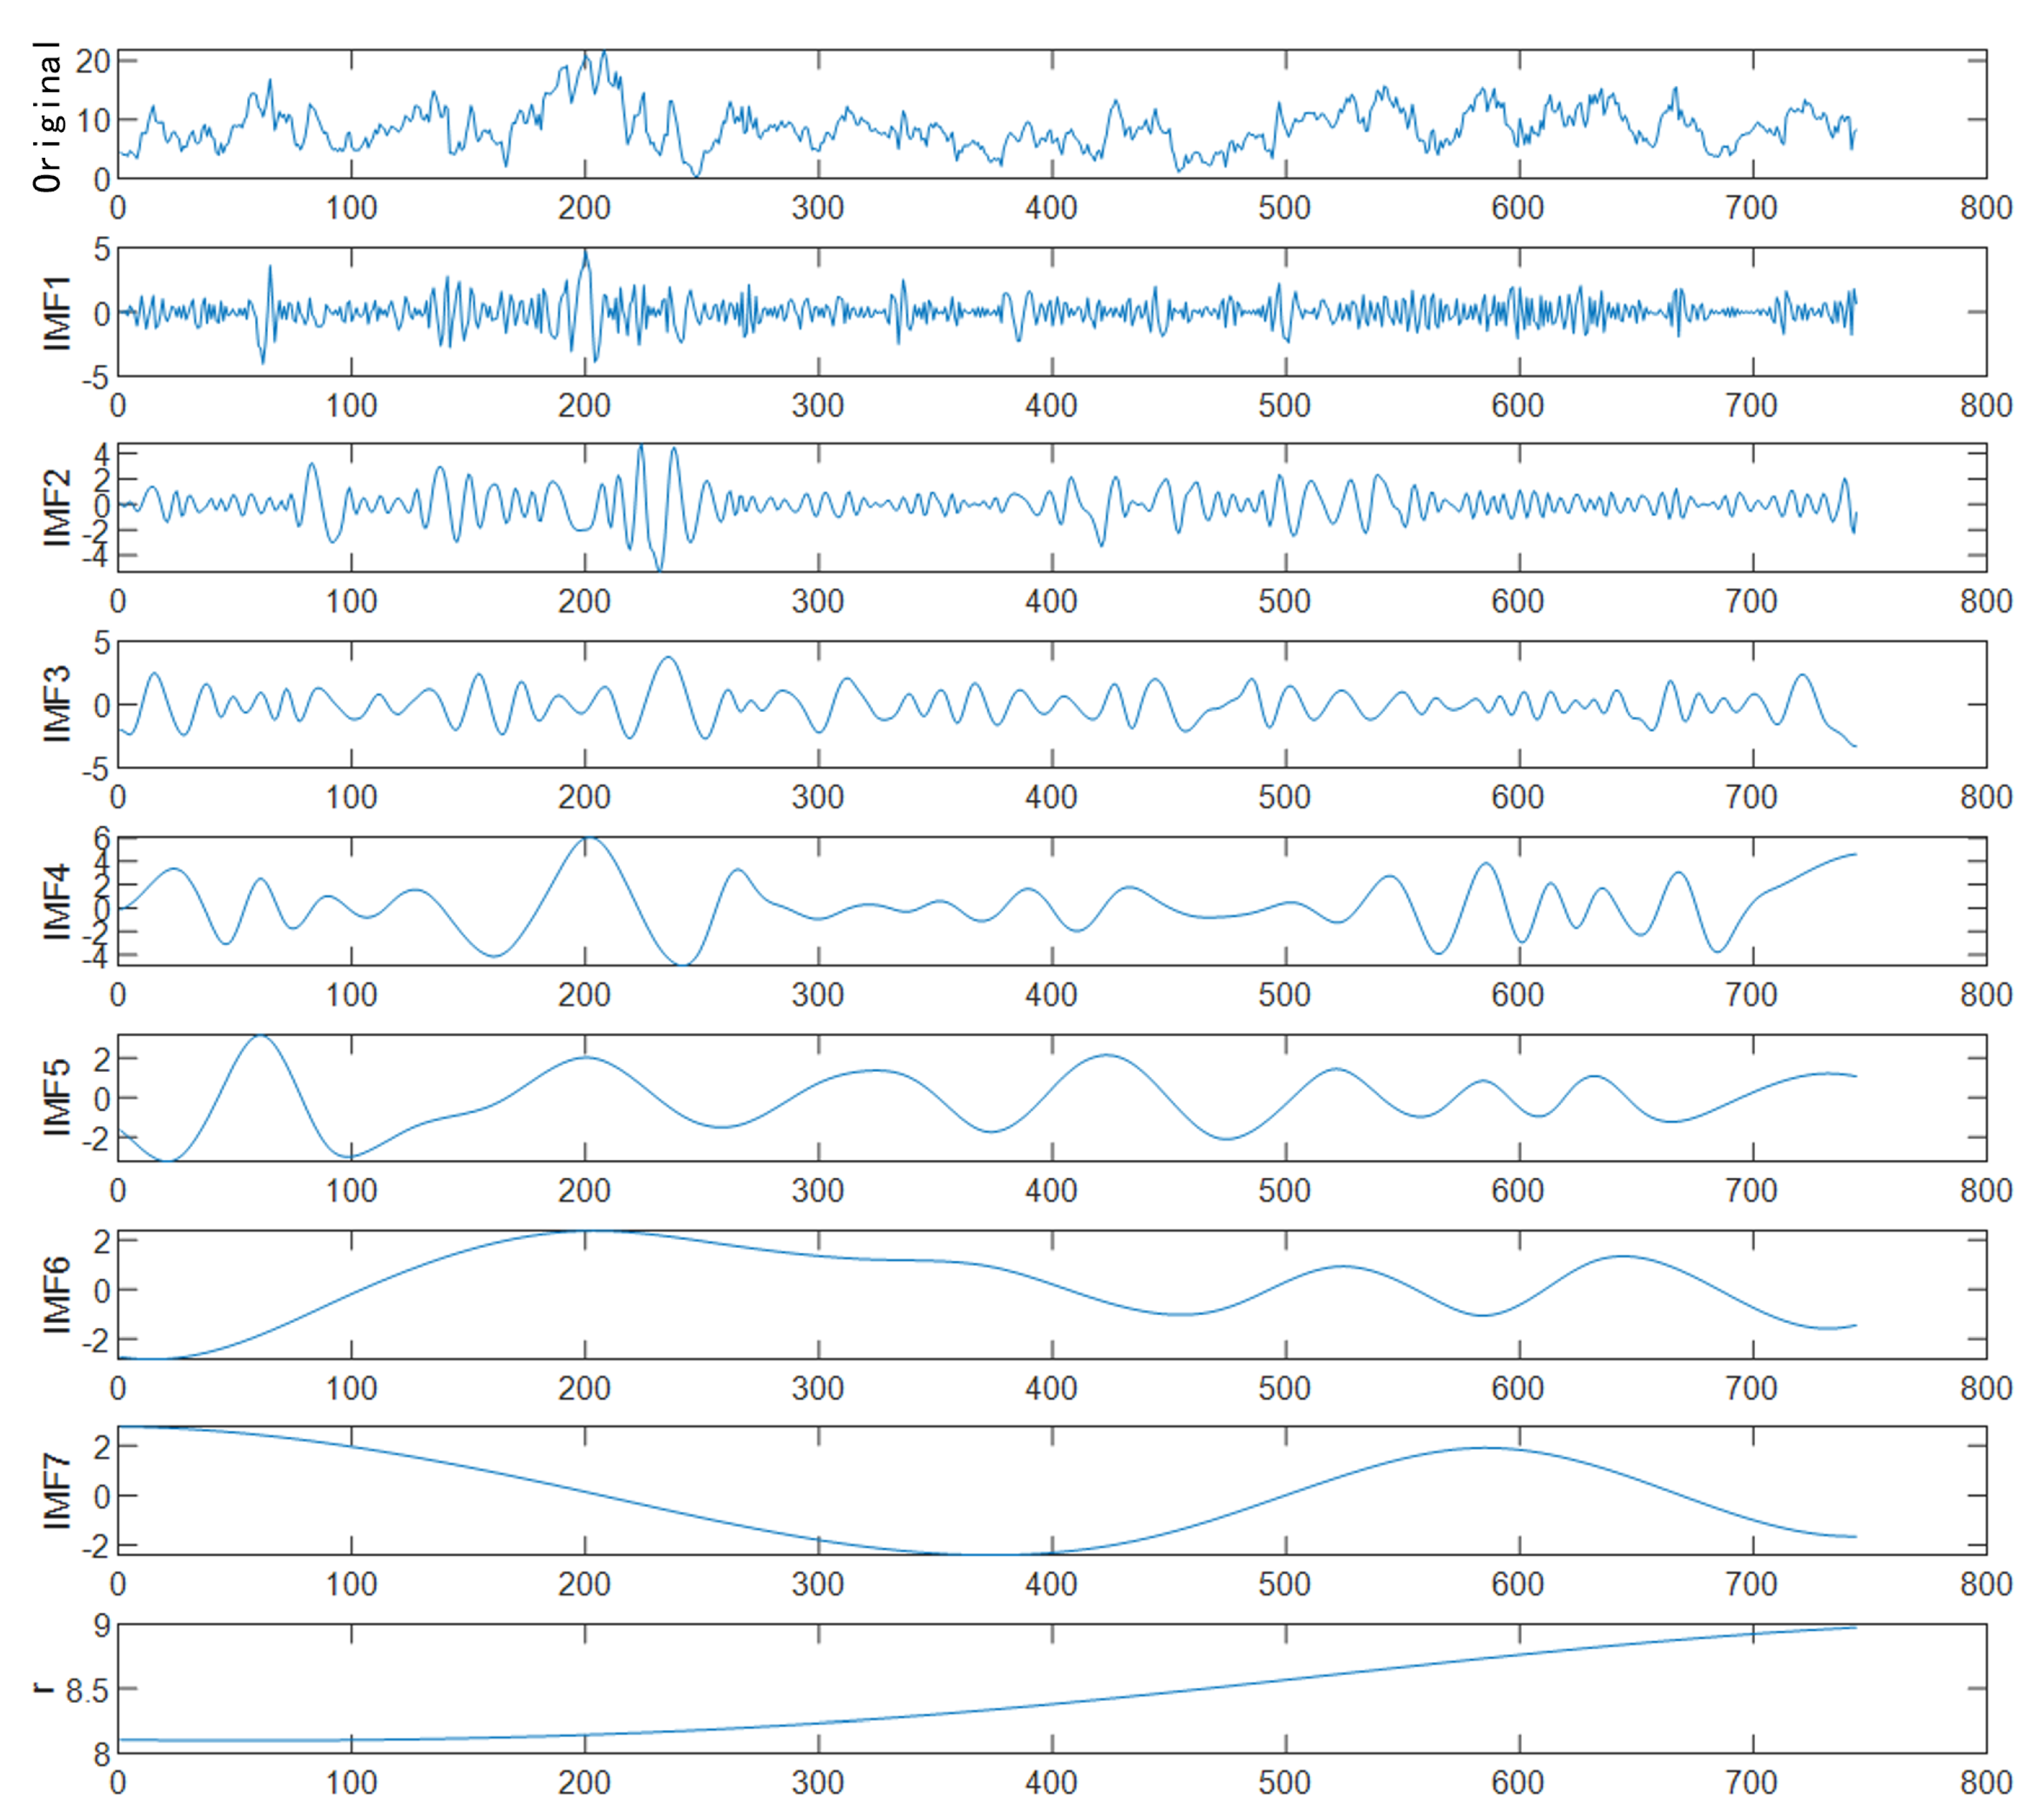
Figure 4 show that six subsequences
and one residual component
are obtained by the EMD decomposition.
Based on the above analysis, this paper further studied the distribution of gear vibration signals, summarized the causes and forms of wind turbine bearing faults, collected vibration acceleration signals through professional methods, and uploaded them to sensors. Finally, important parameters used in the vibration signal of the gearbox were used as fault feature indicators for gearbox fault diagnosis.
3.4. EMD Fault Data Decomposition
By using EMD for decomposition, the preprocessed sample data was decomposed into seven IMF components and one residual component
, of which IMF1, IMF2, and IMF3 were the high-frequency signals, IMF4 and IMF5 were the mid-frequency signals, and IMF6 and IMF7 were the low-frequency signals, forming multidimensional vector data. Compared to the original data, the decomposed IMF components became smoother. The experimental simulation is shown in
Figure 5 (
is included in the IMF components).
3.5. Experimental Implementation
Software: Matlab R2020a (Math-Works); Windows 11 operating system; the processor is Intel-Core i9-10th; the graphics card is Nvidia GTX1080Ti.
Network structure: After multiple experiments, the number of hidden neurons was selected as 32, with a structure of 5-10-1 and LSTM layers of four. The loss function was the mean square error RMSE. The attention mechanism dimension was 256, and there were 250 iterations. In addition, learning and momentum factors were included, with values of 0.01 and 0.04, respectively. The input data length was 750 and the output length was 220.
Comparison standards: Three comparison standards were selected in this paper, to evaluate the performance of different algorithms, including the root mean square error (RMSE), the mean absolute error (MAE), and the mean absolute percentage error (MAPE).
Data preprocessing: The AW-LSTM network involves different physical quantities, and different input nodes may have varying values, due to different environmental factors [
13]. Therefore, this paper first normalized the experimental data, to ensure the stability of the neural network training phase, with data normalization as follows:
where
represents the original data,
represents the normalized data, and
and
represent the minimum and maximum values in the data, respectively.
Model training: To verify the effectiveness of the AW-LSTM model, this paper used the bearing signal data of the first two months as input to predict the load data of the following week. The weights of the neurons in the proposed model were initialized using Gaussian distribution with a mean of 0 and a variance of 1.
Figure 6 shows the training error convergence curves of the proposed AW-LSTM algorithm on different datasets. The left figure shows the error curve with 12 months of SCADA data as the training set and the right figure shows the error curve with 12 months of OWT data as the training set. The AW-LSTM network parameters were set as follows: an Adam optimizer was used for optimization, with an initial learning rate of 0.002. It can be observed from the figure that the proposed AW-LSTM reduced the training error gradually, with the increase of iteration times on different datasets, which demonstrates the effectiveness and generalization of the proposed algorithm. Moreover, it can be observed from
Figure 5 that AW-LSTM gradually converged at 1000 iterations on the two public datasets, indicating that the proposed method has good convergence speed.
3.6. Experimental Results
Comparison between AW-LSTM prediction results and actual values: After training the fault signal feature analysis indicators, the network model could be input for testing the AW-LSTM fault prediction model. The SCADA database recorded some training sample data information. Under consistent experimental conditions, and with the help of the AW-LSTM network principle, the effect of AW-LSTM on gearbox faults was analyzed. At the same time, an AW-LSTM prediction model combining LSTM with the attention mechanism was constructed.
Figure 6 details the prediction error of the network. It can be seen that the proposed AW-LSTM model had a very small deviation between the predicted accuracy and the actual values that was almost indistinguishable by the naked eye.
This result fully demonstrates the performance of the AW-LSTM model. Detailed Results Analysis: To fully validate the effectiveness of the proposed AW-LSTM algorithm, this paper selected FFT, LSTM, CNN, and EMD–GRU as the comparative methods. Additionally, the root mean square error (RMSE) was calculated for different prediction time steps (60, 100, 160, 200, 220) on two different datasets (SCADA and OWT). The prediction results on the SCADA dataset are shown in
Table 3, and the prediction results on the OWT dataset are shown in
Table 4. The bold results indicate the accuracy achieved by the proposed AW-LSTM model in this paper. Overall, AW-LSTM had higher prediction accuracy for different time steps, and the error between the predicted and actual values was very small. In particular, compared to the comparative methods, the long-term prediction results of AW-LSTM were significantly better, indicating that the proposed method has a significant advantage in fault prediction performance. This is mainly due to the fact that the LSTM network can model the time correlation between different data frames in the bearing signal well. Additionally, compared to the comparative methods, the attention mechanism used in AW-LSTM can extract the weights of different frames fully, as well as the different contributions to the model performance. At the same time, the attention mechanism can assign small weights to irrelevant or interfering data, while assigning more attention to data that can contribute significantly to prediction accuracy.
AW-LSTM identification results for different gear operating modes: In addition, to better validate the effectiveness of the AW-LSTM network in diagnosing gearbox faults, this paper trained and tested the network using test data samples under different gear operating modes of the wind turbine signal in the same experimental environment. The EMD–GRU method, which performed well in the previous experiments, was selected as the comparative baseline, and the identification results are shown in
Table 5. It can be seen that AW-LSTM has good prediction accuracy for different gear modes.
Average Results Analysis: In the process of identifying gearbox faults, this paper concludes—through sufficient experimental verification and analysis—that, compared to the FFT, LSTM, CNN, and EMD–GRU networks, the advantages of the AW-LSTM network lie in its accurate diagnostic function, convergence speed, and strong diagnostic adaptability. For example, when identifying gearbox fracture, the RMSE error of the AW-LSTM network was reduced by more than 10%, compared to the best-performing comparative method. In addition to the distributed RMSE error, the average RMSE, MAE, and MAPE for all prediction time steps on the two datasets were also calculated for this paper. The experimental results are shown in
Table 6. It can be seen from the results that the RMSE, MAE, and MAPE obtained by the four comparative methods were larger than those of the proposed AW-LSTM. The experiment shows that the fault prediction accuracy of the wind turbine gearbox based on AW-LSTM is higher than that of the fault diagnosis accuracy that has emerged in recent years, while maintaining the completeness of wind turbine gearbox fault signal data. Additionally,
Table 6 compares the inference time overhead of different methods, and it can be seen that the proposed AW-LSTM model has a lower time overhead during testing, making it more conducive to the deployment of the model in practical environments.
4. Conclusions
This work proposes a novel model for predicting wind turbine gearbox failures using neural networks and signal processing techniques. We introduced the use of SCADA and OWT datasets for experimentation, and we compared the effectiveness of four methods—EMD–GRU, LSTM, CNN, and FFT. We analyzed the characteristics and distribution of gearbox vibration signals, summarized the causes and forms of wind turbine bearing failures, and proposed gearbox fault feature indicators. We also described the software and network structure used in the experiments, and we evaluated the performance of different algorithms using three comparison standards. We provided a detailed discussion of the data preprocessing and model training for the AW-LSTM model, and we presented a comparison of the AW-LSTM prediction results to the actual values. Our experimental results show that the proposed AW-LSTM model has higher prediction accuracy, better diagnostic capabilities and convergence speed, and stronger diagnostic adaptability than the other four methods, making it a promising approach for fast fault diagnosis in wind power generation systems. The algorithm code will be publicly available after the paper is accepted. Authors should discuss the results and how they can be interpreted from the perspective of previous studies and of the working hypotheses. The findings and their implications should be discussed in the broadest context possible. Future research directions may also be highlighted.
For this paper, during the experimental process, the SCADA data, as well as the OWT data, were individually used for fault prediction, and the generalization ability of the model has not been verified. The next step will be to select sample data from multiple wind farms for hybrid modeling training, to further improve the accuracy of similar anomalous pattern judgments, and to enhance the generalization ability of the model.


