Article

Experimental and Numerical Study of the Performance of an Open-Type Multi-Deck Refrigerated Cabinet with Single and Dual Air Curtain

Department of Mechanical and Materials Engineering, Vilnius Gediminas Technical University, Plytinės Str. 25, 10105 Vilnius, Lithuania
*
Author to whom correspondence should be addressed.
Appl. Sci. 2023, 13(16), 9080; https://doi.org/10.3390/app13169080
Submission received: 2 July 2023 / Revised: 27 July 2023 / Accepted: 7 August 2023 / Published: 9 August 2023
(This article belongs to the Special Issue Industrial Applications of Computational Fluid Dynamics)

Abstract

:
This study utilizes a simplified two-dimensional time-dependent computational fluid dynamic (CFD) model to compare the performance of single- and two-layer air curtains in an open-type multi-deck refrigerated display cabinet. Two layers of air curtain generate a more effective invisible barrier from ambient air impact that can reduce electrical energy consumption and maintain a uniform temperature distribution within the cabinet. The CFD model of a refrigerated display cabinet was validated by the experimental data. The results showed a two-layer air curtain advantage over a single air curtain. Electrical energy consumption decreased by 18.5%, and the average temperature of the test products decreased from 5.75 °C to 5.17 °C. The results obtained are important for cabinet design to improve the quality of product storage and reduce energy consumption.

1. Introduction

Open-type multi-deck semi-vertical refrigerated display cabinets are primarily popular in retail food stores as promo refrigerators. This type of cabinet attracts customers without any physical barrier between the customer and the products and increases the sales of the products. Today, the energy consumption of refrigerating systems is one of the most essential factors for retail food stores. In this case, open-type refrigerated display cabinets (OTRDCs) with two air curtains use less energy than OTRDCs with a single-layer air curtain because the two layers form a stronger invisible barrier between ambient air and inside air. Open-front refrigerated cabinets are less energy-effective than closed refrigerated cabinets. Many researchers carried out numerical and experimental investigations to improve the efficiency of open-type vertical refrigerated cabinets. Although many studies have been conducted on the performance of open/closed refrigerated cabinets [1,2,3,4,5,6,7,8,9,10,11], most of them developed computational fluid dynamics (CFD) models and compared numerical results with experimental data. As a result, few studies have presented systemic strategies for performance optimization by investigating the relationship between multiple parameters. Cao et al. [1] applied a two-fluid cooling loss (CLTF) model and a support vector machine (SVM) algorithm, which successfully achieved a better prediction of cooling loss. In this simulation, the cooling loss is reduced by 19.6%. After being validated using experimental data, the total energy consumption/total display area (TEC/TDA) of the optimal display case was found to be reduced by 17.1%. An SVM algorithm was developed that was trained to optimize design parameters with minimum cooling loss [1]. The purpose of the study was to choose the correct air curtain speed and temperature with minimal cooling loss. Utilizing the SVM algorithm for optimization strategies can significantly reduce the time required to optimize the air curtain of the refrigerated cabinet. Moreover, in the majority of cases, employing the SVM algorithm leads to improved accuracy performance compared to manual parameter selection.
One of the most important tasks is to investigate the impact of the environment on the cooling process. The ambient influence is a major factor that must be taken into account to achieve a well-designed air curtain. Yuan et al. [11] conducted a study comparing face-to-face and face-to-back placements of multi-deck display cabinets that were placed in several rows in a supermarket. The face-to-back method demonstrated advantages, including lower ambient air temperatures, stronger environmental coupling, and effective prevention of hot air. Moreover, the isotherm distributions varied, with face-to-back exhibiting higher density above and near the top, while face-to-face showed a uniform distribution above and a sparse one near the ground. This investigation holds significant importance in understanding the impact of the environment on open-type display cabinet performance. The findings highlight that the face-to-back placement method can acquire a better food refrigeration performance, and the food temperature is 0.3 to 0.5 °C lower than that of the face-to-face placement method [11]. Nascimento et al. [6] investigated the impact of the customer on the cold chain. In this case, a robotic mannequin was used to systematically simulate the movement of customers inside the store and quantify the increase in air temperature and thermal load due to this disturbance. Li et al. [5] investigated the impact of ambient airflow velocity and direction on the performance of an open-type refrigerated cabinet with two air curtains and, after that, compared the performance of OTRDCs with one and two air curtains. The results show that the OTRDC with two air curtains has better performance than the OTRDC with a single air curtain, which can save energy up to 41.6%. Comparison of the electrical consumption of doored and open cases plays an essential role in energy-saving strategies. Fricke and Becker [3] compared a typically available refrigerated display case line-up with a typical glass door refrigerated display case line-up with the aim of quantifying the difference in overall energy consumption for each type. It was established that per unit length of case line-up, the open display case line-up consumed approximately 1.3 times more energy than the doored display case line-up. For this investigation, a Coriolis mass flow meter was used to determine the refrigerant mass flow rate; electrical energy consumption was determined using kWh transducers, the ambient dry-bulb temperature was measured by thermocouples, and the relative humidity was measured with a humidity sensor.
Many investigations have been carried out in terms of the jet effects of air curtains. Field and Loth [2] presented the study of the entrainment of refrigerated air curtains down a wall. In this work, negatively buoyant wall jets with high inflow turbulence were studied in the Richardson number range of 0.13–0.58 and in the Reynolds number range of 4200–8000, and it was found that the dimensionless thermal energy loss decreases with decreasing Reynolds number. Zhou et al. [12] focused on studying the jet directions of complex air curtains and evaluated the smoke prevention effect of air curtains from two points of view: smoke and temperature insulation performance. Hammond et al. [4] developed a design guide that enables cabinet designers with limited fluid flow expertise to quickly identify the most efficient air curtain design to seal any given cavity from fundamental measurements without the need for intensive computation. Sun et al. [7] and Tsamos et al. [8], in their investigations, used air guiding strips and cold shelves to achieve the low infiltration of surrounding air and the correct temperature of the testing products with less energy consumption. The results show an energy saving of 16.7 kWh/24 h compared to the unmodified cabinet. The porosity of the back panel impacts the formation of the air curtain. Wu et al. [10] focused on the analysis of the effect of porosity and the location of the perforations on the back panel on the temperature distribution of the products in the vertical open-type refrigerated display cabinet. In many studies, the porous jump model is used to simulate the back panel structure. The porous-jump model is a porous medium and is considered fractal. Liang et al. [13], in their study, present the fractal theory and describe the influence of parameters on diffusion. The other work [14] presents the mathematical model for the transverse permeability of the gas diffusion layer considering the effects of the electrical double layer (EDL). Such mathematical models of fractals ensure the best accuracy and are often found in authors’ works but with limited applicability in research objects such as refrigerated cabinets.
Turbulent flows are commonly solved using four numerical methods: the finite volume method (FVM), the finite difference method (FDM), the finite element method (FEM), and the boundary element method (BEM) [15]. While in various studies of refrigerated cabinet airflows, the FEM and FVM have been employed for numerical computation, the BEM stands out for its computational efficiency, as it only requires discretizing the domain boundaries rather than the entire domain. Moreover, this method finds extensive application in other scenarios, including determining opening displacements in crack problems [16]. The FDM method, which was used in the Rai and Moin study [17], is no longer used as a standalone approach today. Instead, it is commonly combined with the difference transformation method (DTM) [18].
In summary, the majority of the works cited concentrate on improving the multi-deck display cabinet’s performance, encompassing air curtain characteristics, food temperature stability, and the impact of various placement methods. However, only a few studies have explored the correlation between numerical study times, quality, and experimental research. In particular, a previous work [9] introduced a straightforward and rapid 2D numerical analysis of airflows and temperature changes in the OTRDC performed for different shelf configurations and honeycomb inclination angles in order to compare the proposed and unmodified OTRDCs with respect to the internal temperature distribution, air curtain formation time, and temperature variations of M packages placed in different places in the OTRDC [9]. This study builds on previous research and conducts a comparative analysis between numerical and experimental results obtained for OTRDCs equipped with single- and two-layer air curtains. The primary objectives are to improve the quality of the refrigerated cabinet development and to reduce the time required for experimental investigations in testing chambers. Employing Comsol Multiphysics 5.5 software (COMSOL AB, Stockholm, Sweden), the simulation examines heat transfer between food products, the surrounding environment, and the interior air. The study evaluates the temperature distribution inside, the air curtain formation time, the average temperature in the middle plane, temperatures of outtake and intake air, and the electrical energy efficiency by comparing single- and two-layer air curtains in the OTRDC.

2. Materials and Methods

2.1. Object of Research

Figure 1 shows a schematic and a picture of the multi-deck OTRDC (Mercury refrigerated cabinet made by the Freor LT Company (Vilnius, Lithuania)) that is able to keep the food between the minimum −1 °C and the maximum +7 °C. The refrigerator has five food shelves: four attached to the wall and one shelf below (Figure 1 Left). The height of the cabinet is 2005 mm, the depth is 845 mm, and the width is 2500 mm. The distances between the shelves are as follows: between the lower shelf and the base, 290 mm; between the 1st and 2nd, 2nd and 3rd wall shelves, 300 mm; and between the 3rd and 4th wall shelves, 270 mm. A 10 mm gap is provided between the perforated back panel (PBP) and the rear end of the shelves. This clearance allows better cold exchange of the products with the air from PBP and reduces the risk of products freezing. Other cabinet characteristics and dimensions are shown in Table 1 and Figure 1 Left.
Two types of open-type refrigerated cabinets were studied: with a single air curtain and two air curtains. Three streams of cold air maintain the required temperature inside the OTRDC. The first stream chilled by the evaporator descends from a discharge air grille (DAG) (Figure 1) at the top of the OTRDC, creating the first air curtain. The next cold air stream (originated from the return air grille (RAG)) also moves downward from the honeycomb DAG (Figure 1) and generates a barrier from the ambient air and the first air curtain (only in the refrigerated cabinet with two air curtains used). The temperature of the second air curtain is always higher than that of the first air curtain due to the use of the returned air. The inside parts of the refrigerated cabinet work as an exchanger, and the temperature decreases by approximately 1 to 2 °C from the returned air temperature. The third cold airflow enters from the rear through the PBP and passes to the front of the OTRDC, where two or three airflows mix. Four fans (Figure 1) direct air to an RAG, then air passes through the cooling coils to lower the temperature and returns to the OTRDC.

2.2. Numerical Procedure and Boundary Conditions

The 2D (two-dimensional) time-dependent CFD model was constructed to analyze airflows inside the OTRDC (Figure 1) and their effects on the temperature inside the cabinet. The objective of numerical research is to study the capability of the two-dimensional k-ε model to estimate the formation speed of the air curtains and temperatures of the products within the OTRDC. In the numerical simulations, the following assumptions were used in order to simplify the procedure and preserve the fundamental properties of the process:
  • The moisture transfer process is not taken into account;
  • The thermal properties of the fluid in the air-on section are in a steady state, with fixed velocities and temperatures of both airflows;
  • The mass transfer from the load into the air (mass loss) is not taken into account;
  • Fans and the evaporator are replaced by an air-on stream with a fixed temperature and flow velocity.
The mathematical model of heat transfer at the fluid interface, the turbulence kinetic energy equation, and the equation of turbulence dissipation rate are presented in [9].
Heat transfer between products and air, as well as the airflows inside the OTRDC, were simulated using Comsol Multiphysics software. In this study, the numerical solving was conducted using the finite element method (FEM). Three different meshes (number of elements: 4415, 8648, and 16,010) were used to assess simulation precision. Figure 2 shows the temperatures at the same locations inside the OTRDC calculated using different mesh sizes. Significantly finer meshes were used, particularly in areas near the DAG (Figure 1), the RAG, and the fluid/solid interfaces. Mesh sets exhibit relative errors below 0.5%. The mesh with 8648 elements was proven satisfactory, as the calculation results did not change with decreasing mesh size (Figure 2). The 8648-element mesh shown in Figure 3 Left, was used in all numerical simulations. Numerical studies were performed on a computer (64-bit operation system) with an Intel(R) Core(TM) i7-7700K processor (Intel Corporation, Santa Clara, CA, USA) running at 4.20 GHz and 32 GB RAM.
The computational domain with positions of boundary conditions is presented in Figure 3 Right; values are listed in Table 2. Air-off and air-on streams are simulated in a closed-loop model. Air velocity values are computed on the basis of the length of the boundaries and the fan flow rate. The right boundary is described as the open boundary with supported outflow and inflow conditions. In different cases, the air temperature is assumed to be at the one or two air-on boundaries. The air-off boundary is described as the velocity outlet, and the air-on boundary is defined as the velocity inlet. Products are described as non-slip and solid boundary conditions. A thin-walled structure was adopted for the DAG honeycomb modeling to ensure a more precise flow direction. The PBP, shelves, and other parts of the OTRDC were assumed to be made of sheer steel through which heat exchange takes place. The bottom shelf and wall shelves were simulated as 1.4 mm thick steel walls. Other inner sheet parts were adopted as 0.7 mm thick steel walls. The boundary condition of the PBP was described as a porous jump, while conditions of other surfaces are defined as walls. Finally, a strong natural convection exists between the OTRDC and the surrounding air, which is influenced by the density of the air at different temperatures. In order to simulate natural convection, gravity was switched on in the model, and the air density was calculated from the ideal gas formulas.

2.3. Experimental Technique

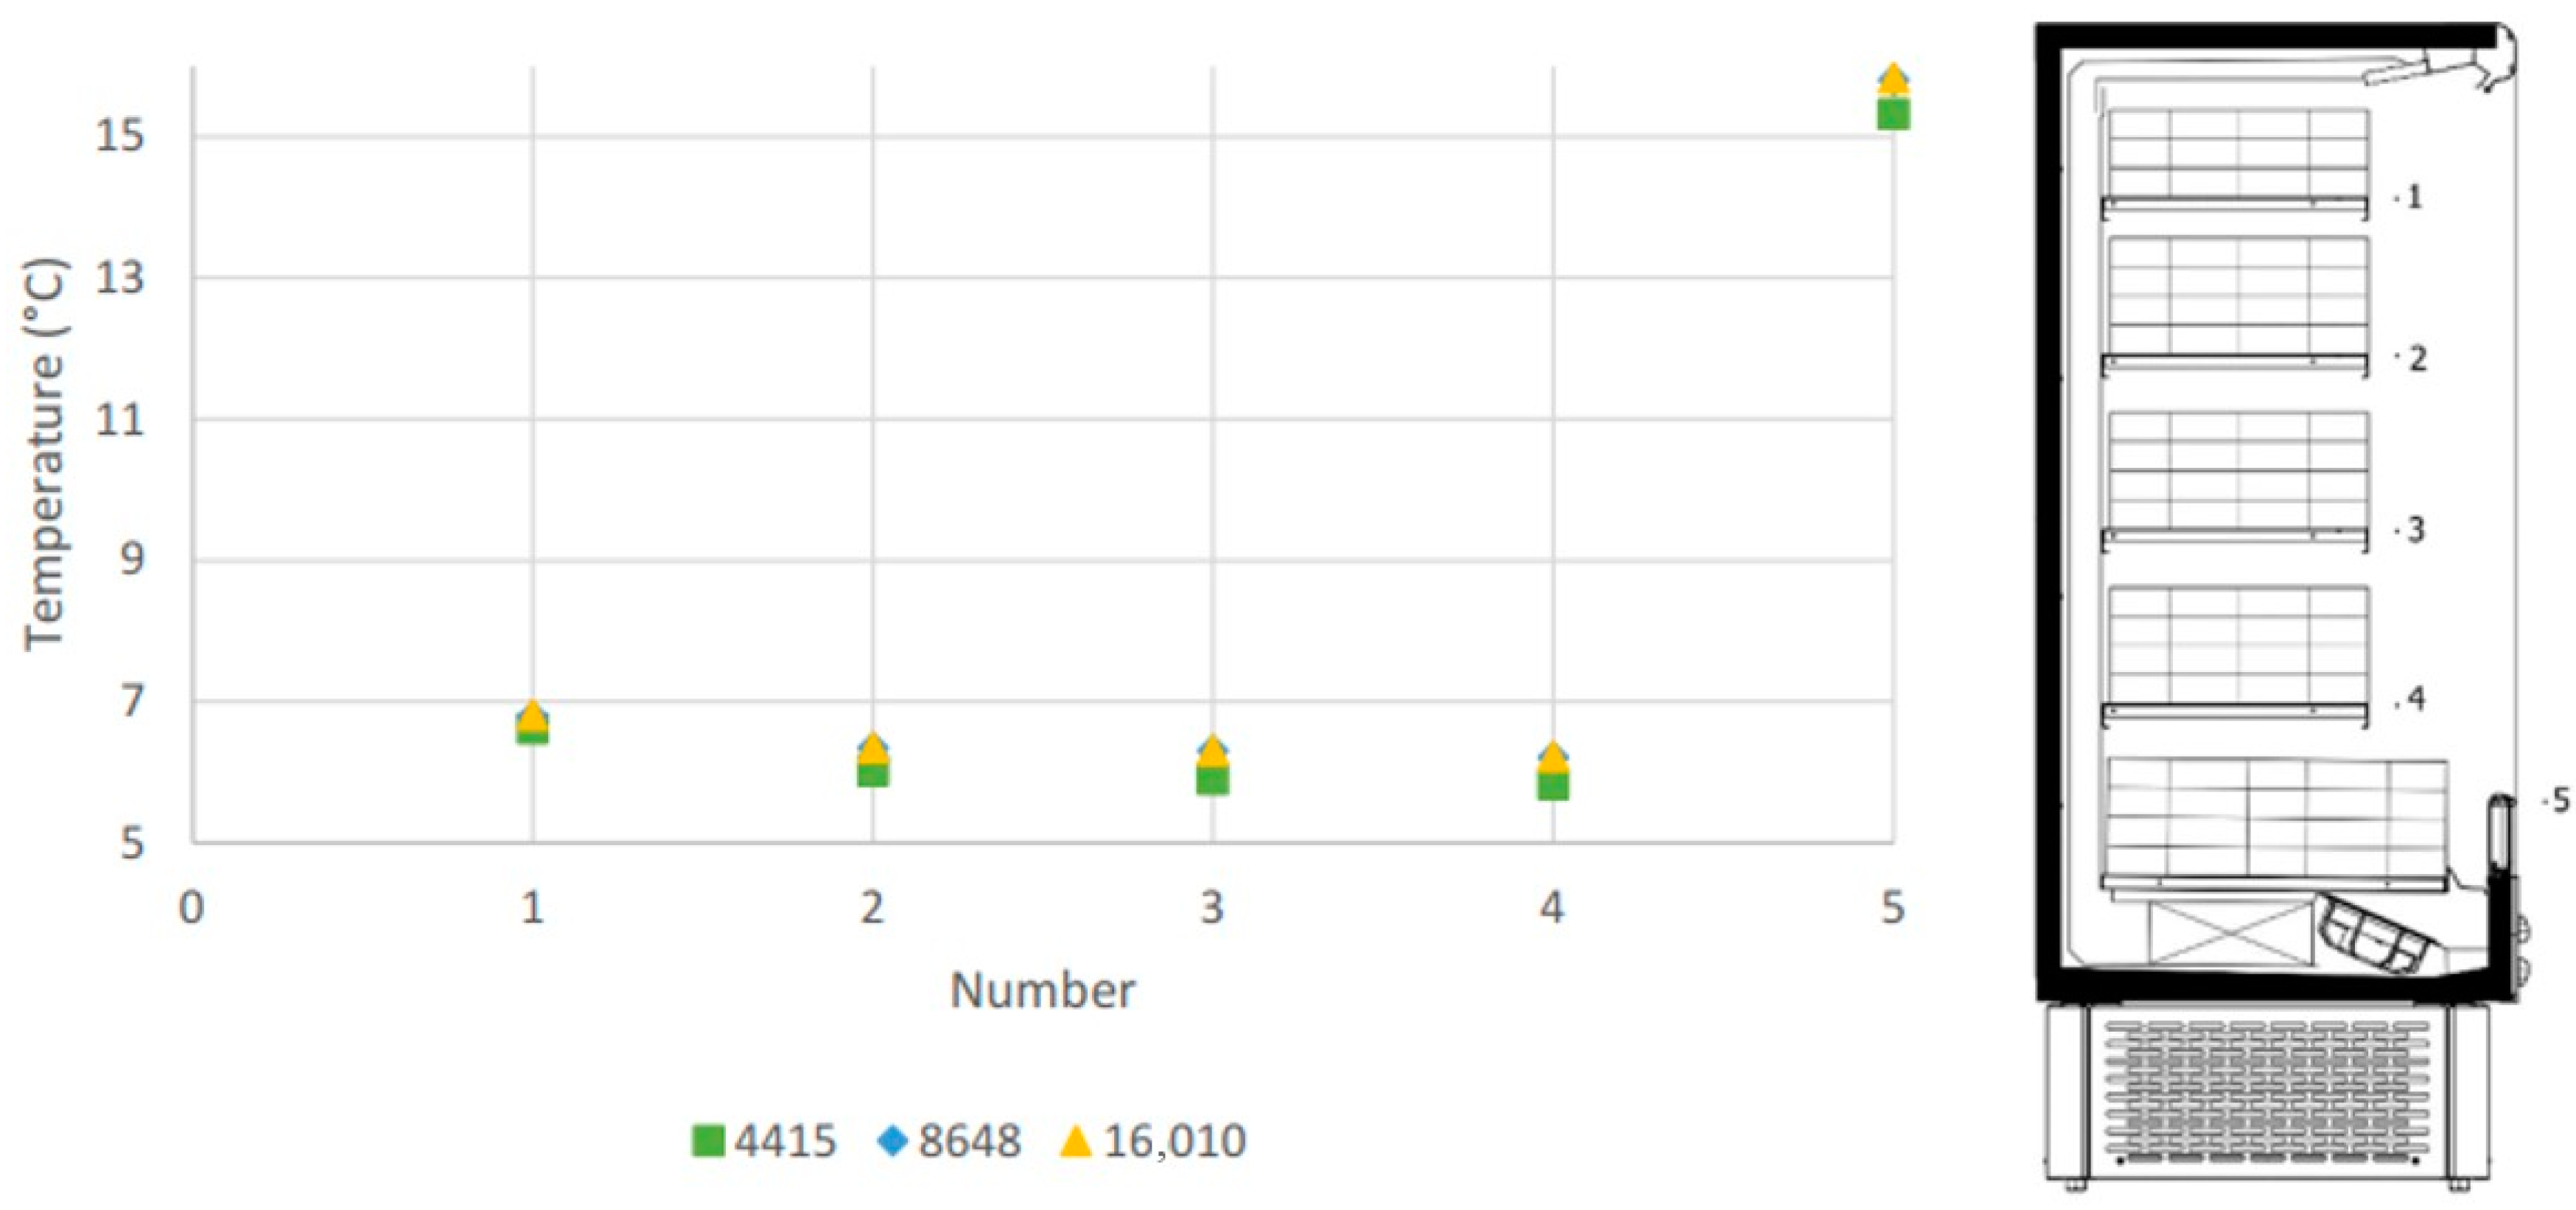
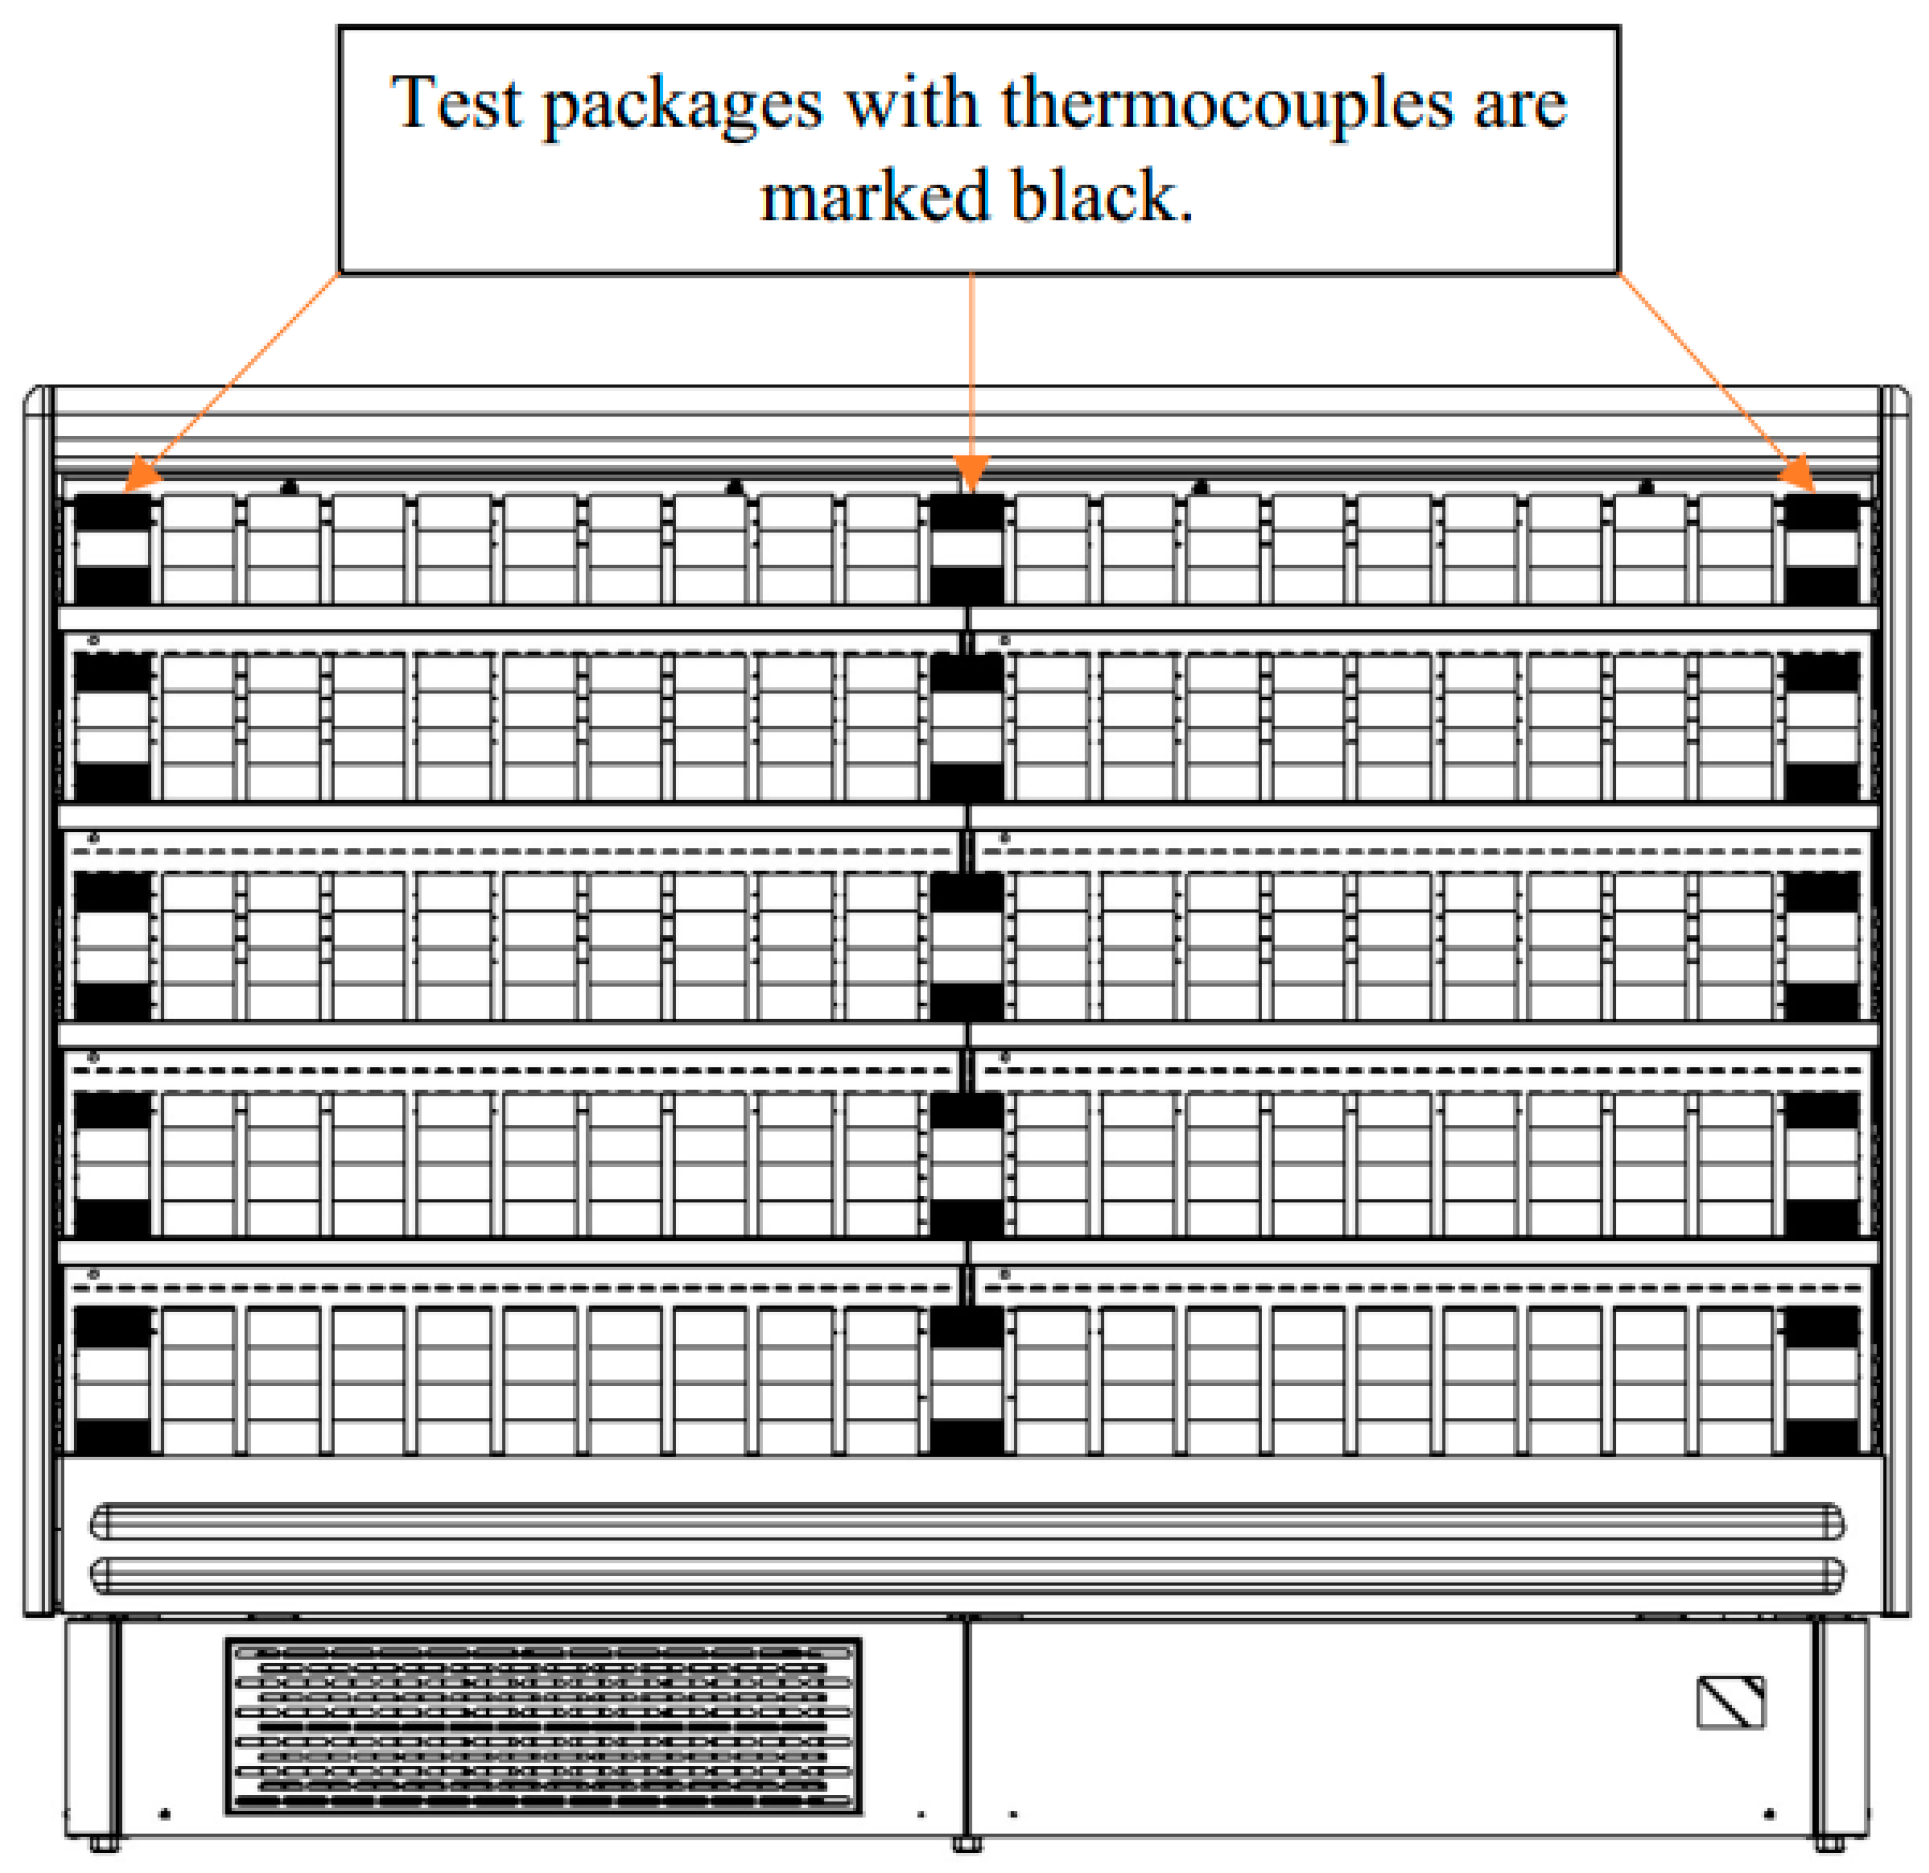
2.3.1. M Package Temperature Measurement

Figure 4 presents the arrangement of the test product packages (M packages) and the thermocouples inside the OTRDC. M packages consist of oxyethylmethylcellulose (length × width × height: 200 × 100 × 50 mm; according to [19,20,21,22,23] standards). The thermal conditions of the M package are identical to those of lean beef, and the freezing point is −1 °C. The OTRDC was cut by three following measuring planes: z = −1.1 m (left plane), z = 0 m (middle plane), and z = +1.1 m (right plane). The thermocouples were placed in the geometric centers of M packages. Carel Easy controllers with 3 probes were used in the study. The controllers were connected to a PC with the monitoring software Carel PlantVisor PRO (CAREL S.p.A., Padova, Italy). The data collected were processed using Microsoft Excel software (Microsoft Corporation, Redmond, WA, USA).
The temperatures of the M packages were measured in the middle plane of the OTRDC operating at an ambient temperature of 25 °C (humidity ratio of 0.003–0.004 kg/kg). The time-averaged temperatures were then calculated over a 6 h cycle. The results of the temperature measurements were compared with the results of numerical simulation in this study.

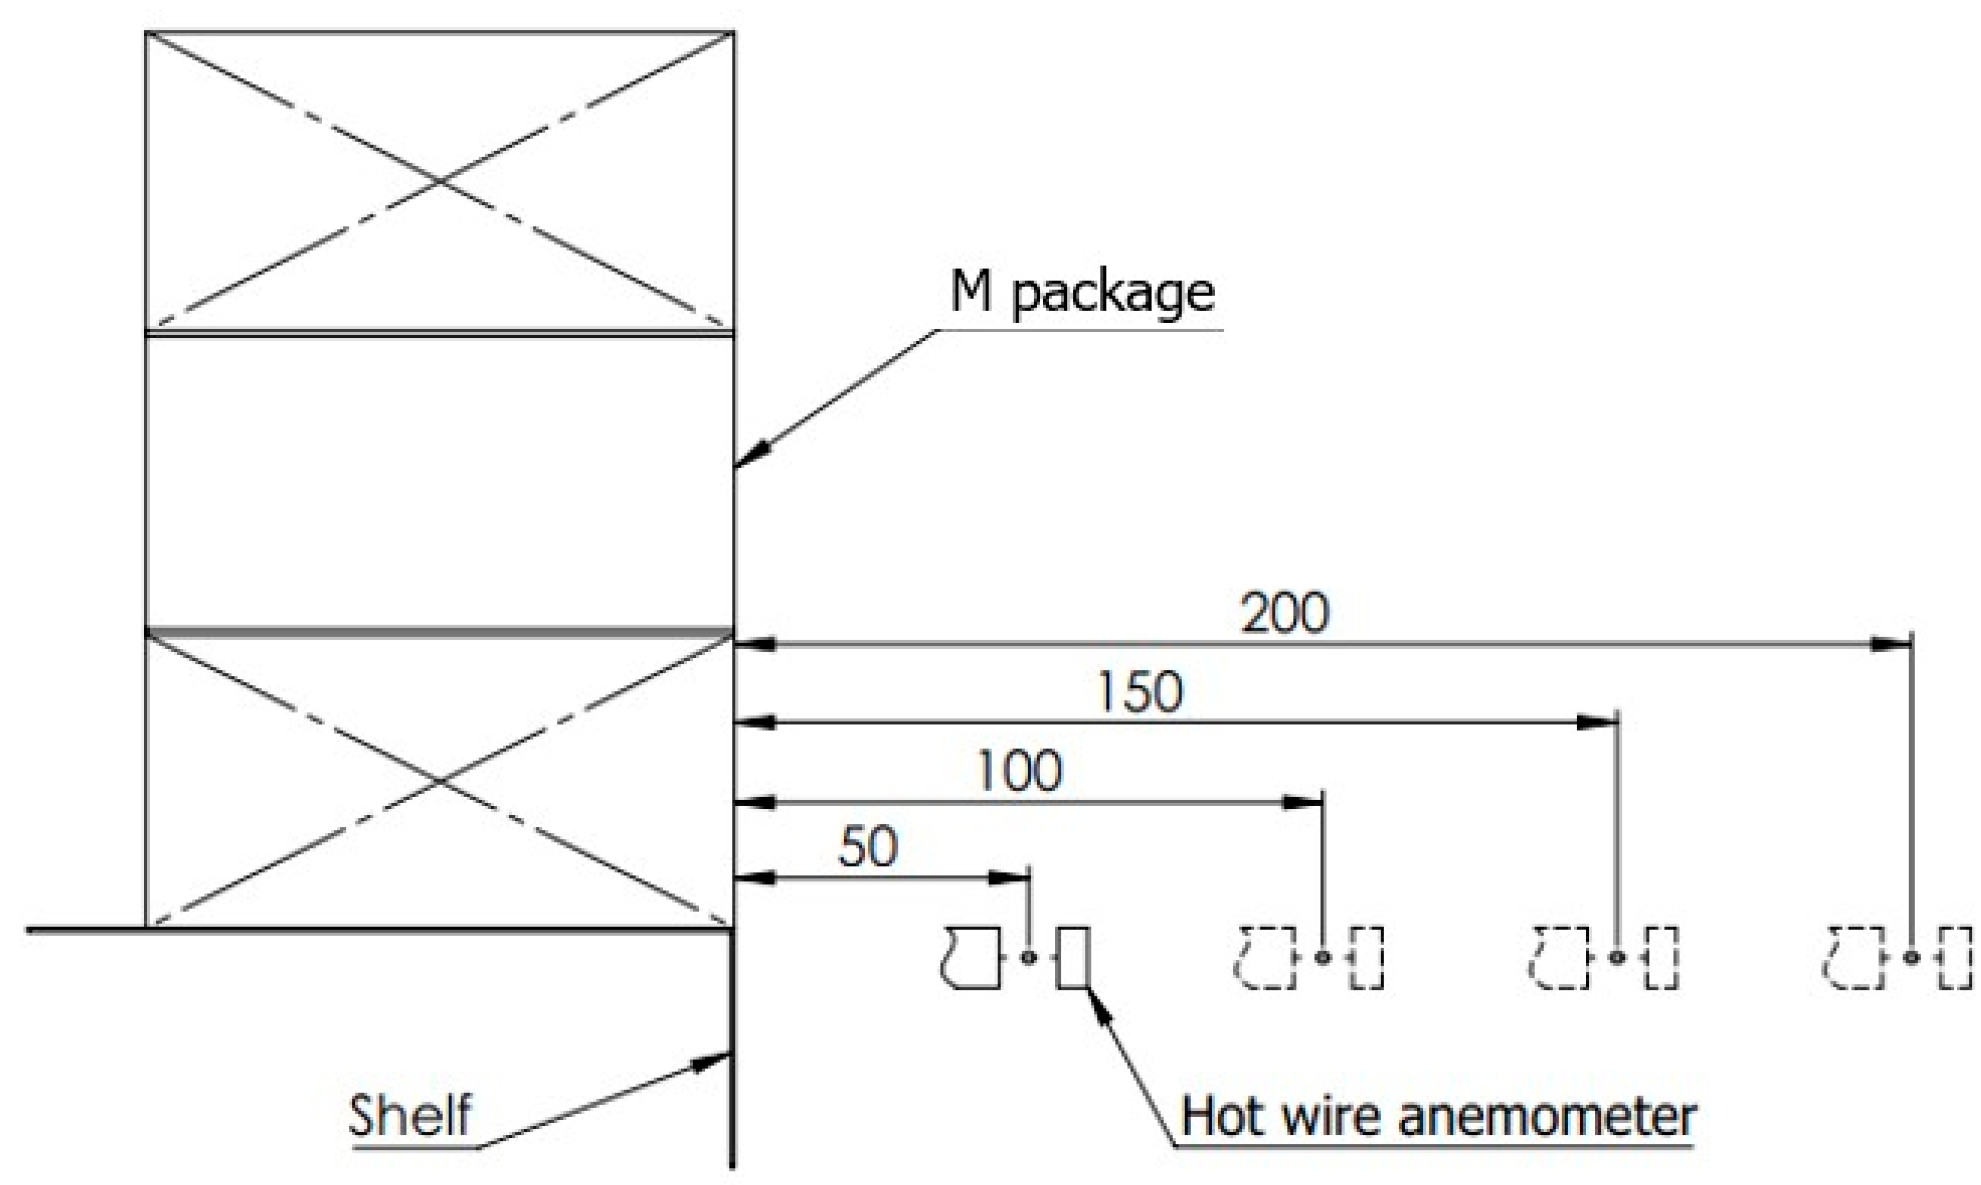
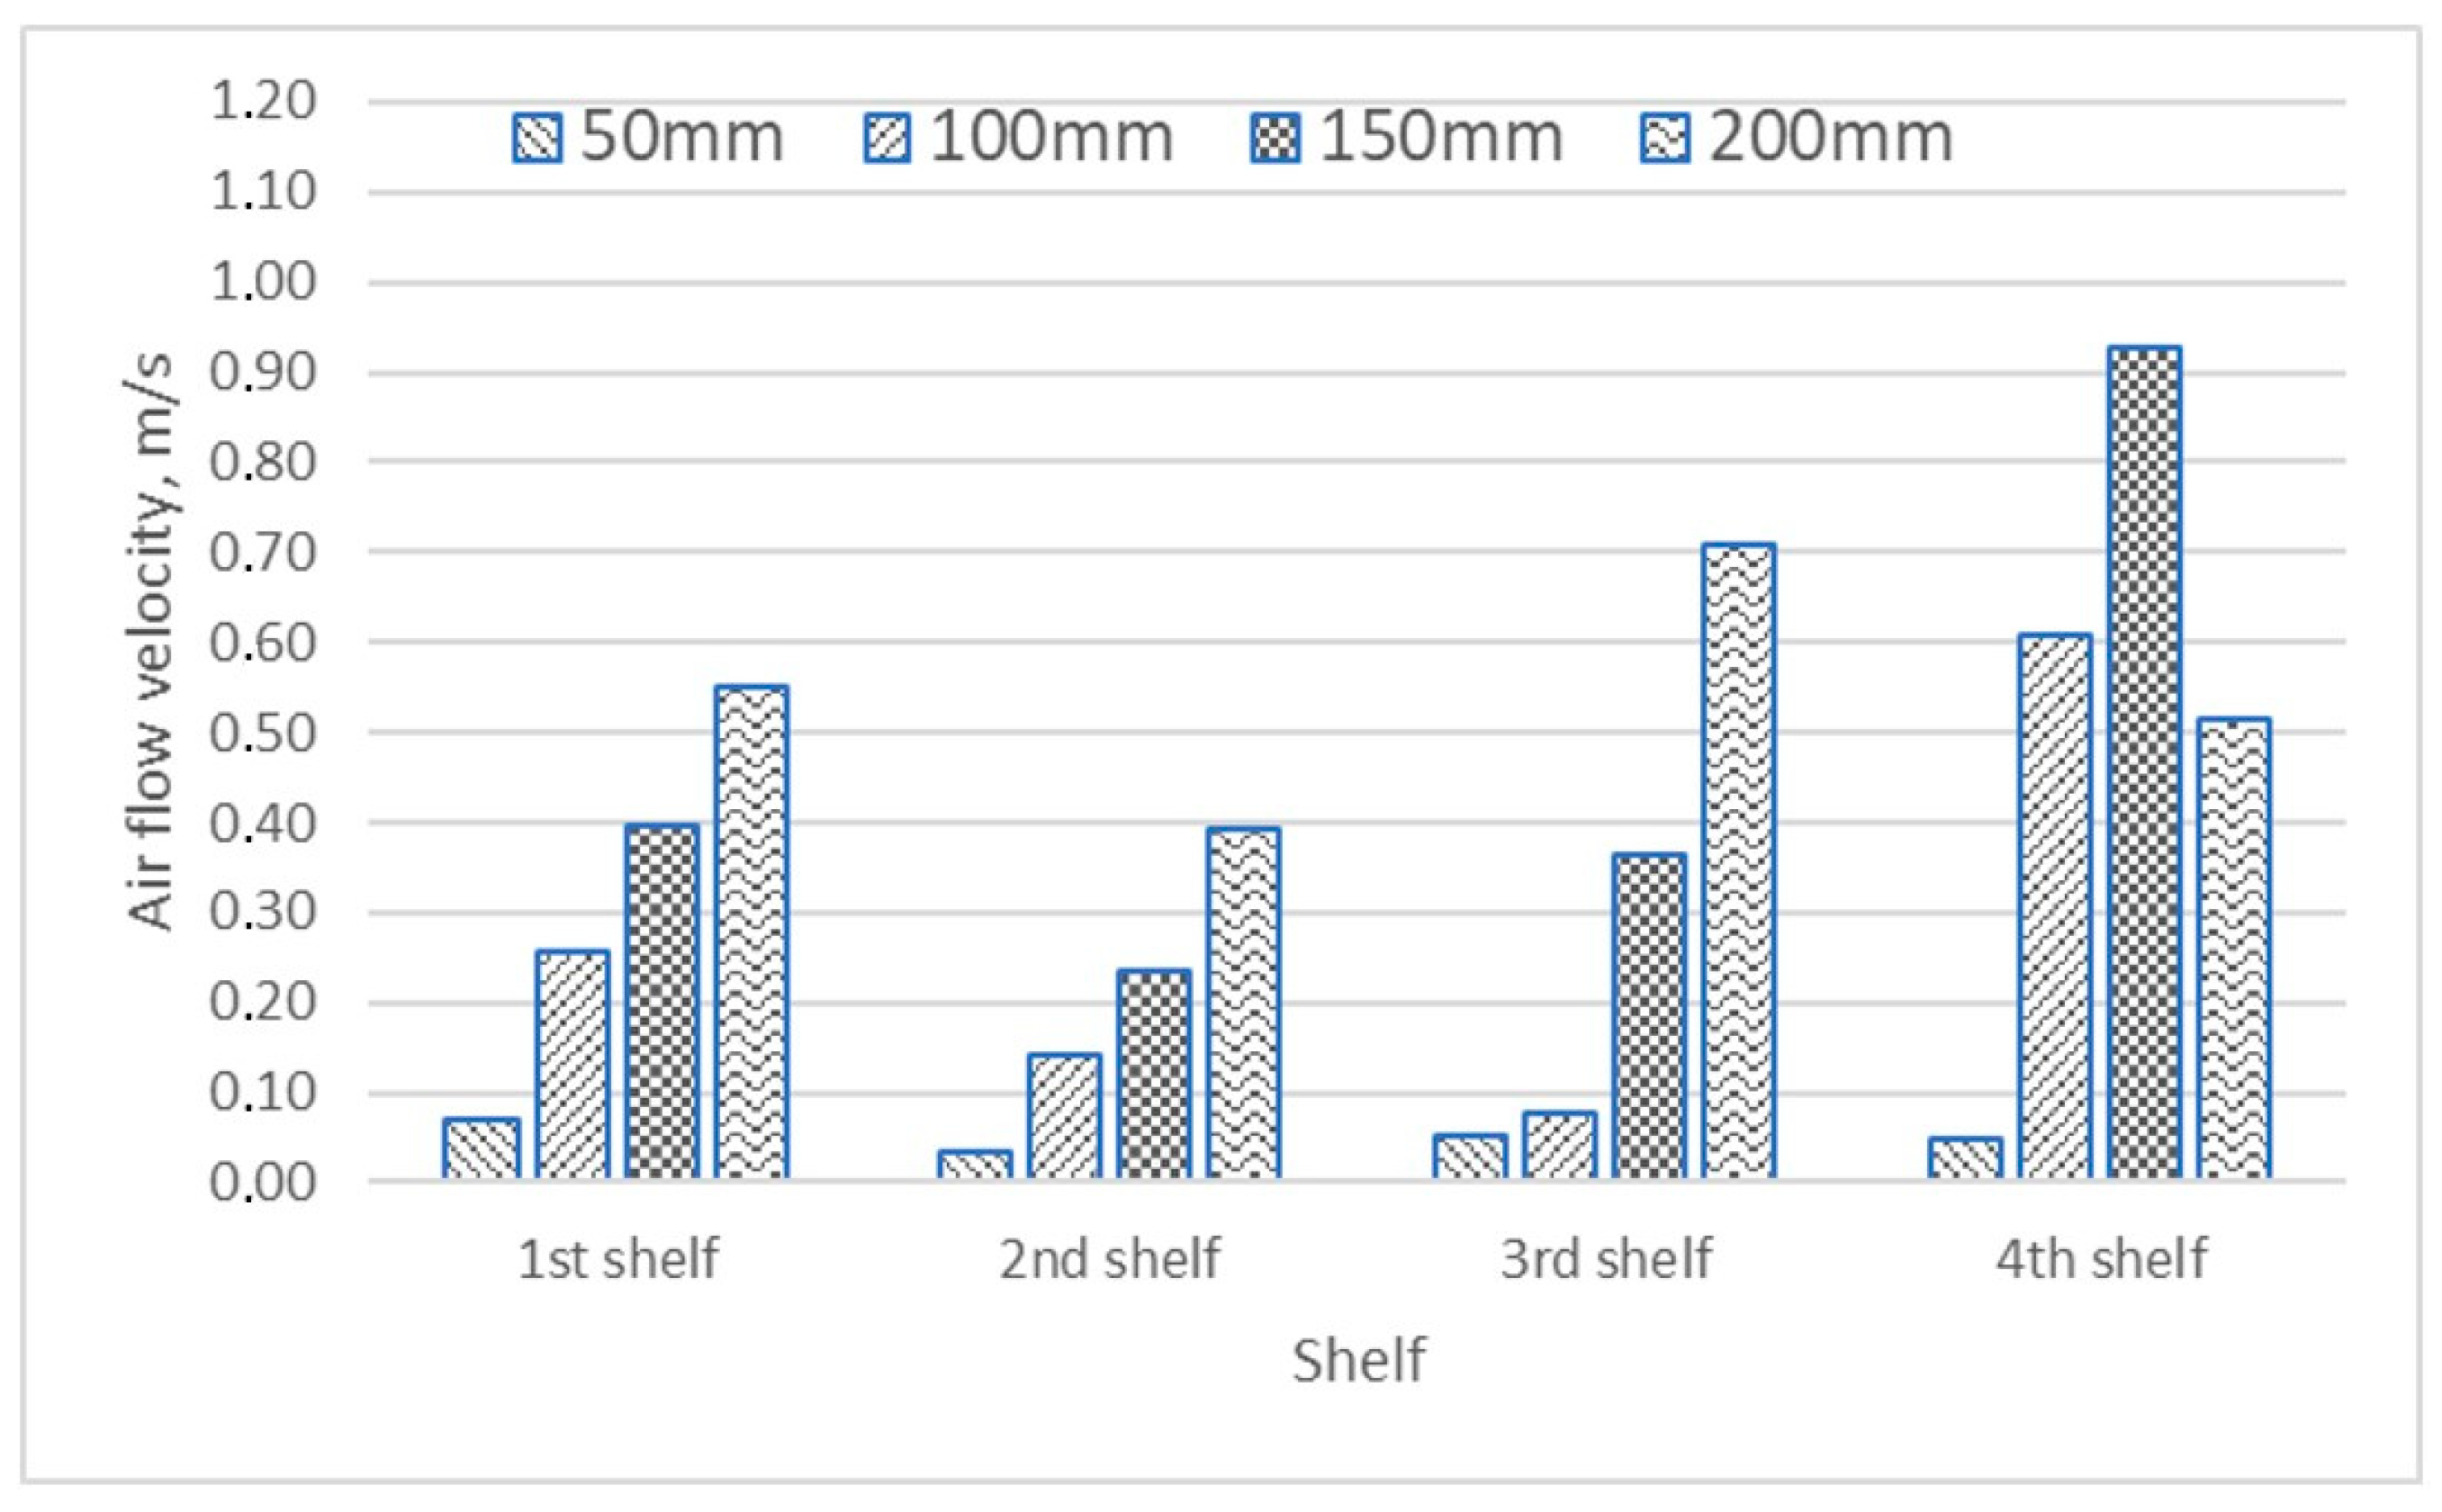
2.3.2. Air Velocity and Temperature Measurement

T-type thermocouples were used to measure air temperature in the honeycomb (DAG) and intake grill (RAG) in three measuring planes: z = −1.1 m (left plane), z = 0 m (middle plane), and z = +1.1 m (right plane). The three measuring planes are needed to compare the results in different planes to confirm the proper functioning of the refrigerated cabinet. Two data loggers (Carel EasyPJEZC00000 (CAREL Industries S.p.A., Padova, Italy) with 3 probes) were used that recorded the temperature of the thermocouples every 300 s. Before measuring, each thermocouple was calibrated in the temperature range of −5 °C to 20 °C in a high-precision water bath (Lauda ECO RE1050S (Lauda dr. R. Wobser GMBH & Co. KG, Lauda-Konigshofen, Germany)) filled with Kryo 30 heat transfer liquid), and the precision of ±0.2 °C was determined.
The airflow velocity measurement scheme is presented in Figure 5. A hot wire thermal anemometer (Testo 405-V1 (Testo SE & Co. KGaA, Titisee-Neustadt, Germany)) was fixed on an adjustable length device, and the airflow velocity values were collected during 5 min of measurement. The average values were calculated at each measurement point during the quasi-steady state.

2.3.3. Measurement of Electrical Energy Consumption

The three-phase refrigerated cabinet was tested in a test room connected to an energy meter. For measurements, the Carel MT300W1100 energy meter (CAREL Industries S.p.A., Padova, Italy) connected to a Carel PlantVisor PRO data logger (CAREL Industries S.p.A., Padova, Italy) was used. After 72 h, the refrigerated cabinet was on, and the experimental measurement was started. During the energy consumption test, the cabinet was left alone for accurate measurement without impacting of the test room environment. The main components that used energy in the refrigerated cabinet were a 3-phase compressor, 4 V-type fans, hot wire evaporator defrosting, and a controller. It is important to point out that the electrical energy consumption test was performed without the canopy and shelf lights, and the results do not describe all the electrical energy consumption of the refrigerated cabinet. This experiment was carried out to compare the impact of the additional air curtain on electrical energy consumption and compressor working time.

2.4. CFD Model Validation

CFD and experimental models of the refrigerated cabinet with two air curtains were used for validation. Figure 6 compares the average temperatures of the shelves obtained experimentally and in numerical simulation. Figure 7 presents the comparison of the airflow velocities measured by the scheme presented in Figure 5 at a distance of 150 mm from the shelf. The airflow velocity was measured in three measuring planes and compared with the results obtained from the CFD model. Figure 6 and Figure 7 show that there is a certain error of ±5% (temperature distribution of food) and ±0.1 m/s (airflow velocity measured in various planes). Simulation results are found to be in good agreement with experiments, and the model is suitable to simulate the refrigerated cabinet.

3. Results of Numerical 2D Simulations and Discussion

3.1. Simulation of the Shape and Formation Time of the Air Curtain

Figure 8 shows the formation of an air curtain in 15 s in the middle plane of the OTRDC with a single air curtain. It is seen from Figure 8 that the curtain is completely formed after 10 s. Figure 9 represents the formation of the air curtain in the middle plane of the refrigerated cabinet with the two-layer air curtain. The air curtain’s full formation time is 7 s. Significant differences in the position of the air curtain in the refrigerated cabinet and the formation time are observed. The refrigerated cabinet with two air curtains has stronger airflow, and its radius is greater than that of the refrigerated cabinet with a single air curtain. The stronger airflow creates a stronger barrier to the ambient air. In this case, the warm air infiltration ratio is lower in the refrigerated cabinet with a two-layer air curtain.
Figure 10 and Figure 11 present airflow velocities calculated for the scheme presented in Figure 5. It can be seen that in all measurement points, the air velocity is 0.05 to 0.2 m/s greater in the case of the cabinet with two air curtains. The second layer of the air curtain is faster and warmer than the first layer because a higher velocity of airflow generates a larger infiltration of ambient air in the second layer of the air curtain. The second layer of the air curtain is warmed faster but, in this case, reduces the ambient air infiltration into the first (main) layer of the air curtain. The air of the second layer escapes mainly into the environment and into the intake grille; the temperature, in this case, is lower than the case with the single air curtain.

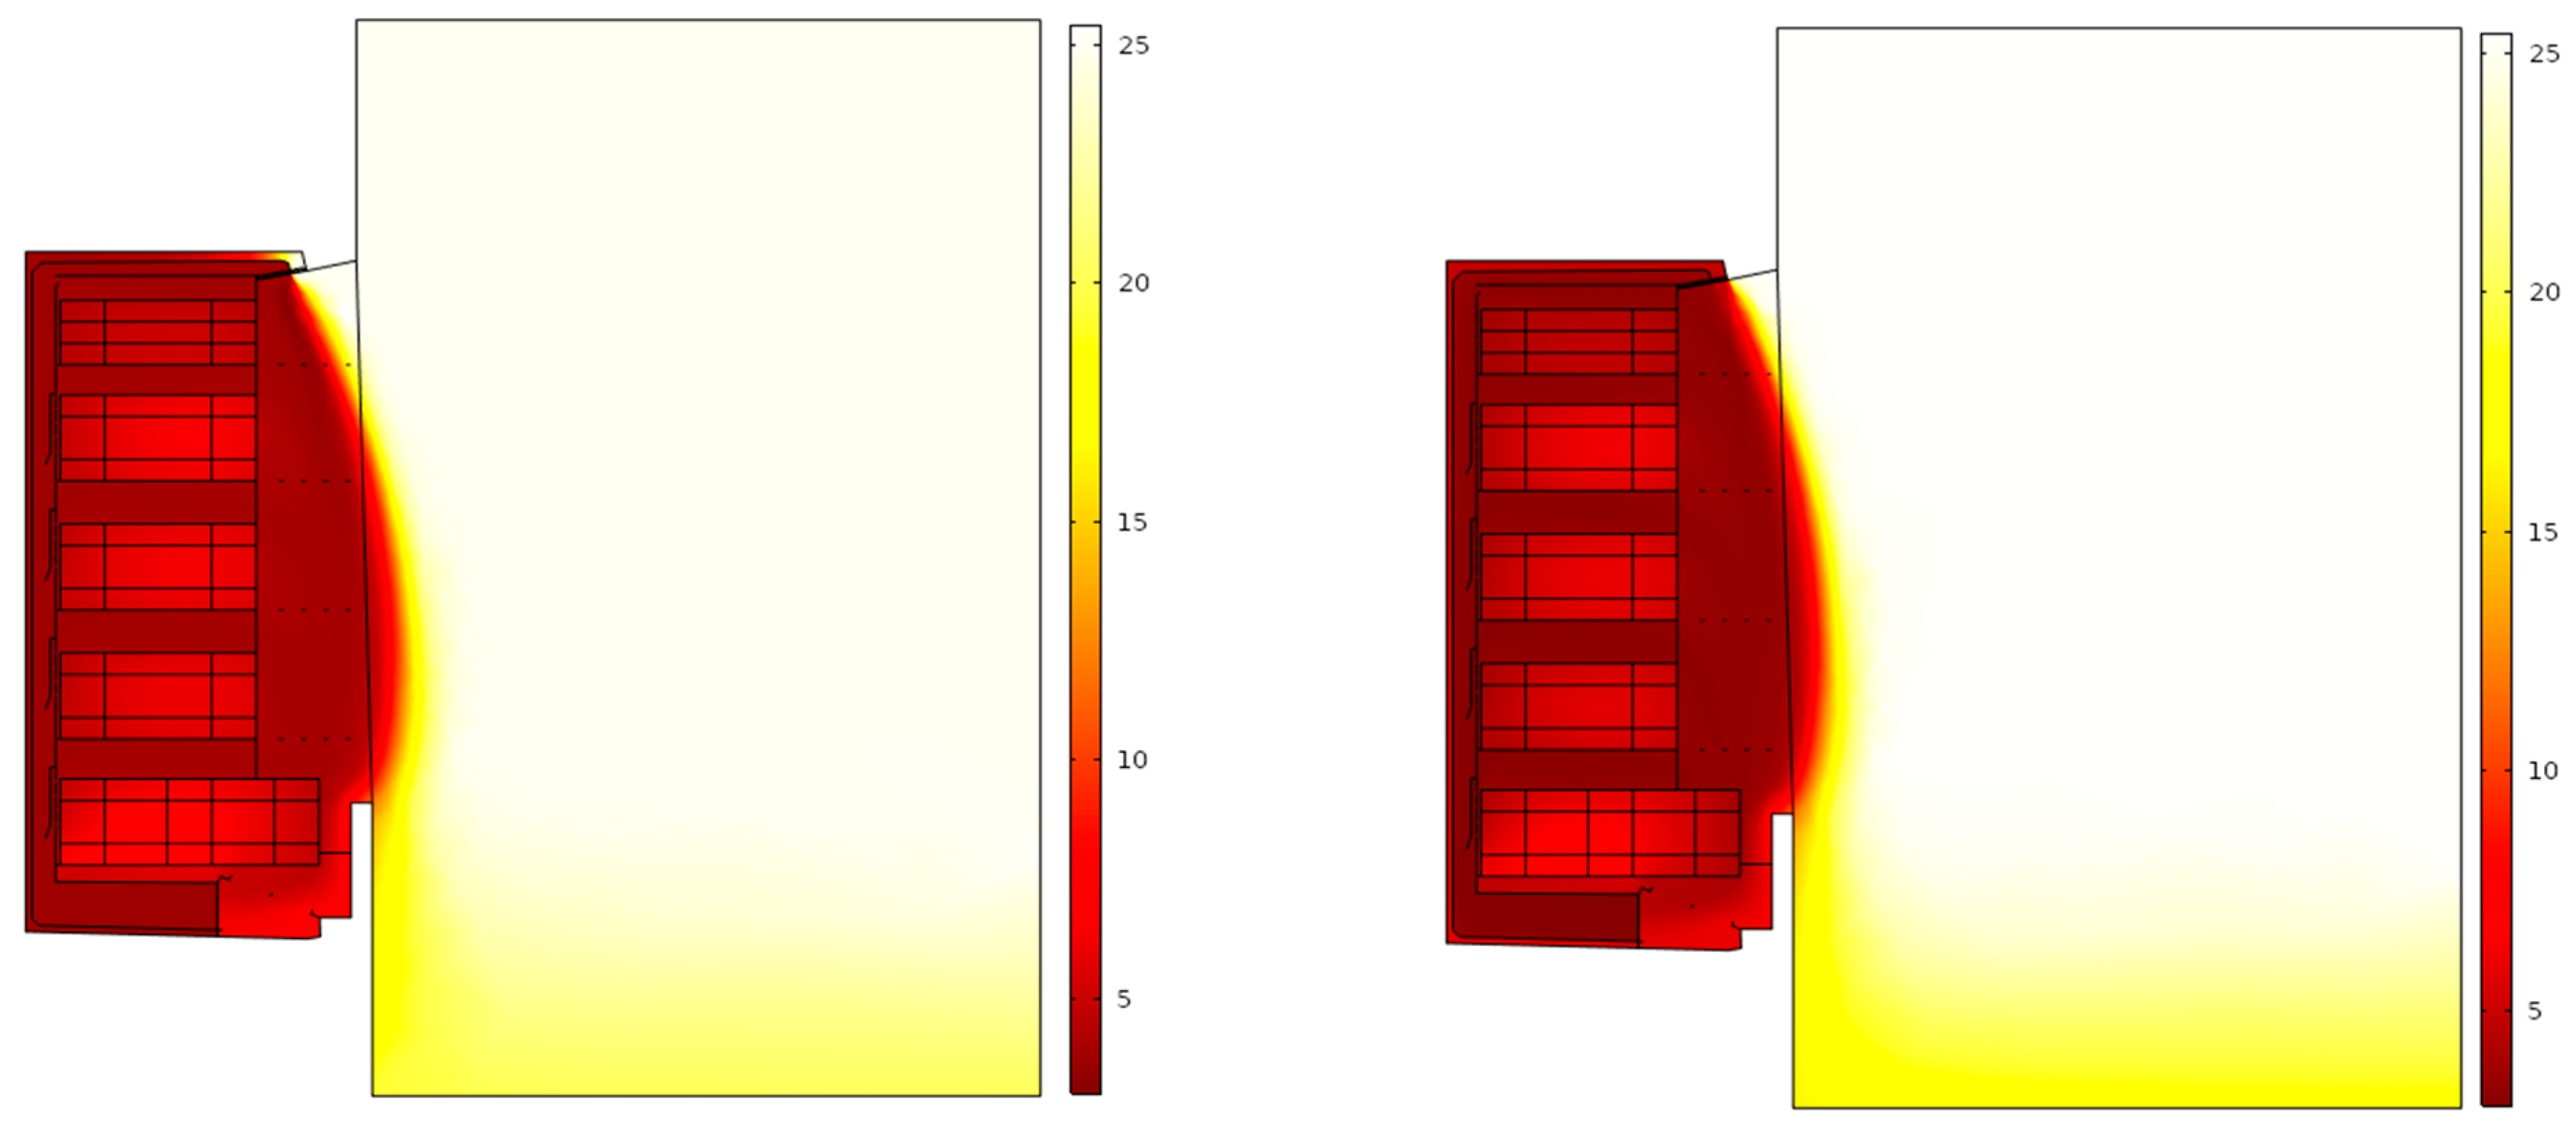
3.2. Simulation of the Temperature Distribution in the OTRDC

Figure 12 shows the distribution of air temperature in the middle plane of the multi-deck OTRDCs. It can be seen that the temperature inside the cabinet with a single-layer air curtain (Figure 12 Left) is higher than in the version with a two-layer air curtain (Figure 12 Right). The temperature distribution within the cabinet is very important, as can be seen in Figure 13. The temperature of the M packages in the front is 0.5–1.0 °C higher in the version with a one-layer air curtain. The temperature of the invisible barrier impacts the temperature of the M packages placed in the front of the cabinet; the biggest difference can be seen in the test packages F3 and F4 (Figure 13). The difference is approximately 1.0 °C in temperature for these packages. The M packages placed in the back are also affected by the environment, and the largest temperature difference is observed in the B1 package; in this case, the temperature difference is 1.19 °C (Figure 13). The average temperature of the M packages is 5.70 °C for the single air curtain and 5.12 °C for the two-layer air curtain. The infiltration ratio indicates how efficiently the air curtain works in the OTRDC. This can be computed according to the following formula:
I N R = T i n T o u t T a i r T o u t 100 % ,
where Tin is the temperature of the intake air (RAG); Tout is the temperature of the outtake air (DAG or honeycomb); and Tair is the temperature of the surrounding air.
For the single air curtain version, the infiltration is 10.4%, and in the case of the two-layer air curtain version, the infiltration ratio is reduced to 7%. The difference is 3.4%; therefore, the OTRDC with a two-layer air curtain works more efficiently, uses less energy, and has better performance. The Tout temperature for the two-layer air curtain was calculated as 80% of the first layer and 20% of the second layer temperature sum. This study utilized temperature and airflow velocity data obtained from previous experimental research. To enhance the performance of refrigerated cabinets, it is essential to optimize these parameters in future studies.

4. Experimental Results

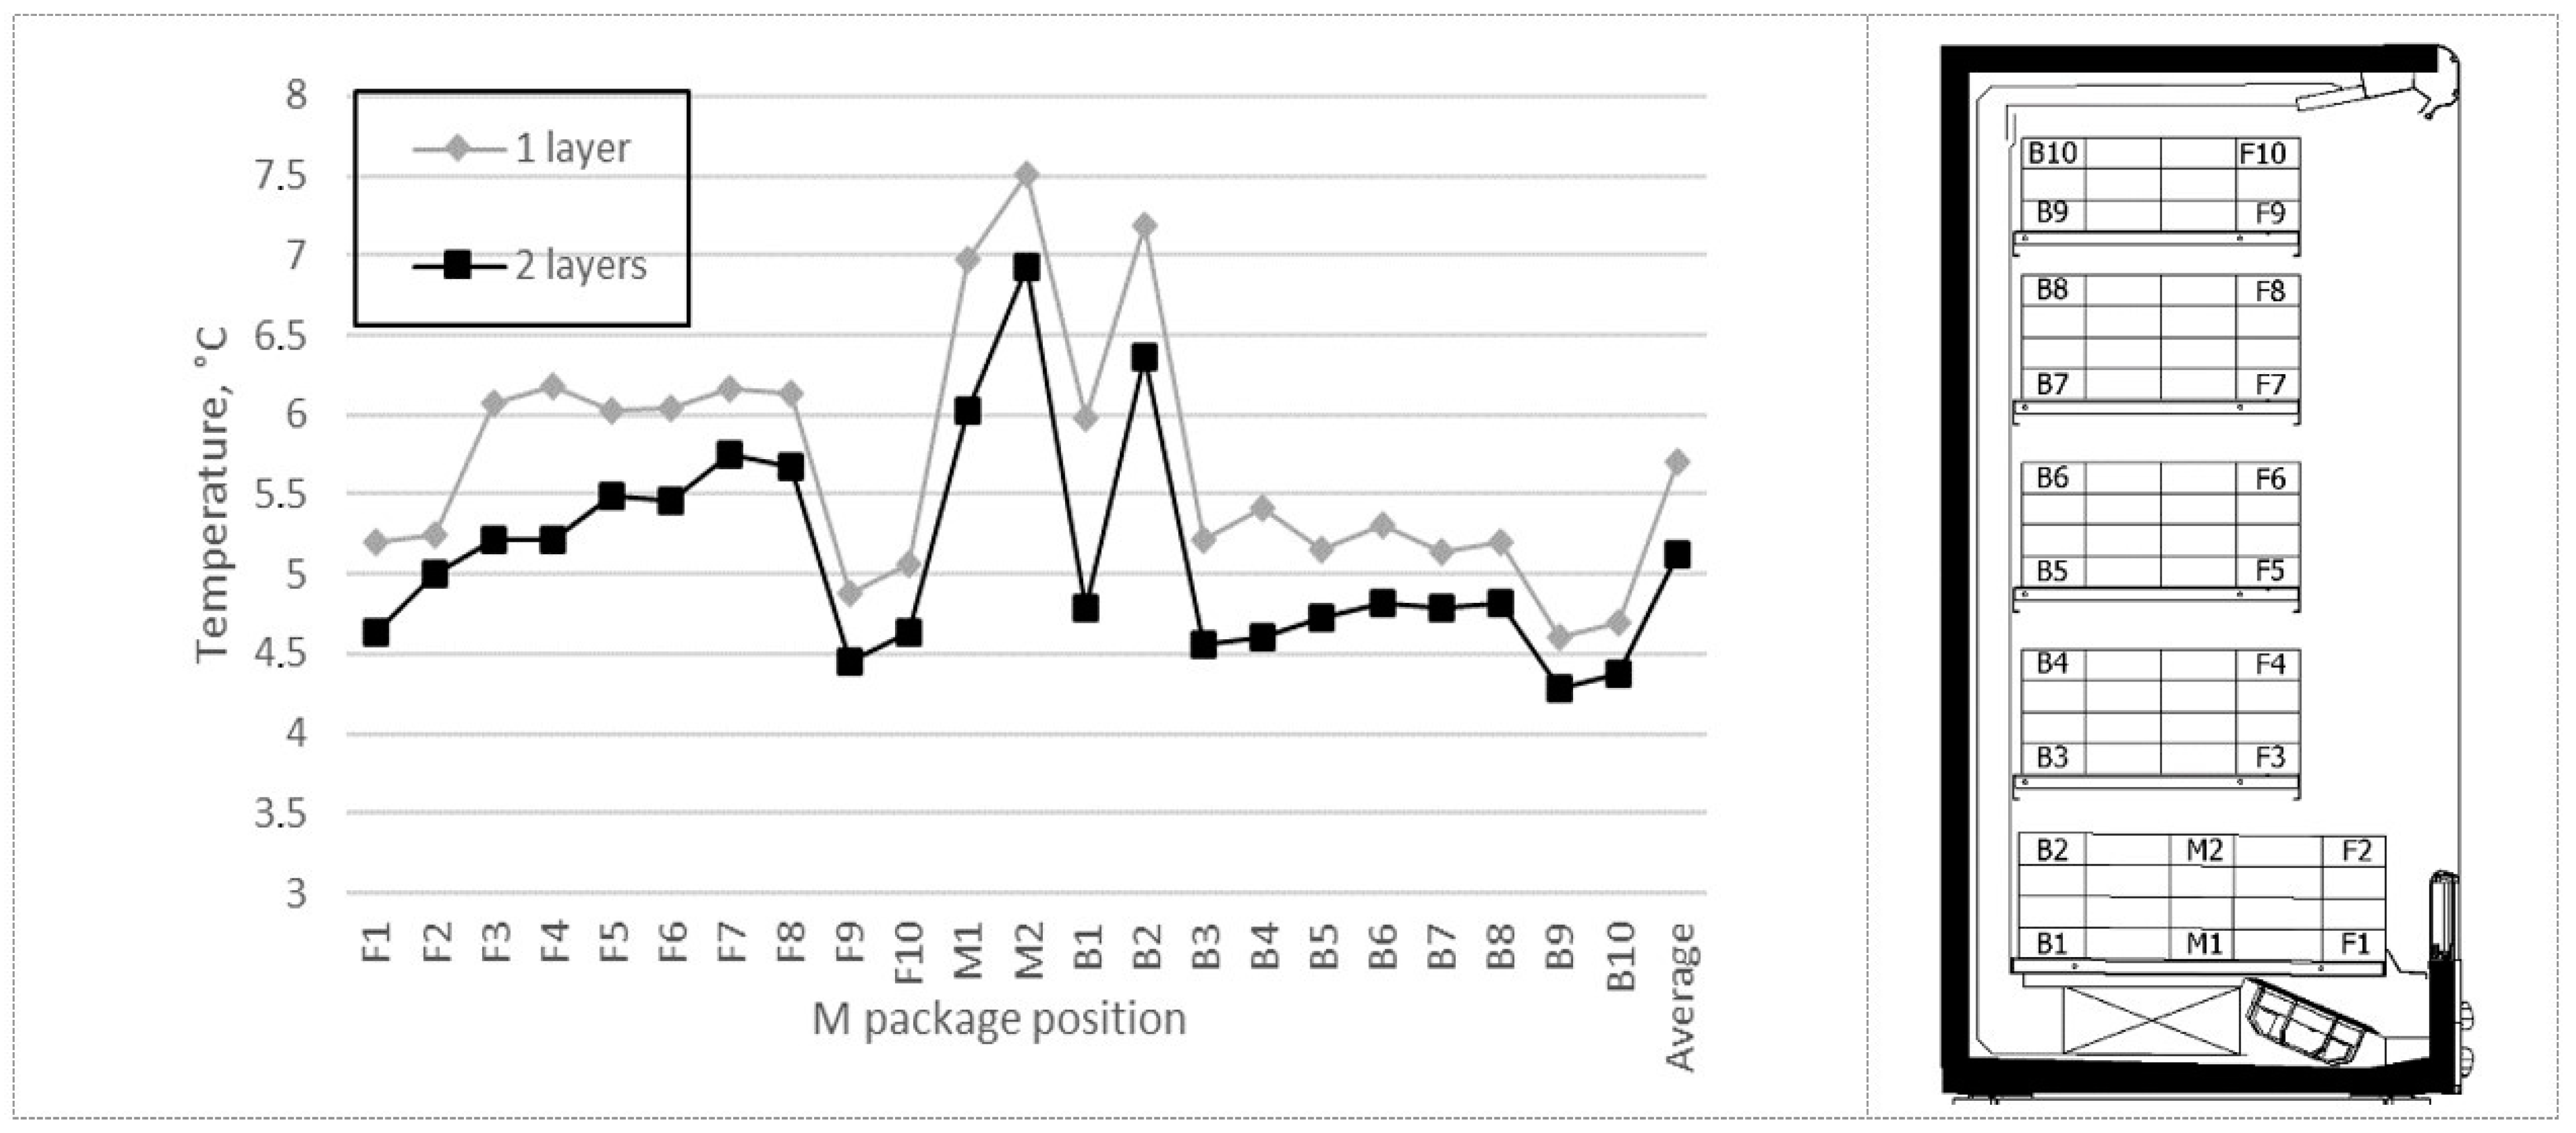
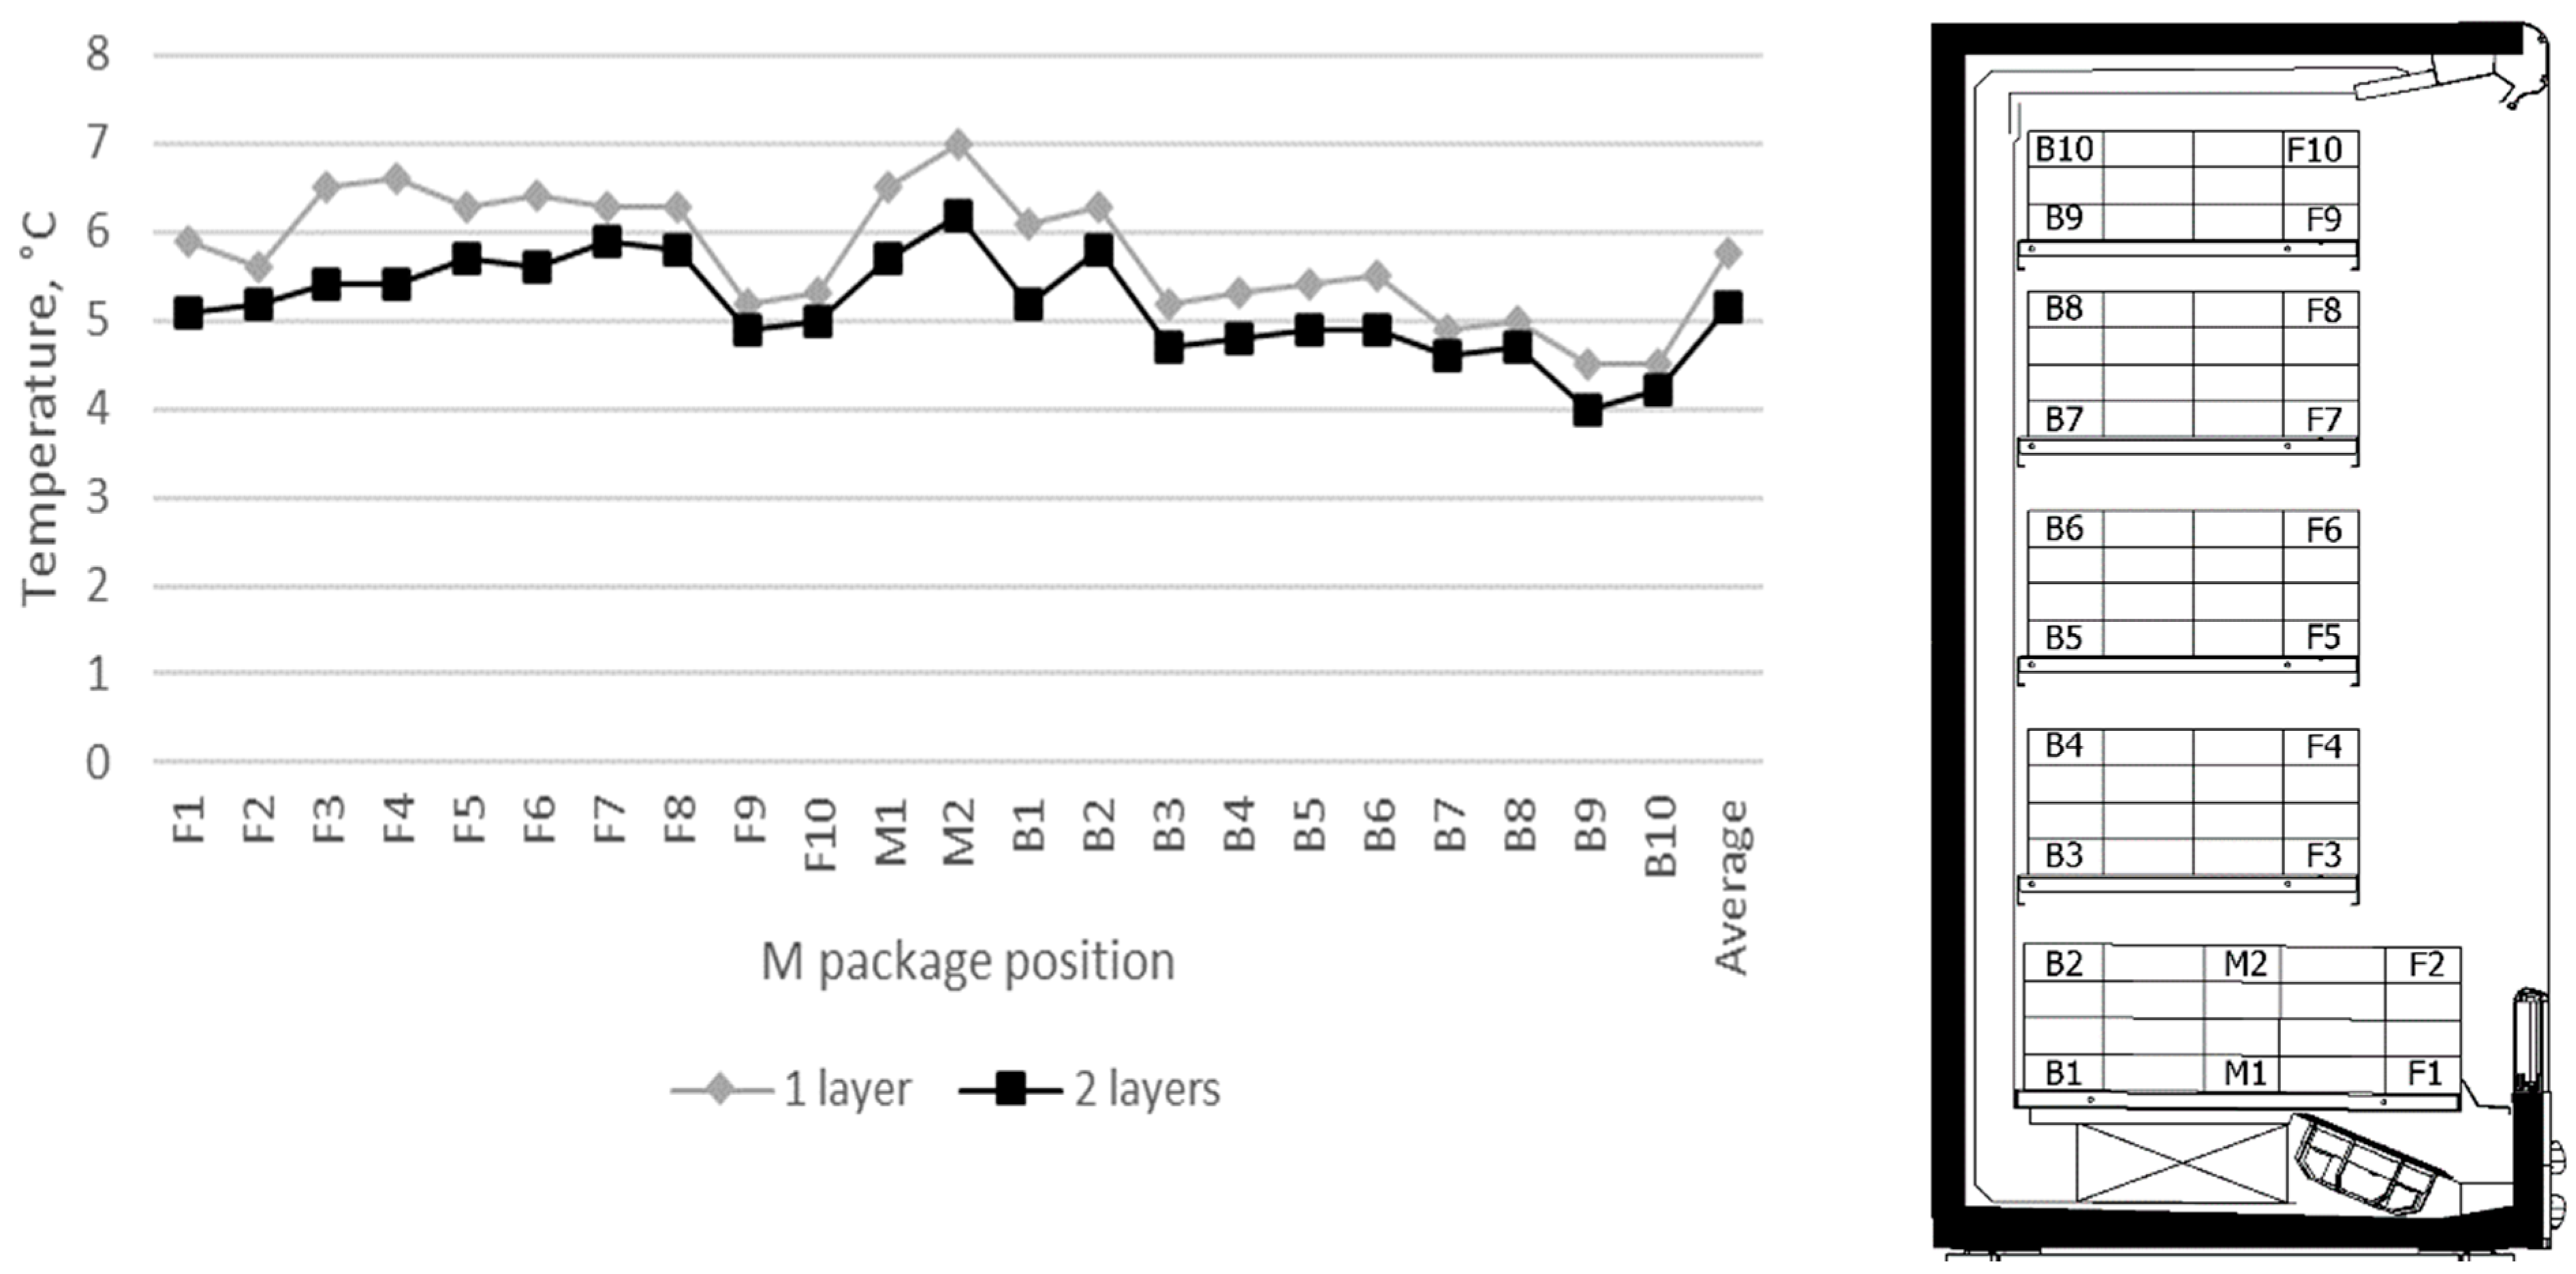
4.1. Quasi-Steady State Temperatures in the Middle Plane

Figure 14 presents the temperature distribution inside the refrigerated cabinets with single- and two-layer air curtains in a steady state. The thermocouple measuring tolerance is at ±0.5 °C. When comparing the results with those obtained from the CFD simulation (Figure 13), the temperature of M packages is higher because the side wind (0.2 m/s) and the defrosting time were not considered in the 2D CFD model. The defrosting process takes about 30 min, and then the air temperature in the refrigerated cabinet increases by approximately 2 to 3 °C. After the defrosting process, it takes about 30 min for the refrigerated cabinet to reach a steady state. The temperature of the discharge air grille corresponds to the set point temperature; in all cases, the set point temperature was set at +3 °C (Table 1). The measured air temperature of the first layer of the air curtain in all cases was +3.2 ± 1 °C, and the temperature of the second layer was +5.3 ± 1.5 °C. The air temperature of the second layer is significantly influenced by the return air temperature. The temperature of air returned to the refrigerated cabinet with a single air curtain was measured, and it was +6.4 ± 1 °C. For a two-layer air curtain, the intake temperature was also measured and was +5.7 ± 1 °C. The infiltration ratio of the experimental model is higher than that of the CFD model, but the relationship between them remains the same. For the single air curtain version, the infiltration ratio is 14.6%, and in the case of the two-layer air curtain version, the infiltration ratio is reduced to 9.7%. The difference is 4.9%. When comparing the results with the CFD model, the difference was 3.4%.
When comparing the temperatures of the M packages presented in Figure 13 and Figure 14, a great difference is not observed. The largest difference between the temperatures inside the cabinets with single- and two-layer air curtains was observed for the positions of the M packages F3 and F4; the same dependence remains in the CFD model, and the temperature in the different refrigerated cabinets differs by approximately 1 °C. The average temperature of the M packages in the experimental model was +5.75 °C (single air curtain) and +5.17 °C (two-layer air curtain). The worst result in terms of temperature of the M packages was recorded on the bottom shelf for the middle M packages (Figure 13 and Figure 14). It takes much more time to cool the products when there is a large volume of M packages.

4.2. Electrical Energy Consumption Profiles

Electrical consumption was measured using an energy meter in a 24 h cycle. In the single air curtain case, energy consumption was 30.9 kWh, and in the case of the two-layer air curtain, it was 25.2 kWh per 24 h. The difference can be seen in the graphs presented in Figure 15 and Figure 16. It can be seen from the graph obtained for the single air curtain (Figure 15) that the compressor works with a short off-cycle, but the compressor works almost continuously. The stops are usually about 5 min. In the graph obtained for the two-layer air curtain (Figure 16), one can see that the compressor works with more stops when the temperature set point is reached. This means that the infiltration is less, and the cooling cycle works with less load. The version with a two-layer air curtain has better cooling performance and saves electrical energy in all cases.

5. Conclusions

A simplified time-dependent 2D heat transfer model was developed to analyze airflows in OTRDCs with single- and two-layer air curtains according to [24] . The CFD model was validated by comparison with experimental data. The difference between the experimental results and the simulation results is less than 10%. It is established that refrigerated cabinets with a two-layer air curtain have better performance and optimization chances with less energy consumption and a lower difference in the temperature of the packages.
The results of the numerical simulation and experimental investigation show the following:
  • In the case of a two-layer air curtain, the air curtain is fully formed in 7 s, that is, 3 s earlier than in the refrigerated cabinet with a single air curtain;
  • The CFD simulation shows that the infiltration ratio of the refrigerated cabinet with a single air curtain is 10.4% and 7% for a two-layer air curtain;
  • The airflow velocities are up to 0.2 m/s higher for a two-layer air curtain;
  • The average temperature of the test packages decreases by approximately 0.6 °C in the case of a two-layer air curtain;
  • The 24 h electrical energy consumption decreases from 30.9 kWh to 25.2 kWh if a refrigerated cabinet with a two-layer air curtain is used instead of the single-layer version.

Author Contributions

Conceptualization, T.V. and V.M.; methodology, T.V. and V.M.; investigation, T.V.; resources, T.V.; writing—original draft preparation, T.V.; writing—review and editing, V.M.; supervision, V.M. All authors have read and agreed to the published version of the manuscript.

Funding

This research received no external funding.

Institutional Review Board Statement

Not applicable.

Informed Consent Statement

Not applicable.

Data Availability Statement

Data are available upon request.

Conflicts of Interest

The authors declare no conflict of interest.

References

  1. Cao, Z.; Han, H.; Gu, B. A novel optimization strategy for the design of air curtains for open vertical refrigerated display cases. Appl. Therm. Eng. 2011, 31, 3098–3105. [Google Scholar] [CrossRef]
  2. Field, B.S.; Loth, E. Entrainment of refrigerated air curtains down a wall. Exp. Therm. Fluid Sci. 2006, 30, 175–184. [Google Scholar] [CrossRef]
  3. Fricke, B.; Becker, B. Energy use of doored and open vertical refrigerated display cases. In Proceedings of the 13th International Refrigeration and Air Conditioning Conference, West Lafayette, IN, USA, 12–15 July 2010. [Google Scholar]
  4. Hammond, E.; Quarini, J.; Foster, A. Development of a stability model for a vertical single band recirculated air curtain sealing a refrigerated cavity. Int. J. Refrig. 2011, 34, 1455–1461. [Google Scholar] [CrossRef]
  5. Li, X.; Zhang, Z.; Liu, H.; Hu, X.; Liu, S.; Xu, Z.; Wang, Q. Performance of an open refrigerated display cabinet with two air curtains. Appl. Therm. Eng. 2022, 212, 118549. [Google Scholar] [CrossRef]
  6. Nascimento, S.M.; Heidinger, G.G.; Gaspar, P.D.; Silva, P.D. Numerical and experimental evaluation of the aerodynamic drag of the air curtain in vertical open refrigerated display cases. In Proceedings of the 25th IIR International Congress of Refrigeration, Montreal, QC, Canada, 24–30 August 2019; pp. 3437–3444. [Google Scholar] [CrossRef]
  7. Sun, J.; Tsamos, K.M.; Tassou, S.A. CFD comparisons of open-type refrigerated display cabinets with/without air guiding strips. Energy Procedia 2017, 123, 54–61. [Google Scholar] [CrossRef]
  8. Tsamos, K.M.; Mroue, H.; Sun, J.; Tassou, S.A.; Nicholls, N.; Smith, G. Energy savings potential in using cold-shelves innovation for multi-deck open front refrigerated cabinets. Energy Procedia 2019, 161, 292–299. [Google Scholar] [CrossRef]
  9. Vengalis, T.; Mokšin, V. 2D CFD simulation of dynamic heat transfer in an open-type refrigerated display cabinet. Appl. Sci. 2022, 12, 6916. [Google Scholar] [CrossRef]
  10. Wu, X.; Chang, Z.; Yuan, P.; Lu, Y.; Ma, Q.; Yin, X. The optimization and effect of back panel structure on the performance of refrigerated display cabinet. Food Control 2014, 40, 278–285. [Google Scholar] [CrossRef]
  11. Yuan, P.; Zeng, Q.; Lei, Z.; Wu, Y.; Lu, Y.; Hu, C. Experimental and numerical study of heat transfer and flow characteristics with different placement of the multi-deck display cabinet in supermarket. Open Phys. 2021, 19, 256–265. [Google Scholar] [CrossRef]
  12. Zhou, Z.; Lu, Y.; Cui, Y. Study on the effect of jet direction of compound air curtain on smoke control. Energies 2021, 14, 6983. [Google Scholar] [CrossRef]
  13. Liang, M.; Fu, C.; Xiao, B.; Luo, L.; Wang, Z. A fractal study for the effective electrolyte diffusion through charged porous media. Int. J. Heat Mass Transf. 2019, 137, 365–371. [Google Scholar] [CrossRef]
  14. Liang, M.; Liu, Y.; Xiao, B.; Yang, S.; Wang, Z.; Han, H. An analytical model for the transverse permeability of gas diffusion layer with electrical double layer effects in proton exchange membrane fuel cells. Int. J. Hydrog. Energy 2018, 43, 17880–17888. [Google Scholar] [CrossRef]
  15. Young, D.L.; Eldho, T.I.; Chang, J.T. Large eddy simulation of turbulent flows in external flow field using three-step FEM-BEM model. Eng. Anal. Bound. Elem. 2006, 30, 564–576. [Google Scholar] [CrossRef]
  16. Long, G.; Liu, Y.; Xu, W.; Zhou, P.; Zhou, J.; Xu, G.; Xiao, B. Analysis of crack problems in multilayered elastic medium by a consecutive stiffness method. Mathematics 2022, 10, 4403. [Google Scholar] [CrossRef]
  17. Rai, M.M.; Moin, P. Direct simulations of turbulent flow using finite difference schemes. J Comput. Phys. 1991, 96, 15–53. [Google Scholar] [CrossRef]
  18. Mosayebidorcheh, S.; Sheikholeslami, M.; Hatami, M.; Ganji, D.D. Analysis of turbulent MHD Couette nanofluid flow and heat transfer using hybrid DTM–FDM. Particuology 2016, 26, 95–101. [Google Scholar] [CrossRef]
  19. ISO 5155:1995; Household Refrigerating Appliances—Frozen Food Storage Cabinets and Food Freezers—Characteristics and Test Methods. The International Organization for Standardization: Geneva, Switzerland, 1995.
  20. ISO 8561:1995; Household Frost-Free Refrigerating Appliances—Refrigerators, Refrigerator-Freezers, Frozen Food Storage Cabinets and Food Freezers Cooled by Internal Forced Air Circulation—Characteristics and Test Methods. The International Organization for Standardization: Geneva, Switzerland, 1995.
  21. ISO 15502:2005; Household Refrigerating Appliances—Characteristics and Test Methods. The International Organization for Standardization: Geneva, Switzerland, 2005.
  22. ISO 8187:1991; Household Refrigerating Appliances—Refrigerator-Freezers—Characteristics and Test Methods. The International Organization for Standardization: Geneva, Switzerland, 1991.
  23. ISO 7371:1995; Household Refrigerating Appliances—Refrigerators with or without Low-Temperature Compartment—Characteristics and Test Methods. The International Organization for Standardization: Geneva, Switzerland, 1995.
  24. ISO 23953-2:2015; Refrigerated Display Cabinets—Part 2: Classification, Requirements and Test Conditions. The International Organization for Standardization: Geneva, Switzerland, 2015.
Figure 1. Schematic (2D side view, left) and picture (right) of the multi-deck OTRDC.
Applsci 13 09080 g001
Figure 2. Temperatures (left) obtained for points 1–5 (right) using meshes 4415; 8648; and 16,010.
Applsci 13 09080 g002
Figure 3. OTRDC 2D model with mesh (left) and positions of boundary conditions (right).
Applsci 13 09080 g003
Figure 4. Multi-deck refrigerated cabinet with test packages.
Applsci 13 09080 g004
Figure 5. Scheme of air velocity measurement with a hot wire thermal anemometer.
Applsci 13 09080 g005
Figure 6. Comparison of the food temperatures obtained by CFD and experimentally.
Applsci 13 09080 g006
Figure 7. Comparison of the airflow velocities obtained by CFD and measurements.
Applsci 13 09080 g007
Figure 8. Distribution of the air velocity (m/s) in the middle plane of the OTRDC with a single air curtain.
Applsci 13 09080 g008
Figure 9. Distribution of the air velocity (m/s) in the middle plane of the OTRDC with the two-layer air curtain.
Applsci 13 09080 g009
Figure 10. Airflow velocities near the shelves (single air curtain).
Applsci 13 09080 g010
Figure 11. Airflow velocities near the shelves (two-layer air curtain).
Applsci 13 09080 g011
Figure 12. Distribution of the temperature (°C) in the middle plane of the OTRDC with one air curtain (left) and two air curtains (right) after 24 h of the working cycle without defrosting process.
Applsci 13 09080 g012
Figure 13. Distribution of the temperature of food products in the middle plane of refrigerated cabinets (CFD simulation results).
Applsci 13 09080 g013
Figure 14. Distribution of the temperature of food products in the middle plane of refrigerated cabinets (experimental data).
Applsci 13 09080 g014
Figure 15. The 24 h electrical energy consumption graph of the refrigerated cabinet with a single air curtain.
Applsci 13 09080 g015
Figure 16. The 24 h electrical energy consumption graph of the refrigerated cabinet with two-layer air curtain.
Applsci 13 09080 g016
Table 1. Technical characteristics of the OTRDC presented in Figure 1.
CharacteristicRefrigerated Cabinet with Single Air CurtainRefrigerated Cabinet with Two-Layer Air
Curtain
Width without end walls, mm25002500
Volume, m32.022.02
Exposition space, m25.985.98
Depth of the bottom shelf, mm600600
Depth of other shelves, mm450450
Dimensions of test products (M packages), mm200 × 100 × 50200 × 100 × 50
Dimensions of the DAG (width × height × depth), mm2500 × 120 × 202500 × 120 × 20
Dimensions of the RAG (width × height), mm2500 × 702500 × 70
Number of propeller fans44
Diameter of fan, mm172172
Flowrate (m3/h) and rpm of propeller fan (backflow pressure 10 Pa)290; 1600335; 1800
Connection typeStand aloneStand alone
Set point temperature3 °C3 °C
Table 2. Boundary conditions.
Pressure, PaVelocity, m/sTemperature, K
Air-on (Main airstream) 1.4276.9
Air-on (additional 2nd air curtain) 2.4281.15
Air-off (Main airstream) 1.4
Air-off (additional 2nd air curtain) 2.4
Open boundary0 298.15
Initial model temperature 283.15
Disclaimer/Publisher’s Note: The statements, opinions and data contained in all publications are solely those of the individual author(s) and contributor(s) and not of MDPI and/or the editor(s). MDPI and/or the editor(s) disclaim responsibility for any injury to people or property resulting from any ideas, methods, instructions or products referred to in the content.

