
Software Product Line Maintenance Using Multi-Objective Optimization Techniques
 , , ,
, , ,
Abstract
:1. Introduction
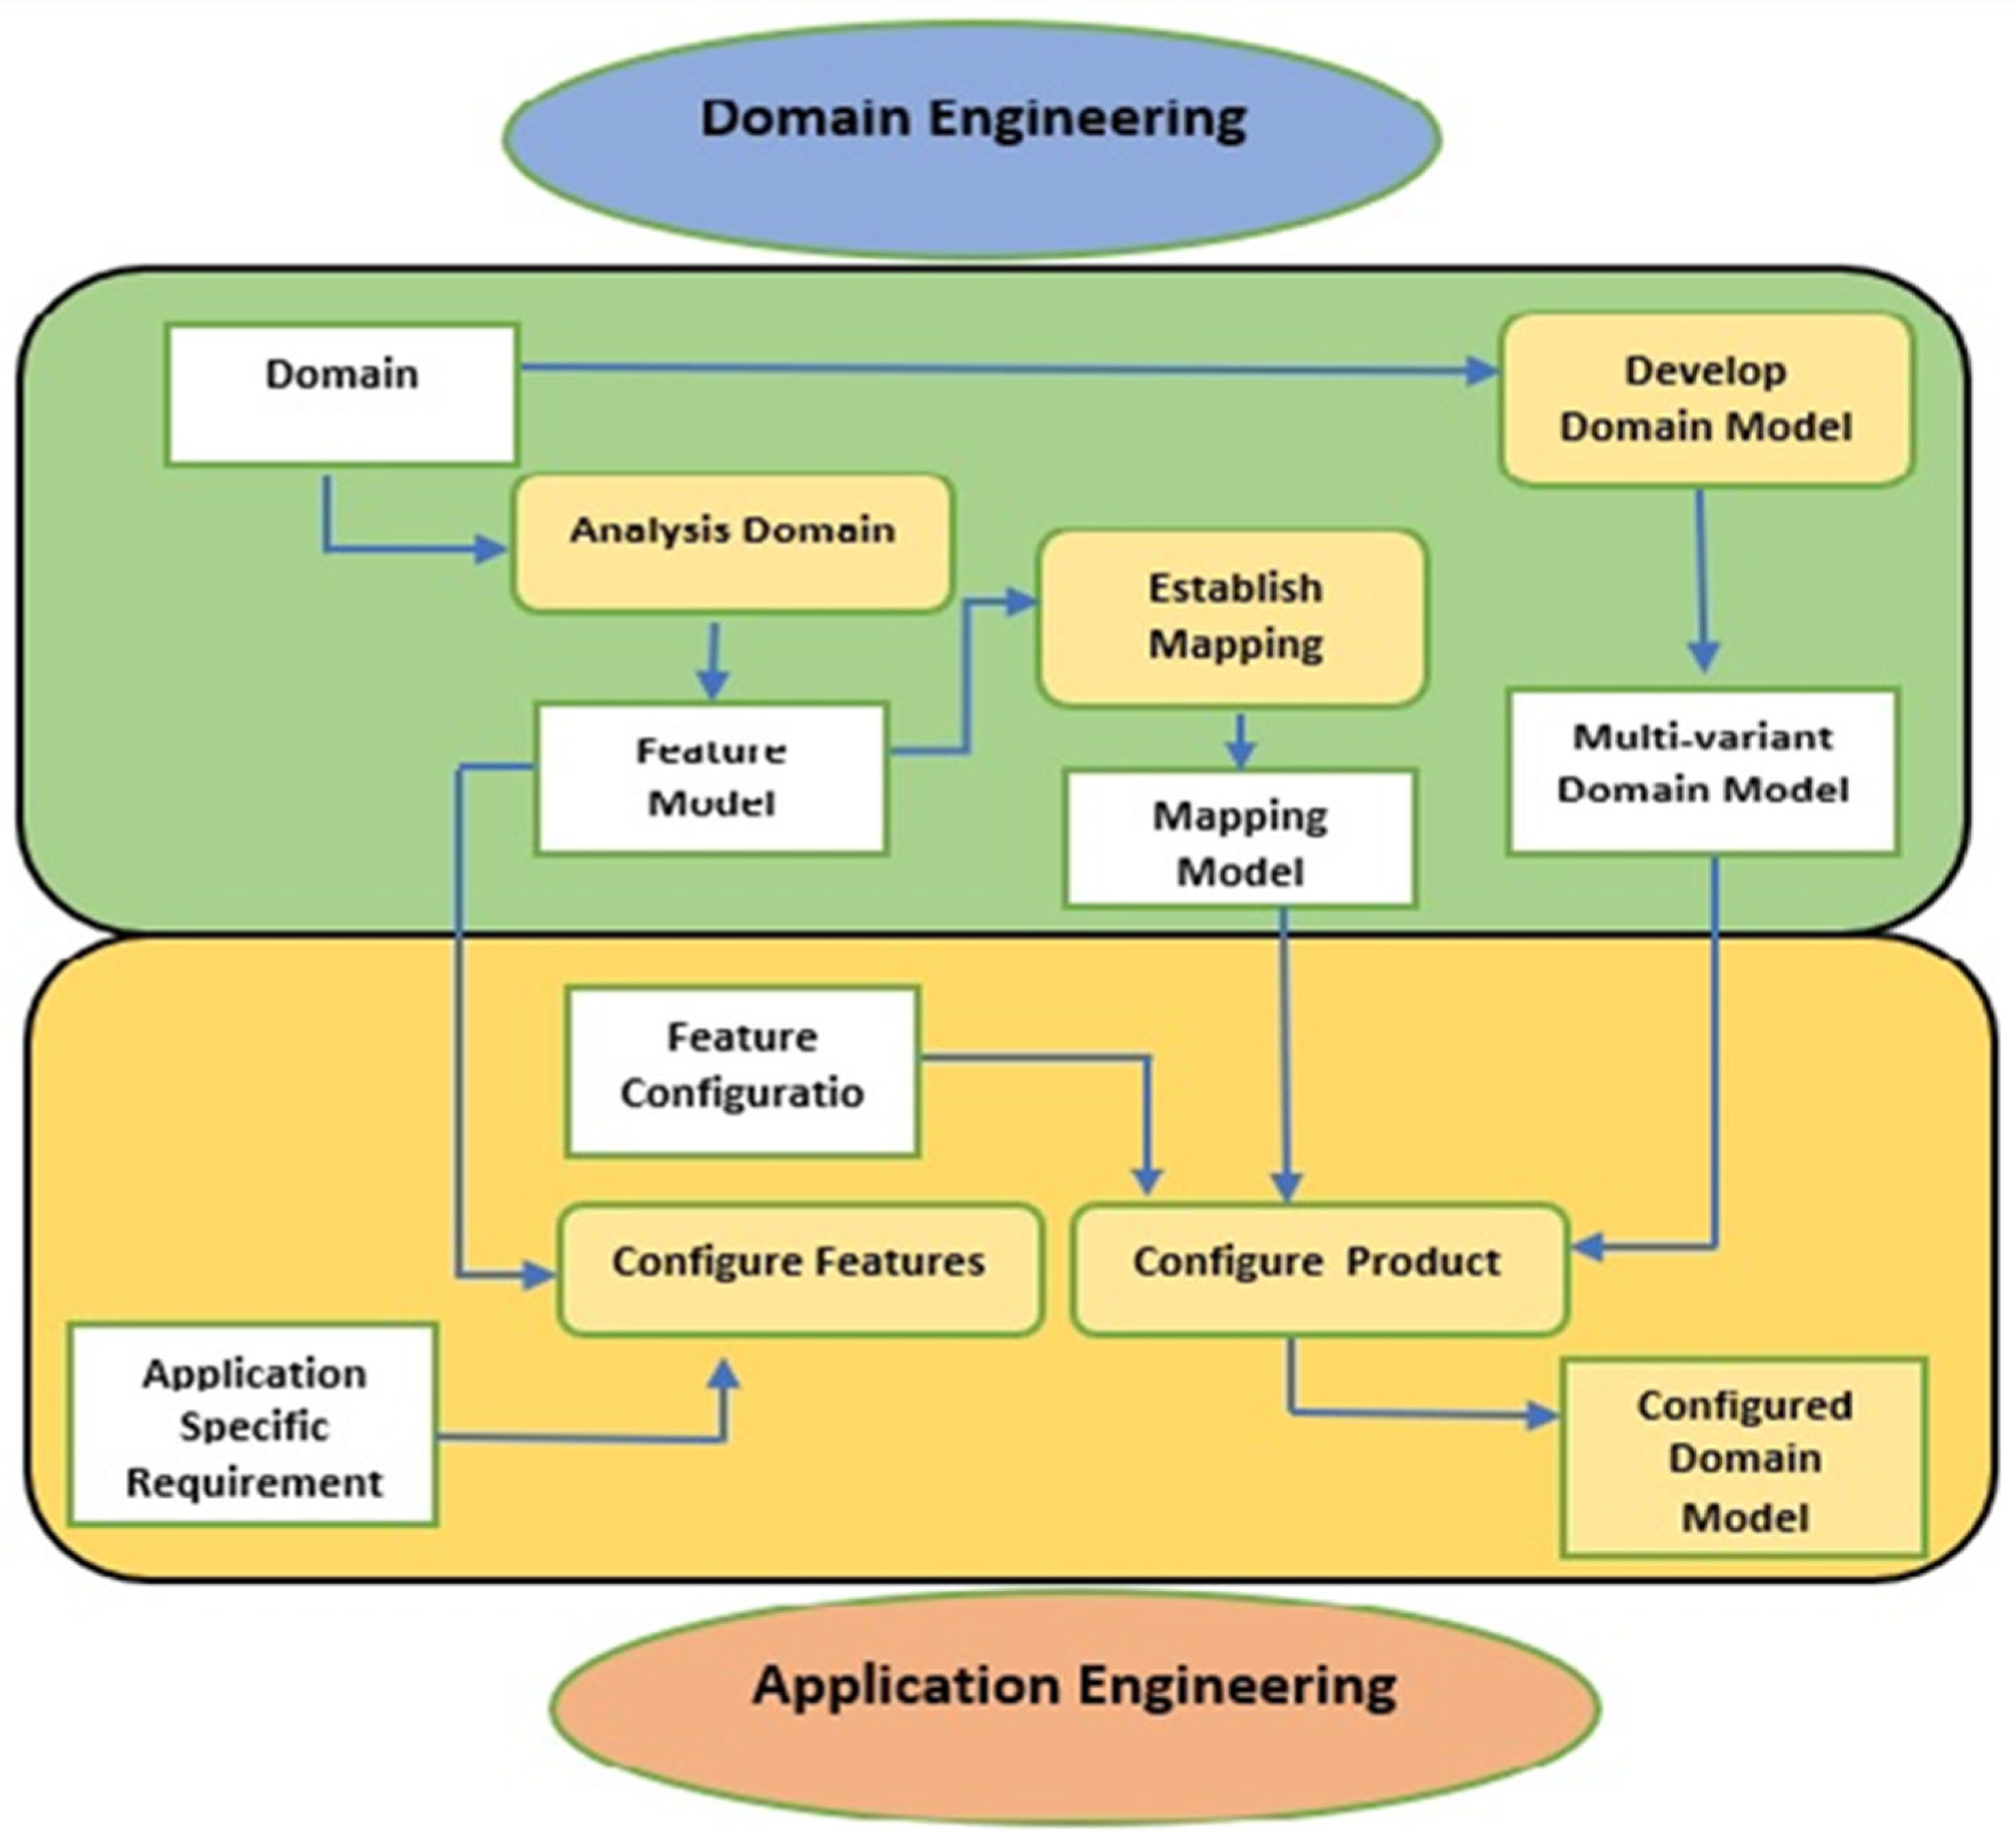
2. Software Product Line Engineering
3. Related Work
4. Optimization for SPL Testing Using Multi-Objective Evolutionary Algorithms
4.1. Method Description
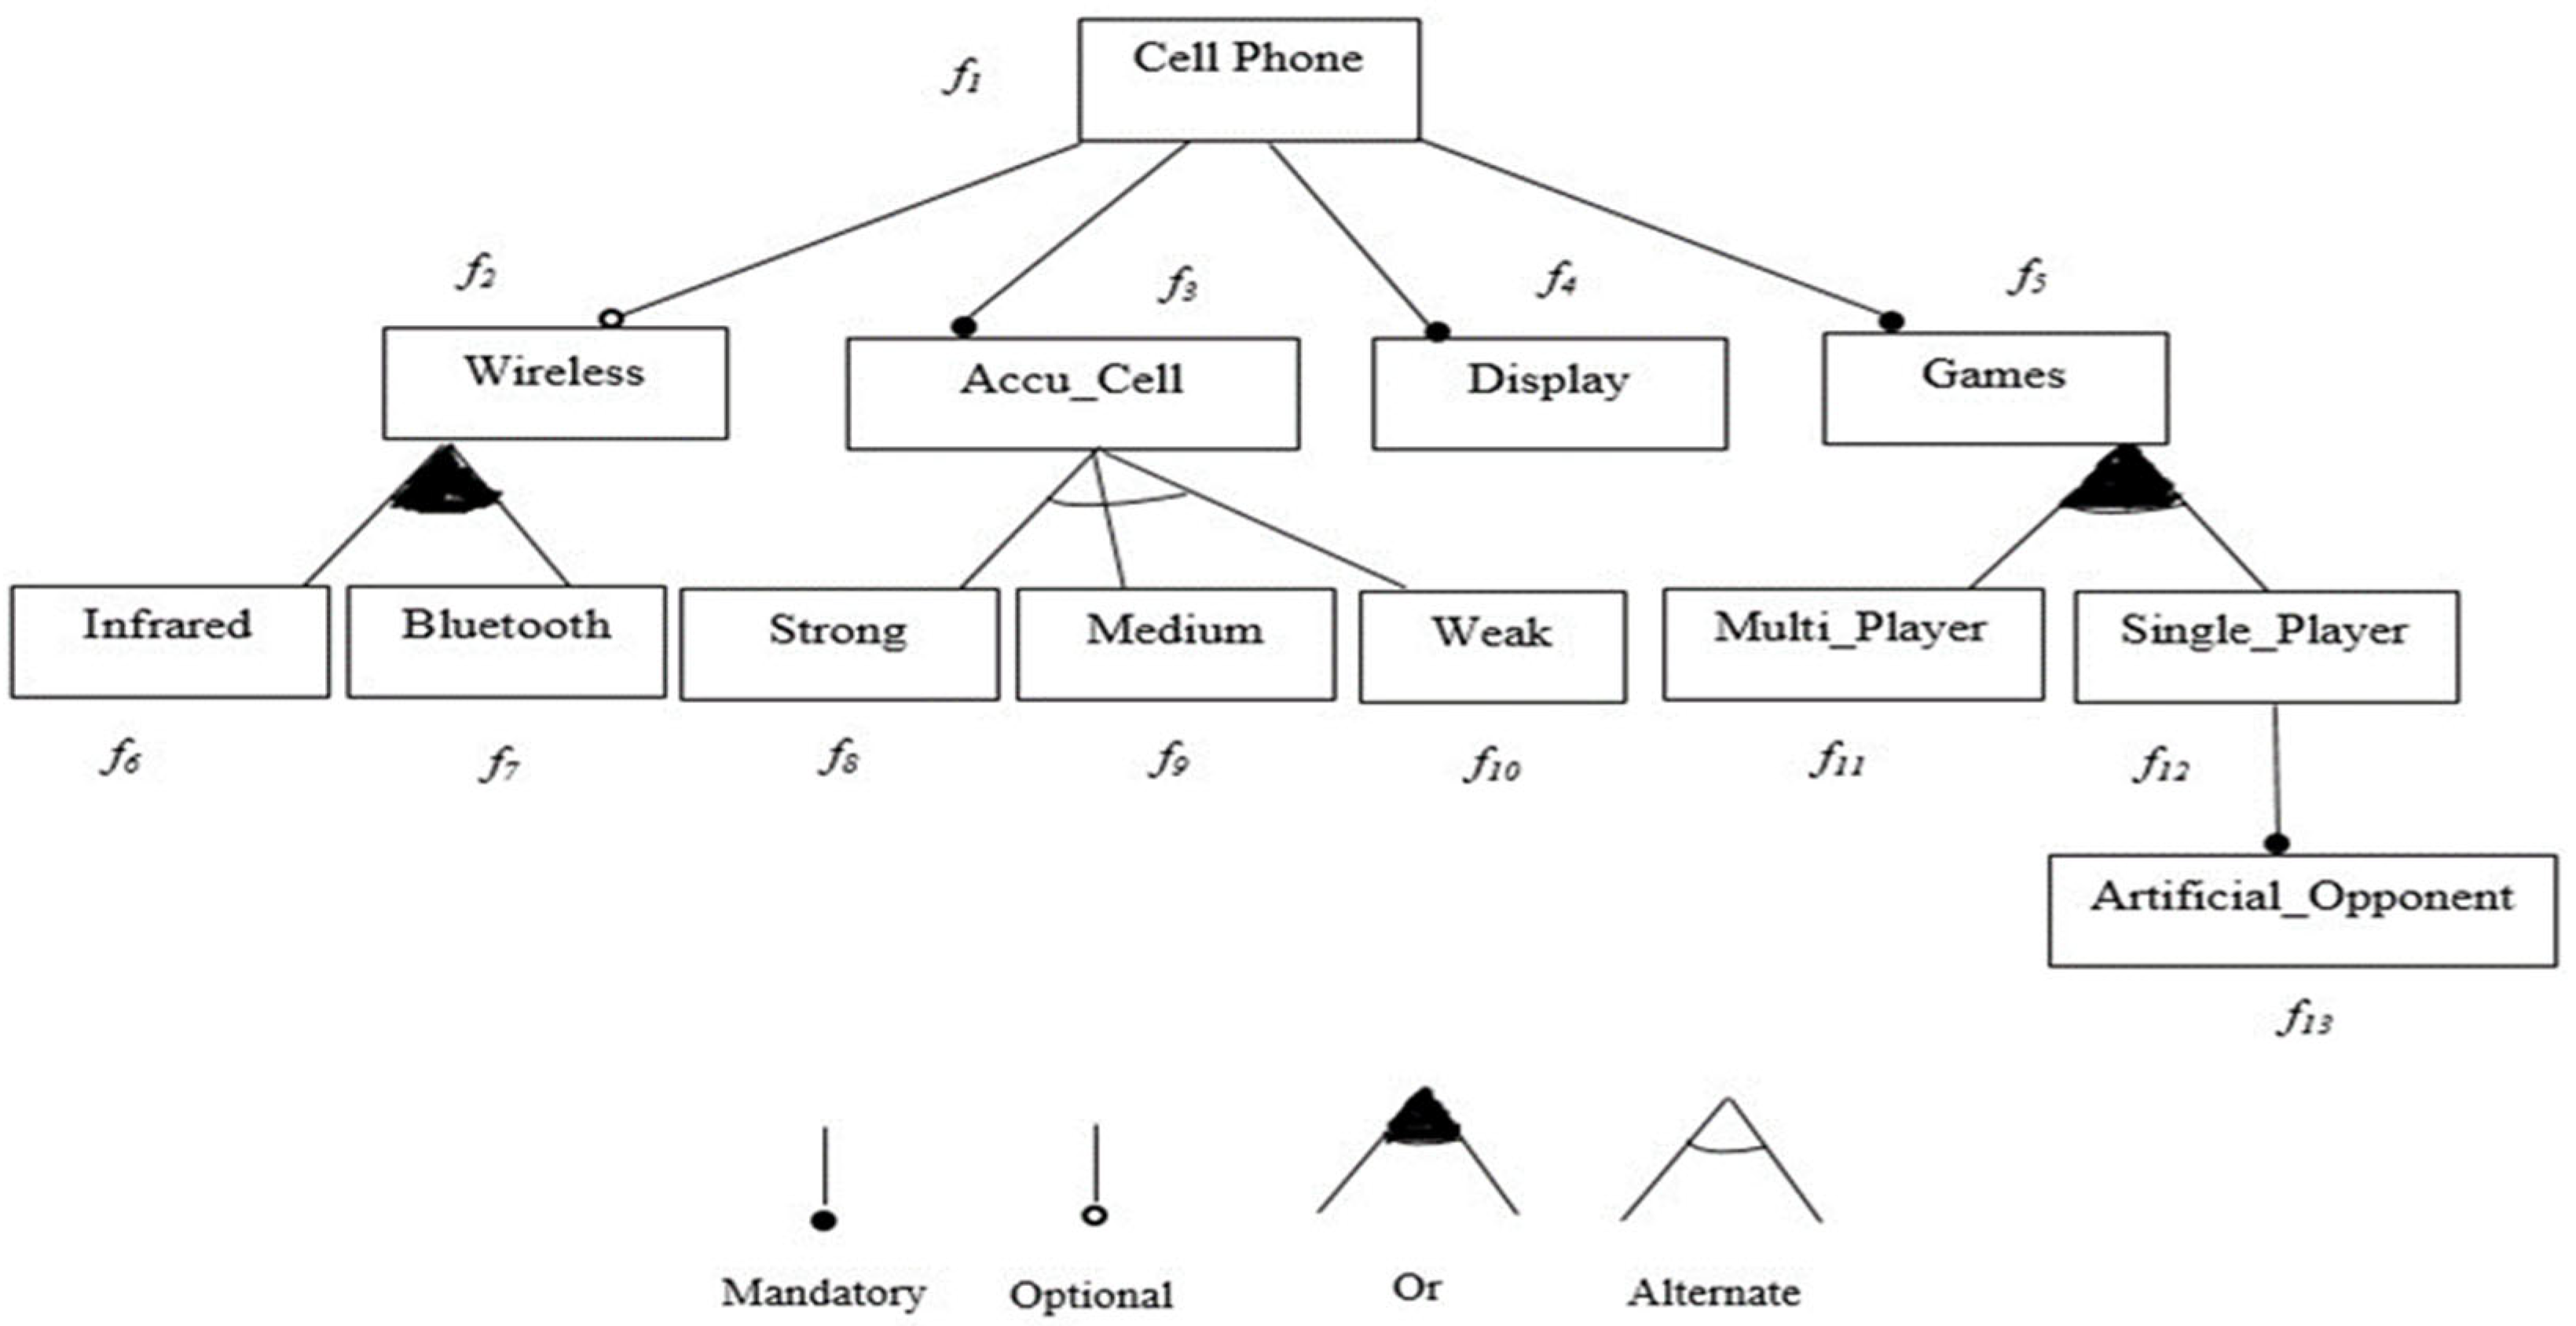
4.1.1. Definition 1 (Feature Model)
4.1.2. Definition 2 (Configuration)
4.1.3. Definition 3 (Configuration Suite)
4.1.4. Definition 4 (Coverage Criteria)
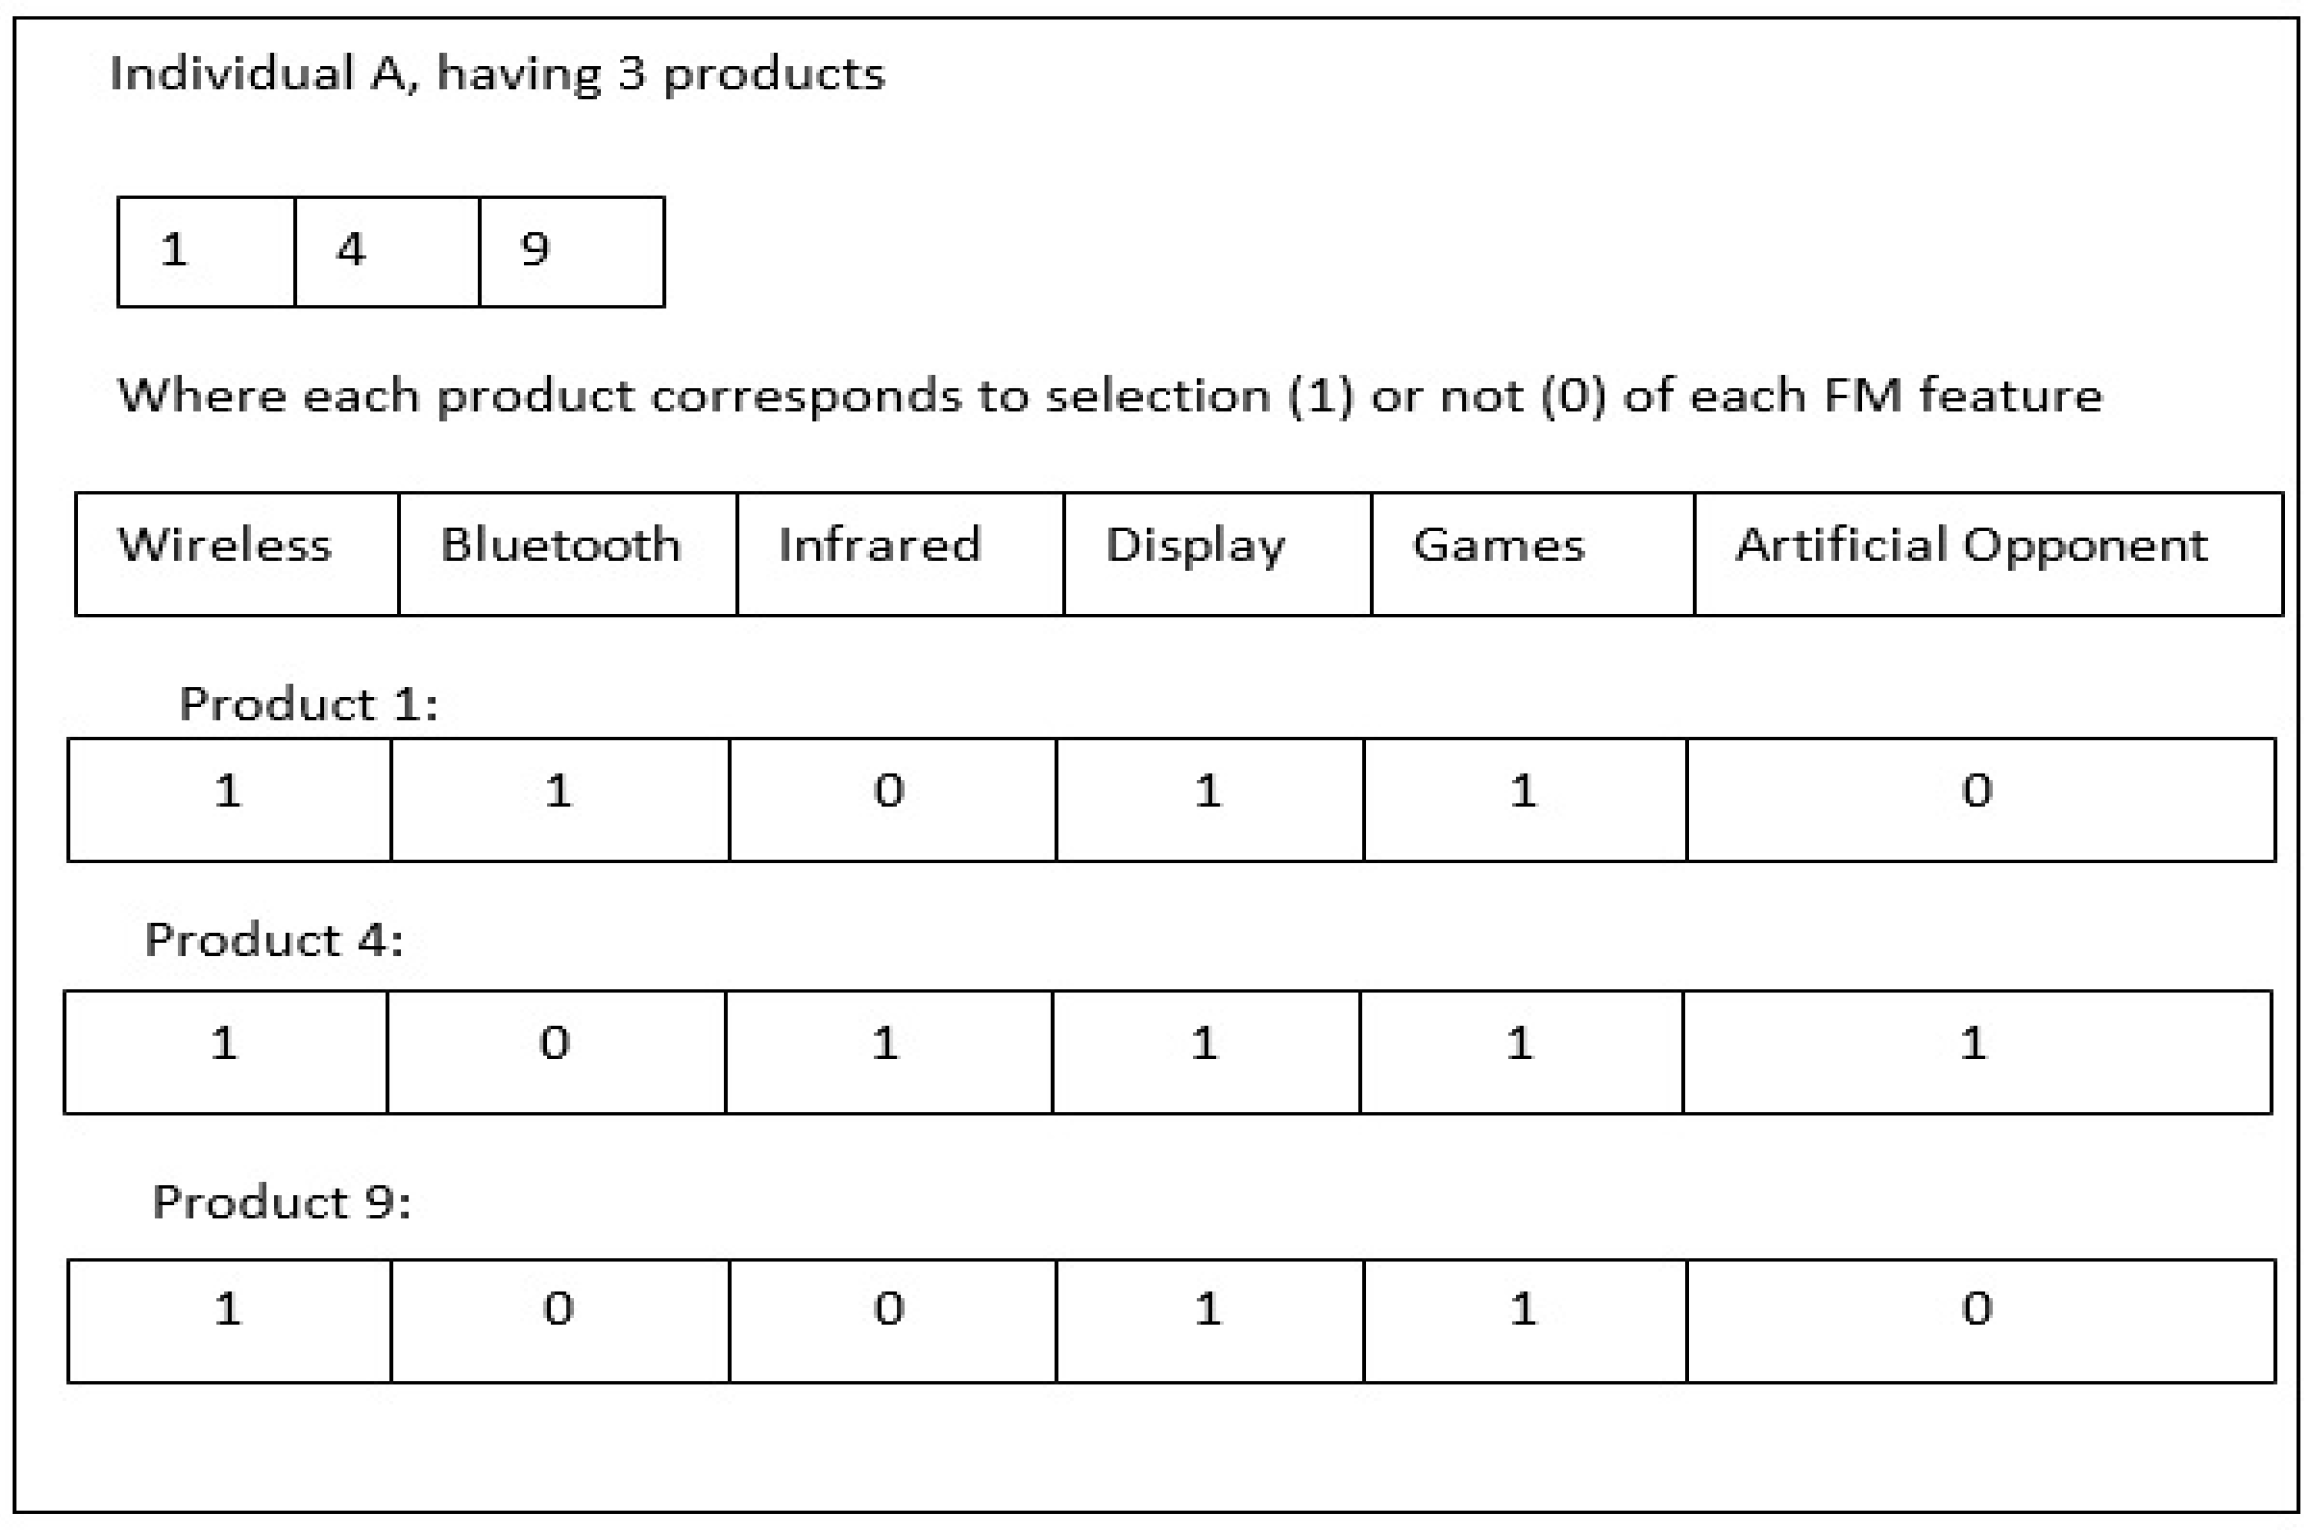
4.1.5. Definition 5 (Individual)
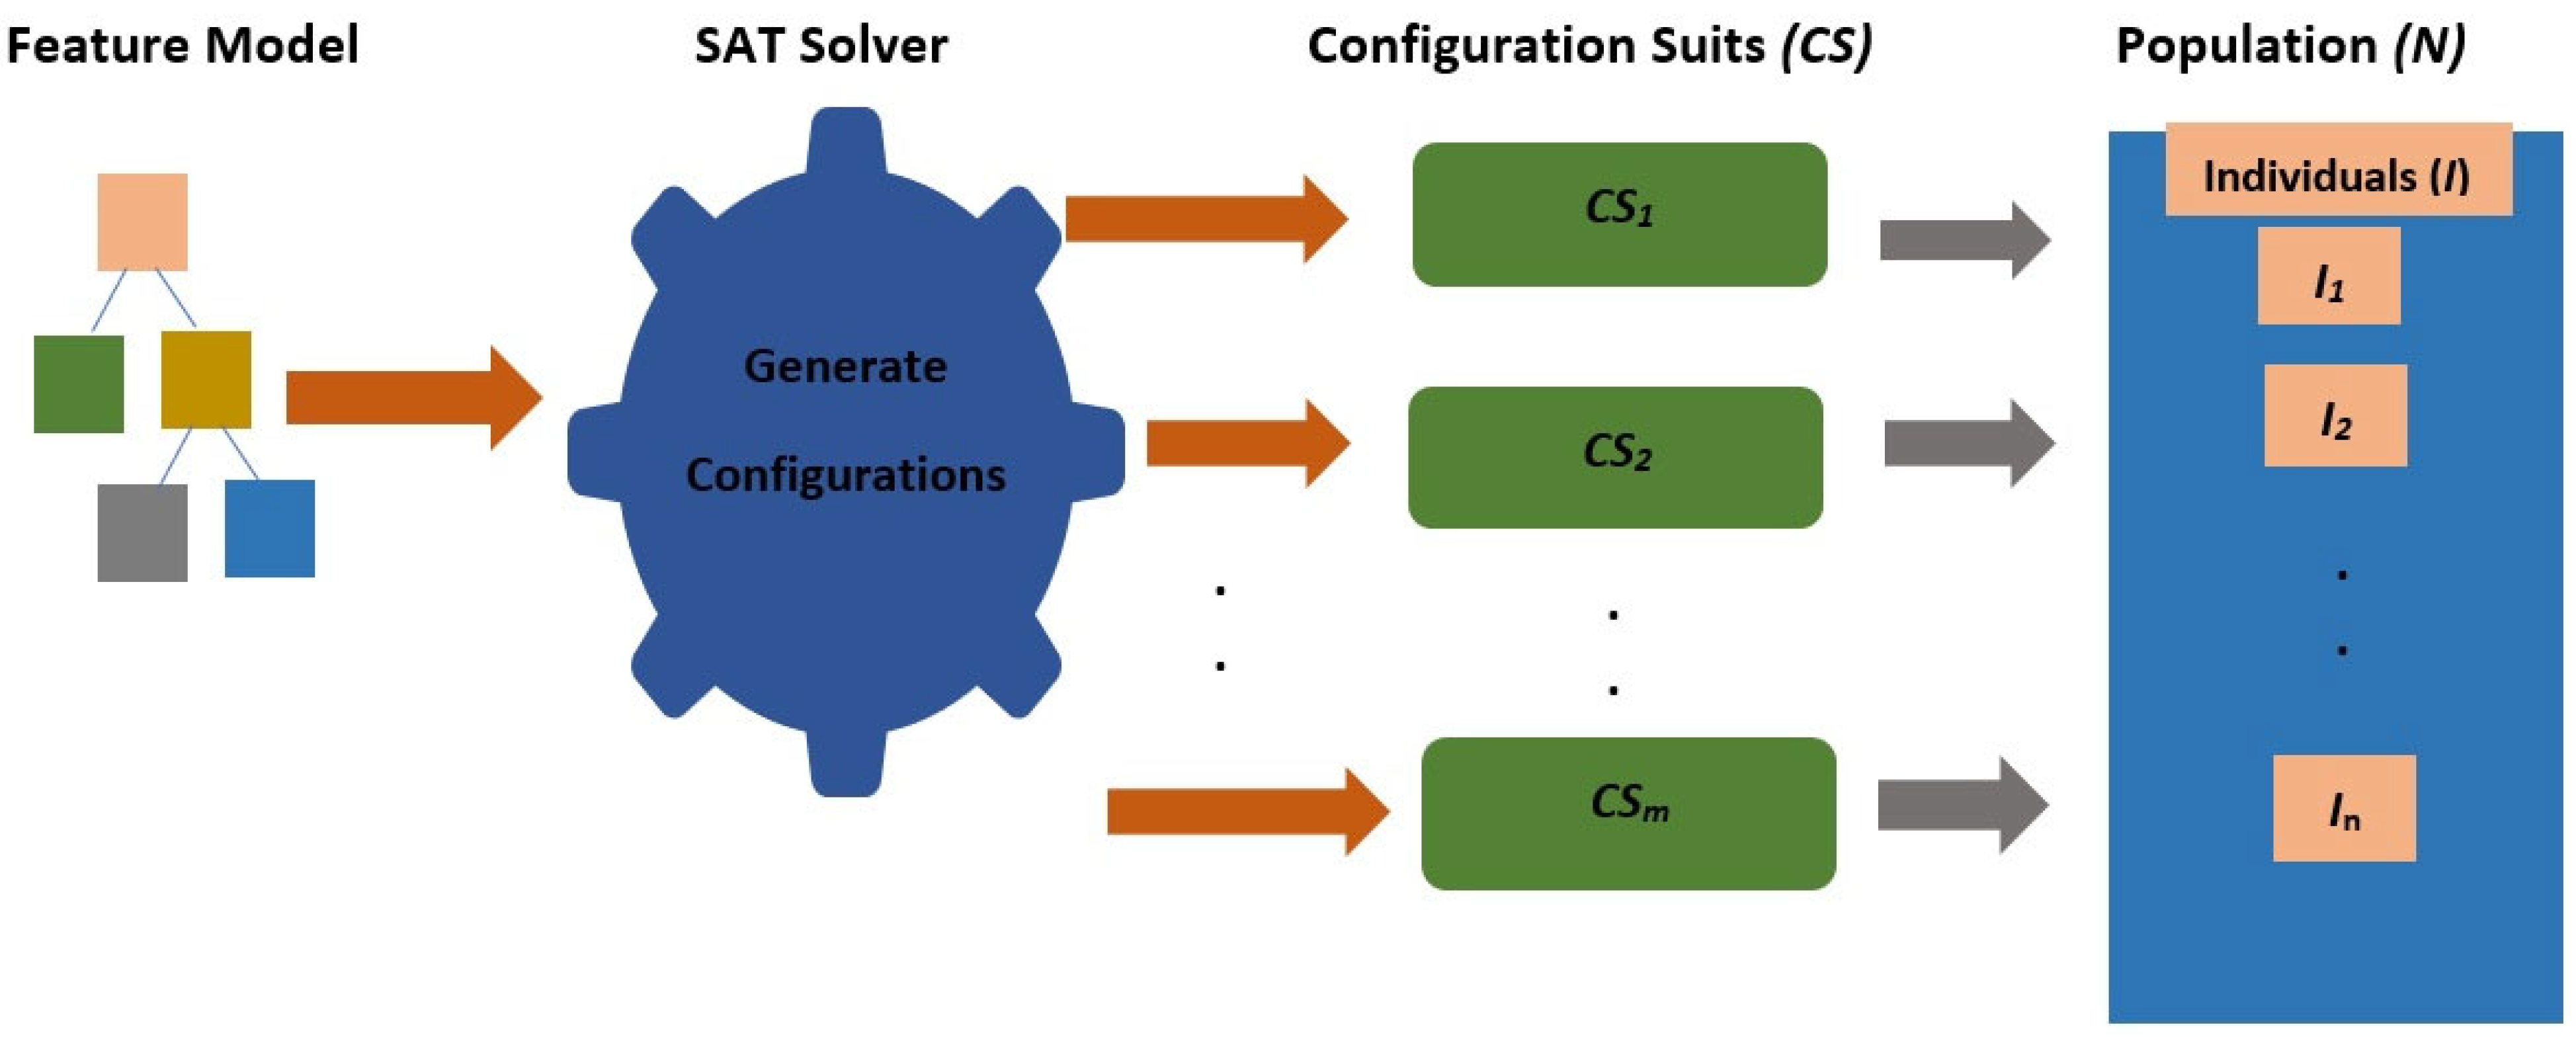
4.1.6. Definition 5 (Population)
4.2. Objectives Definition
4.2.1. Maximize the Pairwise Coverage
4.2.2. Minimize the Number of Products
4.2.3. Testing Cost
4.2.4. Maximizing Number of Features
5. Experiments
5.1. Framework Adopted
5.2. Data Collection
5.3. Parameters Selection
6. Results and Discussion
6.1. Pareto Front Solutions
6.2. Results Generated by Quality Indicators
6.3. Fitness Values for Four Objectives Optimization
6.4. Discussion of Results and Answers to Research Questions
7. Conclusions
7.1. Practical Implications
7.2. Threats to Validity
Author Contributions
Funding
Institutional Review Board Statement
Informed Consent Statement
Data Availability Statement
Acknowledgments
Conflicts of Interest
References
- Harman, M.; Mansouri, S.A.; Zhang, Y. Search-based software engineering: Trends, techniques and applications. ACM Comput. Surv. (CSUR) 2012, 45, 1–13. [Google Scholar] [CrossRef] [Green Version]
- Khari, M.; Kumar, P. An extensive evaluation of search-based software testing: A review. Soft Comput. 2019, 23, 1933–1946. [Google Scholar] [CrossRef]
- Engström, E.; Runeson, P. Software product line testing–a systematic mapping study. Inf. Softw. Technol. 2011, 53, 2–13. [Google Scholar] [CrossRef] [Green Version]
- Varshosaz, M.; Al-Hajjaji, M.; Thüm, T.; Runge, T.; Mousavi, M.R.; Schaefer, I. A classification of product sampling for software product lines. In Proceedings of the 22nd International Systems and Software Product Line Conference, Gothenburg, Sweden, 10–14 September 2018; Volume 1, pp. 1–13. [Google Scholar] [CrossRef]
- Cawley, C.; Botterweck, G.; Healy, P.; Abid, S.B.; Thiel, S. A 3d visualisation to enhance cognition in software product line engineering. In International Symposium on Visual Computing; Springer: Berlin/Heidelberg, Germany, 2009; pp. 857–868. [Google Scholar]
- Hotz, L.; Wolter, K.; Krebs, T. Configuration in Industrial Product Families: The ConIPF Methodology; IOS Press: Amsterdam, The Netherlands, 2006. [Google Scholar]
- Cawley, C.; Thiel, S.; Botterweck, G.; Nestor, D. Visualising Inter-Model Relationships in Software Product Lines. In Proceedings of the Third International Workshop on Variability Modelling of Software-Intensive Systems, Seville, Spain, 28–30 January 2009; pp. 37–44. [Google Scholar]
- Runeson, P.; Engström, E. Regression testing in software product line engineering. In Advances in Computers; Elsevier: Amsterdam, The Netherlands, 2012; Volume 86, pp. 223–263. [Google Scholar]
- Mendonca, M.; Branco, M.; Cowan, D. SPLOT: Software product lines online tools. In Proceedings of the 24th ACM SIGPLAN Conference Companion on Object Oriented Programming Systems Languages and Applications, Orlando, FL, USA, 25–29 October 2009; pp. 761–762. [Google Scholar] [CrossRef]
- Pohl, K.; Böckle, G.; Van Der Linden, F. Software Product Line Engineering: Foundations, Principles, and Techniques; Springer: Cham Switzerland, 2005. [Google Scholar]
- McGregor, J.D.; Northrop, L.M.; Jarrad, S.; Pohl, K. Initiating software product lines. IEEE Softw. 2002, 19, 24. [Google Scholar] [CrossRef]
- Trigaux, J.C.; Heymans, P. Software product lines: State of the art. In Product Line ENgineering of Food TraceabilitY Software; FUNDP-Equipe LIEL: Namur, Belgium, 2003; pp. 9–39. [Google Scholar]
- Buchmann, T.; Schwägerl, F. Advancing negative variability in model-driven software product line engineering. In Proceedings of the Evaluation of Novel Approaches to Software Engineering: 11th International Conference, ENASE 2016, Rome, Italy, 27–28 April 2016; pp. 1–26. [Google Scholar]
- Al-Hajjaji, M.; Lity, S.; Lachmann, R.; Thüm, T.; Schaefer, I.; Saake, G. Delta-oriented product prioritization for similarity-based product-line testing. In Proceedings of the 2017 IEEE/ACM 2nd International Workshop on Variability and Complexity in Software Design (VACE), Buenos Aires, Argentina, 27 May 2017; pp. 34–40. [Google Scholar]
- Al-Hajjaji, M.; Thüm, T.; Lochau, M.; Meinicke, J.; Saake, G. Effective product-line testing using similarity-based product prioritization. Softw. Syst. Model. 2019, 18, 499–521. [Google Scholar] [CrossRef]
- Li, X.; Wong, W.E.; Gao, R.; Hu, L.; Hosono, S. Genetic algorithm-based test generation for software product line with the integration of fault localization techniques. Empir. Softw. Eng. 2018, 23, 1–51. [Google Scholar] [CrossRef]
- Krüger, J.; Al-Hajjaji, M.; Leich, T.; Saake, G. Mutation operators for feature-oriented software product lines. Softw. Test. Verif. Reliab. 2019, 29, e1676. [Google Scholar] [CrossRef] [Green Version]
- Lity, S.; Nieke, M.; Thüm, T.; Schaefer, I. Retest test selection for product-line regression testing of variants and versions of variants. J. Syst. Softw. 2019, 147, 46–63. [Google Scholar] [CrossRef]
- Guo, J.; Liang, J.H.; Shi, K.; Yang, D.; Zhang, J.; Czarnecki, K.; Ganesh, V.; Yu, H. SMTIBEA: A hybrid multi-objective optimization algorithm for configuring large constrained software product lines. Softw. Syst. Model. 2019, 18, 1447–1466. [Google Scholar] [CrossRef]
- Alsewari, A.A.; Kabir, M.N.; Zamli, K.Z.; Alaofi, K.S. Software product line test list generation based on harmony search algorithm with constraints support. Int. J. Adv. Comput. Sci. Appl. 2019, 10, 605–610. [Google Scholar] [CrossRef] [Green Version]
- Al-Hajjaji, M.; Ryssel, U.; Schulze, M. Validating Partial Configurations of Product Lines. In Proceedings of the 13th International Workshop on Variability Modelling of Software-Intensive Systems, Leuven, Belgium, 6–8 February 2019; pp. 1–6. [Google Scholar] [CrossRef]
- Wang, S.; Ali, S.; Gotlieb, A. Minimizing test suites in software product lines using weight-based genetic algorithms. In Proceedings of the 15th Annual Conference on Genetic and Evolutionary Computation, Amsterdam, The Netherlands, 6–10 July 2013; pp. 1493–1500. [Google Scholar]
- Wang, S.; Buchmann, D.; Ali, S.; Gotlieb, A.; Pradhan, D.; Liaaen, M. Multi-objective test prioritization in software product line testing: An industrial case study. In Proceedings of the 18th International Software Product Line Conference, Florence, Italy, 15–19 September 2014; Volume 1, pp. 32–41. [Google Scholar] [CrossRef]
- Ensan, F.; Bagheri, E.; Gašević, D. Evolutionary search-based test generation for software product line feature models. In Advanced Information Systems Engineering: Proceedings of the 24th International Conference, CAiSE 2012, Gdansk, Poland, 25–29 June 2012; Proceedings 24; Springer: Berlin, Germany, 2012; pp. 613–628. [Google Scholar] [CrossRef]
- Henard, C.; Papadakis, M.; Perrouin, G.; Klein, J.; Traon, Y.L. Multi-objective test generation for software product lines. In Proceedings of the 17th International Software Product Line Conference, Tokyo, Japan, 26–30 August 2013; pp. 62–71. [Google Scholar] [CrossRef] [Green Version]
- Matnei Filho, R.A.; Vergilio, S.R. A mutation and multi-objective test data generation approach for feature testing of software product lines. In Proceedings of the 2015 29th Brazilian Symposium on Software Engineering, Belo Horizonte, Brazil, 21–26 September 2015; pp. 21–30. [Google Scholar] [CrossRef] [Green Version]
- Henard, C. Enabling Testing of Large Scale Highly Configurable Systems with Search-Based Software Engineering: The Case of Model-Based Software Product Lines. Doctoral Dissertation, University of Luxembourg, Luxembourg, 2015. [Google Scholar]
- Olaechea, R.; Rayside, D.; Guo, J.; Czarnecki, K. Comparison of exact and approximate multi-objective optimization for software product lines. In Proceedings of the 18th International Software Product Line Conference, Paris, France, 9–13 September 2019; Volume 1, pp. 92–101. [Google Scholar] [CrossRef] [Green Version]
- Sayyad, A.S.; Menzies, T.; Ammar, H. On the value of user preferences in search-based software engineering: A case study in software product lines. In Proceedings of the 2013 35th International Conference on Software Engineering (ICSE), San Francisco, CA, USA, 18–26 May 2013; pp. 492–501. [Google Scholar] [CrossRef] [Green Version]
- Diaz, J.; Perez, J.; Fernandez-Sanchez, C.; Garbajosa, J. Model-to-code transformation from product-line architecture models to aspectj. In Proceedings of the 2013 39th Euromicro Conference on Software Engineering and Advanced Applications, Santander, Spain, 4–6 September 2013; pp. 98–105. [Google Scholar] [CrossRef]
- Karimpour, R.; Ruhe, G. Bi-criteria genetic search for adding new features into an existing product line. In Proceedings of the 2013 1st International Workshop on Combining Modelling and Search-Based Software Engineering (CMSBSE), San Francisco, CA, USA, 20 May 2013; pp. 34–38. [Google Scholar] [CrossRef] [Green Version]
- Cruz, J.; Neto, P.S.; Britto, R.; Rabelo, R.; Ayala, W.; Soares, T.; Mota, M. Toward a hybrid approach to generate software product line portfolios. In Proceedings of the 2013 IEEE Congress on Evolutionary Computation, Cancun, Mexico, 20–23 June 2013; pp. 2229–2236. [Google Scholar] [CrossRef]
- Guo, J.; White, J.; Wang, G.; Li, J.; Wang, Y. A genetic algorithm for optimized feature selection with resource constraints in software product lines. J. Syst. Softw. 2011, 84, 2208–2221. [Google Scholar] [CrossRef]
- Pereira, J.A.; Figueiredo, E.; Noronha, T. Modelo computacional para apoiar a configuração de produtos em linha de produtos de software. In Proceedings of the V Workshop de Engenharia de Software Baseada em Busca (WESB). Congresso Brasileiro de Desenvolvimento de Software (CBSoft), Brasilia, Brazil, 2013; pp. 80–89. [Google Scholar]
- White, J.; Galindo, J.A.; Saxena, T.; Dougherty, B.; Benavides, D.; Schmidt, D.C. Evolving feature model configurations in software product lines. J. Syst. Softw. 2014, 87, 119–136. [Google Scholar] [CrossRef]
- Li, J.; Liu, X.; Wang, Y.; Guo, J. Formalizing feature selection problem in software product lines using 0–1 programming. In Practical Applications of Intelligent Systems: Proceedings of the Sixth International Conference on Intelligent Systems and Knowledge Engineering, Shanghai, China, 15–17 Decemeber 2011; Springer: Berlin/Heidelberg, Germany, 2012; pp. 459–465. [Google Scholar] [CrossRef]
- Sayyad, A.S.; Goseva-Popstojanova, K.; Menzies, T.; Ammar, H. On parameter tuning in search based software engineering: A replicated empirical study. In Proceedings of the 2013 3rd International Workshop on Replication in Empirical Software Engineering Research, Baltimore, MD, USA, 9 October 2013; pp. 84–90. [Google Scholar] [CrossRef]
- Sayyad, A.S.; Ingram, J.; Menzies, T.; Ammar, H. Optimum feature selection in software product lines: Let your model and values guide your search. In Proceedings of the 2013 1st International Workshop on Combining Modelling and Search-Based Software Engineering (CMSBSE), San Francisco, CA, USA, 20 May 2013; pp. 22–27. [Google Scholar] [CrossRef] [Green Version]
- Lopez-Herrejon, R.E.; Chicano, F.; Ferrer, J.; Egyed, A.; Alba, E. Multi-objective optimal test suite computation for software product line pairwise testing. In Proceedings of the 2013 IEEE International Conference on Software Maintenance, Eindhoven, The Netherlands, 22–28 September 2013; pp. 404–407. [Google Scholar] [CrossRef] [Green Version]
- Henard, C.; Papadakis, M.; Perrouin, G.; Klein, J.; Heymans, P.; Le Traon, Y. Bypassing the combinatorial explosion: Using similarity to generate and prioritize t-wise test configurations for software product lines. IEEE Trans. Softw. Eng. 2014, 40, 650–670. [Google Scholar] [CrossRef] [Green Version]
- Johansen, M.F.; Haugen, Ø.; Fleurey, F. Properties of realistic feature models make combinatorial testing of product lines feasible. In Model Driven Engineering Languages and Systems: Proceedings of the 14th International Conference, MODELS 2011, Wellington, New Zealand, 16–21 October 2011; Proceedings 14. Springer: Berlin/Heidelberg, Germany, 2011; pp. 638–652. [Google Scholar] [CrossRef] [Green Version]
- Mendonca, M.; Wąsowski, A.; Czarnecki, K. SAT-based analysis of feature models is easy. In Proceedings of the 13th International Software Product Line Conference, San Francisco, CA, USA, 24–28 August 2009; pp. 231–240. [Google Scholar]
- Oster, S.; Markert, F.; Ritter, P. Automated incremental pairwise testing of software product lines. In Software Product Lines: Going Beyond: Proceedings of the 14th International Conference, SPLC 2010, Jeju Island, Republic of Korea, 13–17 September 2010; Proceedings 14; Springer: Berlin/Heidelberg, Germany, 2010; pp. 196–210. [Google Scholar] [CrossRef]
- Perrouin, G.; Oster, S.; Sen, S.; Klein, J.; Baudry, B.; Le Traon, Y. Pairwise testing for software product lines: Comparison of two approaches. Softw. Qual. J. 2012, 20, 605–643. [Google Scholar] [CrossRef] [Green Version]
- Al-Msie’Deen, R.; Seriai, A.D.; Huchard, M.; Urtado, C.; Vauttier, S.; Salman, H.E. An approach to recover feature models from object-oriented source code. Actes J. Lignes Prod. 2012, 2012, 15–26. [Google Scholar]
- Jamil, M.A.; Nour, M.K.; Alhindi, A.; Awang Abhubakar, N.S.; Arif, M.; Aljabri, T.F. Towards Software Product Lines Optimization Using Evolutionary Algorithms. Procedia Comput. Sci. 2019, 163, 527–537. [Google Scholar] [CrossRef]
- Zitzler, E.; Künzli, S. Indicator-based selection in multiobjective search. In Parallel Problem Solving from Nature—PPSN VIII; Springer: Berlin/Heidelberg, Germany, 2004; Volume 4, pp. 832–842. [Google Scholar] [CrossRef]
- Zhang, Q.; Li, H. MOEA/D: A multiobjective evolutionary algorithm based on decomposition. IEEE Trans. Evol. Comput. 2007, 11, 712–731. [Google Scholar] [CrossRef]
- Deb, K.; Pratap, A.; Agarwal, S.; Meyarivan, T.A.M.T. A fast and elitist multiobjective genetic algorithm: NSGA-II. IEEE Trans. Evol. Comput. 2002, 6, 182–197. [Google Scholar] [CrossRef] [Green Version]
- Deb, K.; Jain, H. An evolutionary many-objective optimization algorithm using reference-point-based nondominated sorting approach, part I: Solving problems with box constraints. IEEE Trans. Evol. Comput. 2013, 18, 577–601. [Google Scholar] [CrossRef]
- Zitzler, E.; Laumanns, M.; Thiele, L. SPEA2: Improving the Strength Pareto Evolutionary Algorithm; TIK Report; ETH Zurich, Computer Engineering and Networks Laboratory: Zurich, Switzerland, 2001; Volume 103. [Google Scholar] [CrossRef]
- Hadka, D. MOEA Framework User Guide: A Free and Open Source Java Framework for Multiobjective Optimization; Version 2; Free Software Foundation: Boston, MA, USA, 2014; pp. 1–192. [Google Scholar]
- Ehrgott, M. Vilfredo Pareto and multi-objective optimization. Doc. Math. 2012, 8, 447–453. [Google Scholar]
- García, S.; Molina, D.; Lozano, M.; Herrera, F. A study on the use of non-parametric tests for analyzing the evolutionary algorithms’ behaviour: A case study on the CEC’2005 special session on real parameter optimization. J. Heuristics 2009, 15, 617–644. [Google Scholar] [CrossRef]
- Zitzler, E.; Thiele, L.; Laumanns, M.; Fonseca, C.M.; Da Fonseca, V.G. Performance assessment of multiobjective optimizers: An analysis and review. IEEE Trans. Evol. Comput. 2003, 7, 117–132. [Google Scholar] [CrossRef] [Green Version]
- Zitzler, E.; Brockhoff, D.; Thiele, L. The hypervolume indicator revisited: On the design of Pareto-compliant indicators via weighted integration. In Evolutionary Multi-Criterion Optimization: Proceedings of the 4th International Conference, EMO 2007, Matsushima, Japan, 5–8 March 2007; Proceedings 4; Springer: Berlin/Heidelberg, Germany, 2007; pp. 862–876. [Google Scholar] [CrossRef]
- Schott, J.R. Fault Tolerant Design Using Single and Multicriteria Genetic Algorithm Optimization; Air Force Institute of Technology: Dayton, OH, USA, 1995; Available online: https://hdl.handle.net/1721.1/11582 (accessed on 10 July 2023).
- Yoo, S.; Harman, M. Pareto efficient multi-objective test case selection. In Proceedings of the 2007 International Symposium on Software Testing and Analysis, London, UK, 9–12 July 2007; pp. 140–150. [Google Scholar] [CrossRef]
- Arcuri, A.; Briand, L. A practical guide for using statistical tests to assess randomized algorithms in software engineering. In Proceedings of the 33rd International Conference on Software Engineering, Honolulu, HI, USA, 21–28 May 2011; pp. 1–10. [Google Scholar] [CrossRef]
- Kader, M.A.; Zamli, K.Z.; Alkazemi, B.Y. An Experimental Study of a Fuzzy Adaptive Emperor Penguin Optimizer for Global Optimization Problem. IEEE Access 2022, 10, 116344–116374. [Google Scholar] [CrossRef]
- Odili, J.B.; Noraziah, A.; Alkazemi, B.; Zarina, M. Stochastic process and tutorial of the African buffalo optimization. Sci. Rep. 2022, 12, 17319. [Google Scholar] [CrossRef]
- Alsewari, A.A.; Zamli, K.Z.; Al-Kazemi, B. Generating t-way test suite in the presence of constraints. J. Eng. Technol. (JET) 2015, 6, 52–66. [Google Scholar]
- Zamli, K.Z.; Alsewari, A.R.; Al-Kazemi, B. Comparative benchmarking of constraints t-way test generation strategy based on late acceptance hill climbing algorithm. Int. J. Softw. Eng. Comput. Sci. (IJSECS) 2015, 1, 14–26. [Google Scholar] [CrossRef]
- Zamli, K.Z.; Mohd Hassin, M.H.; Al-Kazemi, B. tReductSA–Test Redundancy Reduction Strategy Based on Simulated Annealing. In Intelligent Software Methodologies, Tools and Techniques: Proceedings of the 13th International Conference, SoMeT 2014, Langkawi, Malaysia, 22–24 September 2014; Revised Selected Papers 13. Springer International Publishing: Berlin/Heidelberg, Germany, 2015; pp. 223–236. [Google Scholar] [CrossRef]
- Wazirali, R.; Alasmary, W.; Mahmoud, M.M.; Alhindi, A. An optimized steganography hiding capacity and imperceptibly using genetic algorithms. IEEE Access 2019, 7, 133496–133508. [Google Scholar] [CrossRef]
- Ahmad, A. Optimizing Training Data Selection for Decision Trees using Genetic Algorithms. Int. J. Comput. Sci. Netw. Secur. (IJCSNS) 2020, 20, 84. [Google Scholar]
- Sahu, K.; Srivastava, R.K. Needs and importance of reliability prediction: An industrial perspective. Inf. Sci. Lett. 2020, 9, 33–37. [Google Scholar]
- Sahu, K.; Srivastava, R.K. Predicting software bugs of newly and large datasets through a unified neuro-fuzzy approach: Reliability perspective. Adv. Math. Sci. J. 2021, 10, 543–555. [Google Scholar] [CrossRef]
- Sahu, K.; Srivastava, R.K. Soft computing approach for prediction of software reliability. Neural Netw. 2018, 17, 19. [Google Scholar]


| Feature Model | Features | Configurations | Number of Pairs |
|---|---|---|---|
| Counter Strike | 24 | 18,176 | 833 |
| SPL SimulES, PnP | 41 | 6912 | 2592 |
| Smart Homev2.2 | 60 | 3.87 × 10⁹ | 6189 |
| Video Player | 71 | 4.5 × 10¹³ | 7528 |
| Model Transformation | 88 | 1.65 × 10¹³ | 13,139 |
| Coche Ecologico | 94 | 2.32 × 10⁷ | 11,075 |
| Parameter | Values |
|---|---|
| Population Size | 200 |
| Number of Generations | 500 |
| Crossover Rate | 60% |
| Mutation Rate | 30% |
| Feature Models | Algorithms | |||||
|---|---|---|---|---|---|---|
| PFtrue | IBEA | MOEAD | NSGAII | NSGAIII | SPEA2 | |
| PFcontribution | ||||||
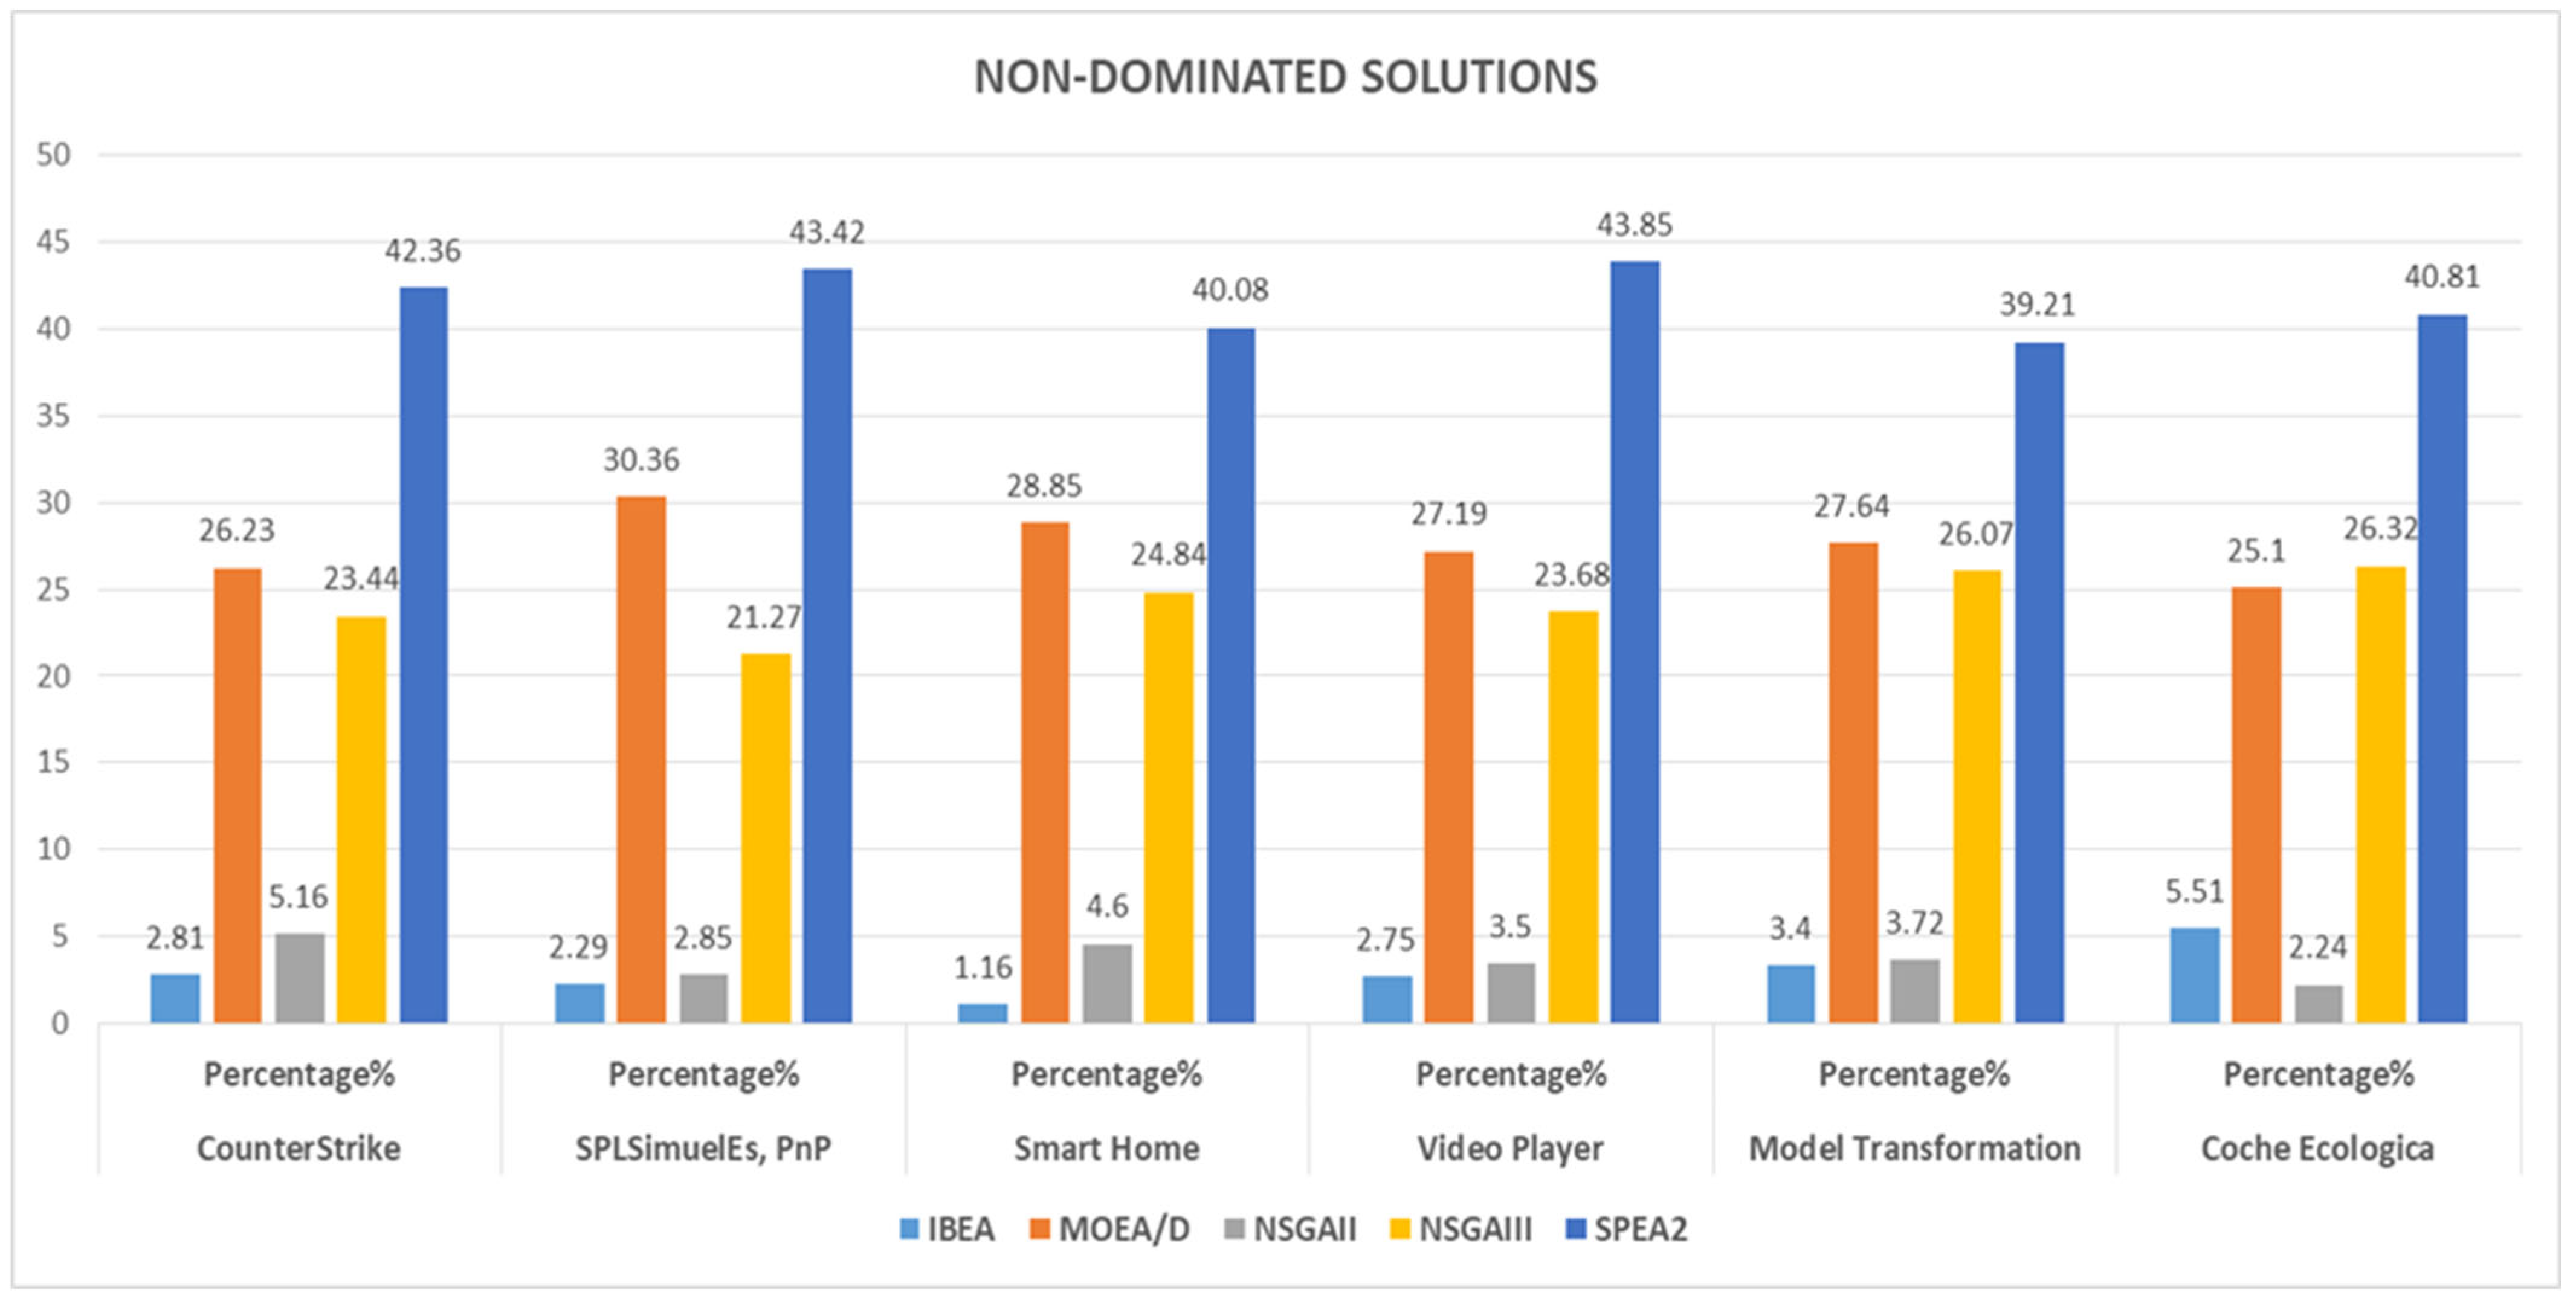
| Counter-Strike | 465 | 13 (2.81%) | 122 (26.23%) | 24 (5.16%) | 109 (23.44%) | 197 (42.36%) |
| SPL SimulES, PnP | 456 | 10 (2.19%) | 138 (30.26%) | 13 (2.85%) | 97 (21.27%) | 198 (43.42%) |
| Smart Home v2.2 | 499 | 8 (1.60%) | 144 (28.85%) | 23 (4.60%) | 124 (24.84%) | 200 (40.08%) |
| Video Player | 456 | 8(1.75%) | 124 (27.19%) | 16 (3.5%) | 108 (23.68%) | 200 (43.85%) |
| Model Transformation | 510 | 17 (3.4%) | 141 (27.64%) | 19 (3.72%) | 133 (26.07%) | 200 (39.21%) |
| Coche Ecologico | 490 | 27 (5.51%) | 123 (25.10%) | 11 (2.24%) | 129 (26.32%) | 200 (40.81%) |
| Indicator | Feature Models | IBEA | MOEAD | NSGAII | NSGAIII | SPEA2 | |||||
|---|---|---|---|---|---|---|---|---|---|---|---|
| Average | St. D | Average | St. D | Average | St. D | Average | St. D | Average | St. D | ||
| HV | Counter Strike | 0.2826 | 0.1162 | 0.7094 | 0.0129 | 0.6029 | 0.0234 | 0.6498 | 0.0113 | 0.7022 | 0.0165 |
| SPL SimulES, PnP | 0.2698 | 0.0954 | 0.6524 | 0.0150 | 0.4659 | 0.0314 | 0.5413 | 0.0176 | 0.6390 | 0.0155 | |
| Smart Home v2.2 | 0.3460 | 0.1105 | 0.6885 | 0.0160 | 0.5742 | 0.0353 | 0.6052 | 0.0300 | 0.6843 | 0.0198 | |
| Video Player | .0.3659 | 0.0969 | 0.6961 | 0.0155 | 0.5795 | 0.0108 | 0.6085 | 0.0262 | 0.6864 | 0.0193 | |
| Model Transformation | 0.3600 | 0.0771 | 0.6009 | 0.0146 | 0.4677 | 0.0256 | 0.5276 | 0.0210 | 0.6136 | 0.0210 | |
| Coche Ecologico | 0.3257 | 0.0802 | 0.4868 | 0.0048 | 0.3227 | 0.0107 | 0.4541 | 0.0329 | 0.5025 | 0.0013 | |
| Spacing | Counter Strike | 0.1138 | 0.0543 | 0.0329 | 0.0033 | 0.0496 | 0.0115 | 0.0316 | 0.0026 | 0.0157 | 0.0017 |
| SPL SimulES, PnP | 0.0713 | 0.0364 | 0.0208 | 0.0019 | 0.0521 | 0.0121 | 0.0295 | 0.0026 | 0.0113 | 0.0011 | |
| Smart Home v2.2 | 0.0753 | 0.0330 | 0.0302 | 0.0024 | 0.0474 | 0.0102 | 0.0342 | 0.0037 | 0.0126 | 0.0086 | |
| Video Player | 0.0855 | 0.0430 | 0.0296 | 0.0028 | 0.0502 | 0.0108 | 0.0328 | 0.0046 | 0.0127 | 0.0015 | |
| Model Transformation | 0.0527 | 0.0112 | 0.0262 | 0.0021 | 0.0412 | 0.0081 | 0.0292 | 0.0024 | 0.0102 | 0.0008 | |
| Coche Ecologico | 0.0417 | 0.0173 | 0.0217 | 0.0016 | 0.0720 | 0.0218 | 0.0179 | 0.0030 | 0.0095 | 0.0013 | |
| Feature Models | Algorithms | ||||
|---|---|---|---|---|---|
| IBEA | MOEAD | NSGAII | NSGAIII | SPEA2 | |
| Counter Strike | O1 (1, 0.010, 0.086, 0.291) O2 (1, 0.010, 0.086, 0.291) O3 (1, 0.010, 0.086, 0.291) O4 (0.274, 0.030, 0.365, 1) | O1 (1, 0.010, 0.623, 0.666) O2 (1, 0.010, 0.623, 0.666) O3 (1, 0.010, 0.107, 0.291) O4 (0.271, 0.071, 0.136, 1) | O1 (1, 0.010, 0.666, 0.75) O2 (1, 0.010, 0.666, 0.75) O3 (1, 0.010, 0.107, 0.291) O4 (0.228, 0.051, 0.276, 1) | O1 (1, 0.010, 0.537, 0.666) O2 (1, 0.010, 0.537, 0.666) O3 (1, 0.010, 0.0107, 0.291) O4 (0.238, 0.051, 0.219, 1) | O1 (1, 0.010, 0.709, 0.791) O2 (1, 0.010, 0.709, 0.791) O3 (1, 0.010, 0.0107, 0.291) O4 (0.260, 0.051, 0.198, 1) |
| SPL SimulES, PnP | O1 (1, 0.010, 0.358, 0.593) O2 (1, 0.010, 0.358, 0.593) O3 (1, 0.010, 0.305, 0.05) O4 (0.625, 0.030, 0.419, 1) | O1 (1, 0.010, 0.312, 0.468) O2 (1, 0.010, 0.312, 0.468) O3 (1, 0.010, 0.229, 0.50) O4 (0.638, 0.122, 0.279, 1) | O1 (1, 0.010, 0.343, 0.562) O2 (1, 0.010, 0.343, 0.562) O3 (1, 0.010, 0.236, 0.50) O4 (0.654, 0.030, 0.358, 1) | O1 (1, 0.010, 0.458, 0.625) O2 (1, 0.010, 0.458, 0.625) O3 (1, 0.010, 0.244, 0.468) O4 (0.669, 0.408, 0.328, 1) | O1 (1, 0.010, 0.664, 0.656) O2 (1, 0.010, 0.664, 0.656) O3 (1, 0.010, 0.236, 0.50) O4 (0.647, 0.071, 0.312, 1) |
| Smart Home v2.2 | O1 (1, 0.010, 0.419, 0.045) O2 (1, 0.010, 0.419, 0.045) O3 (1, 0.010, 0.257, 0.366) O4 (0.264, 0.306, 0.395, 1) | O1 (1, 0.010, 0.389, 0.483) O2 (1, 0.010, 0.389, 0.483) O3 (1, 0.010, 0.069, 0.20) O4 (0.161, 0.061, 0.354, 1) | O1 (1, 0.010, 0.551, 0.583) O2 (1, 0.010, 0.551, 0.583) O3 (1, 0.010, 0.077, 0.216) O4 (0.178, 0.071, 0.302, 1) | O1 (1, 0.010, 0.507, 0.583) O2 (1, 0.010, 0.507, 0.583) O3 (1, 0.010, 0.036, 0.133) O4 (0.190, 0.071, 0.334, 1) | O1 (1, 0.010, 0.441, 0.466) O2 (1, 0.010, 0.441, 0.466) O3 (1, 0.010, 0.106, 0.216) O4 (0.239, 0.071, 0.248, 1) |
| Video Player | O1 (1, 0.010, 0.437, 0.605) O2 (1, 0.010, 0.437, 0.605) O3 (1, 0.010, 0.234, 0.450) O4 (0.128, 0.061, 0.412, 1) | O1 (1, 0.010, 0.427, 0.619) O2 (1, 0.010, 0.427, 0.619) O3 (1, 0.010, 0.128, 0.352) O4 (0.174, 0.051, 0.323, 1) | O1 (1, 0.010, 0.558, 0.690) O2 (1, 0.010, 0.558, 0.690) O3 (0.801, 0, 0.156, 0.521) O4 (0.206, 0.040, 0.330, 1) | O1 (1, 0.010, 0.540, 0.633) O2 (1, 0.010, 0.540, 0.633) O3 (0.772, 0.010, 0.161, 0.535) O4 (0.279, 0.036, 0.335, 1) | O1 (1, 0.010, 0.601, 0.676) O2 (1, 0.010, 0.601, 0.676) O3 (1, 0.010, 0.163, 0.380) O4 (0.214, 0.040, 0.301, 1) |
| Model Transformation | O1 (1, 0.010, 0.534, 0.579) O2 (1, 0.010, 0.534, 0.579) O3 (1, 0.010, 0.193, 0.363) O4 (0.211, 0.051, 0.393, 1) | O1 (1, 0.010, 0.327, 0.454) O2 (1, 0.010, 0.327, 0.454) O3 (1, 0.010, 0.161, 0.318) O4 (0.021, 0.256, 0.404, 1) | O1 (1, 0.010, 0.415, 0.50) O2 (1, 0.010, 0.415, 0.50) O3 (1, 0.010, 0.170, 0.340) O4 (0.165, 0.071, 0.371, 1) | O1 (1, 0.010, 0.372, 0.477) O2 (1, 0.010, 0.372, 0.477) O3 (1, 0.010, 0.170, 0.284) O4 (0.224, 0.051, 0.342, 1) | O1 (1, 0.010, 0.461, 0.534) O2 (1, 0.010, 0.461, 0.534) O3 (1, 0.010, 0.179, 0.284) O4 (0.158, 0.081, 0.319, 1) |
| Coche Ecologico | O1 (1, 0.010, 0.251, 0.563) O2 (1, 0.010, 0.251, 0.563) O3 (1, 0.010, 0.202, 0.563) O4 (0.143, 0.112, 0.268, 1) | O1 (1, 0.010, 0.398, 0.659) O2 (1, 0.010, 0.398, 0.659) O3 (1, 0.010, 0.156, 0.510) O4 (0.180, 0.816, 0.251, 1) | O1 (1, 0.010, 0.310, 0.574) O2 (1, 0.010, 0.310, 0.574) O3 (1, 0.010, 0.156, 0.521) O4 (0.094, 0.173, 0.275, 1) | O1 (1, 0.010, 0.310, 0.574) O2 (1, 0.010, 0.310, 0.574) O3 (1, 0.010, 0.156, 0.521) O4 (0.094, 0.173, 0.275, 1) | O1 (1, 0.010, 0.316, 0.617) O2 (1, 0.010, 0.316, 0.617) O3 (1, 0.010, 0.156, 0.50) O4 (0.149, 0.102, 0.255, 1) |
| Feature Models | Quality Indicators | |
|---|---|---|
| Hyper Volume | Spacing | |
| Counter Strike | MOEA/D, SPEA2, NSGAIII | MOEA/D, SPEA2, NSGAIII |
| SPL SimulES, PnP | MOEA/D, SPEA2 | MOEA/D, SPEA2, NSGAIII |
| Smart Home v2.2 | MOEA/D, SPEA2, NSGAIII | MOEA/D, SPEA2, NSGAIII |
| Video Player | MOEA/D, SPEA2, NSGAIII | MOEA/D, SPEA2 |
| Model Transformation | MOEA/D, SPEA2, NSGAIII | MOEA/D, SPEA2, NSGAIII |
| Coche Ecologico | MOEA/D, SPEA2, NSGAIII | SPEA2, NSGAIII, |
Disclaimer/Publisher’s Note: The statements, opinions and data contained in all publications are solely those of the individual author(s) and contributor(s) and not of MDPI and/or the editor(s). MDPI and/or the editor(s) disclaim responsibility for any injury to people or property resulting from any ideas, methods, instructions or products referred to in the content. |
© 2023 by the authors. Licensee MDPI, Basel, Switzerland. This article is an open access article distributed under the terms and conditions of the Creative Commons Attribution (CC BY) license (https://creativecommons.org/licenses/by/4.0/).
Share and Cite
Jamil, M.A.; Nour, M.K.; Alotaibi, S.S.; Hussain, M.J.; Hussaini, S.M.; Naseer, A. Software Product Line Maintenance Using Multi-Objective Optimization Techniques. Appl. Sci. 2023, 13, 9010. https://doi.org/10.3390/app13159010
Jamil MA, Nour MK, Alotaibi SS, Hussain MJ, Hussaini SM, Naseer A. Software Product Line Maintenance Using Multi-Objective Optimization Techniques. Applied Sciences. 2023; 13(15):9010. https://doi.org/10.3390/app13159010
Chicago/Turabian StyleJamil, Muhammad Abid, Mohamed K. Nour, Saud S. Alotaibi, Mohammad Jabed Hussain, Syed Mutiullah Hussaini, and Atif Naseer. 2023. "Software Product Line Maintenance Using Multi-Objective Optimization Techniques" Applied Sciences 13, no. 15: 9010. https://doi.org/10.3390/app13159010