Article

Infrared Spectroscopy for the Analysis of Bioactive Analytes in Wheat: A Proof-of-Concept Study

1
School of Health, Medical and Applied Sciences, Central Queensland University, Rockhampton, QLD 4701, Australia
2
Centre for Nutrition and Food Sciences, Queensland Alliance for Agriculture and Food Innovation (QAAFI), The University of Queensland, Brisbane, QLD 4072, Australia
*
Author to whom correspondence should be addressed.
Appl. Sci. 2023, 13(15), 8989; https://doi.org/10.3390/app13158989
Submission received: 1 June 2023 / Revised: 15 July 2023 / Accepted: 2 August 2023 / Published: 5 August 2023
(This article belongs to the Special Issue Bioactive Compounds: From Extraction to Application)

Abstract

:
This study compared the performance of near-infrared spectroscopy (NIRS) and mid-infrared spectroscopy (MIRS) for the prediction of moisture, protein, total phenolic content (TPC), ferric reducing antioxidant potential (FRAP) and total monomeric anthocyanin (TMA) content in 65 samples of Australian wheat flour. Models were constructed on 50 of the wheat samples, with the 15 remaining samples used as a dependent test set. NIRS showed excellent results for the prediction of protein content (R2test = 0.991; RMSEP = 0.22% w/v) and acceptable to good results for TPC (R2test = 0.83; RMSEP = 3.9 mg GAE/100 g), FRAP (R2test = 0.92; RMSEP = 5.4 mg TE/100 g) and moisture content (R2test = 0.76, RMSEP = 0.62% w/v). Similarly, MIRS showed the best results for protein prediction (R2test = 0.93, RMSEP = 0.62% w/v) and acceptable results for moisture content (R2test = 0.83, RMSEP = 0.65% w/v), FRAP (R2test = 0.83, RMSEP = 7.0 mg TE/100 g) and TPC (R2test = 0.73, RMSEP = 5.6 mg GAE/100 g). However, the TMA content could not be predicted. Finally, moving window analysis was conducted to determine the optimum wavelength ranges for predicting selected analytes. On average, this improved RMSECV values by an average of 18–20% compared to the corresponding full wavelength models, when using the same component selection method. The results confirm that infrared spectroscopy may be useful for the real-time quantitation and/or screening of key quality parameters in wheat, such as protein, TPC and antioxidant capacity.

1. Introduction

Common or bread wheat (Triticum aestivum L.) is the second-most frequently grown grain crop worldwide (after corn), with over 760 million tonnes harvested in 2020 [1]. It is a vital crop for ensuring global food security, supplying approximately 20% of dietary calorie requirements across the globe [2]. Furthermore, wheat is the largest broadacre crop in Australia, with 14 million tonnes produced in the 2019–2020 season [3].
Although the health benefits of wheat are generally considered to be lower than those of pulse crops [4,5], it does contain several potentially health-benefitting compound classes, including polyphenols, carotenoids, vitamin E and phytosterols [6,7]. Although these compounds are most abundant in wholegrain products [6], they are also found in refined wheat products, albeit at lower levels [8]. The major polyphenol compounds previously identified from wheat include gallic acid, 4-hydroxybenzoic acid, vanillic acid protocatechuic acid, syringic acid, ferulic acid, caffeic acid, chlorogenic acid, sinapic acid, p-coumaric acid, cinnamic acid, rutin, quercetin, kaempferol, vitexin, isovitexin and resveratrol [9,10]. There is also increasing interest in developing wheat lines with elevated phenolic acid contents [11,12].
As with other grain crops, infrared (IR) spectroscopy has been widely applied for the quality assessment of wheat and wheat flour, including the prediction of protein [13], fibre [14], starch [15] and other quality parameters important for bread-making [16]. Infrared spectroscopy is an analytical technique that uses the characteristic absorption of infrared light by dipole-active covalent bonds to infer the chemical composition of a sample. In brief, the full spectrum of IR light is shone onto the sample, where certain bonds will absorb the IR light at characteristic wavelengths (depending on the bond’s constituent atoms, and to a lesser degree the surrounding atoms). By measuring the IR light that is not absorbed (either from reflectance or transmittance measurements), the chemical bonds found in the sample can be predicted, along with their relative concentrations. More detail on the principles behind IR spectroscopy can be found in several recent reviews [17,18,19].
Near-infrared spectroscopy (NIRS) is most commonly used for food analysis, and uses wavelengths in the near-infrared (750–2500 nm) region. It has the benefit of increased IR penetration into the sample, which provides results that are more representative of the true sample composition. However, the absorption is generally less specific, making it more difficult to detect trace constituents.
The other type of infrared spectroscopy that is applied to food products is mid-infrared spectroscopy (MIRS), which uses wavelengths between 4000 and 400 cm−1. It provides increased specificity for the chemical bond type, but decreased sample penetration. Consequently, more MIR instruments require firm contact between the instrument and the sample to be analysed, e.g., using an attenuated total reflectance (ATR) platform.
For analytes found in sufficiently high concentrations, IR spectroscopy can provide rapid, non-destructive and environmentally friendly method of compositional analysis. However, its accuracy will almost always be less than that found using traditional analytical techniques. One major benefit of using infrared spectroscopy for compositional analysis is that multiple analytes (e.g., protein, moisture, starch content, etc.) can be simultaneously predicted from a single infrared spectrum. This provides further time savings over ‘wet’ chemical analysis, which is often a ‘serial’ process using multiple analytical instruments.
Recent work has reported the prediction of micro-nutrients (such as phenolics or antioxidant compounds) in several grain crops, including rice [20], gluten-free grains [21] and mungbean. However, predicting the levels of micro-nutrients (such as phenolics or antioxidant compounds) is considered to be more challenging in wheat, as it generally has much lower phenolic and antioxidant concentrations compared to other grain crops such as pulses (e.g., faba beans, mungbeans, chickpeas, and lentils) [22].
One recent study by Tian et al. [23] investigated the use of NIRS for the prediction of TPC in whole wheat flour, reporting a high level of linearity (R2val = 0.90) and precision (RMSEV = 7.1 mg GAE/100 g) on a dependent test set. However, the authors did not consider the prediction of antioxidant capacity in this study. Additionally, there are few studies investigating the use of MIRS for the quality assessment of wheat.
Consequently, this work investigated and evaluated the performance of NIRS and MIRS for the prediction of phenolic content, anthocyanin content and antioxidant capacity in Australian-grown wheat.

2. Materials and Methods

Wheat samples (n = 65) were sourced from the Australian Export Grains Innovation Centre (AEGIC). In order to provide maximum variability in their anticipated bioactive contents, these comprised samples sourced from a range of different wheat qualities and production areas (n = 17 samples), as well as samples from a pearling trial (n = 48 samples from 3 wheat grades). The latter group of samples had varying levels of bran remaining on the kernel after the different pearling times, and thus would be expected to contain significantly different phenolic and antioxidant contents. As commercial Australian wheat samples are sold by grade rather than variety, each sample likely comprised batches of wheat from a range of different varieties, rather than being from one pure wheat variety. Consequently, analysis by wheat variety was not performed here.
The samples were impact milled to produce whole seed flour (Falling No. grinder, 0.8 mm screen). Moisture content was determined by the American Association of Cereal Chemists (AACC) International Method 44–15.02; briefly, this involved drying the samples in a laboratory oven at 130 °C for 1 h. All subsequent results are expressed on a dry weight basis. Protein content was determined by combustion using a LECO TruMac N protein analyser (LECO, Saint Joseph, MI, USA) with a conversion factor of ×6.25 [24].
Ferric reducing antioxidant potential (FRAP), total phenolic content (TPC) and total monomeric anthocyanin (TMA) content were determined following previously described methods [22,25]. Antioxidant compounds were first extracted by combining 0.5 g of sample (in duplicate) with 7 mL of 90% methanol, followed by end-over-end shaking at 50 rpm for 60 min. After centrifugation and collecting the supernatant, the pellet was re-extracted using another 7 mL of 90% methanol and end-over-end shaking for 20 min. The combined supernatants were made up to 15 mL volume. The FRAP was measured by combining 100 µL of methanol extract with 3 mL of FRAP reagent (comprising 300 mM acetate buffer at pH 3.56, 20 mM aqueous ferric chloride and 10 mM TPTZ (made in 40 mM HCl) in the ratio 10:1:1). After vortexing (10 s) and incubation at 37 °C for 4 min, the absorbance was measured at 593 nm. Results are expressed in Trolox equivalents (TE). The TPC was determined by combining 400 µL of methanol extract with 2 mL of Folin–Ciocalteu reagent (previously diluted 10× in Milli-Q water), incubating in darkness at room temperature for 10 min, then adding 2 mL of 7.5% w/v aqueous sodium carbonate. After a further incubation in a covered waterbath for 30 min at 40 °C, the absorbance was measured at 760 nm. The results are expressed as gallic acid equivalents (GAE). Finally, the TMA content was measured by combining 400 µL of the methanol extract with 1.6 mL of pH 1 buffer (comprising 0.025 M aqueous KCl and adjusted to pH 1 with HCl). In a separate vessel, 400 µL of the same methanol extract was combined with 1.6 mL of pH 4.5 buffer (comprising 00.4 M aqueous sodium acetate and adjusted to pH 4.5 with HCl). After incubation in darkness at room temperature for 15 min, the absorbance was measured at 510 and 700 nm, with the anthocyanin content calculated using the formula below. Results are expressed in equivalents of cyanidin-3-glucoside (cyd-3-glu).
Anthocyanin content (mg cyd-3-glu L−1) = (A × 449.38 × DF × 1000)/(26,900 × 1)
where DF = dilution factor (i.e., 5 for this study), and A = (pH1: Absorbance510 nm − Absorbance700 nm) − (pH4.5: Absorbance510 nm − Absorbance700 nm)
Mid-infrared spectra were collected using from the wheat flour using a Bruker Alpha FTIR (Fourier transformed infrared) spectrophotometer (Bruker Optics Gmbh, Ettlingen, Germany) operating between 4000 and 400 cm−1 [22]. Five spectra were collected from each sample, with the mean of these replicate scans used in subsequent analysis.
Near-infrared spectra were collected using a Thermo Scientific Antaris II FT-NIR Analyzer operating in reflectance mode, using an integrating sphere with a rotating sample cup (30 mm diameter). The spectra were measured between 1000 and 2500 nm (10,000 and 4000 cm−1), as the mean of 32 scans (8 cm−1 resolution). Spectra were collected from each flour sample in triplicate, repacking the cup with fresh sample each time.
Partial least squares regression (PLSR) analysis of the spectra was conducted in R Studio running R 4.0.5 [26], using the spectrolab and prospectr packages. Spectra were pre-processed using combinations of the standard normal variate (SNV) and the 1st or 2nd derivative, using the Savitzky-Golay algorithm with varying numbers of smoothing points [27]. In order to determine the optimum pre-processing method and number of components to use, the model performance of the calibration set was evaluated through full cross-validation (leave-one-out (LOO) method).
To create the calibration set, 50 of the samples (~75% of the total) were selected from the dataset using the Kennard–Stone algorithm, using the Mahalanobis distance across the first two 2 principal components. The remaining 15 samples (~25%) were used as a dependent test set to assess the performance of the optimised models. No outliers were removed from the dataset. The full range of wavelengths was used in the PLS regressions.
Finally, a moving window analysis was performed on the best-performing NIRS and MIRS models, following the method described in Johnson et al. [28]. In short, individual PLSR models were created for each possible wavelength range at 10 nm or 10 cm−1 intervals. For example, for NIRS models, PLSR models were created between 1000 and 1010, 1000 and 1020… 1000 and 2500, 1010 and 1020, 1010 and 1030… 1010–2500 nm, and so forth. The R2 and RMSECV values from the moving window PLSR models were then compared to determine the optimum wavelength. This process provides further insight into the key wavelengths required for the accurate prediction of each analyte.

3. Results

3.1. Descriptive Statistics

The descriptive statistics for the calibration and test sets are provided in Table 1. The range, mean and standard deviation were comparable between the calibration and test sets for most analytes, indicating that the Kennard–Stone algorithm did an adequate job of partitioning the spectra between these groups. The moisture and protein content showed a reasonably high degree of variation between samples, with a moderate amount of variation also found in the FRAP content. However, the variation in the total phenolic (TP) content was much lower, suggesting that it would be more difficult to create an accurate model for this analyte.

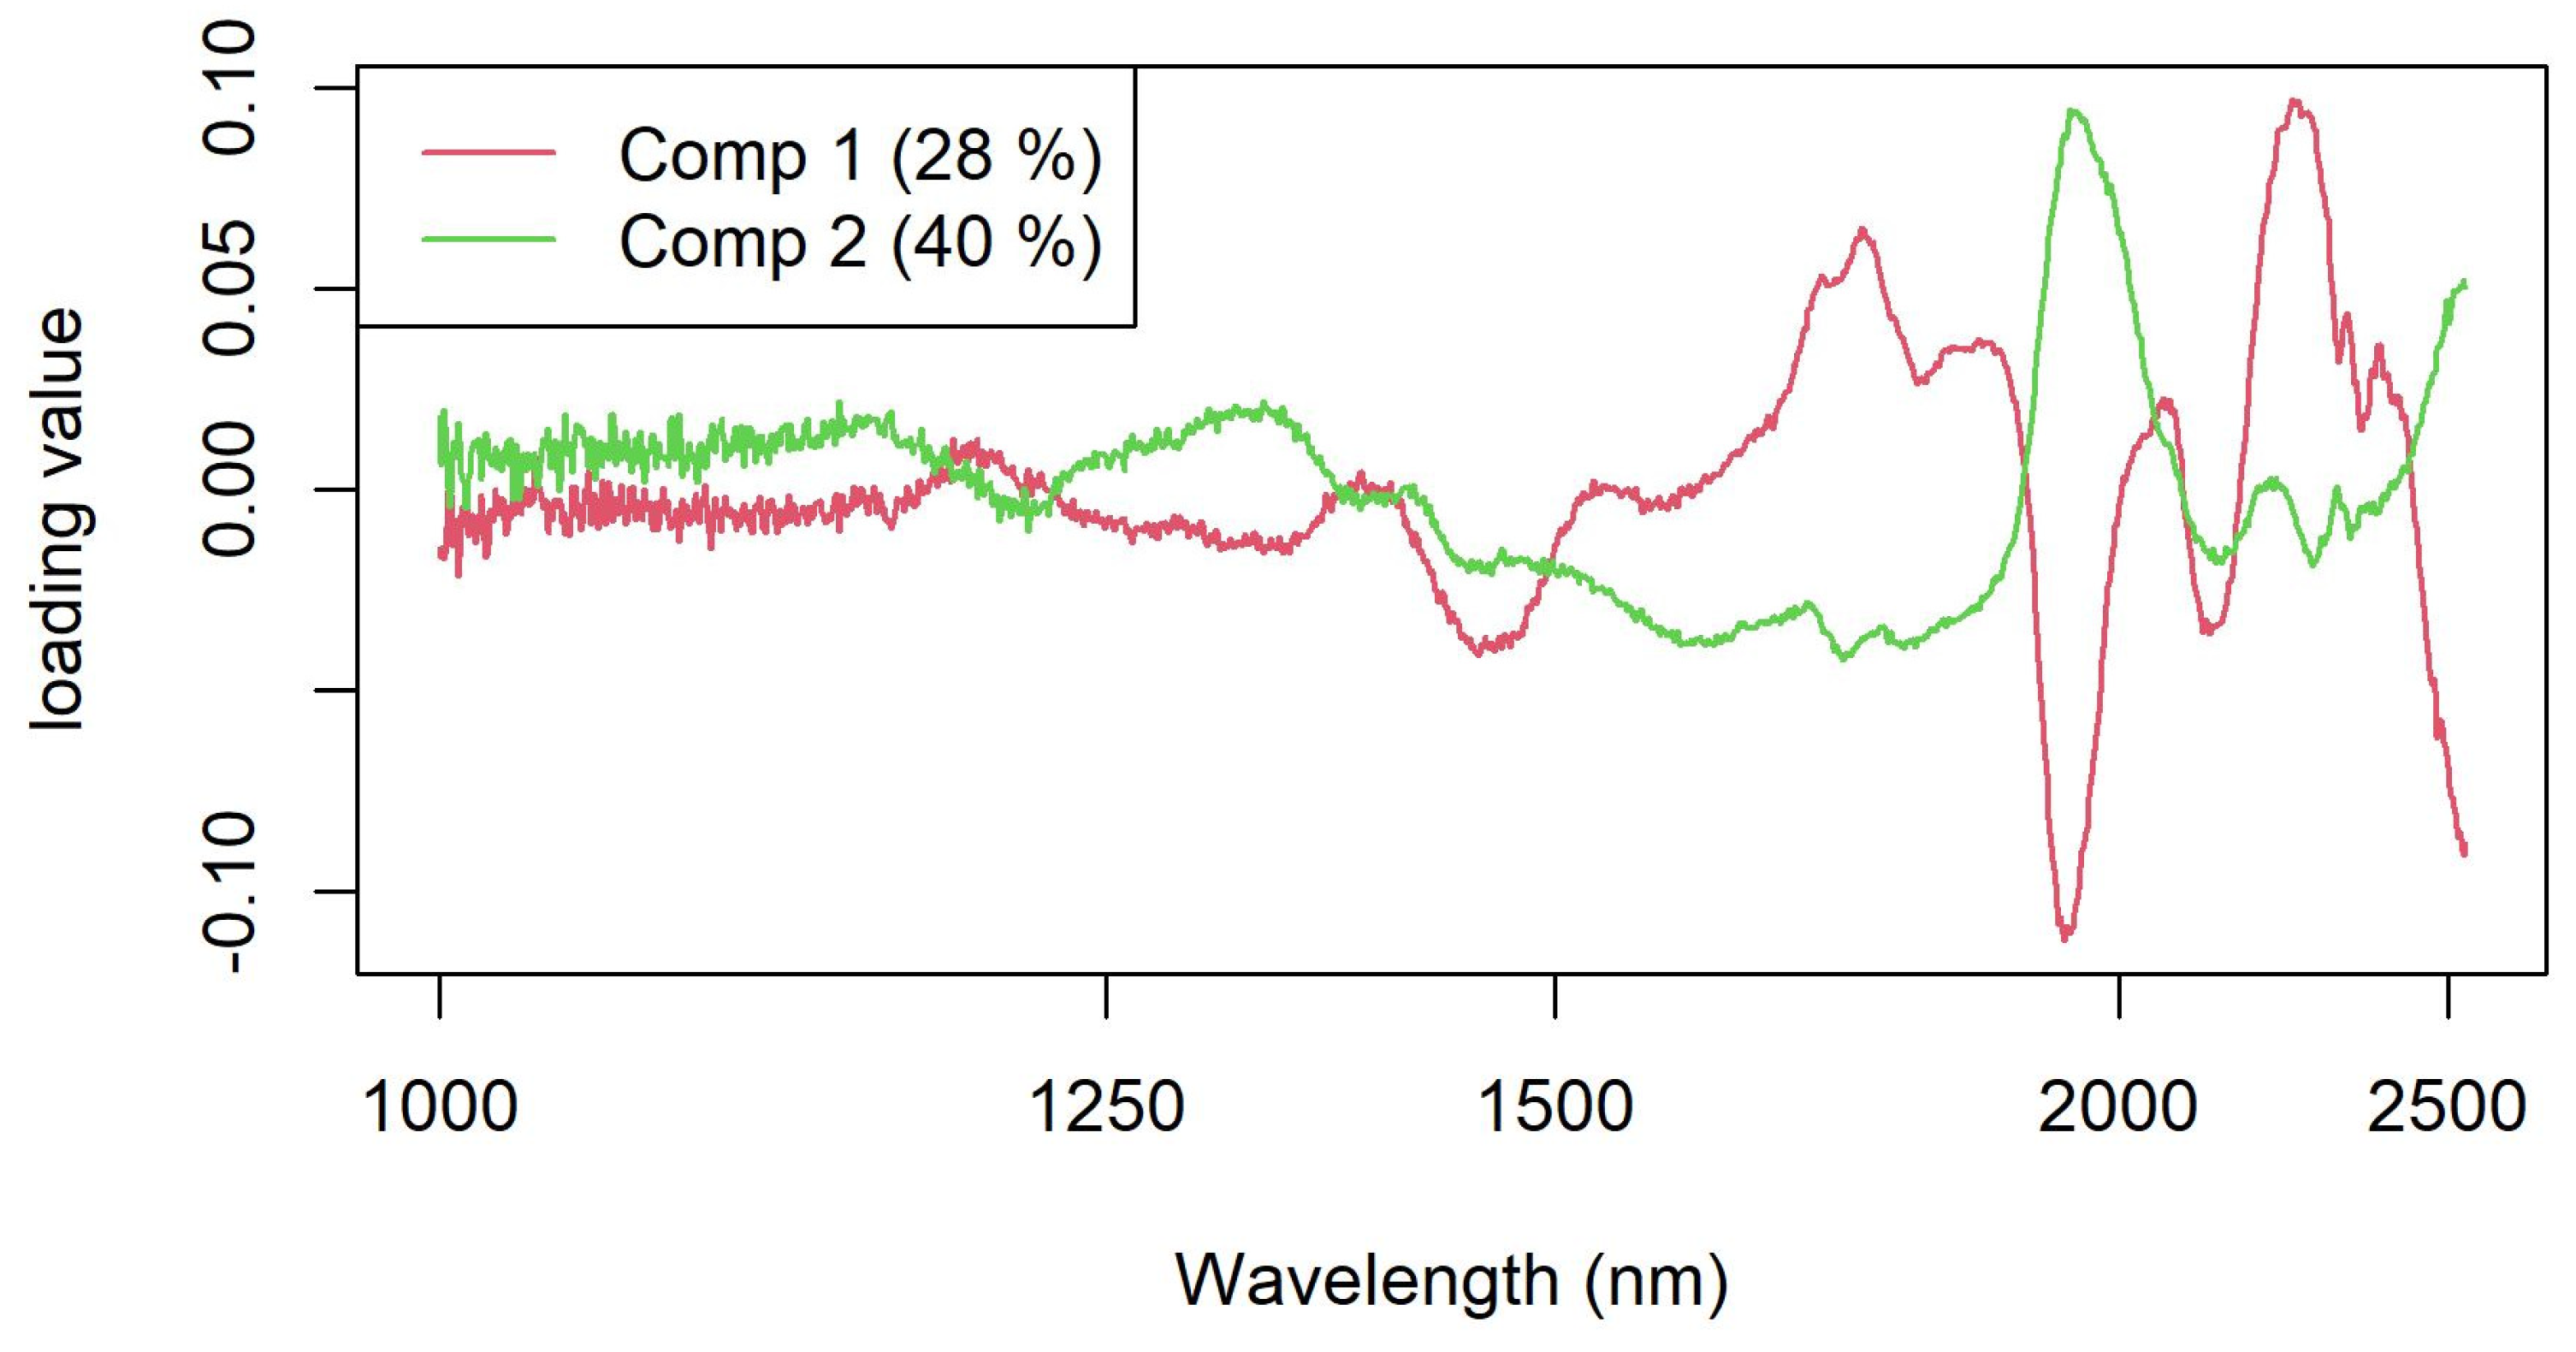
3.2. Near-Infrared Spectra

Figure 1 shows the mean raw and SNV-processed NIR spectra of all 65 wheat flour samples. The NIR spectra showed major peaks at 1467 nm and 1934 nm, corresponding to the second and first overtones of the OH bond (from moisture in the sample or other R-OH bonds), respectively [29]. Other smaller peaks included 1205 nm (CH second overtone from lipids and structural carbohydrates), 2107 nm (amide bond from protein), broad peaks between 1680–1850 nm (CH first overtone stretch) and 2260–2370 nm (CH stretching deformation of CH2 and CH3 bonds), and shoulders at 1360 nm (second overtone of CH3 or ArOH) and 1580 nm (tentatively assigned to CH3/ArCH first overtone from starch) [30,31].
The PLSR models with the optimised spectral pre-processing methods for each analyte are detailed in Table 2. The best-performing model was that for protein content (Figure 2), which showed an R2test of 0.991 and RMSEP of 0.22%. Furthermore, the model showed minimal bias and the slope and intercept were extremely close to their ideal values of 1 and 0, respectively (Table 2). Examination of the loadings plot for the protein prediction model (Figure 3) showed predominant contributions in the N-H asymmetric stretch and amide II region (1928–1941 nm), as anticipated [32]. Other minor contributions were at 2226 nm (potentially corresponding to the amide I and III region) and 1732 nm (which may be due to CH first overtones in gluten, the major protein found in wheat) [32].
The model for moisture content performed acceptably, with acceptable linearity, very low bias, and a slope close to 1. However, the ratio of performance to deviation (RPD) was considerably lower than that for protein, indicating relatively higher error associated with the moisture model. This was also evidenced in the higher RMSEP for the prediction of moisture in the samples from the test set. Most likely, this is due to small changes in the moisture content of the wheat samples between when the moisture analysis was conducted, and when the samples were subjected to NIR and MIR analysis. The predominant loading for the moisture content model was at 1900, corresponding to the first overtone of the OH bond [29], with more minor contributions at 1949 and 2156 nm.
In contrast to the results for protein and moisture, the model for TMA content showed no predictive power, likely due to the very low concentrations of this analyte.
The NIRS model for FRAP content also performed well, although it should be cautioned that there were no samples with intermediate FRAP values (Figure 4). For example, in the test set, only one sample had a high FRAP value, which was underpredicted by the model. When the outlier point was removed, the R2test fell significantly to 0.46, although the RMSEP improved to 2.9 mg TE/100 g. Nevertheless, most of the other sample points fell very close to the regression line (Figure 4B). The main loadings for the FRAP model (Figure 5) showed a negative peak at 1934 nm (the N-H asymmetric stretch and amide II region) and a positive peak at 2102 nm (potentially resulting from the combination bands of ROH groups). Thus, it appears that the antioxidant capacities of the samples were negatively correlated with their protein contents and positively associated with their levels of phenolic compounds (containing ROH groups).
The TP content of the samples was more evenly distributed compared to the FRAP (for both the calibration and test sets), containing samples of a range of TP contents throughout the calibration range (Figure 6). Although the linearity was lower compared to the FRAP model (R2test = 0.73), the RMSEP was better, at just 3.9 mg GAE/100 g. This was evidenced in that most of the test set samples were very close to their true values across the entire calibration range (Figure 6B). The loadings plot for the TP model (Figure 7) appeared visually different to the FRAP model due to the use of the first derivative of the spectra in the former. However, the main influential wavelengths were quite similar, being centred at approximately 1930 nm and 2110 nm. Again, these are likely to correspond to amide and R-OH bonds.

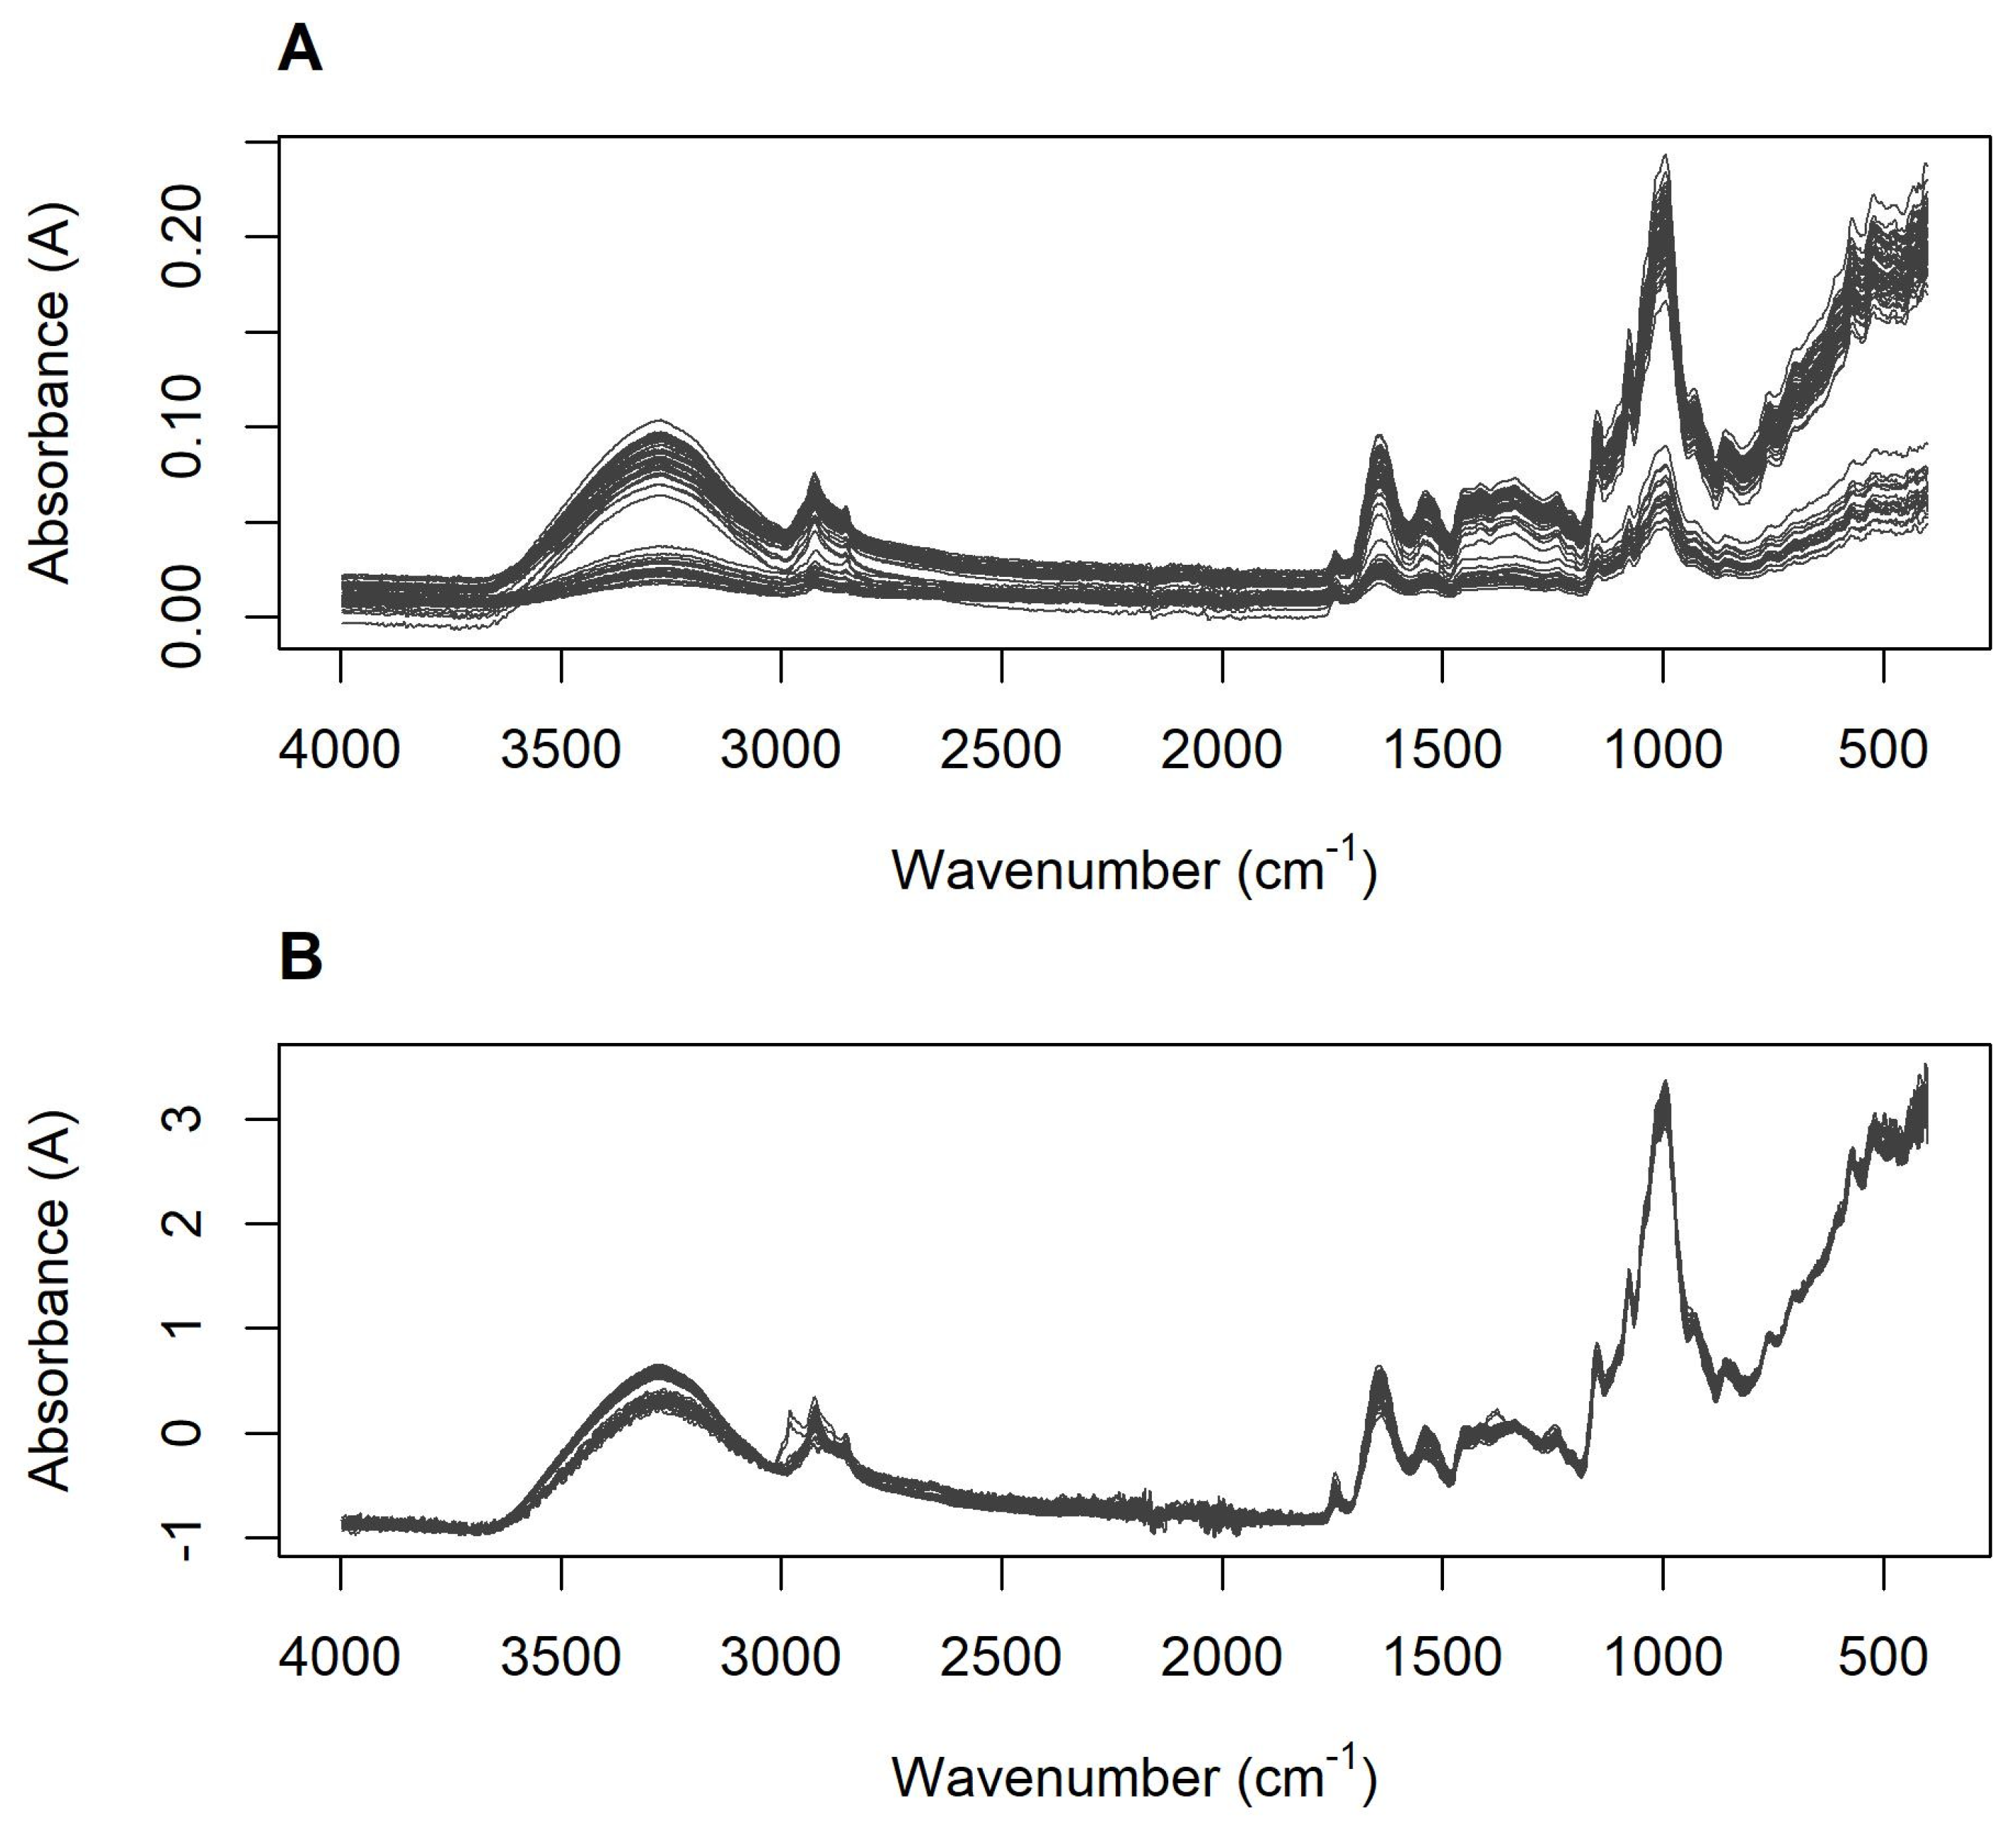
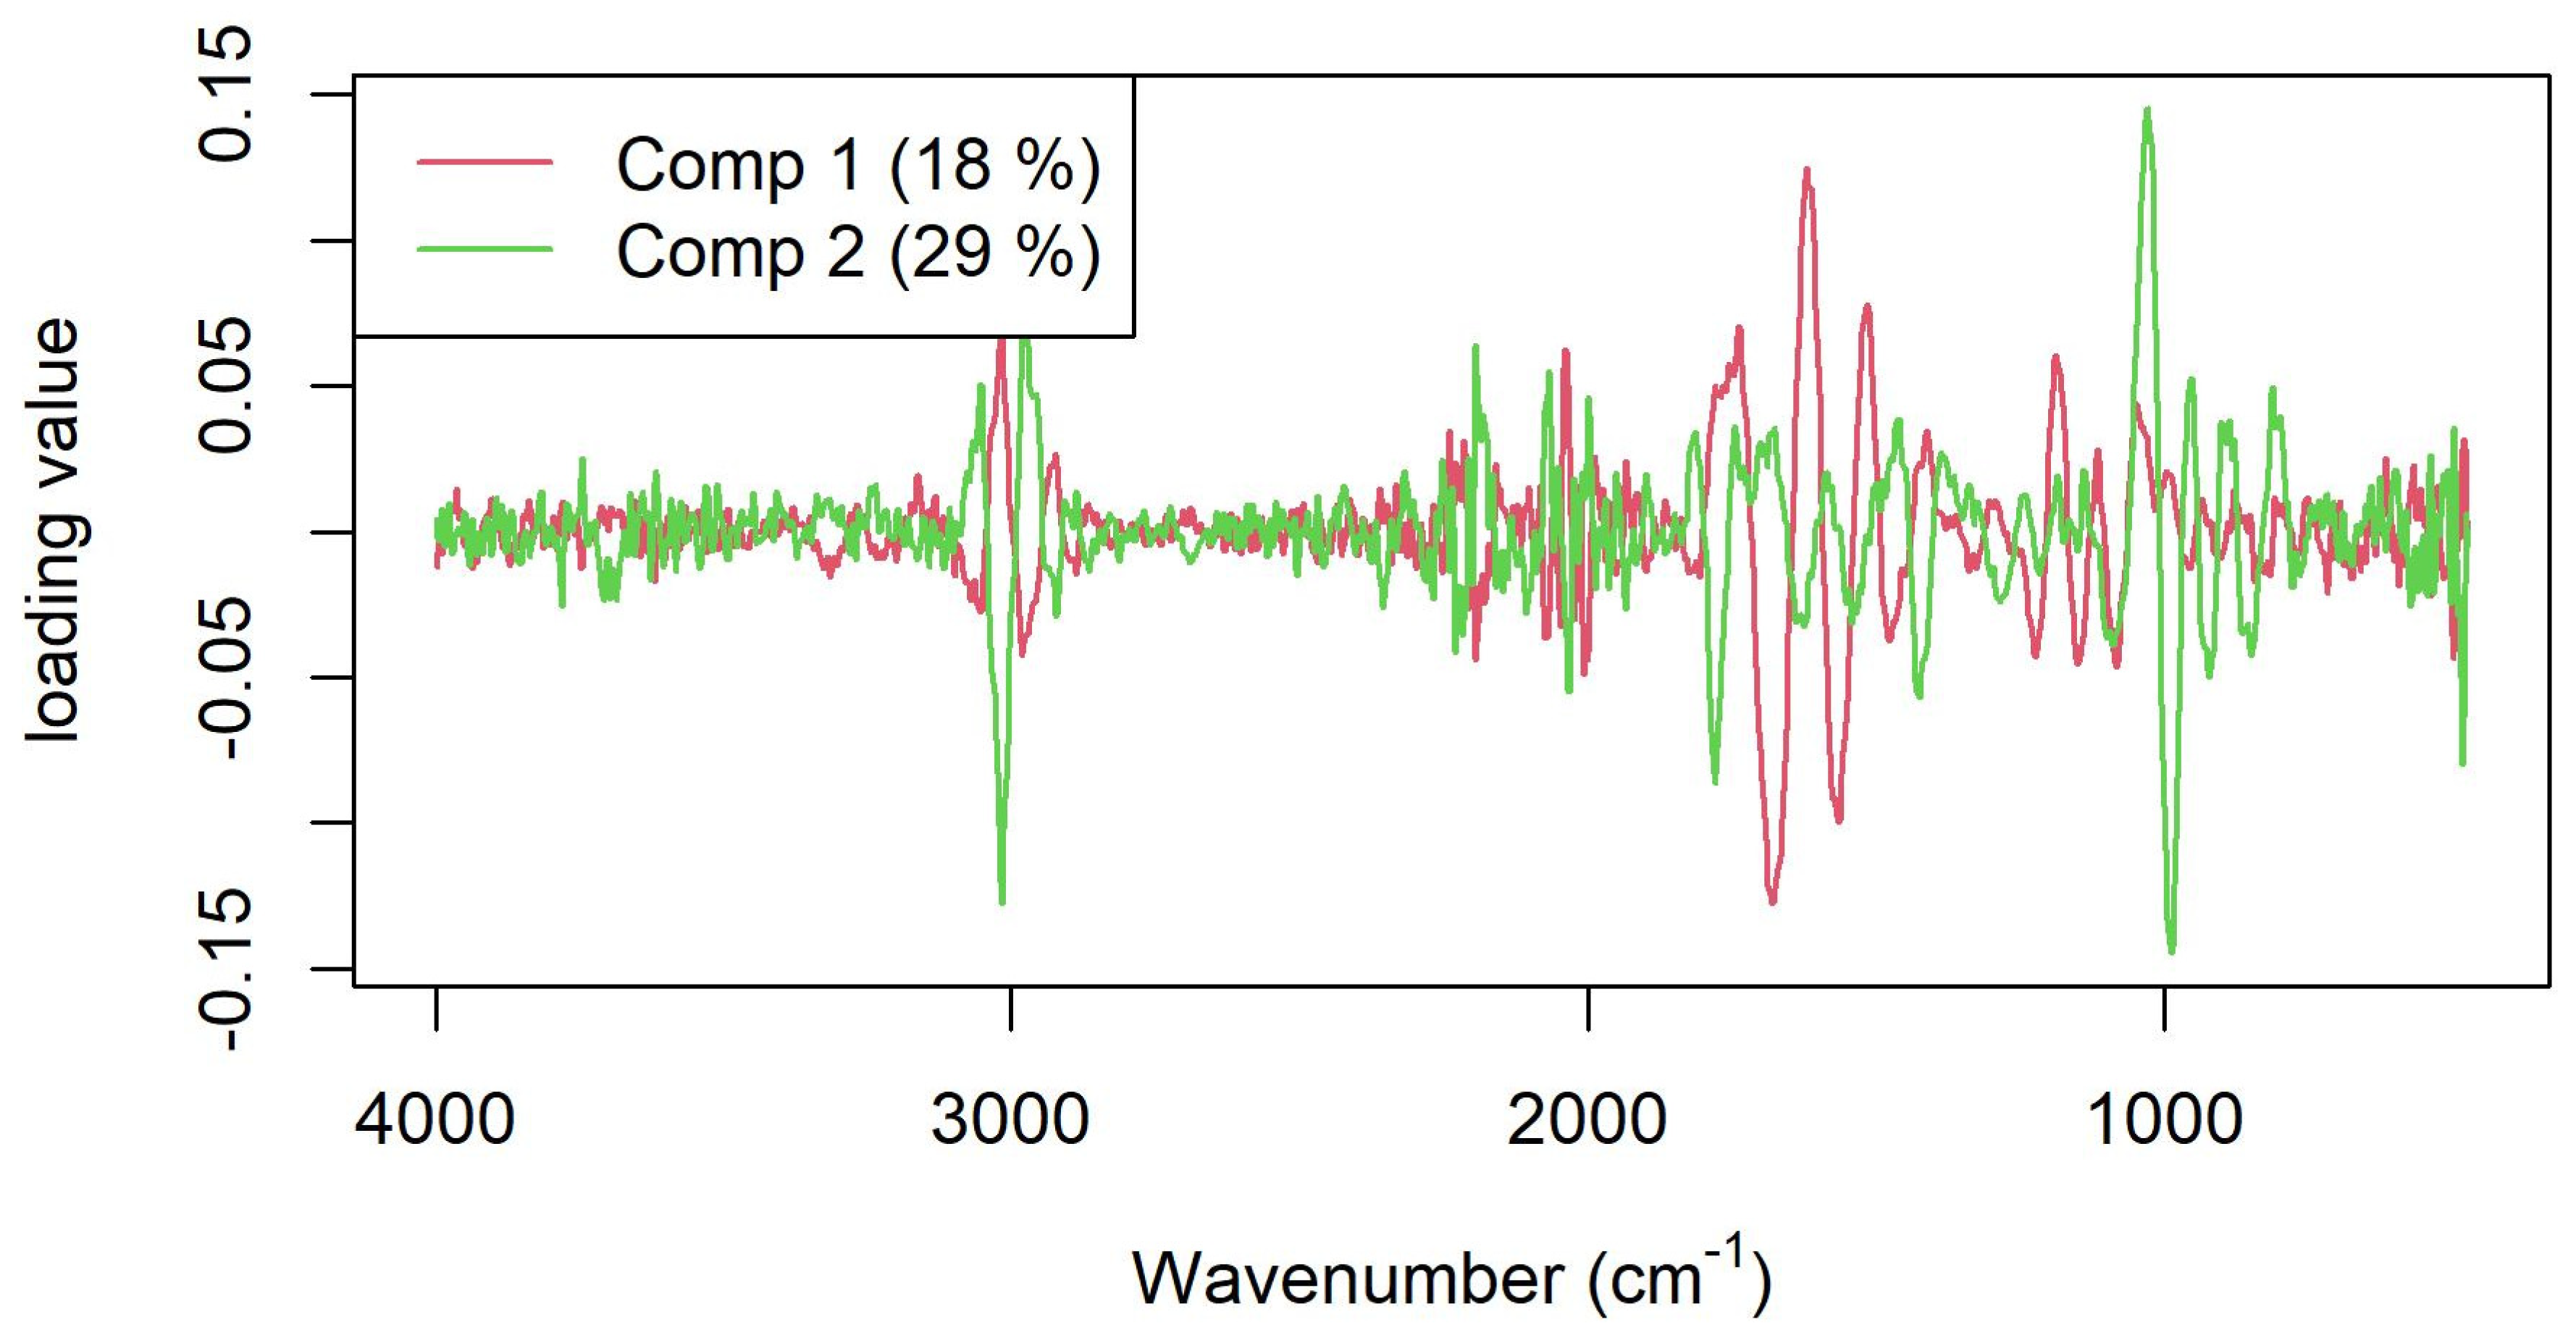
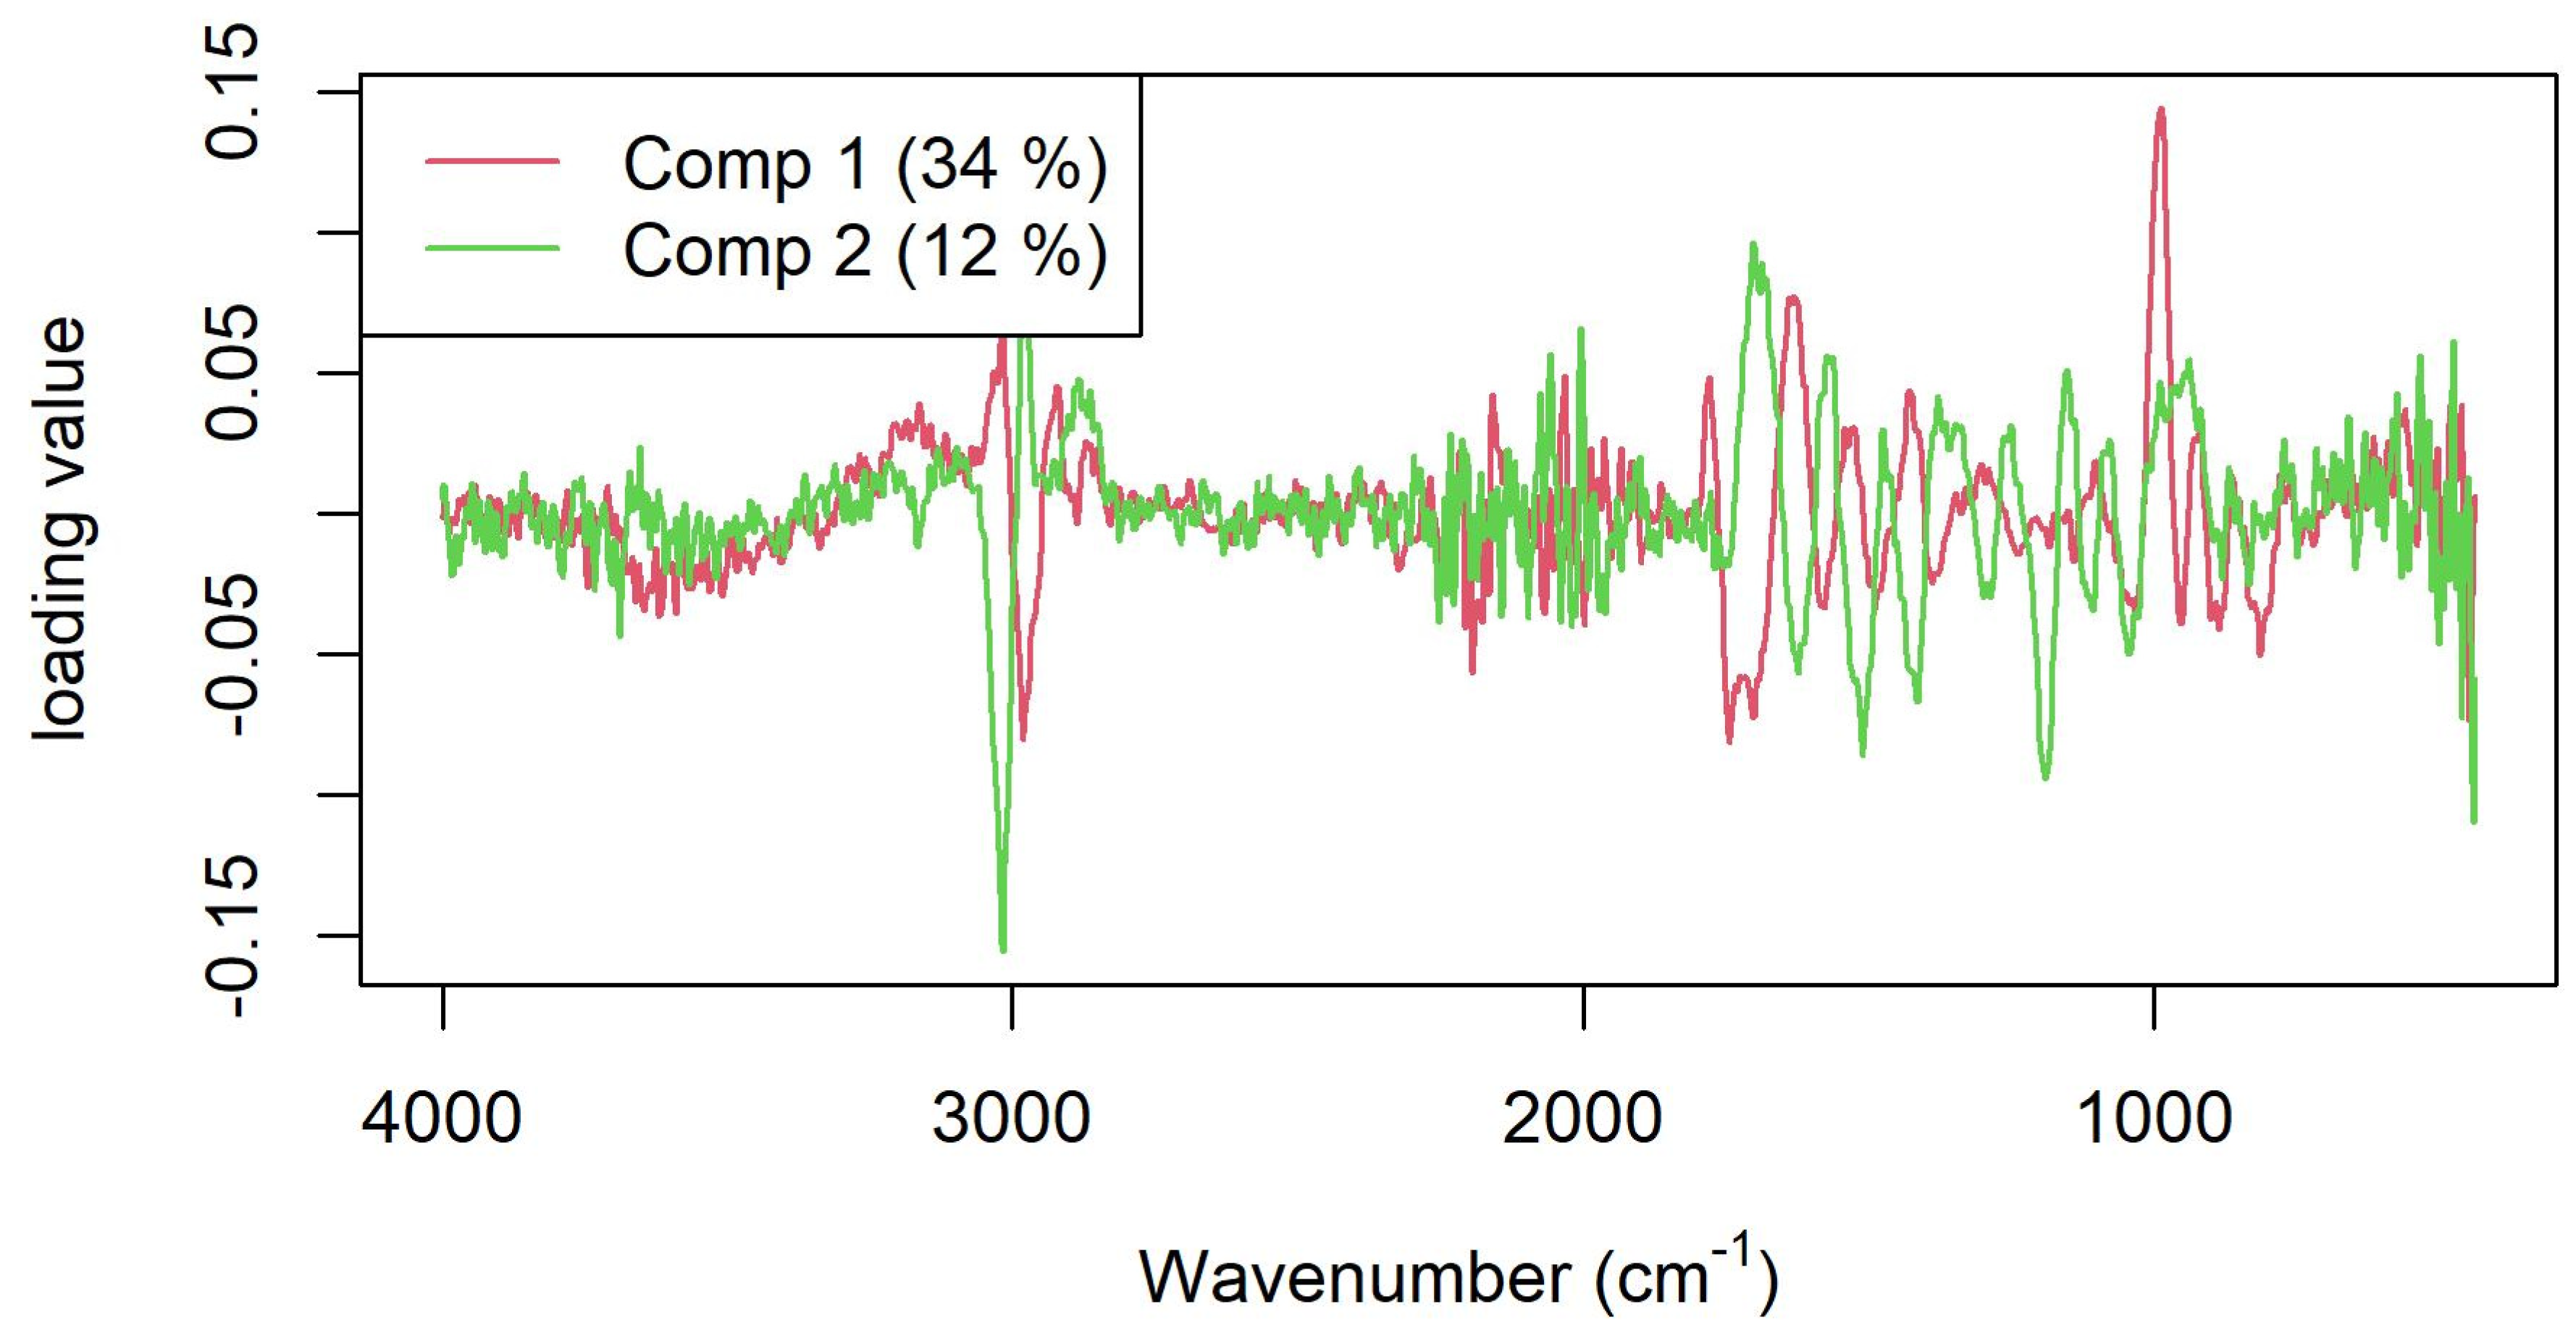
3.3. Mid-Infrared Spectra

The MIR spectra of the wheat samples are shown in Figure 8A. As can be seen from this figure, there was considerable variation in the amplitude of the MIR signal, resulting from the difficulty of applying each of the samples to the attenuated total reflectance (ATR) crystal with a consistent pressure. However, application of the SNV pre-processing algorithm removed most of this variation (Figure 8A).
Compared to the NIRS results, the MIRS PLSR models showed lower R2test and higher RMSEP values for all analytes (Table 3), although the magnitude of this difference was not very high for most of them. For example, the RMSEP values for FRAP and TP were only slightly higher, while the RMSEP for moisture content was almost the same.
However, the MIRS results for the prediction of protein were less than half as accurate compared to NIRS (Figure 9). The loadings for the protein model (Figure 10) showed that the primary influences were from regions corresponding to CH stretching (~3050–2870 cm−1), amide I and II bands (1760–1400 cm−1), and aromatic groups from cellulose (~970 cm−1) [33].
Again, the wheat samples included in this study displayed only low or high FRAP values (with no samples of intermediate values), while the TP contents of the samples were distributed roughly equally throughout the calibration range. Consequently, the prediction accuracy of the FRAP model (Figure 11) would likely be improved through inclusion of samples of intermediate values. The loadings for this model (Figure 12) were somewhat similar to those of the protein content model, but with the strongest influences from the CH stretch (~3000 cm−1) and cellulose bond (~1000 cm−1) regions, with moderate influence from the carbonyl (~1700 cm−1) and amide regions (1600–1400 cm−1).
Similarly, the prediction accuracy of the MIRS model for TP content (Figure 13) was somewhat poorer than that of the NIRS model for this analyte (cf. Figure 6); however, MIRS still appeared suitable for the estimation (although not exact quantification) of TP content.
In contrast to the FRAP loadings, the loadings plot for the TP prediction model showed influences from the OH (~3400 cm−1), carbonyl (~1700 cm−1) and cellulose (~1000 cm−1) regions (Figure 14).

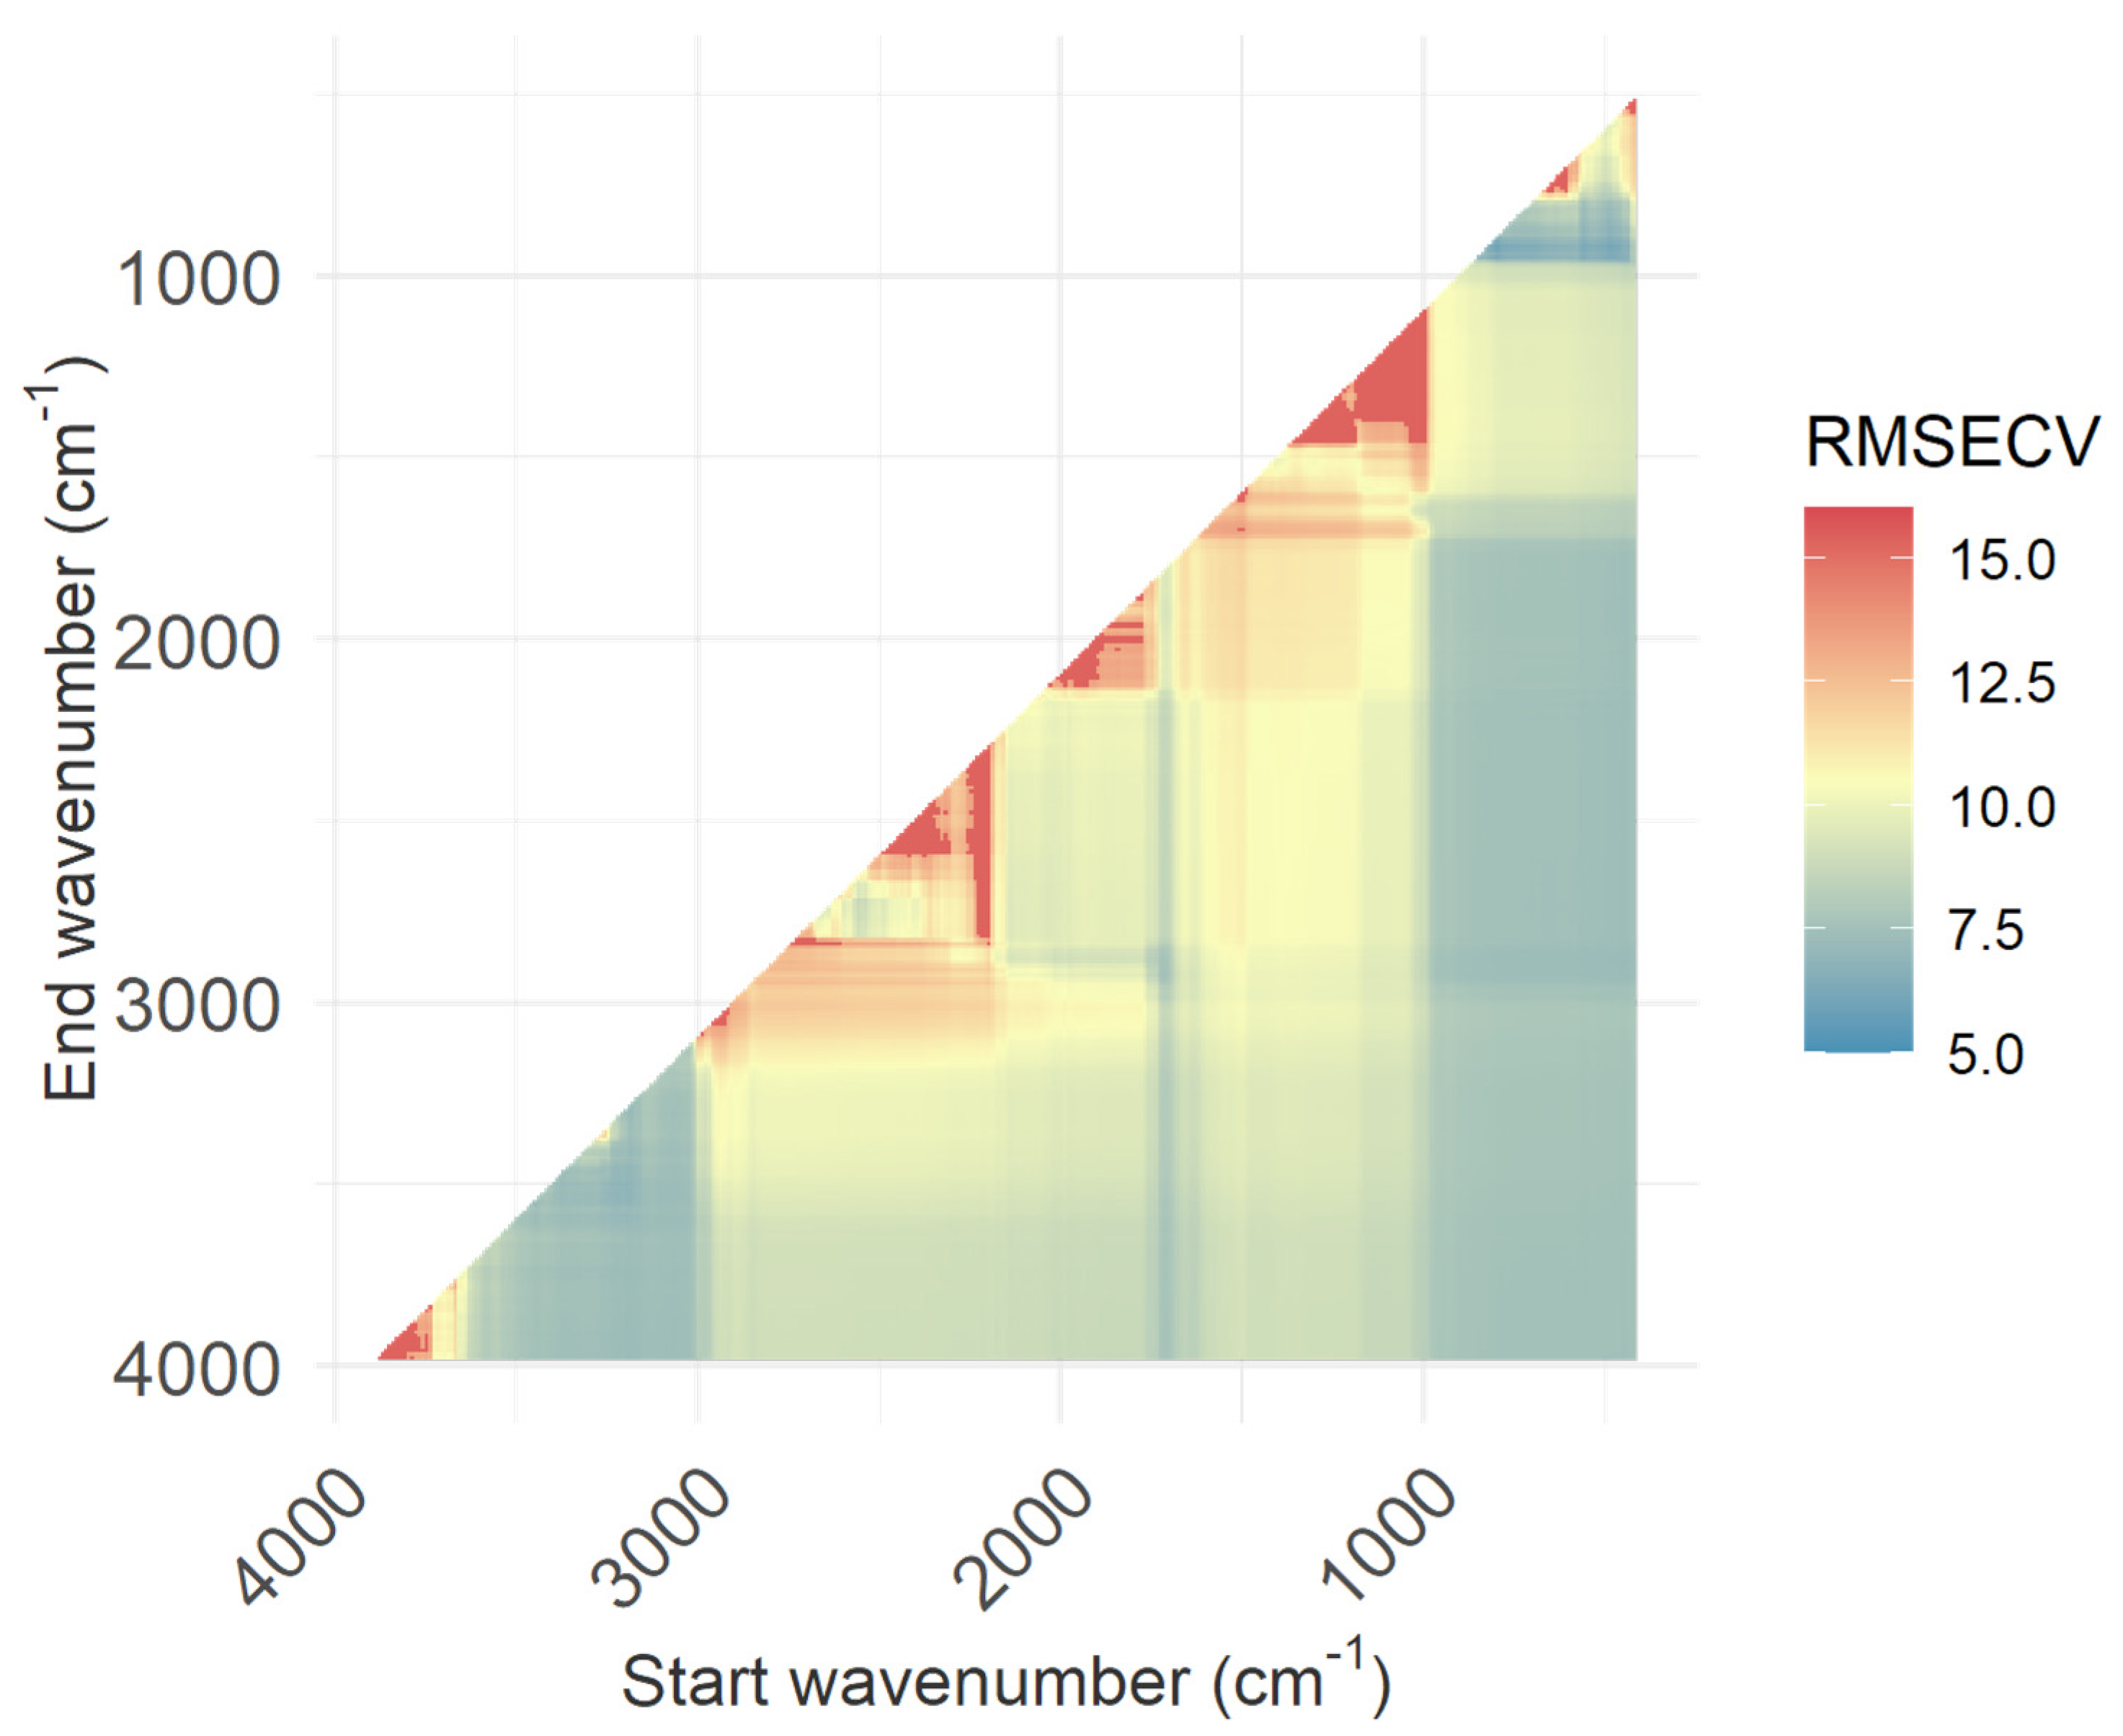
3.4. Moving Window Analysis

Finally, moving window analysis was performed for the best-performing analytes (protein, FRAP, TPC), using both the NIR and MIR spectra. The optimum pre-processing method was determined using regular PLSR (Table 2 and Table 3).
As shown in Figure 15, most wavelength ranges gave reasonably good PLSR models for the prediction of protein from the NIR spectra. However, it was evident that wavelengths below approximately 1400 nm did not provide any useful information for this analyte. As shown by the darker blue stripe across the top of Figure 15, the inclusion of wavelengths between approximately 2150 and 2500 nm appeared to be quite important for the prediction of protein. The optimum PLSR model was found to be between 1210 and 2340 nm, which included the most important wavelengths previously seen in the loadings plot for this analyte (Figure 3). The model created on the optimised wavelengths showed a moderate improvement in R2cv and RMSECV values compared to the full-wavelength model (Table 4).
The FRAP moving window analysis showed a smaller number of high-performing wavelength ranges (Figure 16). Again, the inclusion of wavelengths between approximately 2300–2450 nm were important for high-accuracy models. The optimal wavelength range for the prediction of FRAP was between 1600–2310 nm (Table 4). Again, this generally agreed with the loadings plot for this analyte (Figure 5).
The final NIRS moving window analysis was performed for TPC. It showed a much lower number of high-performing PLSR models, with nearly all of the best models beginning at a wavelength of 1000–1400 nm and ending between 2050 and 2450 nm (Figure 17). The optimal model was found to be between 1200 and 2100 nm (Table 4). Interestingly, this excluded several of the prominent peaks seen above 2100 nm in the loadings plot for TPC (Figure 7), suggesting that these peaks may not be specific to TPC.
Interestingly, the moving window analysis for protein using the MIR spectra showed that the inclusion of wavenumbers below 1000 cm−1 provided reasonably accurate model results (blue band on the left of Figure 18). This contrasted somewhat with the loadings plot for the full-wavenumber PLSR analysis (Figure 9), which showed strong contributions between ~1800 and 1400 cm−1. Nevertheless, the optimum window was found to be between 1515 and 1315 cm−1 (Table 4), which included the region of the Amide II band.
In contrast, the optimum window for FRAP prediction was a very narrow window of 920–800 cm−1 (Figure 19), which did not feature heavily in the full-wavenumber loadings plot (Figure 12). Further investigation would be required to determine the reason for this anomaly.
Finally, the moving window analysis for TPC showed that wavelengths below 1500 cm−1 played an important role in creating an accurate PLSR model (Figure 20), with an optimum wavenumber window of 410–1760 cm−1. This may be linked to the peaks seen around 1000 cm−1 (attributed to cellulose) in the TPC loadings plot previously reported (Figure 14); the range also includes the carbonyl bond seen around 1700 cm−1.

4. Discussion

Overall, the NIRS results showed promise for the rapid, non-invasive prediction of most of the analytes investigated in the wheat samples, including proximate analytes (protein and moisture) and bioactive components (FRAP and TP). The best-performing NIRS model was found to be that for protein content (R2test = 0.991; RMSEP = 0.22%). This model showed ideal statistics, with minimal bias, a slope close to 1, and an intercept close to 0. Furthermore, the RPD of the test set (RPDtest) was 10.23, well above the threshold indicating an excellent prediction model (RPD of 3) [34]. The model developed here was more accurate than NIRS models previously reported for Turkish wheat (R2test = 0.97, RMSEP = 0.38%; dependent test set) [35] and triticale, a hybrid cross of wheat and rye (R2test = 0.96, RMSEP = 0.32%; test set from a different growing season) [36]. However, it was not quite as accurate as the model reported by Ye et al. [13] (R2test = 0.999, RMSEP = 0.05%; dependent test set), likely due to the smaller calibration sample size used in this study. Nevertheless, the protein model’s accuracy would appear to place it among the best performing models reported in the literature.
Although the model linearity was somewhat lower for the prediction of TPC (R2test = 0.83), the RMSEP for this analyte was exceptionally low, at just 3.9 mg GAE/100 g. This corresponds to an RPDtest of 2.49, corresponding to a good prediction accuracy [34]. The only previous study found using NIRS for the prediction of TPC in wheat flour was performed by Tian et al. [23], who reported a higher R2 value (R2val = 0.90), but lower precision (RMSEV = 7.1 mg GAE/100 g) on a dependent test set.
No previous studies were found using infrared spectroscopy for the prediction of antioxidant capacity in wheat flour, although several studies have attempted this in other crops such as maize [37], rice [20], and gluten-free grains [21]. Although the FRAP prediction model developed here showed high linearity and a relatively low RMSEP, it should be cautioned that there were relatively few points with higher FRAP values included in the calibration and test sets. Consequently, this model had a slope that deviated from 1, indicating relative under-prediction of the highest-content sample. Nevertheless, the similar wavelength loadings between the TPC and FRAP models support the observation that this model was looking at the “correct” wavelengths to measure compounds with antioxidant activity. While it is likely that analysis of a larger number of wheat samples containing a broader array of FRAP values would be required to create a robust NIRS model for the prediction of this analyte, the current model appeared suitable for the rough estimation (not exact quantification) of FRAP values. Its RPDcal was 2.95, although this fell to an RPDtest of 1.57 for the dependent test set, indicating that it is most suitable for screening purposes only [34]. However, with a larger sample size covering the full range of FRAP values found in wheat, it is possible that these statistics could be improved to provide more accurate prediction of antioxidant capacity.
Neither NIRS nor MIRS were able to predict the total monomeric anthocyanin content. This result was not unexpected, due to the very low concentration of this compound (mean content of just 2.5 mg cyd-3-glu/100 g in the calibration set). Work on other grain crops (faba beans, chickpeas, and mungbeans) has also failed to produce accurate NIRS or MIRS models for TMA content [38], confirming that this challenge is not unique to the wheat matrix.
In general, the MIRS models performed more poorly compared to the NIRS models in both the calibration and test sets. The only exception to this trend was for the prediction of moisture content, which showed a higher R2test and similar RMSEP in the MIRS model. MIRS was able to predict the protein content of wheat with acceptable accuracy (R2test = 0.93; RMSEP = 0.62%). However, its accuracy was approximately three times lower compared to the use of NIRS for the same analyte (R2test = 0.991; RMSEP = 0.22%), reflecting the challenge in obtaining reproducible spectra when using MIRS instruments with an attenuated total reflectance sampling module.
Similarly, the linearity (R2) and RMSEP were slightly poorer for the MIRS prediction of TPC and FRAP compared to their respective NIRS models. However, the slope of the FRAP MIRS model (1.20) was closer to the ideal value of 1. In contrast to the similar loadings seen in the NIRS models for TPC and FRAP prediction, the MIRS models for these analytes were noticeably different in their loadings. While both included the carbonyl region (~1700 cm−1), the OH (~3400 cm−1) and cellulose (~1000 cm−1) regions showed greater influence in the TPC model, while the FRAP model included more influence from the CH stretch (~3000 cm−1) and amide regions (1600–1400 cm−1). This indicated that the FRAP model was relatively specific for the prediction of antioxidant compounds (potentially including other non-phenolic antioxidant compounds such as tocopherols and or carotenoids), rather than just relying on the correlation between FRAP and TPC values to predict the former analyte.
On average, wavelength optimisation via moving window analysis improved the RMSECV values by 18 ± 6% for NIRS, and by 20 ± 8% for MIRS. Consequently, moving window PLSR appears to be an easy and readily implementable method for improving model performance via wavelength selection, although it can be computationally expensive for large datasets.

5. Conclusions

The models developed here showed a high level of accuracy for the prediction of protein and considerable promise for the estimation of TPC and FRAP, particularly using the NIR spectra. This is beneficial for the potential uptake of this application, as NIRS is already more commonly used for the analysis of other nutritional components in the grains sector. On the other hand, MIRS is generally a slower process, as each sample must be manually positioned on the ATR module, and the correct amount of pressure applied. Furthermore, there can be difficulty in obtaining reproducible spectra, due to differing amounts of pressure applied to the ATR module. However, the loadings plots for FRAP suggested that the MIRS model was more specific to antioxidant compounds, while the NIRS FRAP model loadings were very similar to the TPC model loadings. Consequently, users may have to determine the compromise required between better accuracy and better specificity. It is possible that concatenation of NIR and MIR spectra would provide improved model performance. Future studies should incorporate a larger sample set split into calibration and independent test sets, in order to confirm the true accuracy of NIRS for these analytes. Finally, it was shown that moving window PLSR is a viable and easy method for removing non-informative wavelengths from PLSR models, thus providing moderate improvements in R2 and RMSECV values.

Author Contributions

Conceptualisation, J.B.J., K.B.W. and M.N.; methodology, J.B.J.; software, J.B.J.; validation, J.B.J.; formal analysis, J.B.J.; investigation, J.B.J.; resources, J.B.J. and M.N.; data curation, J.B.J.; writing—original draft preparation, J.B.J.; writing—review and editing, J.B.J., K.B.W. and M.N.; visualisation, J.B.J.; supervision, M.N. and K.B.W.; project administration, J.B.J., K.B.W. and M.N.; funding acquisition, M.N. and K.B.W. All authors have read and agreed to the published version of the manuscript.

Funding

This research was supported in part by the Australian Government in the form of a Research Training Program Stipend provided to one of the authors (J.B.J.).

Institutional Review Board Statement

Not applicable.

Informed Consent Statement

Not applicable.

Data Availability Statement

The data presented in this study are openly available in Mendeley Data at https://doi.org/10.17632/8bb2d725sd.1 [39].

Acknowledgments

Thanks to Daniel Skylas from the Australian Export Grains Innovation Centre (AEGIC) for supplying the wheat samples used in this study.

Conflicts of Interest

The authors declare no conflict of interest.

References

  1. FAO. FAOSTAT. Available online: http://www.fao.org/faostat/en/#data/QC (accessed on 12 January 2023).
  2. Shiferaw, B.; Smale, M.; Braun, H.-J.; Duveiller, E.; Reynolds, M.; Muricho, G. Crops that feed the world 10. Past successes and future challenges to the role played by wheat in global food security. Food Secur. 2013, 5, 291–317. [Google Scholar] [CrossRef] [Green Version]
  3. Australian Bureau of Statistics. Agricultural Commodities, Australia. Available online: https://www.abs.gov.au/statistics/industry/agriculture/agricultural-commodities-australia/latest-release (accessed on 12 January 2023).
  4. Rebello, C.J.; Greenway, F.L.; Finley, J.W. Whole Grains and Pulses: A Comparison of the Nutritional and Health Benefits. J. Agric. Food Chem. 2014, 62, 7029–7049. [Google Scholar] [CrossRef]
  5. Curran, J. The nutritional value and health benefits of pulses in relation to obesity, diabetes, heart disease and cancer. Br. J. Nutr. 2012, 108, S1–S2. [Google Scholar] [CrossRef] [Green Version]
  6. Dalton, S.M.C.; Tapsell, L.C.; Probst, Y. Potential Health Benefits of Whole Grain Wheat Components. Nutr. Today 2012, 47, 163–174. [Google Scholar] [CrossRef]
  7. Baublis, A.J.; Lu, C.; Clydesdale, F.M.; Decker, E.A. Potential of Wheat-Based Breakfast Cereals as a Source of Dietary Antioxidants. J. Am. Coll. Nutr. 2000, 19, 308S–311S. [Google Scholar] [CrossRef]
  8. Lu, Y.; Luthria, D.; Fuerst, E.P.; Kiszonas, A.M.; Yu, L.; Morris, C.F. Effect of Processing on Phenolic Composition of Dough and Bread Fractions Made from Refined and Whole Wheat Flour of Three Wheat Varieties. J. Agric. Food Chem. 2014, 62, 10431–10436. [Google Scholar] [CrossRef]
  9. Kaur, N.; Singh, B.; Kaur, A.; Yadav, M.P.; Singh, N.; Ahlawat, A.K.; Singh, A.M. Effect of growing conditions on proximate, mineral, amino acid, phenolic composition and antioxidant properties of wheatgrass from different wheat (Triticum aestivum L.) varieties. Food Chem. 2021, 341, 128201. [Google Scholar] [CrossRef]
  10. Tian, W.; Chen, G.; Tilley, M.; Li, Y. Changes in phenolic profiles and antioxidant activities during the whole wheat bread-making process. Food Chem. 2021, 345, 128851. [Google Scholar] [CrossRef]
  11. Tian, W.; Chen, G.; Gui, Y.; Zhang, G.; Li, Y. Rapid quantification of total phenolics and ferulic acid in whole wheat using UV–Vis spectrophotometry. Food Control 2021, 123, 107691. [Google Scholar] [CrossRef]
  12. Li, L.; Shewry, P.R.; Ward, J.L. Phenolic acids in wheat varieties in the HEALTHGRAIN diversity screen. J. Agric. Food Chem. 2008, 56, 9732–9739. [Google Scholar] [CrossRef]
  13. Ye, D.; Sun, L.; Zou, B.; Zhang, Q.; Tan, W.; Che, W. Non-destructive prediction of protein content in wheat using NIRS. Spectrochim. Acta Part A Mol. Biomol. Spectrosc. 2018, 189, 463–472. [Google Scholar] [CrossRef]
  14. Stubbs, T.L.; Kennedy, A.C.; Fortuna, A.-M. Using NIRS to predict fiber and nutrient content of dryland cereal cultivars. J. Agric. Food Chem. 2010, 58, 398–403. [Google Scholar] [CrossRef]
  15. Peng, J.; Zhang, Z.-m. Rapid determination of starch and amylose content in whole wheat seeds by near infrared reflectance spectroscopy (NIRS). J. Triticeae Crops 2010, 30, 276–279. [Google Scholar]
  16. Williams, P.C. Application of chemometrics to prediction of some wheat quality factors by near-infrared spectroscopy. Cereal Chem. 2020, 97, 958–966. [Google Scholar] [CrossRef]
  17. Johnson, J.B.; Walsh, K.B.; Naiker, M.; Ameer, K. The Use of Infrared Spectroscopy for the Quantification of Bioactive Compounds in Food: A Review. Molecules 2023, 28, 3215. [Google Scholar] [CrossRef]
  18. Walsh, K.B.; Blasco, J.; Zude-Sasse, M.; Sun, X. Visible-NIR ‘point’ spectroscopy in postharvest fruit and vegetable assessment: The science behind three decades of commercial use. Postharvest Biol. Technol. 2020, 168, 111246. [Google Scholar] [CrossRef]
  19. Pasquini, C. Near infrared spectroscopy: A mature analytical technique with new perspectives–A review. Anal. Chim. Acta 2018, 1026, 8–36. [Google Scholar] [CrossRef]
  20. Zhang, C.; Shen, Y.; Chen, J.; Xiao, P.; Bao, J. Nondestructive prediction of total phenolics, flavonoid contents, and antioxidant capacity of rice grain using near-infrared spectroscopy. J. Agric. Food Chem. 2008, 56, 8268–8272. [Google Scholar] [CrossRef]
  21. Wiedemair, V.; Ramoner, R.; Huck, C.W. Investigations into the total antioxidant capacities of cultivars of gluten-free grains using near-infrared spectroscopy. Food Control 2019, 95, 189–195. [Google Scholar] [CrossRef]
  22. Johnson, J.; Collins, T.; Skylas, D.; Naiker, M. ATR-MIR: A valuable tool for the rapid assessment of biochemically active compounds in grains. In Proceedings of the 69th Australasian Grain Science Conference, Carlton, Melbourne, Australia, 27–29 August 2019; pp. 73–79. [Google Scholar]
  23. Tian, W.; Chen, G.; Zhang, G.; Wang, D.; Tilley, M.; Li, Y. Rapid determination of total phenolic content of whole wheat flour using near-infrared spectroscopy and chemometrics. Food Chem. 2021, 344, 128633. [Google Scholar] [CrossRef]
  24. Skylas, D.J.; Paull, J.G.; Hughes, D.G.; Gogel, B.; Long, H.; Williams, B.; Mundree, S.; Blanchard, C.L.; Quail, K.J. Nutritional and anti-nutritional seed-quality traits of faba bean (Vicia faba) grown in South Australia. Crop Pasture Sci. 2019, 70, 463–472. [Google Scholar] [CrossRef]
  25. Johnson, J.; Collins, T.; Skylas, D.; Quail, K.; Blanchard, C.; Naiker, M. Profiling the Varietal Antioxidative Content and Macrochemical Composition in Australian Faba Beans (Vicia faba L.). Legume Sci. 2020, 2, e28. [Google Scholar] [CrossRef] [Green Version]
  26. R Core Team. R: A Language and Environment for Statistical Computing, Version 4.2.3. R Foundation for Statistical Computing: Vienna, Austria, 2023.
  27. Savitzky, A.; Golay, M.J. Smoothing and differentiation of data by simplified least squares procedures. Anal. Chem. 1964, 36, 1627–1639. [Google Scholar] [CrossRef]
  28. Johnson, J.B.; Mani, J.S.; Walsh, K.B.; Naiker, M. Infrared spectroscopy for the quality assessment of Habanero chilli: A proof-of-concept study. J. Food Meas. Charact. 2023, 17, 1764–1774. [Google Scholar] [CrossRef]
  29. Ziegler, J.U.; Leitenberger, M.; Longin, C.F.H.; Würschum, T.; Carle, R.; Schweiggert, R.M. Near-infrared reflectance spectroscopy for the rapid discrimination of kernels and flours of different wheat species. J. Food Compos. Anal. 2016, 51, 30–36. [Google Scholar] [CrossRef]
  30. Rodríguez, S.D.; López-Fernández, M.P.; Maldonado, S.; Buera, M.P. Evidence on the discrimination of quinoa grains with a combination of FT-MIR and FT-NIR spectroscopy. J. Food Sci. Technol. 2019, 56, 4457–4464. [Google Scholar] [CrossRef]
  31. De Girolamo, A.; Cortese, M.; Cervellieri, S.; Lippolis, V.; Pascale, M.; Logrieco, A.F.; Suman, M. Tracing the Geographical Origin of Durum Wheat by FT-NIR Spectroscopy. Foods 2019, 8, 450. [Google Scholar] [CrossRef] [Green Version]
  32. Kays, S.E.; Barton, F.E.; Windham, W.R. Predicting Protein Content by near Infrared Reflectance Spectroscopy in Diverse Cereal Food Products. J. Near Infrared Spectrosc. 2000, 8, 35–43. [Google Scholar] [CrossRef]
  33. Ji, Y.; Yang, X.; Ji, Z.; Zhu, L.; Ma, N.; Chen, D.; Jia, X.; Tang, J.; Cao, Y. DFT-Calculated IR Spectrum Amide I, II, and III Band Contributions of N-Methylacetamide Fine Components. ACS Omega 2020, 5, 8572–8578. [Google Scholar] [CrossRef] [Green Version]
  34. Nicolaï, B.M.; Beullens, K.; Bobelyn, E.; Peirs, A.; Saeys, W.; Theron, K.I.; Lammertyn, J. Nondestructive measurement of fruit and vegetable quality by means of NIR spectroscopy: A review. Postharvest Biol. Technol. 2007, 46, 99–118. [Google Scholar] [CrossRef]
  35. Başlar, M.; Ertugay, M.F. Determination of protein and gluten quality-related parameters of wheat flour using near-infrared reflectance spectroscopy (NIRS). Turk. J. Agric. For. 2011, 35, 139–144. [Google Scholar] [CrossRef]
  36. Igne, B.; Gibson, L.R.; Rippke, G.R.; Schwarte, A.; Hurburgh, C.R., Jr. Triticale moisture and protein content prediction by near-infrared spectroscopy (NIRS). Cereal Chem. 2007, 84, 328–330. [Google Scholar] [CrossRef]
  37. Redaelli, R.; Alfieri, M.; Cabassi, G. Development of a NIRS calibration for total antioxidant capacity in maize germplasm. Talanta 2016, 154, 164–168. [Google Scholar] [CrossRef] [PubMed]
  38. Johnson, J. Investigation of the Phenolic and Antioxidant Content in Australian Grains Using Traditional and Non-Invasive Analytical Techniques. Master’s Thesis, CQ University, Rockhampton, Australia, 2022. [Google Scholar]
  39. Johnson, J.B. Phenolics in Australian Grain Crops. Master’s Thesis, Mendeley Data, London, UK, 2022. [Google Scholar] [CrossRef]
Figure 1. The raw NIR spectra (A) and SNV-processed spectra (B) of the wheat flour samples.
Applsci 13 08989 g001
Figure 2. Actual vs. NIRS-predicted protein values for the calibration (A) and test (B) samples, using 5 components.
Applsci 13 08989 g002
Figure 3. Loadings plot for the NIRS prediction of protein content in wheat flour. Note that “comp” stands for the number of principal components in the model.
Applsci 13 08989 g003
Figure 4. Actual vs. NIRS-predicted ferric reducing antioxidant potential (FRAP) values for the calibration (A) and test (B) samples, using 6 components.
Applsci 13 08989 g004
Figure 5. Loadings plot for the NIRS prediction of ferric reducing antioxidant potential (FRAP) in wheat flour. Note that “comp” stands for the number of principal components in the model.
Applsci 13 08989 g005
Figure 6. Actual vs. NIRS-predicted total phenolic contents for the calibration (A) and test (B) samples, using 5 components.
Applsci 13 08989 g006
Figure 7. Loadings plot for the NIRS prediction of total phenolic content in wheat flour. Note that “comp” stands for the number of principal components in the model.
Applsci 13 08989 g007
Figure 8. The raw MIR spectra (A) and SNV-processed spectra (B) of the wheat flour samples.
Applsci 13 08989 g008
Figure 9. Actual vs. MIRS-predicted protein contents for the calibration (A) and test (B) samples, using 6 components.
Applsci 13 08989 g009
Figure 10. Loadings plot for the MIRS prediction of protein content in wheat flour. Note that “comp” stands for the number of principal components in the model.
Applsci 13 08989 g010
Figure 11. Actual vs. MIRS-predicted ferric reducing antioxidant potential (FRAP) values for the calibration (A) and test (B) samples, using 6 components.
Applsci 13 08989 g011
Figure 12. Loadings plot for the MIRS prediction of ferric reducing antioxidant potential (FRAP) in wheat flour. Note that “comp” stands for the number of principal components in the model.
Applsci 13 08989 g012
Figure 13. Actual vs. MIRS-predicted TP values for the calibration (A) and test (B) samples, using 5 components.
Applsci 13 08989 g013
Figure 14. Loadings plot for the MIRS prediction of total phenolic content in wheat flour. Note that “comp” stands for the number of principal components in the model.
Applsci 13 08989 g014
Figure 15. Results of the moving window optimisation for the prediction of protein using the NIR spectra. Note that the figure shows RMSECV values.
Applsci 13 08989 g015
Figure 16. Results of moving window optimisation for the prediction of FRAP using the NIR spectra. Note that the figure shows RMSECV values.
Applsci 13 08989 g016
Figure 17. Results of moving window optimisation for the prediction of TPC using the NIR spectra. Note that the figure shows RMSECV values.
Applsci 13 08989 g017
Figure 18. Results of moving window optimisation for the prediction of protein using the MIR spectra. Note that the figure shows RMSECV values.
Applsci 13 08989 g018
Figure 19. Results of moving window optimisation for the prediction of FRAP using the MIR spectra. Note that the figure shows RMSECV values.
Applsci 13 08989 g019
Figure 20. Results of moving window optimisation for the prediction of TPC using the MIR spectra. Note that the figure shows RMSECV values.
Applsci 13 08989 g020
Table 1. Descriptive statistics for the parameters measured in this study, for both the calibration and test sets.
Calibration Set (n = 50)Test Set (n = 15)
ParameterRangeMean ± SD
(Median)
RangeMean ± SD
(Median)
Moisture (%)10.1–14.511.90 ± 1.39
(11.40)
8.7–14.011.70 ± 1.30
(11.30)
Protein (%)10.66–17.4614.16 ± 1.98
(13.84)
11.43–16.8413.97 ± 2.25
(14.19)
FRAP (mg TE/100 g)14.4–64.032.8 ± 16.4
(24.6)
19.4–53.525.3 ± 8.5
(23.4)
TPC (mg GAE/100 g)129.7–179.8149.5 ± 11.3
(151.9)
139.0–167.6151.9 ± 9.7
(146.4)
TMA (mg cyd-3-glu/100 g)0.0–10.02.5 ± 2.2
(2.2)
0.0–3.92.0 ± 1.1
(2.6)
cyd-3-glu = cyanidin-3-glucoside equivalents; FRAP = ferric reducing antioxidant potential; GAE = gallic acid equivalents SD = standard deviation; TE = Trolox equivalents; TMA = total monomeric anthocyanin content; TPC = total phenolic content.
Table 2. Optimum PLSR models found for the prediction of the specified analytes using near-infrared spectroscopy (NIRS), using separate calibration and dependent test sets.
ParameterSpectral
Pre-Processing
ComponentsR2cvRMSECVRPDR2testRMSEPBiasSlopeIntercept
MoistureSNV + 1d1560.840.562.490.760.62−0.040.9660.35
ProteinSNV50.9740.326.250.9910.22−0.060.998−0.03
FRAPSNV60.885.62.950.9175.4−0.640.6209.2
TPCSNV + 1d2150.617.01.620.833.9−0.100.90714.1
TMA1d1140.052.11.030.001.9−0.630.021.98
FRAP = ferric reducing antioxidant potential; TPC = total phenolic content; TMA = total monomeric anthocyanin content; RMSECV = root mean square error of cross-validation; RPD = ratio of performance to deviation; RMSEP = root mean square error of prediction.
Table 3. Optimum PLSR models found for the prediction of the specified analytes using mid-infrared spectroscopy (MIRS), using separate calibration and dependent test sets.
ParameterSpectral
Pre-Processing
ComponentsR2cvRMSECVRPDR2testRMSEPBiasSlopeIntercept
Moisture1d2140.860.522.650.830.650.081.45−5.10
ProteinSNV + 2d1560.920.553.650.930.62−0.100.891.40
FRAPSNV + 1d1560.885.22.930.837.01.561.20−4.21
TPCSNV50.517.81.450.735.6−1.530.7633.8
TMANone1−0.042.10.990.021.60.54−1.255.55
FRAP = ferric reducing antioxidant potential; TPC = total phenolic content; TMA = total monomeric anthocyanin content; RMSECV = root mean square error of cross-validation; RPD = ratio of performance to deviation; RMSEP = root mean square error of prediction.
Table 4. Comparison of PLSR models created using the full wavelength range, and the optimised wavelength range found through moving window PLSR optimisation, for selected analytes using both NIRS and MIRS. Note that the RMSECV and R2cv values may vary from those reported in Table 2 and Table 3, as the optimum number of components was selected using an algorithm for the moving window comparison, rather than manually selected.
ParameterMethodWavelength RangeR2cvRMSECV
NIRS (nm)
ProteinFull range1000–25000.9760.302
ProteinOptimised1210–23400.9870.225
FRAPFull range1000–25000.8915.36
FRAPOptimised1600–23100.9184.66
TPCFull range1000–25000.5217.78
TPCOptimised1200–21000.6646.51
MIRS (cm−1)
ProteinFull range4000–4000.8410.803
ProteinOptimised1515–13150.9160.584
FRAPFull range4000–4000.7507.56
FRAPOptimised920–8000.8465.92
TPCFull range4000–4000.3069.06
TPCOptimised410–17600.4528.05
Disclaimer/Publisher’s Note: The statements, opinions and data contained in all publications are solely those of the individual author(s) and contributor(s) and not of MDPI and/or the editor(s). MDPI and/or the editor(s) disclaim responsibility for any injury to people or property resulting from any ideas, methods, instructions or products referred to in the content.

