Article

Interaction of Voice Onset Time with Vocal Hyperfunction and Voice Quality

by
Maria Francisca de Paula Soares
1,2,*,
Marília Sampaio
1 and
Meike Brockmann-Bauser
2,*
1
Department of Speech, Language and Hearing Science, Federal University of Bahia, Salvador 40110-170, Brazil
2
Department of Phoniatrics and Speech Pathology, Clinic for Otorhinolaryngology Head and Neck Surgery, University Hospital Zurich, University of Zurich, 8091 Zurich, Switzerland
*
Authors to whom correspondence should be addressed.
Appl. Sci. 2023, 13(15), 8956; https://doi.org/10.3390/app13158956
Submission received: 30 May 2023 / Revised: 29 July 2023 / Accepted: 31 July 2023 / Published: 4 August 2023
(This article belongs to the Special Issue Computational Methods and Engineering Solutions to Voice III)

Abstract

:

Featured Application

This research article investigates whether the acoustic measure Voice Onset Time (VOT) can describe voicing features in patients with vocal hyperfunction.

Abstract

The main aim of the present work was to investigate whether vocal hyperfunction (VH), perceptual voice quality (VQ), gender, and phonetic environment influence Voice Onset Time (VOT). The investigated group consisted of 30 adults, including 19 women (X = 46.1 ± 13.7 years) and 11 men (X = 47.5 ± 11.0 years), who had either phonotraumatic vocal hyperfunction (PVH) and non-phonotraumatic vocal hyperfunction (NPVH). VQ was judged considering the overall severity of dysphonia (OS) and the subcharacteristics of roughness, breathiness, and strain. Phonetic variables such as vowel stress, syllable stress, and mode of speech task were analyzed. Four samples of syllables with [p] plus vowel or diphthong were retrieved from CAPE-V sentences recordings. Acoustic analysis with Praat comprised VOT, mean fundamental frequency (fo), intensity (SPL dB(A)), and coefficient of variation of fundamental frequency (CV_fo %). VOT was significantly influenced by OS (p ≤ 0.001) but not by vocal VH condition (PVH versus NPVH) (p = 0.90). However, CV_fo was affected by the VH condition (p = 0.02). Gender effects were only found for mean fo (p ≤ 0.001) and SPL (p = 0.01). All VQ sub characteristics (OS, roughness, breathiness, and strain) correlated with VOT (p ≤ 0.001) and SPL (p ≤ 0.001) but not with fo. In summary, VOT was affected by voice quality, while it was not affected by vocal hyperfunction conditions. Therefore, VOT has the potential to objectively describe the onset of voicing in voice diagnostics, and may be one underlying objective characteristic of perceptual vocal quality.

1. Introduction

There are many possible applications for acoustic voice analysis techniques, such as measuring specific aspects of vocal quality (VQ), interpreting laryngeal and vocal tract function adjustments related to dysphonia to support voice diagnostics, and guiding voice treatment or training [1]. Acoustic measurement techniques to evaluate VQ include parameters related to the fundamental frequency (fo), amplitude (SPL), spectrum, or signal waveform, and are applied individually or as combined indices [2].
Vocal hyperfunction (VH) is an etiologic model of voice disorders in which an increased intrinsic and extrinsic laryngeal muscle tension baseline is assumed [3,4]. Hillman et al. 2020 [5] classified VH as either of (i) non-phonotraumatic vocal hyperfunction (NPVH) or (ii) phonotraumatic vocal hyperfunction (PVH). These two conditions vary in phonatory pathophysiology. PVH is associated with structural lesions of the lamina propria, and consequently with prolonged phonotrauma such as vocal nodules, polyps, and further reactive lesions. In contrast, NPVH is related to primary muscle tension dysphonia (pMTD). Vocal signs and symptoms of VH include dysphonia, increased vocal effort, vocal fatigue, and strain [6,7]. Moreover, elevated activity of the perilaryngeal muscles during phonation related to hyperfunction has been shown to lead to increased pitch and loudness, involuntary voice breaks during phonation, and difficulties in triggering voicing [8].
Despite a quite considerable amount of effort, the literature has not yet indicated a reliable acoustic measure capable of indicating VH [9]. Thus far, a relative increase of fundamental frequency (fo) has been related to an elevated baseline tension in the laryngeal muscles [10]. While alterations may change vocal fold stiffness, our understanding of the complex adaptation of vocal hyperfunction behavior and its effects on fo remains limited. The relative fundamental frequency (RFF) parameter, usually referring to changes in fo control at the phonemic level, has been discussed as a promising acoustic measure to describe voicing onset and offset control. RFF has been shown to discriminate between the PVH and NPVH conditions in adults [11,12,13], to denote treatment effects after voice therapy [12], and to indicate laryngeal tension [14]. However, its implementation as a clinical measure is hindered by its methodological complexity [15], phonetic constraints [16], and dependence on quasi-periodic signals [8].

1.1. Concept of Voice Onset Time

An assessment of voice onset is an integral part of perceptual evaluation in a variety of diagnostic concepts, and is commonly described as vocal attack (rated as soft, breathy, or harsh) [17,18]. The quality of the voicing onset potentially adds information about vocal control and the vibratory behavior of the vocal folds. An objective feasible way to measure vocal onset could improve clinical voice assessment [19].
Voice Onset Time (VOT) is an acoustic measure of the temporal domain. Its calculation relies on the onset of voicing to phonologically distinguish between voiceless [p, t, k] and voiced [b, d, g] stop consonant productions [20,21]. Studies in Brazilian Portuguese (BP) have pointed out that VOT objectively discriminates voicing features (voiced versus voiceless) and place of articulation (bilabial, alveolar, and velar) [22,23], in consonance with other languages, for example, English [23,24,25,26]. VOT has been shown to be influenced by a variety of factors, including language-specific rules, phonetic environment, and prosody [20,27]. Moreover, BP language, the vowel environment, syllable stress, and syllable position may affect VOT [22,23,25]. Thus, these aspects should be considered when interpreting VOT data. Data from BP voiceless bilabial stop [p] productions have shown a VOT duration with a large natural range from 6.90 ms to 28.30 ms [22].
In addition, physiological factors can influence VOT measurements. General voice onset differences related to the place of articulation and voicing depend on numerous factors, such as aerodynamic forces, articulatory movements, and differences in the mass of articulators [20]. Therefore, disturbed phonation involving an imbalance of muscular tension and altered aerodynamic functions, vocal fold mass and stiffness, and articulatory movements or position all have the potential to impact VOT.
Studies carried out on healthy voices have shown that VOT duration in voiceless stop production decreases with increasing pitch [10,27]. The physiological hypothesis is that increased tension in the intrinsic laryngeal musculature related to higher fo leads to a decrease in glottal abduction amplitude, reducing VOT duration. In a recent study, Groll et al. [10] explored the relation between fo, self-reported vocal strain, and vocal effort in a group of sixteen vocally healthy speakers of both genders. The results confirmed that an increase in fo leads to a decrease in VOT duration in voiceless stop production embedded in a carrier phrase. However, these results were not confirmed for the characteristics of strain and vocal effort. In addition, despite SPL rising in both conditions (vocal effort and strain), there was no significant effect on VOT. The authors concluded that vocal effort and strain in typical speakers may be associated with individually different voice techniques and that a temporary increase in vocal effort may be associated with different underlying muscular adjustments as in patients with chronic vocal hyperfunction (VH). This reinforces the hypothesis that VH is related to complex adjustments of intrinsic and extrinsic laryngeal muscles exhibiting recurrent patterns during a certain period of time [5].

1.2. Voice Onset Time in Vocal Hyperfunction

Few studies have applied VOT as an acoustic parameter to investigate voicing onset in patients with VH [28,29,30,31]. Three investigated patients with PVH associated with vocal nodules were compared with a control group in [28,29,30]. Two studies reported a shortening in VOT, but found no significant relation between PVH and VOT [28,30]. In opposition, the other of these works found elongated VOT [29].
Following the perspective that VOT should be shortened in VH, McKenna et al. (2020) [31] compared the voiceless stop production of two groups, 32 women with VH (21 with NPVH and 11 with PVH) and 32 vocally healthy women. In their study, VOT did not distinguish between the groups. A significantly shortened VOT was found only in a subset of women with VH who also had moderate perceptual dysphonia. The authors concluded that the increase in laryngeal muscle tension, as supposed in PVH conditions, may not impact VOT in a consistent way.
A relationship between VOT and VQ was consistently pointed out in two studies [30,31]. Colleti et al. (2022) [30] compared cepstral peak prominence (CPP) and VOT measurements (mean and variability) in stop voiceless production by children with and without vocal fold nodules during the production of Consensus Auditory–Perceptual Evaluation of Voice (CAPE-V) sentences. The authors found a strong positive correlation between CPP and the variability in VOT values for the vocal nodule group and concluded that the more dysphonic voices were, the more variable VOT measurements were.
It remains unclear how the VH condition influences VOT duration. Mehta et al. (2015) [32] described increases in laryngeal muscle tension in both NPVH and PVH, despite their different vocal fold states. In addition, structural laryngeal pathologies may imply differences in vocal fold mass and stiffness, which could impose adaptations in aerodynamic and myoelastic forces and delay voice onset. Findings that VOT decreases as fo increases in healthy voices support the argument that VOT should decrease when laryngeal muscle tension rises [10,33].
In this context, it is important to highlight that increased vocal amplitude (SPL) has been associated with higher laryngeal muscle tonus. Indeed, SPL has been shown to influence measurable VQ in several aspects, with improved acoustic measurement results for jitter, harmonics-to-noise-ratio (HNR), and cepstral peak prominence (CPPS) in both vocally healthy and disordered individuals [34,35] in higher speaking voice intensity levels. Even though it is possible that speaking SPL may affect VOT, this relation was not explored in any of the VOT studies addressing individuals with VH.
In this study, we aim to explore the potential of VOT as an indicator for VH and VQ. Specifically, we investigate whether VH condition and VQ impact the onset of voicing by addressing the followings research questions:
(1)
Does the VH condition influence VOT, fo, and speaking voice intensity?
(2)
Is there a relationship between vocal quality, VOT, fo, and speaking voice intensity?
(3)
Does the phonetic environment influence VOT, fo, and speaking voice intensity?

2. Materials and Methods

In a cross-sectional retrospective study, data from the cases of 31 adults with VH (21 women and 10 men) were selected from a clinical database to constitute the study group. This research was approved by the Ethics Committee of the Federal University of Bahia (letters n. 2.641.558/ICS and 2.761.949/HUPES).

2.1. Database

The original database consisted of cases of adults with voice disorders assessed at the Voice Care Outpatient Clinic of Edgar Santos University Hospital from January 2014 to December 2019. Each case was assigned a code to maintain anonymity. All information about the patients was available in the form of electronic medical patient records. Laryngeal diagnosis was performed by an Otorhinolaryngologist (ORL) at the Ear, Nose, and Throat Ambulatory Outpatient Clinic of Edgar Santos University Hospital. Voice assessments were performed by a speech–language pathology student under the supervision of a speech–language pathology professor from the Federal University of Bahia Department in the Voice Care Outpatient Clinic of Edgar Santos University Hospital. Standard voice assessment consisted of: (i) a patient interview; (ii) a clinical voice examination, including head and postural description, laryngeal extrinsic musculature palpation, laryngeal position, and speech articulation assessment; (iii) vocal quality analysis by CAPE-V protocol [36]; (iv) maximum phonation time measurement; (v) voice recording of CAPE-V sentences, sustained vowel /a/, and spontaneous speech; and (vi) Voice Handicap Index-10 (VHI) [37] or Voice-Related Quality of Life (V-RQOL) [38] questionnaires. It is important to highlight that these data were collected for clinical purposes, and as such they represent an outpatient sample.

2.2. Patient Inclusion Criteria

Suitable cases were selected from institutional medical records and audio recording databases. The inclusion criteria were: (i) medical patient records containing a basic description of the case, including age, gender, laryngeal diagnosis, and voice evaluation; (ii) conclusive laryngeal diagnosis describing structural lesions consistent with phonotrauma or VH without structural laryngeal alteration [5]; and (iii) recording quality requirements, including a Signal-to-Noise-Ratio (SNR) of at least 25 dB [39] and spectrographic type 1 or 2 signals [40] in target syllable vowels.

Diagnosis Criteria of PVH and NPVH

The diagnosis of PVH and NPHV was based on laryngeal findings and patient-reported voice complaints during the interview, both documented in medical records. Laryngeal diagnostics included a visual assessment of laryngeal structures and function with the description of (i) structural lesions consistent with phonotrauma such as benign mass lesions (vocal nodules, polyp, polypoid degeneration, or granuloma), submucosal cyst, or reactive lesions for the PVH group and (ii) without structural laryngeal alteration consistent with pMTD for the NPVH group. VH complaints included signs and symptoms of vocal fatigue, strain, roughness, voice breaks, vocal limitation, increased vocal effort, and neck discomfort [6].

2.3. Description of Included Cases

The examined group consisted of 31 patients with VH, 9 patients with NPVH, and 22 patients with PVH. The patients’ ages ranged between 27 to 77 years, with a mean of 46.6 years (±1.6). The women group age range was 27 to 77, with a mean of 46.1 (±13.7), and the men’s group range was 31 to 65 years, with a mean of 47.5 (±11.0).
The laryngeal pathologies associated with PVH had following distribution: cyst (32%); polypoid degeneration (23%); polyp (18%); vocal fold nodules (14%); and granuloma (14%). Table 1 summarizes the distribution of cases after VH condition by gender.

2.4. Voice Recording Technique and Study Corpus

The audio database was compiled from clinical data recorded during the period of January 2014 to December 2019. All voice recordings were performed in the same place and in a sound-treated acoustic booth. Two different pieces of recording equipment were used during this period: (i) a desktop computer and (ii) a digital recorder. Computer recordings were taken using a monoarticular headset with a unidirectional condenser-type digital microphone (Satellite AE-216, frequency response range 20–15 kHz, sensitivity 64 ± 3 dB) positioned at a 5 cm distance and a 45° angle from the mouth. Praat software [41] was used as an audio interface in a mono channel setting. For the cases with digital recorders, Zoom equipment (model H2n) was set at 90° MS, 4 to 6 mic gain, uncompressed wave, volume 40 to 60, and stereo channel. The recorder was placed at a distance of 15 cm and at a 45° angle from the mouth. The audio files were transferred from the digital recorder to the computer and stored.
All recordings used a 44 kHz sampling rate and 32-bit quantization in .wav audio format. Procedures to calibrate voice SPL were carried to for both types of equipment separately by applying a comparison method, as described in Sampaio et al. (2020) [35].
All voice recordings contained at least a sustained vowel [a], the six CAPE-V sentences adapted for Brazilian Portuguese [42], and a spontaneous speech sample. The CAPE-V sentences were presented to patients on a card, and they were instructed to read the sentences with habitual pitch and loudness. When a patient had difficulty reading, the task was accomplished by repetition.

Composition of Study Corpus

CAPE-V sentences were chosen for analysis because they are commonly used for speech assessment and provide speech samples with a controlled phonetic environment. Four samples of the voiceless bilabial stop [p] were selected for this analysis. The target tokens are displayed in Table 2.
Because the phonetic environment is expected to significantly affect acoustic measurements [24,39], two phonetic features were controlled in this corpus: (i) vowel or diphthong [e, I, ɔ, aj] and (ii) syllable stress, i.e., stressed or unstressed.
For the purpose of analysis, an independent variable concerning the mode of speech task was created. As explained in item 2.4, the CAPE-V sentences could be performed by reading, preferable mode, or by repetition when the patient could not accomplish it by reading. The mode of delivery of speech task (reading versus repetition) was incorporated into the statistical model.

2.5. Perceptual Assessment

Even though the database included information about the clinical perceptual voice examination, this was not used in the present data. A perceptual assessment with CAPE-V sentences was performed using the patient recordings to ensure the homogeneity of voice judgments. Each audio stimulus was constructed with the two target CAPE-V sentences in the same sequence. Thirty-eight stimuli, one for each case, plus 22.5% repeated stimuli to test intra-rater reliability, were assessed by an experienced speech pathologist blind to the study purpose. All audio files were presented randomly through Alvin Experiment Control Software [43]. The perceptual analysis responses were registered directly in the Alvin interface, using a visual analogical scale (VAS) with 100 mm, following the instructions of the CAPE-V protocol [36]. Four voice characteristics were judged: overall severity of dysphonia (OS), roughness, breathiness, and strain. The respective answers were registered in a .txt file within the Alvin Software.
Thereafter, the responses were categorized using a simple conversion: 0 to 9 represented no voice deviation, 10 to 34 mild voice deviation, 35 to 69 moderated voice deviation, and above 70 a severe voice deviation. The intra-rater agreement was verified by the intraclass correlation coefficient (ICC) with 22.5% of retested random samples. ICC estimates and 95% confidence intervals were calculated based on absolute agreement and two-way mixed-effects models. The intraclass correlation for average measures was 0.86 (CI = 0.63–0.97), indicating good intra-rater reliability [44].

2.6. Acoustic Recording Preparation and Analysis

Acoustic analysis and labeling of suitable signal parts were performed using Praat software, version 6.1.40. Figure 1 shows an example of the sound, spectrogram, and TextGrid, with respective labels for the target sounds. Four acoustic measures were derived: VOT (ms); mean syllable fundamental frequency (fo mean) Hz; the variation of syllable fundamental frequency, i.e., fo coefficient of variation (CV_fo) %; and mean syllable voice intensity (SPL) dB(A).

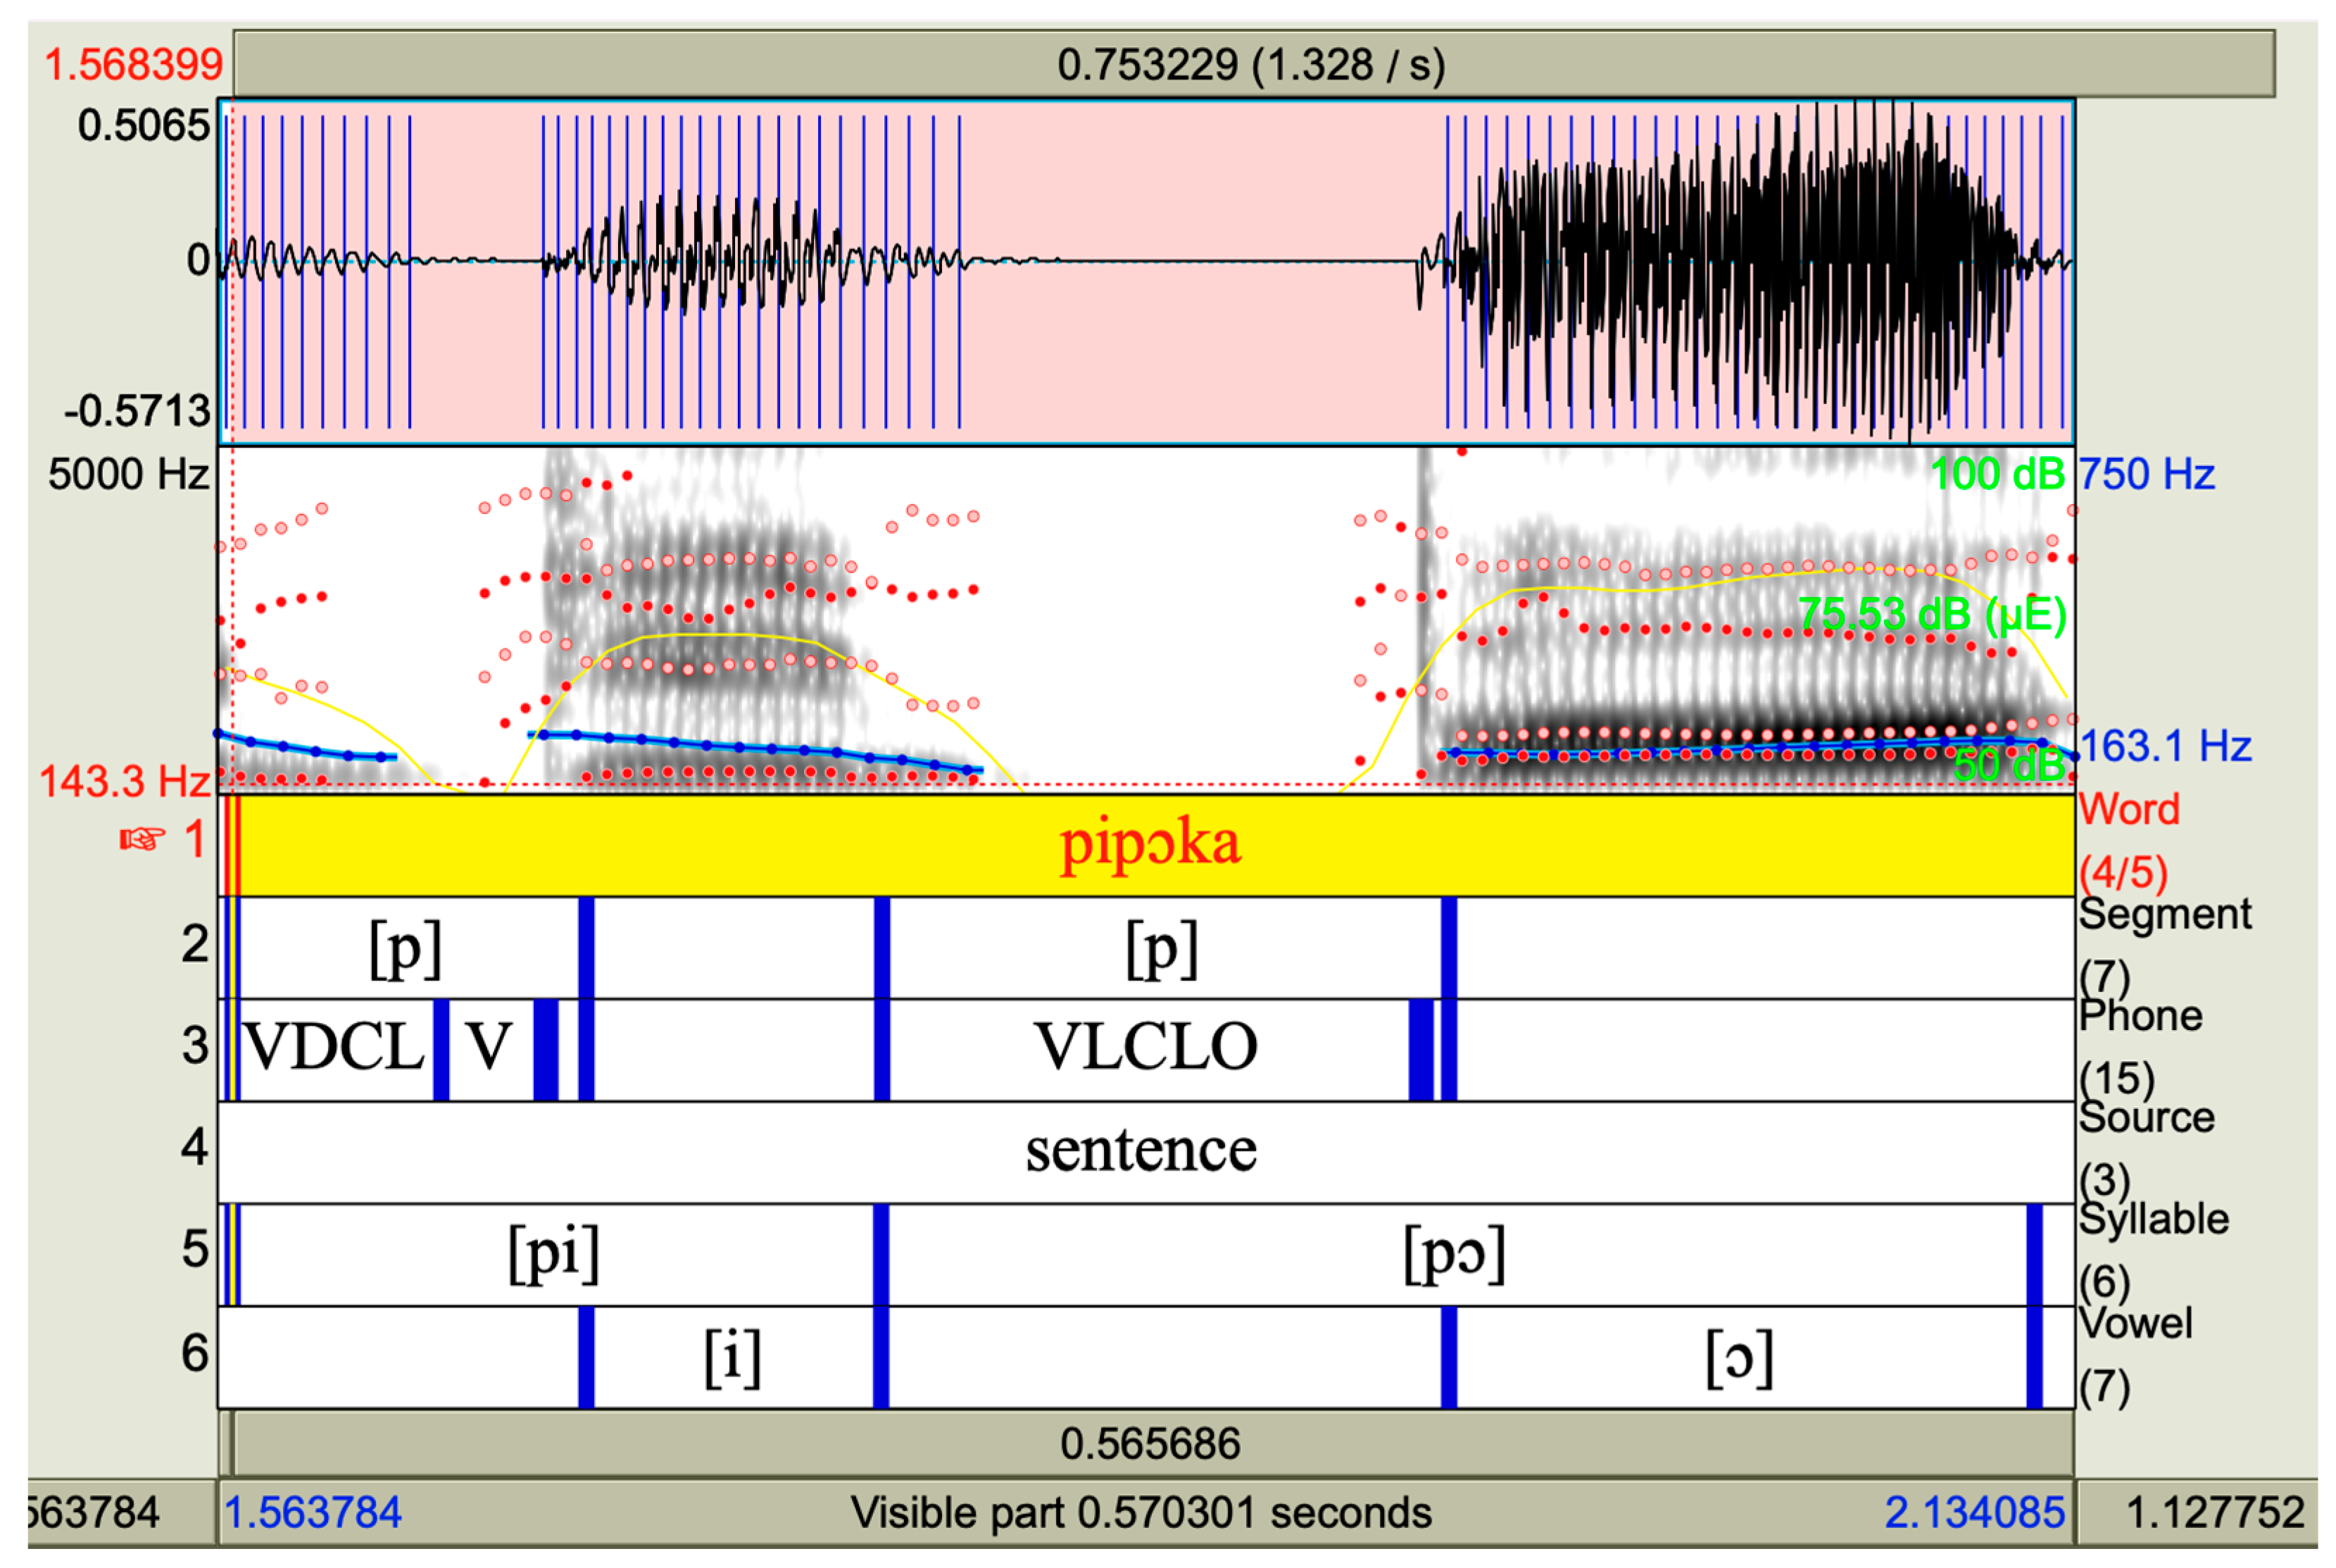
2.6.1. Acoustic Features of the Consonant [p]

The main investigator manually settled all acoustic features of [p] from the sound wave and spectrographic inspections. The beginning of [p] was considered the ending of its preceding vowel, while the final boundary of [p] was the beginning of its following vowel. The vowel pulse, formant track, and perturbation on the sound wave were used as Campo instrumental acoustic cues [45] to settle vowel boundaries. The analysis settings as applied in Praat and the acoustic features of [p] are summarized in Table 3.

2.6.2. Instrumental Acoustic Analysis

All measures were extracted automatically with a custom Praat script [46,47]. The syllable frame ([p] + vowel or diphthong) was considered for extraction of fo and SPL. To determine CV fo, the coefficient of variation was defined as the ratio of standard deviation to the mean (CV = σ/μ) [48]. VOT was defined as the interval between the release of the burst and the first voicing pulse [21]. For analysis procedures, the results for VOT (ms), fo (Hz), and SPL (dB(A)) were exported to a spreadsheet. After that, calibrated SPL values and CV_fo (%) were calculated.
An inspection of VOT measures showed one negative value, which means that in that particular sample the voicing started before the burst. This was considered to be an outlier, and was counted as a missing case in the statistical analysis. Moreover, one sample of the target phone [pi] had no voicing during the following vowel. Therefore, for this sample the parameters VOT, fo, and CV_fo data were counted as missing data in the analysis. In total, 3.2% of the total data (two samples) was excluded from the analysis.

2.7. Statistical Analysis

Statistical analysis was performed with SPSS Statistics (version 25) [49]. Shapiro–Wilk tests were applied to all four dependent variables (VOT, fo, CV_fo, and SPL) to investigate the normality of the data distribution. The results showed a normal distribution for fo (W = 0.99, p = 0.47), SPL (W = 0.98, p = 0.32), and VOT (W = 0.99, p = 0.67) and a non-normal distribution for CV_fo (W = 0.84, p < 0.001). Considering homogeneity of variance as indicated by the Levene statistics (LS), the variables fo (LS = 0.33, p = 0.56), SPL (LS = 0.44, p = 0.50), and VOT (LS = 0.07, p = 0.78) showed homogeneity, while CV_fo (LS = 8.0, p < 0.001) did not. After logarithmic transformation, CV_fo showed normal distribution (W = 0.98, p = 0.12) and homogeneity of variance (LS = 0.71, p = 0.40). Thereafter, all dependent variables were suitable for analysis by parametric statistical tests.
For the first and second aims, to determine the effects of VH condition and VQ on VOT, fo, and SPL, a multivariate analysis of variance (MANOVA) was applied. Two interactions were examined: (i) VH (two levels, NPVH and PVH) and (ii) VQ as represented by the OS (three levels, mild, moderate, and severe). Due to the inequality of samples between groups, Pillai’s Trace was used to interpret the MANOVA results. The significance level (α) was set a priori to p-values less than 0.05 (p < 0.05). Squared partial curvilinear correlation (η2p) was used to interpret effect sizes [50]. Post hoc testing using the Bonferroni method was run for all combinations of interaction effects.
Thereafter, Spearman’s rank correlation coefficient was applied to explore the relation between VOT, fo, SPL, and CV_fo with VQ, because the perceptual voice data (roughness, breathiness, and strain) were non-normally distributed. This analysis considered all three perceptual subcharacteristics of VQ, including roughness, breathiness, and strain, plus the OS. This analysis used numerical values of perceptual judgment (0 to 100) instead of categorical variables (none, mild, moderate, and severe).
For the third aim, in order to determine whether the phonetic environment affects VOT, fo (mean and CV), and SPL, a further MANOVA analysis was applied, with the following interactions: (i) syllable, i.e., following vowel (four levels, [e; I; ɔ and aj]); (ii) syllable stress (two levels, stress or unstressed); and (iii) mode of speech task (two levels, reading or repetition). Again, gender was included as a co-factor.

3. Results

3.1. Descriptive Results

The group was analyzed considering two main characteristics, namely, VH condition and VQ. The case distribution of OS by gender is described in Table 4. Descriptive data for dependent variables are reported in Table 5, split by gender. The mean VOT range for the whole group was 18.87 (±0.72), and was distributed from 0 to 37 ms.

3.2. Effects of VH Condition, OS, and Gender on VOT, fo, and SPL

3.2.1. VH Condition

VH condition (NPVH versus PVH) only affected CV_fo (p = 0.02, ηp2 = 0.04), and did not affect the other investigated variables of VOT, fo, and SPL. The interaction of VH and OS significantly influenced fo (p = 0.01, ηp2 = 0.07), even though VH and OS as isolated characteristics did not significantly affect fo. All of these results are summarized in detail in Table 6.

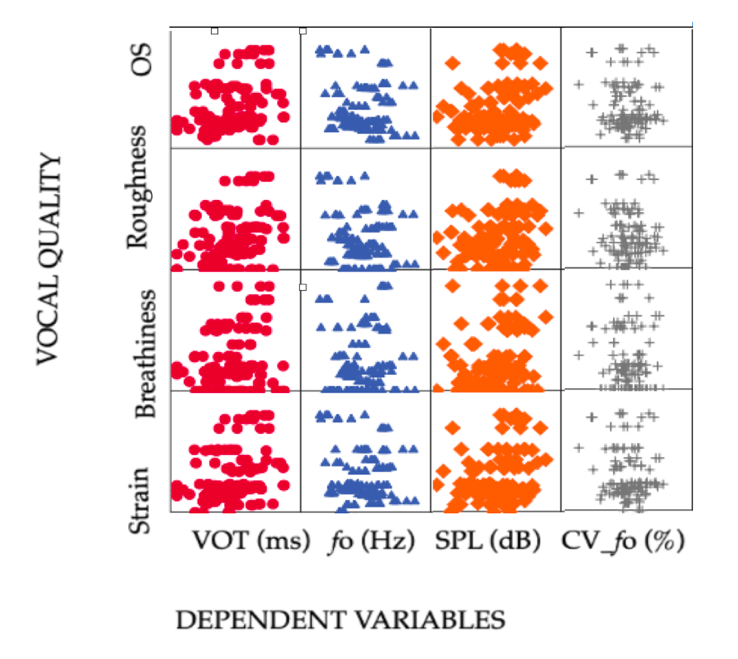
3.2.2. Vocal Quality

According to Table 6, OS had a highly significant influence on VOT, combined with a small effect size (p ≤ 0.001, ηp2 = 0.09). VOT values were greater as the degree of OS increased.
Results of the post hoc Bonferroni test showed that VOT discriminated mild voice deviation (M = 16.67) from moderate deviation (M = 21.621) (p ≤ 0.001) and mild deviation (M = 16.67) from severe voice deviation (M = 24.51) (p ≤ 0.001). Detailed results are available in Table 7.

3.2.3. Gender

Gender had a highly significant influence on both fo and SPL, with a moderate effect size for fo and a small effect size for SPL (p ≤ 0.001, ηp2 = 0.30 and p = 0.01, ηp2 = 0.05, respectively). SPL and fo were greater for the women group than for the men group. No gender effects were found for VOT and CV_fo. All results are described in Table 6.

3.3. Relation of VQ with VOT, fo, and SPL

Spearman‘s rank correlation coefficient (Spearman’s rho) was applied to explore possible correlations between VOT, fo, SPL, and CV_fo and the examined VQ parameters. Figure 2 shows bivariate combinations of the dependent variables and VQ characteristics by scatterplot matrix graphs.
As expected, there was a clear correlation of OS with roughness, breathiness, and strain, which was corroborated by a Spearman’s Rho of r = 0.94 (p ≤ 0.001), r = 0.66 (p ≤ 0.001), and r = 0.87 (p ≤ 0.001), respectively. The results revealed weakly positive and highly significant correlations between VOT and OS (r = 0.34, p ≤ 0.001), roughness (r = 0.29, p ≤ 0.001), breathiness (r = 0.22, p ≤ 0.001), and strain (r = 0.29, p ≤ 0.001). These results indicate longer VOT with more severe OS.
Fundamental frequency showed a weak negative correlation with all perceptual VQ parameters, although the results were not significant: OS (r = −0.11, p = 0.20); roughness (r = −0.08, p = 0.37); breathiness (r = 0.13, p = 0.15); strain (r = −0.02, p = 0.76). In addition, fo showed a weak and non-significant correlation with SPL (r = 0.15, p = 0.11) and CV_fo (r = −0.08, p = 0.34). Voice SPL demonstrated weakly positive and highly significant correlations with all perceptual VQ parameters: OS (r = 0.24, p ≤ 0.001); roughness (r = 0.26, p ≤ 0.001); breathiness (r = 0.25, p ≤ 0.001); and strain (r = 0.26, p ≤ 0.001). SPL had higher values for more deviant VQ.

3.4. Effects of Phonetic Environment on VOT, fo, and SPL

The phonetic characteristics vowel context [I, e, ɔ and ay], syllable stress (stressed or unstressed), and mode of speech task (reading or repetition) were investigated as independent variables that may affect VOT, fo, and SPL. None of the independent variables had an influence on VOT, fo, SPL, and CV_fo. Moreover, the interaction of variables had no effect on the dependent variables.
As expected, gender influenced fo with a small effect size (p ≤ 0.001, ηp2 = 0.33), as well as SPL with a medium effect size (p ≤ 0.001, ηp2 = 0.09), while no influence was found for VOT (p = 6.33, ηp2 = 0.00) and CV_fo (p = 0.60 ηp2 = 0.00).

4. Discussion

In the present study of adults with VH, Voice Onset Time was significantly affected by VQ. This was true for the OS as well as for each subcharacteristic (roughness, breathiness, and strain). In turn, VH condition and phonetic environment did not substantially influence VOT.
Deviations in perceptual voice onset are well-described characteristics of vocal dysfunction [51,52,53]; thus, VOT may have the potential to measure these objectively using acoustic analysis. However, perceptual assessment results are systematically related to speaking SPL. Therefore, a larger clinical study in different age and pathology groups (stratified after PVH diagnosis), including speaking voice SPL as covariable, should explore how useful VOT is as a clinical indicator of voice onset dysfunction.

4.1. VOT Mean Duration

In the present work, VOT measurement results were affected by VQ. Our results for the VH group show a slightly longer VOT mean than those reported in literature, range between 6.90 ms to 28.30 msfor BP bilabial voicelesss [22], though lower than found in one study [54]. Thus, the VOT values reported here are in the expected range for maintaining phonologic distinctions, which is essential for preserving speech intelligibility.
Comparing absolute VOT values between studies is highly challenging because this measure may be affected by phonetic context and individual conditions such as gender, age [24,39], and supposed pathophysiological conditions. In addition, perceptual dysphonia may occur in individuals who consider themselves to be vocally healthy. In this context, it is relevant to point out that this study did not aim to compare VOT data from a voice-disordered group with a control group. Nevertheless, it is reasonable to assume that our data indicate an elongation of VOT with increased dysphonia. This contradicts the hypothesis that VH may reduce VOT duration [28,31], and agrees with the findings reported by Marciniec [29].

4.2. Influence of VH Condition on VOT, fo, and SPL

This study was designed by mixing NPVH and PVH cases to investigate whether the two conditions of VH have different effects on VOT and further so-called traditional voice measures, including mean fo, SPL, and CV_fo. Our findings agree with the results of McKenna et al. [31] in that VH condition did not influence VOT systematically. In addition, there were no differences in fo, SPL, or CV_fo for the NPHV and PHV subgroups.
These results may be partly due to the heterogeneous characteristics of the VH sample, which contained different laryngeal pathologies for PVH and a comparatively low number of cases. Interestingly, the VH condition only affected fo when interacting with OS, despite none of the two significantly influencing in isolation fo. Further studies with a larger group of patients with identical phonotraumatic tissue lesions and equally distributed by gender would allow stratified analysis by gender, supporting a more detailed understanding of the interactions of VH, fo, and gender.
Previous reports have pointed out that PVH does not differentiate from typical voices for average fo and SPL [55,56,57], supporting the view that patients with VH use different physiological strategies to maintain a functional voice. Therefore, other approaches for fo and SPL must be implemented in order to better describe VH. Several studies have shown that RFF can indicate the condition of VH and track the treatment changes [8]. As RFF is a measure of fo related to the onset of voicing, future studies associating RFF with VOT could add more information on VH behavior.

4.3. VQ Is Correlated with VOT

Two conditions of VH were analyzed in this study: one group with PHV associated with five different laryngeal pathologies and one group with NPHV. All VH conditions have examples of three-grade deviant VQ (mild, moderate, and severe), despite not being equally distributed by gender.
In our data, all VQ characteristics correlate with VOT, which is in consonance with similar studies [30,31]. VQ can range from not deviant to severely deviant in patients with VH, and is not a key determinant to distinguish patients in the NPVH group between those from the PVH group. In other words, the presence or absence of a phonotraumatic structural lesion is insufficient to indicate the degree of vocal deviation. Furthermore, it is essential to consider that vocal tract adjustments are critical to vocal output and the phenomenon of dysphonia.
Based on our findings, we conclude that voicing onset, even as measured objectively, seems to play an important role in the perception of VQ deviation. From a broad perspective, our findings show that the more deviant the VQ is, the longer the VOT duration. Furthermore, the VOT Confidence Interval, i.e., the data spread, increased as the OS became more severe. All vocal parameters composing VQ, namely, roughness, breathiness, and strain, were significantly correlated with VOT, while vocal strain and roughness had a highly significant association. This endorses the assumption that increased tension in the vocal mechanism, as represented by audible strain and roughness (increased adduction), impacts the voicing onset and perceptual VQ.

4.4. Influence of Phonetic Environment

One main methodological concern of this study was using speech material available in clinical voice recordings. Taking advantage of recording procedures already widely used in voice clinics may allow an improvement of voice diagnostics without adding more speech tasks, thereby risking overloading the patient. Furthermore, as these data are from a clinical database, they represent an investigation of realistic materials. The CAPE-V sentences are widely applied, and have the advantage of providing a standardized phonetic speech environment despite not being phonetically balanced. In this way, it is possible to guarantee the constancy and reproducibility of the phonetic context.
The corpus proposed in this study is composed of the voiceless bilabial stop [p], with three combinations of vowels and one gliding vowel [e, I, ɔ and aj], two combinations of stress (stressed and unstressed), and two modes of speech task (repetition and reading). Although BP studies claim that the phonetic environment may affect VOT measurements [22,23,25], we did not find a relation with a vowel after [p], syllable stress, or mode of speech task in the present study.
Considering the individuals’ characteristics in the phonetic environment, gender showed a strong relationship with both mean fo and SPL, which is in alignment with the literature [20]. Xuanda [58] pointed out that VOT tends to be reduced in elderly people. Thus, heterogeneity between the groups in terms of age may have affected the present acoustic measurements, which may have partially masked potential phoneticf context effects. Due to the comparatively small sample size, we did not stratify by age or different combinations of phonetic environments; this would call for an expanded study with more patients of different ages, including a larger variety of samples.

4.5. Gender Effects

In the present work, both gender groups were investigated. Thus, as far as we know, this is the first work systematically observing VOT in men with VH. In fact, despite men and women having differences in physiology related to the size of the vocal tract and vocal folds that could potentially influence the voicing onset, there are no reliable indicators in the literature to indicate whether VOT is gender sensitive. As expected, gender strongly influenced both fo and SPL for the case characteristics (VH condition and VQ) and the phonetic environment characteristics (vowel, syllable stress, and mode of speech task). Therefore, it is important to consider gender as a variable in voice analysis for numerous variables. However, future studies should investigate a larger sample of vocally healthy and voice-disordered women and men while applying gender as a dependent variable in order to verify whether VOT is genuinely independent of gender-related physiological differences and behavior.

4.6. Clinical Relevance and Future Directions

Beyond the language and phonetic conditions, VOT is speaker-specific and varies over time [20,58]. Even in typical speech, there are many gaps in understanding the onset of voicing and its complex relationship with the individuality of speakers and universal principles. Voice disorders represent a challenging situation regarding the complex interaction of multiple dimensions. further research is necessary in order to understand the short-term fluctuations in VOT and how it establishes a long-term changing trend in pathological voice mechanisms.
Voice quality has been addressed in acoustic analysis mainly by fo, SPL control, harmonicity, and noise measurements. However, in the present work VOT showed the potential to provide objective, and as such universally replicable information about the onset of voicing with VQ. Because a disturbed voice onset is considered one of the main characteristics of a dysphonic voice, this adds a new perspective and dimension to objective voice analysis [59,60].

5. Conclusions

The present work aimed to explore the potential of VOT as an indicator of VH condition (NPVH or PVH) and VQ. Productions of [p] in CAPE-V sentences were analyzed, and the effect of VH condition and VQ were explored. VOT was not associated with the VH condition, while it was associated with the OS and had a high degree of relation to perceptual roughness and strain. Considering the phonetic environment factors, vowel context, syllable stress, and mode of speech task had no influence on the dependent variables. Because deviations in perceptual voice onset are well-described characteristics of vocal dysfunction, VOT shows the potential to objectively characterize the onset of voicing related to vocal quality. These results should be confirmed in a larger clinical study of women and men in different age groups and with larger pathology groups stratified according to PVH diagnosis.

Author Contributions

Conceptualization, M.F.d.P.S.; Data curation, M.S.; Investigation, M.F.d.P.S.; Methodology, M.F.d.P.S. and M.B.-B.; Supervision, M.B.-B.; Writing—original draft, M.F.d.P.S.; Writing—review and editing, M.S. and M.B.-B. All authors have read and agreed to the published version of the manuscript.

Funding

This research received no external funding.

Institutional Review Board Statement

The present study is part of an ongoing larger project entitled “Studying the Behavior of Acoustic Measures of the Praat Program in Voice Evaluation” approved by the Ethics Committee of the Federal University of Bahia (letters n. 2.641.558/ICS and 2.761.949/HUPES).

Informed Consent Statement

Written informed consent has been obtained from the patient(s) to publish the results of this study.

Acknowledgments

We gratefully acknowledge all patients, students, and professors that contributed in one way or another to the database used in this study. In addition, a special thanks to José Joaquim Araújo Filho who contributed to editing the paper.

Conflicts of Interest

The authors have no conflict of interest to disclose.

References

  1. Kreiman, J.; Gerratt, B. Measuring Vocal Quality. In Voice Quality Measurement; Kent, R., Ball, M.J., Eds.; Singular Publishing Group: San Diego, CA, USA, 2000; Volume 1, pp. 73–101. [Google Scholar]
  2. Buder, E.H. Acoustic Analysis of Voice Quality: A tabulation of Algorithms 1902–1990. In Voice Quality Measurement; Kent, R., Ball, M., Eds.; Singular Publishing Group: San Diego, CA, USA, 2000; pp. 119–244. [Google Scholar]
  3. Hillman, R.E.; Holmberg, E.B.; Perkell, J.S.; Walsh, M.; Vaughan, C. Objective Assessment of Vocal Hyperfunction: An experimental framework and initial results. J. Speech Lang. Hear. Res. 1989, 32, 373–392. [Google Scholar] [CrossRef] [PubMed]
  4. Hillman, R.E.; Holmberg, E.B.; Perkell, J.S.; Walsh, M.; Vaughan, C. Phonatory function associated with hyperfunctionally related vocal fold lesions. J. Voice 1990, 4, 52–63. [Google Scholar] [CrossRef]
  5. Hillman, R.E.; Stepp, C.E.; Van Stan, J.H.; Zañartu, M.; Mehta, D.D. An Updated Theoretical Framework for Vocal Hyperfunction. Am. J. Speech-Lang. Pathol. 2020, 29, 2254–2260. [Google Scholar] [CrossRef] [PubMed]
  6. Solomon, N.P. Vocal fatigue and its relation to vocal hyperfunction. Int. J. Speech-Lang. Pathol. 2008, 10, 254–266. [Google Scholar] [CrossRef]
  7. Hunter, E.J.; Cantor-Cutiva, L.C.; van Leer, E.; van Mersbergen, M.; Nanjundeswaran, C.D.; Bottalico, P.; Sandage, M.J.; Whitling, S. Toward a Consensus Description of Vocal Effort, Vocal Load, Vocal Loading, and Vocal Fatigue. J. Speech Lang. Hear. Res. 2020, 63, 509–532. [Google Scholar] [CrossRef]
  8. Roy, N.; Fetrow, R.A.; Merrill, R.M.; Dromey, C. Exploring the Clinical Utility of Relative Fundamental Frequency as an Objective Measure of Vocal Hyperfunction. J. Speech Lang. Hear. Res. 2016, 59, 1002–1017. [Google Scholar] [CrossRef]
  9. Lopes, L.W.; Batista Simoes, L.; Delfino da Silva, J.; da Silva Evangelista, D.; da Nobrega, E.U.A.C.; Oliveira Costa Silva, P.; Jefferson Dias Vieira, V. Accuracy of Acoustic Analysis Measurements in the Evaluation of Patients with Different Laryngeal Diagnoses. J. Voice 2017, 31, 382.e15–382.e26. [Google Scholar] [CrossRef]
  10. Groll, M.D.; Hablani, S.; Stepp, C.E. The Relationship Between Voice Onset Time and Increase in Vocal Effort and Fundamental Frequency. J. Speech Lang. Hear. Res. 2021, 64, 1197–1209. [Google Scholar] [CrossRef]
  11. Heller Murray, E.S.; Lien, Y.S.; Van Stan, J.H.; Mehta, D.D.; Hillman, R.E.; Pieter Noordzij, J.; Stepp, C.E. Relative Fundamental Frequency Distinguishes Between Phonotraumatic and Non-Phonotraumatic Vocal Hyperfunction. J. Speech Lang. Hear. Res. 2017, 60, 1507–1515. [Google Scholar] [CrossRef] [Green Version]
  12. Stepp, C.E.; Merchant, G.R.; Heaton, J.T.; Hilmann, R.E. Effects of Voice Therapy on Relative Fundamental Frequency During Voicing Offset and Onset in Patients with Vocal Hyperfunction. J. Speech Lang. Hear. Res. 2011, 54, 1260–1266. [Google Scholar] [CrossRef] [Green Version]
  13. Stepp, C.E.; Hillman, R.E.; Heaton, J.T. The Impact of Vocal Hyperfunction on Relative Fundamental Frequency During Voicing Offset and Onset. J. Speech Lang. Hear. Res. 2010, 53, 1220–1226. [Google Scholar] [CrossRef] [PubMed]
  14. McKenna, V.S.; Heller Murray, E.S.; Lien, Y.-A.S.; Stepp, C.E. The Relationship Between Relative Fundamental Frequency and a Kinematic Estimate of Laryngeal Stiffness in Healthy Adults. J. Speech Lang. Hear. Res. 2016, 19, 1283–1294. [Google Scholar] [CrossRef] [PubMed] [Green Version]
  15. Groll, M.D.; Vojtech, J.M.; Hablani, S.; Mehta, D.D.; Buckley, D.P.; Noordzij, J.P.; Stepp, C.E. Automated Relative Fundamental Frequency Algorithms for Use with Neck-Surface Accelerometer Signals. J. Voice 2022, 36, 156–169. [Google Scholar] [CrossRef] [PubMed]
  16. Lien, Y.A.S.; Gattuccio, C.I.; Stepp, C.E. Effects of Phonetic Context on Relative Fundamental Frequency. J. Speech Lang. Hear. Res. 2014, 57, 1259–1267. [Google Scholar] [CrossRef] [PubMed] [Green Version]
  17. Behlau, M.; Madazio, G.; Feijo, D.; Pontes, P. Avaliação de Voz. In Voz O Livro do Especialista, 1st ed.; Behlau, M., Ed.; Revinter: Rio de Janeiro, Brazil, 2000; Volume 1, pp. 85–180. [Google Scholar]
  18. Koike, Y. Experimental Studies on Vocal Attack. Pr. Oto-Rhino-Laryngol. 1967, 60, 663–688. [Google Scholar] [CrossRef] [Green Version]
  19. Maryn, Y.; Poncelet, S. How Reliable Is the Auditory-Perceptual Evaluation of Phonation Onset Hardness? J. Voice 2021, 35, 869–875. [Google Scholar] [CrossRef]
  20. Cho, T.; Ladefoged, P. Variation and universals in VOT: Evidence from 18 languages. J. Phon. 1999, 27, 207–229. [Google Scholar] [CrossRef]
  21. Lisker, L.; Abramson, A.S. A Cross-Language Study of Voicing in Initial Stops: Acoustical Measurements. Word 1964, 20, 384–422. [Google Scholar] [CrossRef] [Green Version]
  22. Klein, S. Estudo do VOT no Português Brasileiro; Universidade Federal de Santa Catarina: Florianópolis, Brazil, 1999. [Google Scholar]
  23. Schwartzhaupt, B. Factors Influencing Voice Onset Time: Analyzing Brazilian Portuguese, English and Interlanguage Data; Universidade Federal do Rio Grande do Sul: Porto Alegre, Brazil, 2012. [Google Scholar]
  24. Silva, T.C.; Seara, I.C.; Silva, A.; Rauber, A.S.; Cantoni, M.M. Fonética Acústica. Os Sons do Português Brasileiro; Editora Contexto: São Paulo, Brazil, 2019. [Google Scholar]
  25. Alves, M.A. Estudo dos Parâmetros Acústicos Relacionados à Produção das Plosivas do Português Brasileiro na Fala Adulta: Análise Acústico-Quantitativa; Universidade Federal de Santa Catarina: Florianópolis, Brazil, 2015. [Google Scholar]
  26. Keating, P.A. Universal phonetics and the organization of grammars. In Phonetic Linguistics: Essays in Honor of Peter Ladefoged; Fromkin, V.A., Ed.; Academic Press: Oxford, UK, 1985; pp. 115–132. [Google Scholar]
  27. Narayan, C.; Bowden, M. Pitch affects voice onset time (VOT): A cross-linguistic study. In Proceedings of the Meeting on Acoustics, Montreal, QC, Canada, 2–7 June 2013. [Google Scholar]
  28. Park, S.-Y.; Kim, S.-T.; Kim, S.-Y.; Choi, S.-H.; Roh, J.-L.; Nam, S.-Y. Voice Onset Time in Patients with Bilateral Vocal Nodules. J. Korean Soc. Laryngol. Phoniatr. Logop. 2006, 17, 107–110. [Google Scholar]
  29. Marciniec, S.A. Voice Onset Time of Women with Vocal Nodules; Rush University, ProQuest Dissertations Publishing: Chicago, IL, USA, 2009. [Google Scholar]
  30. Colletti, L. Voice Onset Time in Children with and without Vocal Fold Nodules; Temple University: Philadelphia, PA, USA, 2022; Available online: http://hdl.handle.net/20.500.12613/7709 (accessed on 5 October 2022).
  31. McKenna, V.S.; Hylkema, J.A.; Tardif, M.C.; Stepp, C.E. Voice Onset Time in Individuals with Hyperfunctional Voice Disorders: Evidence for Disordered Vocal Motor Control. J. Speech Lang. Hear. Res. 2020, 63, 405–420. [Google Scholar] [CrossRef]
  32. Mehta, D.D.; Van Stan, J.H.; Zañartu, M.; Ghassemi, M.; Guttag, J.V.; Espinoza, V.M.; Cortés, J.P.; Cheyne, H.A.; Hillman, R.E. Using Ambulatory Voice Monitoring to Investigate Common Voice Disorders: Research Update. Front. Bioeng. Biotechnol. 2015, 3, 155. [Google Scholar] [CrossRef] [Green Version]
  33. McCrea, C.R.; Morris, R.J. The Effects of Fundamental Frequency Level on Voice Onset Time in Normal Adult Male Speakers. J. Speech Lang. Hear. Res. 2005, 48, 1013–1024. [Google Scholar] [CrossRef] [PubMed]
  34. Bohlender, J.E.; Mehta, D.D. Acoustic Perturbation Measures Improve with Increasing Vocal Intensity in Individuals with and without Voice Disorders. J. Voice 2017, 32, 162–168. [Google Scholar] [CrossRef] [Green Version]
  35. Sampaio, M.; Vaz Masson, M.L.; de Paula Soares, M.F.; Bohlender, J.E.; Brockmann-Bauser, M. Effects of Fundamental Frequency, Vocal Intensity, Sample Duration, and Vowel Context in Cepstral and Spectral Measures of Dysphonic Voices. J. Speech Lang. Hear. Res. 2020, 63, 1326–1339. [Google Scholar] [CrossRef] [PubMed]
  36. Kempster, G.B.; Gerratt, B.R.; Abbott, K.V.; Barkmeier-Kraemer, J.; Hillman, R.E. Consensus Auditory-Perceptual Evaluation of Voice: Development of a Standardized Clinical Protocol. Am. J. Speech-Lang. Pathol. 2009, 18, 124–132. [Google Scholar] [CrossRef] [Green Version]
  37. Behlau, M.; Alves dos Santos, L.d.M.; Oliveira, G. Cross-Cultural Adaptation and Validation of the Voice Handicap Index Into Brazilian Portuguese. J. Voice 2011, 25, 354–359. [Google Scholar] [CrossRef] [PubMed]
  38. Gasparini, G.; Behlau, M. Quality of Life: Validation of the Brazilian Version of the Voice-Related Quality of Life (V-RQOL) Measure. J. Voice 2009, 23, 76–81. [Google Scholar] [CrossRef]
  39. Barbosa, P.A.; Madureira, S. Manual de Fonética Acústica Experimental: Aplicações a Dados do Português, 1st ed.; Cortez Publisher: São Paulo, SP, Brazil, 2015; p. 591. [Google Scholar]
  40. Titze, I.R. Toward standards in acoustic analysis of voice. J. Voice 1994, 8, 1–7. [Google Scholar] [CrossRef]
  41. Boersma, P.; Weenink, D. Praat: Doing Phonetics by Computer [Computer Program], version 6.2.06; 2022. Available online: https://www.praat.org (accessed on 1 February 2022).
  42. Behlau, M.; Rocha, B.; Englert, M.; Madazio, G. Validation of the Brazilian Portuguese CAPE-V Instrument-Br CAPE-V for Auditory-Perceptual Analysis. J. Voice 2022, 36, 586.e15–586.e20. [Google Scholar] [CrossRef]
  43. Hillenbrand, J.M.; Gayvert, R.T.; Clark, M.J. Phonetics Exercises Using the Alvin Experiment-Control Software. J. Speech Lang. Hear. Res. 2015, 58, 171–184. [Google Scholar] [CrossRef] [Green Version]
  44. Koo, T.K.; Li, M.Y. A Guideline of Selecting and Reporting Intraclass Correlation Coefficients for Reliability Research. J. Chiropr. Med. 2016, 15, 155–163. [Google Scholar] [CrossRef] [Green Version]
  45. Kent, R.A.; Read, C. The Acoustic Analysis of Speech; Singular Publishing Group: San Diego, CA, USA, 1992; p. 238. [Google Scholar]
  46. Kang, J.; Whalen, D.H. Get VOT Script. Available online: https://github.com/HaskinsLabs/get_vot#readme (accessed on 20 June 2021).
  47. Kawahara, S. get_intensity_minmax.praat. Available online: http://user.keio.ac.jp/~kawahara/scripts/get_intensity_minmax.praat (accessed on 20 June 2021).
  48. Bennett, B.M. On multivariate coefficients of variation. Stat. Hefte 1977, 18, 123–128. [Google Scholar] [CrossRef]
  49. IBM Corp. SPSS Statistics for Machintosh; IBM Corp.: Armonk, NY, USA, 2017. [Google Scholar]
  50. Peterson, S.J.; Foley, S. Clinician’s Guide to Understanding Effect Size, Alpha Level, Power, and Sample Size. Nutr. Clin. Pract. 2021, 36, 598–605. [Google Scholar] [CrossRef] [PubMed]
  51. Andrade, D.F.; Heuer, R.; Hockstein, N.E.; Castro, E.; Spiegel, J.R.; Sataloff, R.T. The frequency of hard glottal attacks in patients with muscle tension dysphonia, unilateral benign masses and bilateral benign masses. J. Voice 2000, 14, 240–246. [Google Scholar] [CrossRef] [PubMed]
  52. Uygun, M.N.; Esen Aydinli, F.; Aksoy, S.; Ozcebe, E. Turkish Standardized Reading Passage for the Evaluation of Hard Glottal Attack Occurrence Frequency. J. Voice 2017, 32, 51–56. [Google Scholar] [CrossRef] [PubMed]
  53. Revis, J.; Giovanni, A.; Triglia, J.M. Influence of voice onset on the perceptual analysis of dysphonia. Folia Phoniatr Logop. 2002, 54, 19–25. [Google Scholar] [CrossRef]
  54. Alves, M.A.; Dias, E.C.O. Estudo da produção do VOT em plosivas não-vozeadas diante de vogal alta anterior e posterior no português brasileiro. In Proceedings of the IX Encontro do Celsul, Palhoça, SC, Brazil, 20–22 October 2010. [Google Scholar]
  55. Van Stan, J.H.; Mehta, D.D.; Zeitels, S.M.; Burns, J.A.; Barbu, A.M.; Hillman, R.E. Average Ambulatory Measures of Sound Pressure Level, Fundamental Frequency, and Vocal Dose Do Not Differ Between Adult Females with Phonotraumatic Lesions and Matched Control Subjects. Ann. Otol. Rhinol. Laryngol. 2015, 124, 864–874. [Google Scholar] [CrossRef] [PubMed] [Green Version]
  56. Espinoza, V.M.; Zañartu, M.; Van Stan, J.H.; Mehta, D.D.; Hillman, R.E. Glottal Aerodynamic Measures in Women with Phonotraumatic and Nonphonotraumatic Vocal Hyperfunction. J. Speech Lang. Hear. Res. 2017, 60, 2159–2169. [Google Scholar] [CrossRef] [PubMed]
  57. Van Stan, J.H.; Mehta, D.D.; Ortiz, A.J.; Burns, J.A.; Toles, L.E.; Marks, K.L.; Vangel, M.; Hron, T.; Zeitels, S.; Hillman, R.E. Differences in Weeklong Ambulatory Vocal Behavior Between Female Patients with Phonotraumatic Lesions and Matched Controls. J. Speech Lang. Hear. Res. 2020, 63, 372–384. [Google Scholar] [CrossRef]
  58. Chen, X.; Xiong, Z.; Hu, J. The Trajectory of Voice Onset Time with Vocal Aging. In Proceedings of the Interspeech, Hyderabad, India, 2–6 September 2018; pp. 1556–1560. [Google Scholar]
  59. Colton, R.H.; Casper, J.K.; Leonard, R. Compreendendo os Problemas da Voz—Uma Perspectiva Fisiológica no Diagnóstico e Tratamento das Disfonias, 3rd ed.; Revinter: Rio de Janeiro, Brazil, 2010. [Google Scholar]
  60. Hecker, P.; Steckhan, N.; Eyben, F.; Schuller, B.W.; Arnrich, B. Voice Analysis for Neurological Disorder Recognition—A Systematic Review and Perspective on Emerging Trends. Front. Digit. Health 2022, 4, 842301. [Google Scholar] [CrossRef]
Figure 1. Screenshot of Praat with oscillogram, spectrogram, TextGrid borders, and labeling (from top to bottom).
Applsci 13 08956 g001
Figure 2. Scatterplot distribution of Voice Onset Time (ms) indicated as a red round symbol, fundamental frequency (fo) indicated as a blue triangle, sound pressure level (SPL) indicated as an orange diamond, and fundamental frequency coefficient of variation (CV_fo %) indicated as a grey cross, with the vocal quality parameters overall severity of dysphonia, roughness, breathiness, and strain.
Applsci 13 08956 g002
Table 1. Distribution of patients according to gender and vocal hyperfunction condition.
Men (n)Women (n)Total (n)%
Vocal HyperfunctionNPVH36929
PVH7152271
Table 2. Target tokens from Brazilian Portuguese CAPE-V sentences in IPA and orthographic form, word, following vowel and syllable stress pattern.
SentenceWordVowelStress
[ɛ’.ɾi.kə to.m’ow s’u.kw ʤɪ p’e.ɾɐ ya.m’ɔ.ɾɐ]/p’e.ɾa/[e]Stressed
Erica tomou suco de pera e amora
[pa. pˈaj tr ˈo.ʃi pi.pˈɔ.kɐ kˈẽ.tʃi]/pa.p’aj/[aj]Unstressed
Papai trouxe pipoca quente/pi.p’ɔ.ka/[I]Unstressed
/pi.p’ɔ.ka/[ɔ]Stressed
Table 3. Description of analysis settings in Praat and acoustic features of [p].
DisplaySetting
SpectrogramView range (Hz): 0.0 to 5.00
Window length (s): 0.005
Dynamic Range (dB): 40.0
Pitch settingView range (Hz): 75 to 500
Unit: Hertz
Analysis method: Cross correlation
Drawing method: Automatic
Formant trackingDefault setting
IntensityDefault setting
Window zoom to set voicing boundary20 to 50 ms
[p] Acoustic FeatureDescription *
Voiced closure interval (VDCLO)The voiced portion of the stop closure
Voiceless closure interval (VLCLO)The voiceless portion of the stop closure
Release (REL)Release of the burst
Aspiration (ASP)The aspiration after the burst
Note: * Definitions are described in Kang and Whalen [46].
Table 4. Distribution of overall severity of dysphonia by gender.
Overall Severity of DysphoniaMen (n)Women (n)Total (n)%
Mild8111961.29
Moderate17825.81
Severe13412.90
Total102131100
Table 5. Descriptive results for VOT (ms), fo (Hz), SPL (dB(A)), and CV_fo (%), split by gender.
Gender nMeanSDRangeMinimumMaximum
MenVOT4019.398.1837037
fo40134.7426.07103.078.0180.0
SPL4055.815.1720.645.0365.63
CV_ƒo401.240.261.300.531.83
WomenVOT8318.627.9336036
fo83185.0739.32200.080281
SPL8458.514.3219.8448.3668.20
CV_ƒo831.28.3421.80.222.02
Abbreviations: n = number of included samples; SD = Standard Deviation; VOT = Voice Onset Time (ms); fo = fundamental frequency (Hz), CV_ƒo = Coefficient of variation of fundamental frequency (%), and SPL = sound level pressure (dB(A)).
Table 6. Multivariate ANOVA results for vocal hyperfunction and overall severity of dysphonia as independent variables, with VOT, fo, SPL, and CV_fo as dependent variables, including gender as a co-variable.
EffectDependent VariableFp-ValuePartial
Eta-Square (η2p)
Interpretation
Effect Size
GenderVOT2.450.120.02
Fo48.900.000.30Moderate
SPL6.800.010.05Small
CV_fo2.050.150.02
VHVOT0.010.900.00
Fo3.200.070.03
SPL0.260.600.00
CV_fo5.040.020.04Small
OSVOT6.240.000.09Small
Fo0.000.990.00
SPL1.360.260.02
CV_fo0.360.690.00
VH × OSVOT1.280.280.22
Fo4.400.010.07Small
SPL0.100.900.00
CV_ fo0.140.870.00
Note: Significant values are shown in bold. Abbreviation: η2p = partial eta squared, indicating effect size; VH = vocal hyperfunction; OS = overall severity of dysphonia; VOT = Voice Onset Time (ms); fo = fundamental frequency (Hz); SPL = sound pressure level (dB(A)) and CV_fo = coefficient of variation of fundamental frequency (%).
Table 7. Bonferroni multivariate comparisons result for overall severity of dysphonia and VOT, ƒo, SPL, and CV_ƒo.
Dependent Variable(I) OS(J) OSMean Difference (I-J)Std. ErrorSig95% CI
Lower BoundUpper
Bound
VOTmildmoderate−4.81 1.570.00−8.62−0.99
severe−7.84 2.020.00−12.76−2.92
moderatesevere−3.032.260.55−8.532.47
fomildmoderate−15.117.250.12−32.752.53
severe1.379.351.00−21.3824.11
moderatesevere16.4810.460.35−8.9541.90
SPLmildmoderate−1.990.950.12−4.290.32
severe−2.841.220.06−5.820.13
moderatesevere−0.861.371.00−4.202.46
CV_fomildmoderate0.060.060.89−0.090.23
severe0.000.081.00−0.200.21
moderatesevere−0.060.091.00−0.290.17
Note: Significant values are shown in bold.
Disclaimer/Publisher’s Note: The statements, opinions and data contained in all publications are solely those of the individual author(s) and contributor(s) and not of MDPI and/or the editor(s). MDPI and/or the editor(s) disclaim responsibility for any injury to people or property resulting from any ideas, methods, instructions or products referred to in the content.

