Article

Dynamic Monitoring and Analysis of Mining Land Subsidence in Multiple Coal Seams in the Ehuobulake Coal Mine Based on FLAC3D and SBAS-InSAR Technology

1
College of Geology and Mines Engineering, Xinjiang University, Urumqi 830046, China
2
Key Laboratory of Environmental Protection Mining for Minerals Resources at Universities of Education, Department of Xinjiang Uygur Autonomous Region, Xinjiang University, Urumqi 830047, China
3
Kuqa Yushuling Coal Mine Co., Ltd., Kuqa 652902, China
*
Author to whom correspondence should be addressed.
Appl. Sci. 2023, 13(15), 8804; https://doi.org/10.3390/app13158804
Submission received: 12 June 2023 / Revised: 24 July 2023 / Accepted: 27 July 2023 / Published: 30 July 2023
(This article belongs to the Special Issue Remote Sensing Technology in Landslide and Land Subsidence)

Abstract

:
Aiming at the land subsidence problem caused by multiple coal seam mining in the Ehuobulake Coal Mine, this paper, considering the geological conditions of the first and fifth layers of coal, adopts the method of combining FLAC3D numerical simulation and SBAS-InSAR technology to analyze the dynamic evolution law of land subsidence amount and range under multiple coal seam repeated mining conditions. The reliability of the technology is verified by the field GPS monitoring data. The results show that, under the mining condition of multiple coal seams in the Ehuobulake Coal Mine, the land subsidence presents obvious asymmetry, and the size and range of the land subsidence in the mining area further increase due to the mining of lower layer coal. FLAC3D simulation results show that the maximum land subsidence is −211.8 mm. The results of SBAS-InSAR monitoring show that the maximum land subsidence is −225 mm, and the land subsidence obtained by the two methods has a high degree of fitting. The method of combining FLAC3D and InSAR technology can accurately and reliably monitor and analyze the land subsidence under the repeated mining of multiple coal seams in the mining area. It can provide effective guidance for the stability analysis of mined-out areas and the prediction of the influence of repeated mining on ground deformation.

1. Introduction

Underground mining of mineral resources will break the original stress balance state of the overlying strata, causing stress redistribution and overlying strata movement. With the expansion of the mined-out areas to a certain range, the strata movement will spread upward to the surface, causing subsidence and deformation of the surface [1]. Subsidence is one of the most important hazards related to underground mining activities. Ground surface displacement is triggered due to the excavation or failure of mining exploitations, and it may produce severe damages to urban structures and infrastructures located within the area of exploitation [2]. Therefore, mine surface deformation monitoring is the basis of disaster prevention and control. Traditional monitoring technologies such as GPS and leveling can obtain deformation data of discrete ground points [3,4]. However, there are defects such as long cycle, large workload, single-point monitoring, and small monitoring scope, which cannot reflect the overall condition of ground deformation in the mining areas [5,6,7]. The rapid development of remote sensing methods allows exploring the possibilities of their use for monitoring ground surface deformation. Among these methods, differential synthetic aperture radar interferometry (DInSAR) has proven to be particularly useful to monitor mining subsidence [8,9,10,11,12]. SBAS is a DInSAR algorithm and allows maps to be obtained with deformation time series corresponding to around 35 days using ERS-1/2 and ENVISAT datasets [13]. The Short Baseline Subsets (SBAS) technique [14] allows the generation of maps of average deformation and monitoring on the prone areas with precision to 1 cm or below [15]. The SBAS algorithm reduces the atmospheric artefacts and topographic errors in time-sequential interferograms. The algorithm uses only interferograms with small baselines that overlap in time to reduce spatial decorrelation. The method uses the most highly correlated areas to derive the deformation signal from multiple-examined interferograms, which reduces speckle and improves the phase estimate [13,14,16]. SBAS-InSAR has been successfully applied for monitoring volcanic activity, (e.g., Lee et al. on Augustine Volcano (Alaska) [17]) and seismic activity (e.g., Shanker et al. in San Francisco Bay [18]). In summary, SBAS-InSAR technology has the advantages of all-weather, all-sky time, low cost, large coverage area, and high spatial resolution. At the same time, the technology can reduce the impact of spatiotemporal loss correlation and atmospheric delay, and apply a limited number of images to obtain millimeter-level temporal settlement [14,19,20]. FLAC3D can set a variety of numerical analysis models under different geological conditions to meet the complexity of the actual engineering geological environment. It can intuitively analyze the change process of stress field and deformation state in mined-out areas, and deeply analyze the deformation mechanism and development trend of overburden rock in mined-out areas. The combination of FLAC3D and SBAS-InSAR can give full play to their respective advantages and realize the dynamic monitoring and analysis of land subsidence law in mining area.
At present, scholars at home and abroad have conducted a series of studies on the law of mine land subsidence using various methods. Turkish scholar Yasitli et al. conducted numerical simulation research on Omerler Coal Mine in Turkey and proposed to use shield support to reduce surface movement and deformation, as well as increase mining safety [21]. Indian scholar Poonam Sahua et al. conducted numerical simulation research on sharply inclined coal seam, analyzed risks, and proposed prevention and control measures [22]. Carnec (1996) et al. first monitored the settlement of coal mines near Cardanne in France using DInSAR technology [8]. Raucoules (2003) et al. used DInSAR technology [23]. Baek (2008) et al. obtained the deformation results of the coal mines in Gangwondo, South Korea from 1992 to 1998 [24]. Albert (2018), Govil (2019), Jessica (2017), and Macdonald (2016) et al. [25,26,27] all carried out the quantitative research of InSAR technology in long-term deformation disasters in mining areas. Fast Lagrangian analysis of continua in three dimensions (FLAC3D) is a numerical simulation software for rock and coal mines [28]. Ji et al. established a mining area model, simulated the mining situation using FLAC3D (6.0) software, obtained the movement and deformation of overlying strata, and proposed corresponding prevention and protection measures on this basis [29]. Jin used FLAC3D software to study the law of ground moving deformation and ground slope deformation under different coal seam dip angles [30]. Deng and Li et al. adopted FLAC3D numerical simulation finite difference method to conduct numerical simulation and obtained the surrounding rock movement and ground moving deformation laws of five mining areas under different mining technical parameters [31]. According to different InSAR parameters, Yan used D-InSAR technology to monitor the settlement of the Yunjaling mining area and invert mining settlement damage model parameters. Liu used SBAS technology to obtain large-scale deformation in mining area, and took Shendong mining area as an example, using the distributed dislocation model to invert mining earthquake magnitude [32,33]. It can be found that, at present, FLAC3D or InSAR and other single technical means are mostly used to study the mine land subsidence, and there is a lack of comprehensive analysis of multiple technical means.
At present, the Ehuobulake Coal Mine is facing the problem of land subsidence caused by mining of multiple coal seams. In order to realize the dynamic monitoring and analysis of the land subsidence law of the Ehuobulake mining area, this paper intends to adopt the method of combining FLAC3D numerical simulation and SBAS-InSAR technology to carry out research on the geological conditions of the first and fifth layers of coal production in the Ehuobulake Coal Mine. The research results can provide effective guidance for the prediction of the land subsidence law in the later mining area.

2. Mine General Situation

The Ehuobulake Coal Mine is located in Agge Township, Kuqa County, Xinjiang Uygur Autonomous Region. The geographical coordinates of the central point of the mining area are 82°59′26″ E longitude and 42°12′43″ N latitude. The identified coal resources amount to 229.54 billion tons, and the predicted coal resources amount to 1668.2 billion tons. Currently, the annual coal production is about 7.5 million tons. The approved mine production scale is 4.00 Mt/a, and the designed production capacity after the mine reconstruction and expansion is 7.50 Mt/a. The mining area is about 8.63 km long from east to west, 3.83 km wide from north to south, and 33.0495 km2 in area. The elevation of the mining area is about +1910 m, and the relative elevation difference is about 100 m. The eastern terrain is undulating due to gully cutting, the western part is hilly, surrounded by mountains, and the central part is flat. The Ehuobulake Coal Mine mainly mines the first and fifth layers of coal. The thickness of the first layer of coal is 3.11–4.16 m, the dip angle is 11°, and the buried depth is about 290 m; the distance between the fifth layer of coal and the first layer of coal is about 60 m, the thickness is 7.0–10.4 m, the dip angle is 12.5° on average, and the buried depth is about 350 m. The comprehensive mechanized coal mining method of moving to the longwall is adopted, using a collapse management roof. The distribution of working faces in the research area is shown in Figure 1.

3. Numerical Analysis of Land Subsidence Caused by Repeated Mining in Multiple Coal Seams

3.1. Model Construction

The model was constructed using FLAC3D software, and the model size was 1650 m × 300 m × 550 m (length × width × height). Horizontal constraints were applied around the model to limit the lateral displacement of the model side. A free boundary was adopted at the top, while a fixed constraint was adopted at the bottom. The lateral pressure coefficient was set at 1.4, and the Mohr–Coulomb criterion and elastic–plastic constitutive relation were adopted for strength criterion. The model parameters were assigned according to the characteristics of the comprehensive bar chart and the physical and mechanical test results of the coal (rock) layer. The lithology and mechanical parameters are shown in Table 1.
Exploiting working faces 1110, 1112, 1404, and 1406 were defined as working condition 1, while exploiting working faces 1408 and 5106 were defined as working condition 2. The distribution of mined-out areas is shown in Figure 2. Measuring lines were overlaid on the upper surface of the model, as shown in Figure 3. A displacement monitoring point was arranged every 50 m on the measuring line.

3.2. Result Analysis

The vertical displacement of overlying rock stratum after working conditions 1 and 2 is shown in Figure 4a,b. The ground vertical displacement is shown in Figure 5, and the ground vertical displacement increment caused by mining on working faces 1408 and 5106 is shown in Figure 6. As can be seen from Figure 4a, the vertical displacement of the ground presented obvious asymmetry due to the coal seam dip angle, and the advance influence range on the left side of the 1408 mined-out area was larger than the advance influence range on the right side of the shallow 1110 mined-out area. Under working condition 1, the maximum vertical displacement of overlying rock appeared near the mined-out area of the 1404 working face. The maximum vertical displacement of ground appeared above the mined-out area of the 1404 working face and 1406 working face, and the displacement amount was −350 to −400 mm. The range of surface settlement was obviously larger than the mining scale of underground working face. As can be seen from Figure 4b, the maximum vertical displacement of the overlying rock appeared near the mined-out area of the 1406 working face under working condition 2. The maximum vertical displacement of the ground appeared above the mined-out area of the 1406 working face, the displacement amount was −550 to −600 mm, and the range of ground settlement was further increased. It can be seen from Figure 6 that mining in the 1408 and 5106 working faces resulted in two obvious settlement funnels on the ground. The maximum displacement in the center of the settlement funnels was −180 and −211.8 mm, respectively.

4. Monitoring and Analysis of Ground Deformation Based on SBAS-InSAR Technology

4.1. Monitoring Data Preparation

The 45-scene C-band, interferometric wide swath (IW), VV-polarized Sentinel-lA orbit ascent data covering the Ehuobulake Coal Mine area were adopted, with the time span from January 2019 to September 2022. Detailed image information is shown in Table 2. SRTM DEM data with a resolution of 30 m were used to remove the terrain phase.

4.2. Data Processing Flow

N + 1 SAR images covering the study area at different times were processed, and one of the landscape images was selected as the super main image. By setting appropriate time and space thresholds, the above SAR data were generated into an M amplitude differential interferogram combination. The technical flow of ground deformation monitoring by the SBAS-InSAR method is shown in Figure 7, and the spatial and temporal baseline distributions obtained during data processing are shown in Figure 8a,b.

5. Results

The SBAS-InSAR processing strategy yielded 458 interferograms. The topographic phase in the interferogram was filtered by external DEM. The interferogram was filtered using the Goldstein algorithm to reduce the coherence noise, and the corresponding coherence coefficient diagram was obtained. Using the high-coherence points in the obtained diagram, the phase unwrapping was realized through the minimum cost flow (MCF) algorithm, and the images with a poor unwrapping effect were removed, thus obtaining the filtered interferogram. In Figure 9, one out of 458 interferograms is shown. Two active areas are clearly identified in this interferogram, represented by closed circular shaped fringes. The location of these active areas (subsidence basins) corresponds to the location of coal mining areas, suggesting a clear relationship between the mining activity and measured deformation.

6. Discussion

6.1. Analysis of SBAS-InSAR Results

Figure 10 and Figure 11 respectively show the cumulative vertical displacement and ground-level annual average vertical displacement speed situation in the Ehuobulake Coal Mine area from 1 January 2019 to 6 September 2022 obtained via the application of SBAS-InSAR technology. Displacement quantity is represented by different colors, the negative value indicates the land subsidence, the positive value indicates the land uplift, and a deeper color denotes greater vertical displacement. As can be seen from Figure 10, two obvious deformation regions (1# and 2#) appear in the study area during the study period. The maximum vertical displacement in the study area is −225 mm, which occurs in the 2# deformation region. As can be seen from Figure 11, the maximum vertical displacement velocity in the mining area is −67 mm/a, which occurs in the 2# deformation region.

6.2. Analysis of Precision

The observation data of two ground GPS monitoring stations in the study area were compared with the ground vertical displacement obtained by the SBAS-InSAR technology, and the results are shown in Figure 12a,b. It can be found by comparison that the displacement curves obtained by the two monitoring methods were basically the same in trend. The maximum errors were 4.40 mm and 4.21 mm respectively, with a high fit, demonstrating the reliability of the SBAS-InSAR deformation monitoring results.

6.3. Analysis of the Formation Time of the Deformation Region

The topographic phase in the interferogram was filtered by external DEM. The interferogram was filtered using the Goldstein algorithm to reduce the coherence noise, and the corresponding coherence coefficient diagram was obtained. Using the high-coherence points in the obtained diagram, the phase unwrapping was realized through the minimum cost flow algorithm, and the images with poor unwrapping effect were removed. Two filtered interference graphs in the experiment were selected for analysis, as shown in Figure 13. From Figure 13a, it can be seen that, from January 2019 to March 2019, deformation regions 1# and 2# appeared. Compared with deformation region 2#, deformation region 1# had smaller shape variables and influence scope. As can be seen from Figure 13b, with the passage of time, the scope of deformation region 1# and 2# gradually expanded, and the color became darker and darker, indicating that the scope and vertical deformation magnitude of the two deformation regions were gradually expanding.

6.4. Analysis of Cumulative Settlement of Mining Area in Time Series

In order to further analyze the development of the deformation area in the time domain, three measuring lines were drawn in the area with large ground deformation above the mined-out areas. Among them, the 1–1′ measuring line and 2–2′ measuring line were disposed along the working face dip, and the 3–3′ measuring line was disposed along the working face strike. A number of displacement monitoring points were arranged on the 1–1′ and 2–2′ measuring lines at equal intervals from left to right, and on the 3–3′ measuring lines at equal intervals from top to bottom, focusing on monitoring the deformation area of 1# and 2#. The layout of measuring lines is shown in Figure 14. Finally, according to the deformation information of each monitoring point, the time series vertical displacement curves and cumulative vertical displacement curves of the three measurement lines were drawn, and the time series analysis was conducted. The time series vertical displacement and cumulative vertical displacement of the measuring lines are shown in Figure 15, Figure 16 and Figure 17.
It can be seen from Figure 15a,b that the time series vertical displacement curve of the 1–1′ measuring line presented a “V” shape, with obvious subsidence basin characteristics, and the maximum vertical displacement of the monitoring point was −192.27 mm. As the average dip angle of coal seam was 12°, it can be characterized as gently inclined; with the advance of the working face, the maximum subsidence value tended to move in the downhill direction. The ground corresponding to the mined-out area also showed a continuous downward trend during the study period.
It can be seen from Figure 16a,b that the mining subsidence basin in deformation area 2# migrated toward the mining direction with the advance of the working face, and the maximum vertical displacement of the monitoring point was −197.83 mm. Since working faces 1110 and 1112 were fully mined in 2014, while working face 5106 was mined from 2019 to 2021, the above land subsidence phenomenon was directly related to the mining of working face 5106.
It can be seen from Figure 17a,b that there were two obvious settlement funnels in the 3–3′ survey line, and the maximum vertical displacements in the center of the two settlement funnels were −169.98 mm and −226.22 mm, respectively.
The cumulative vertical displacement from 2019 to 2022 obtained by SBAS-InSAR technology (Figure 17b) was compared with the ground-based vertical displacement increment from 2019 to 2022 caused by mining in the 1408 and 5106 working faces (Figure 6) obtained by FLAC3D, and the results are shown in Figure 18. It can be found that the ground vertical displacement curves obtained by the two methods showed a similar trend, and the degree of fitting was high. The vertical displacement errors of the No. 7 and No. 18 monitoring points with the largest cumulative vertical displacement obtained by SBAS-InSAR technology and the corresponding positions of the numerical model were 5.48 mm and 14.42 mm, respectively. The maximum error of the two curves was 50.27 mm (No.11 monitoring point), meeting the accuracy requirements of ground deformation monitoring, and proving that the numerical simulation model is accurate and reliable. It can provide a favorable guarantee for the later use of the mined-out area stability analysis using numerical simulation and the prediction of the impact of repeated mining on ground deformation in the mining area.

7. Limitations and Prospects

In this paper, FLAC3D numerical simulation and SBAS-InSAR technology were used to analyze the dynamic evolution law of ground settlement amount and range under repeated mining in multiple coal seams. It can be found that the surface deformation results of the mining area obtained using the FLAC3D numerical simulation were highly consistent with those obtained by the SBAS-InSAR technology, which provides a reliable means for the surface deformation prediction in mining areas. At the same time, this paper also had certain limitations. For example, the SBAS-InSAR technology was used to monitor the surface deformation of the mining area, which can be considered to have uniform or linear characteristics. However, it can be found in the monitoring of the ground subsidence of the mining area that sudden collapse may occur, resulting in failure to obtain the surface deformation results of the collapse area, thus limiting the sequential InSAR. The traditional D-InSAR technique can be used to monitor the surface deformation characteristics before and after the collapse. Therefore, how to combine time series InSAR and D-InSAR to monitor the land subsidence of mining areas is also a future research focus.

8. Conclusions

(1)
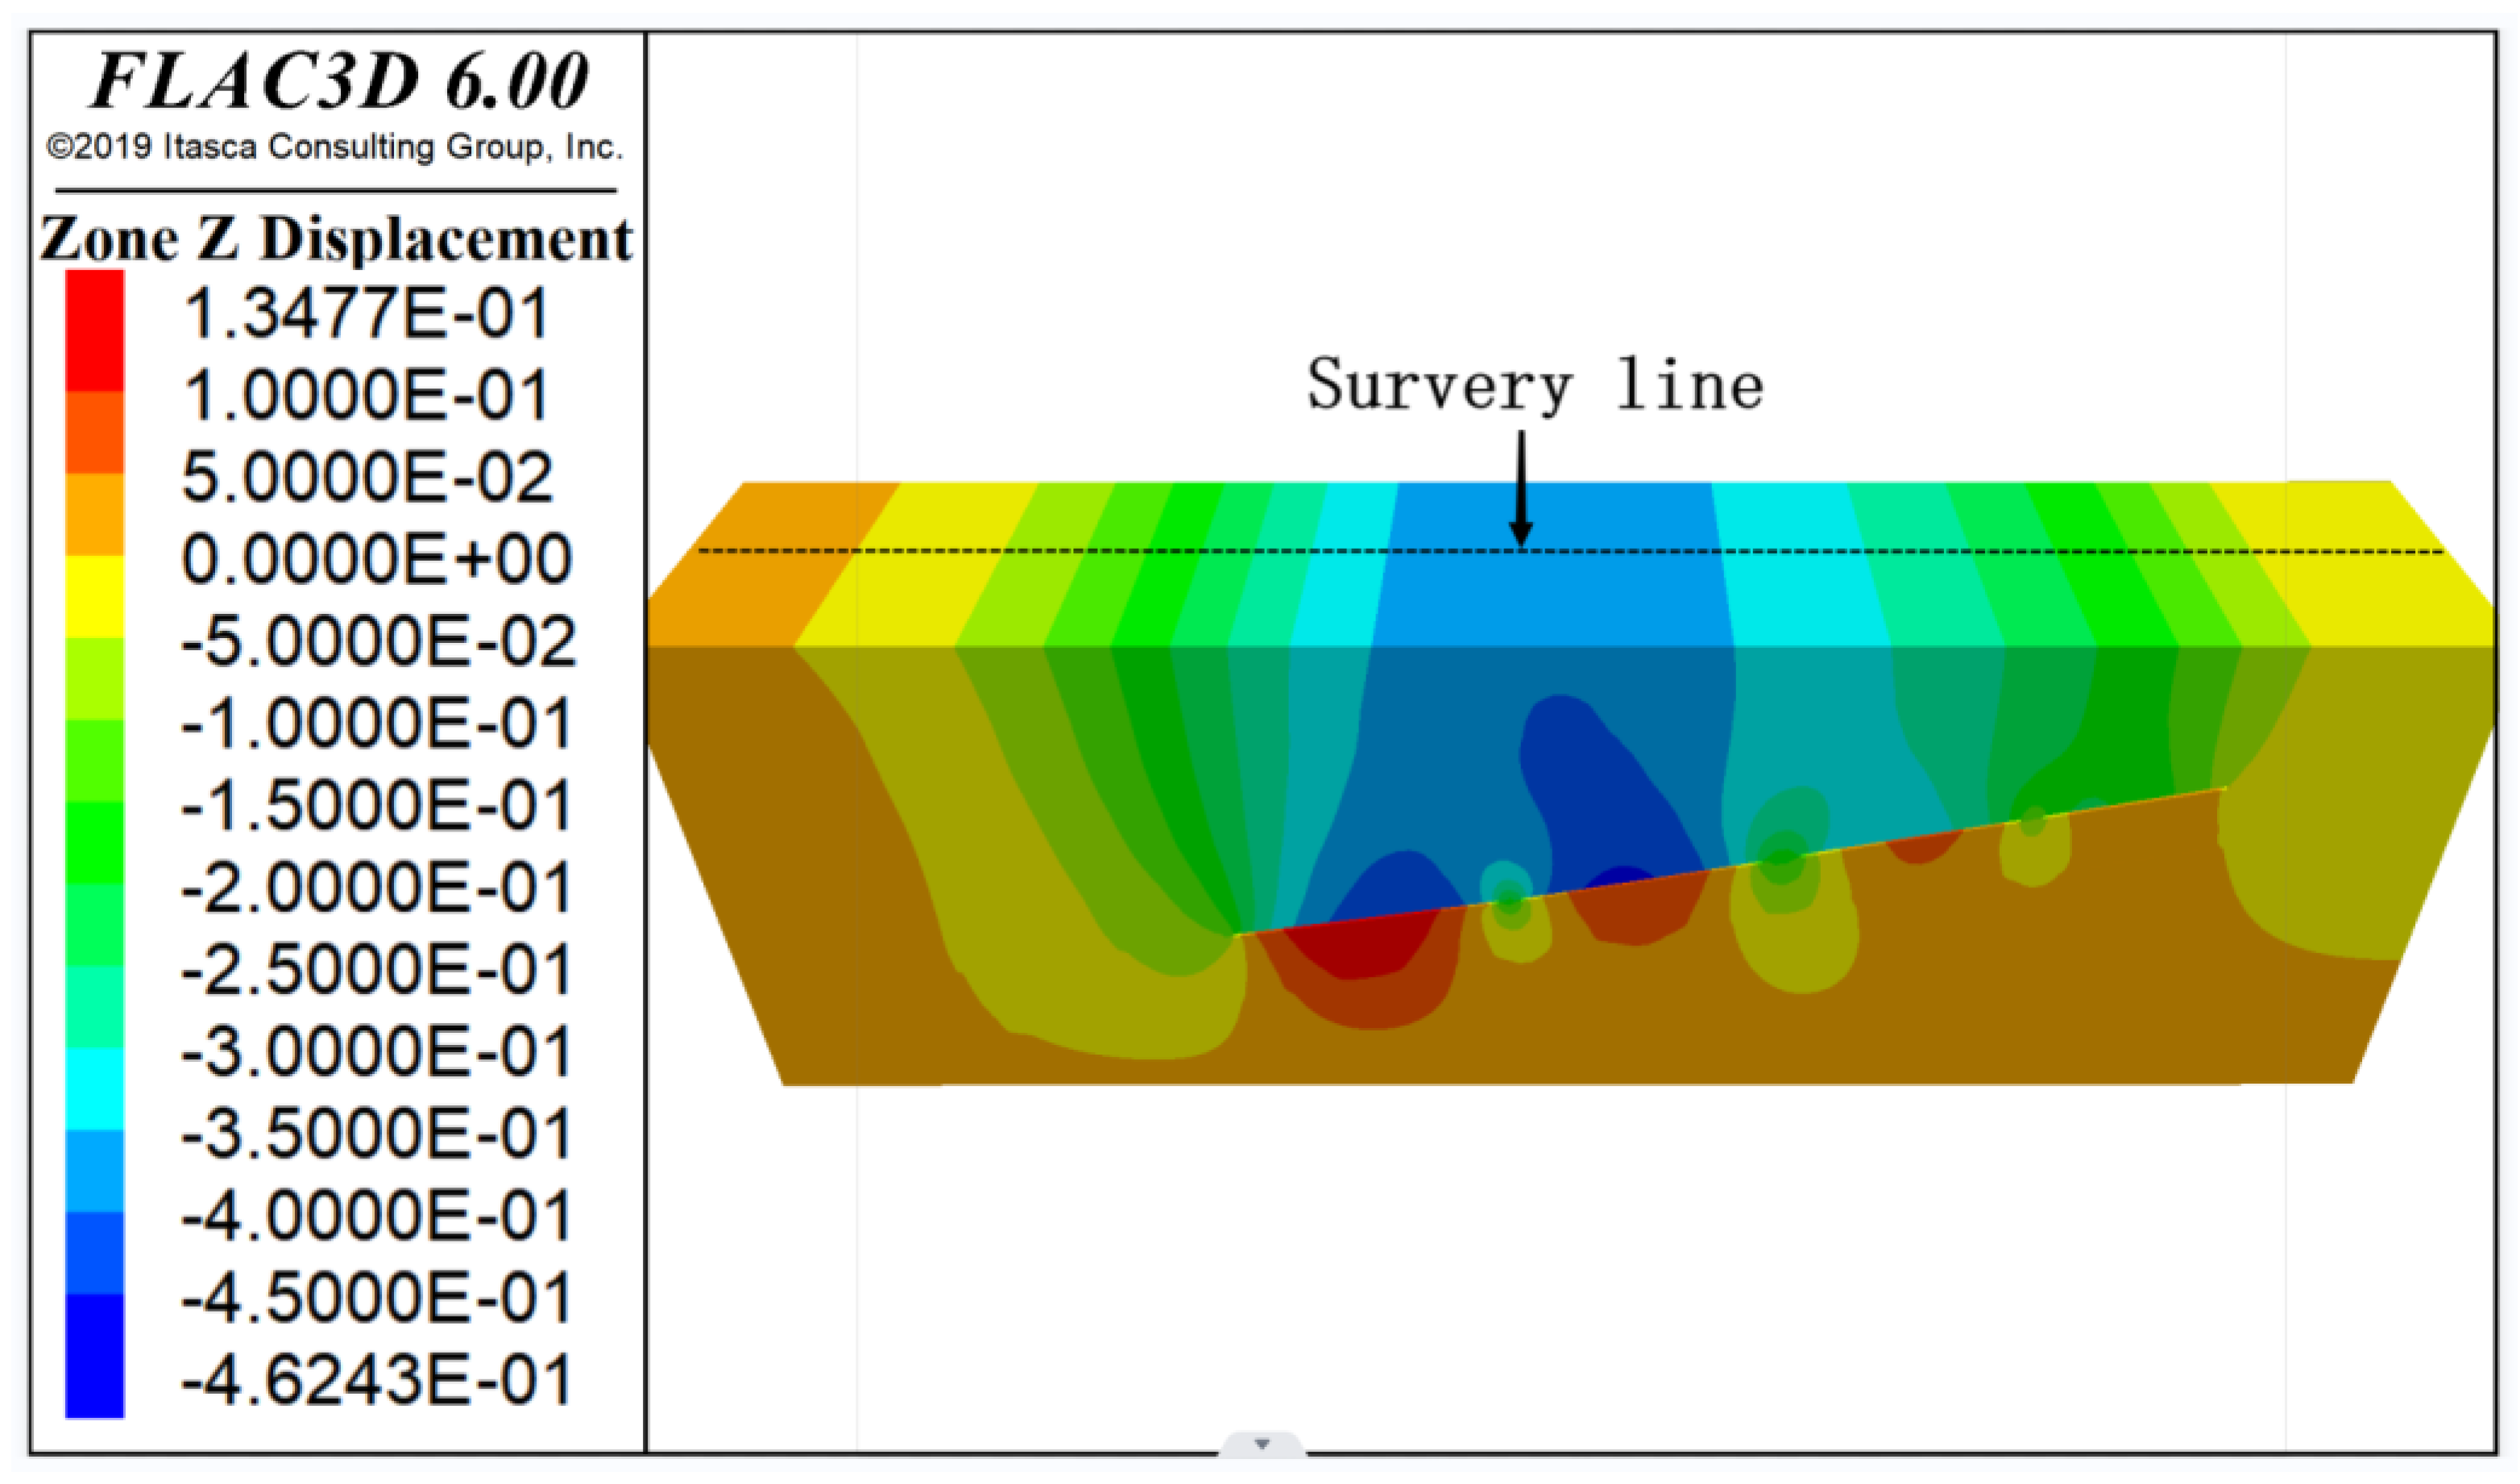
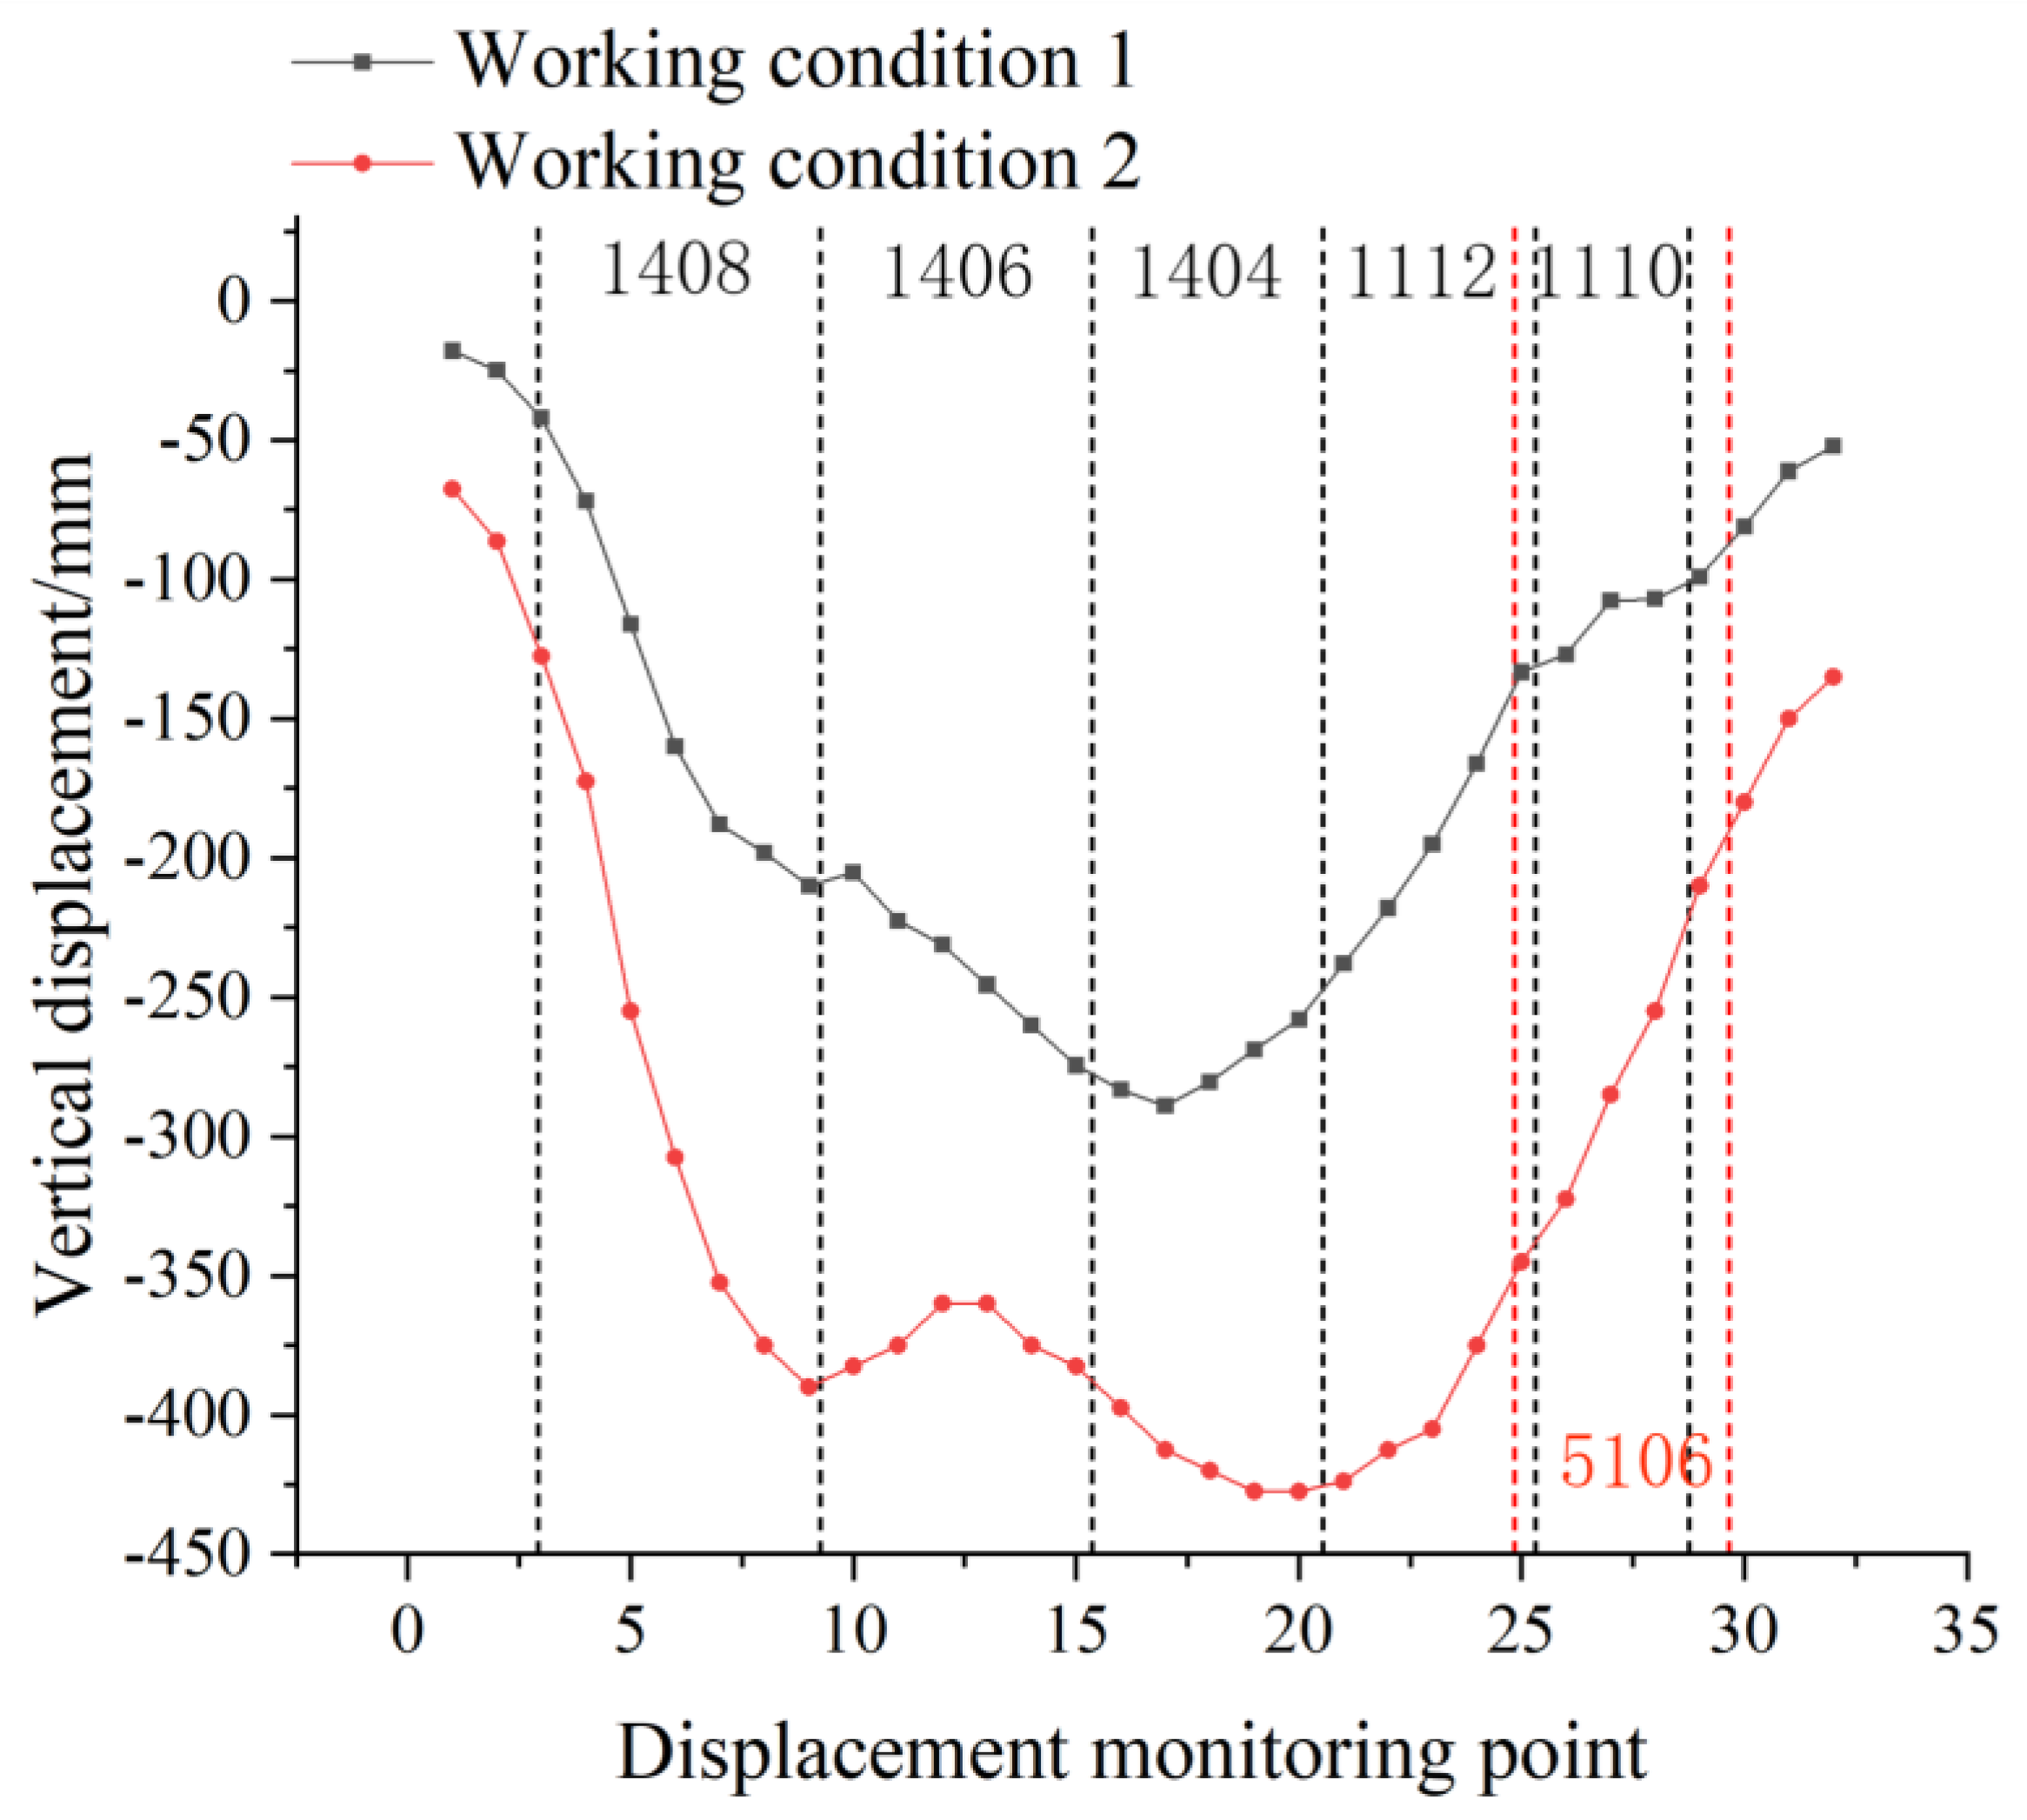
FLAC3D numerical simulation was used to analyze the law of land subsidence under the condition of repeated mining in multiple coal seams of the Ehuobulake Coal Mine. Under the condition of multiple coal seam mining, land subsidence presented obvious asymmetry. The size and scope of land subsidence further increased due to the mining of lower layer coal. There were two obvious settlement funnels on the ground, with maximum displacement of −180 mm and −211.8 mm, respectively.
(2)
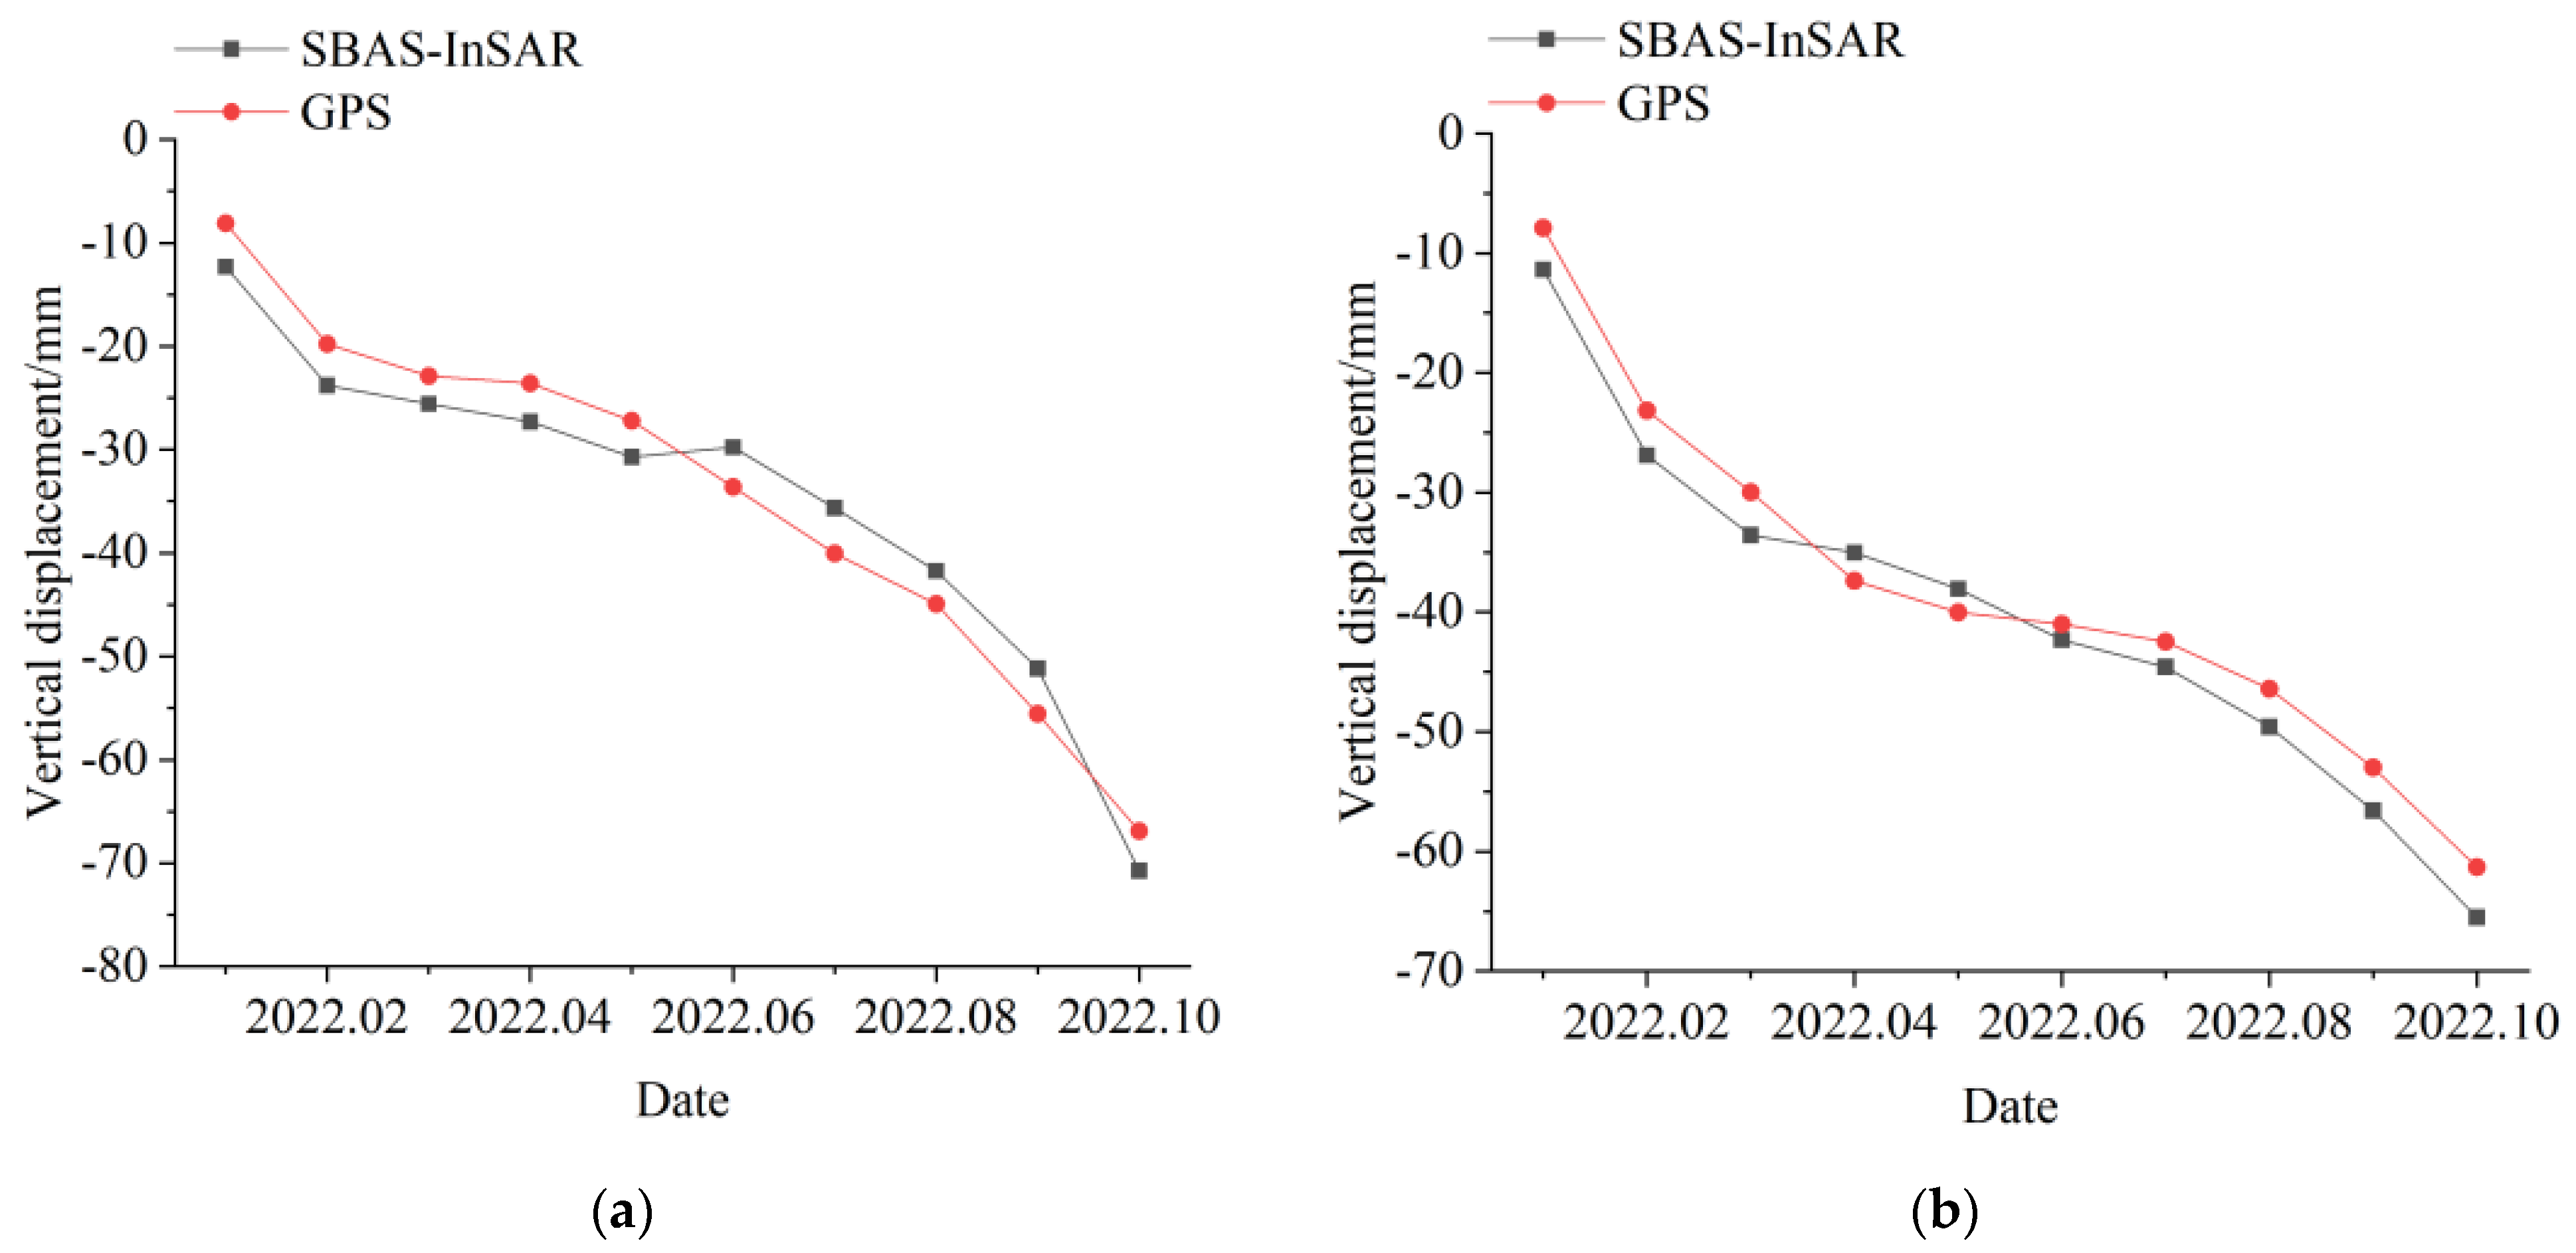
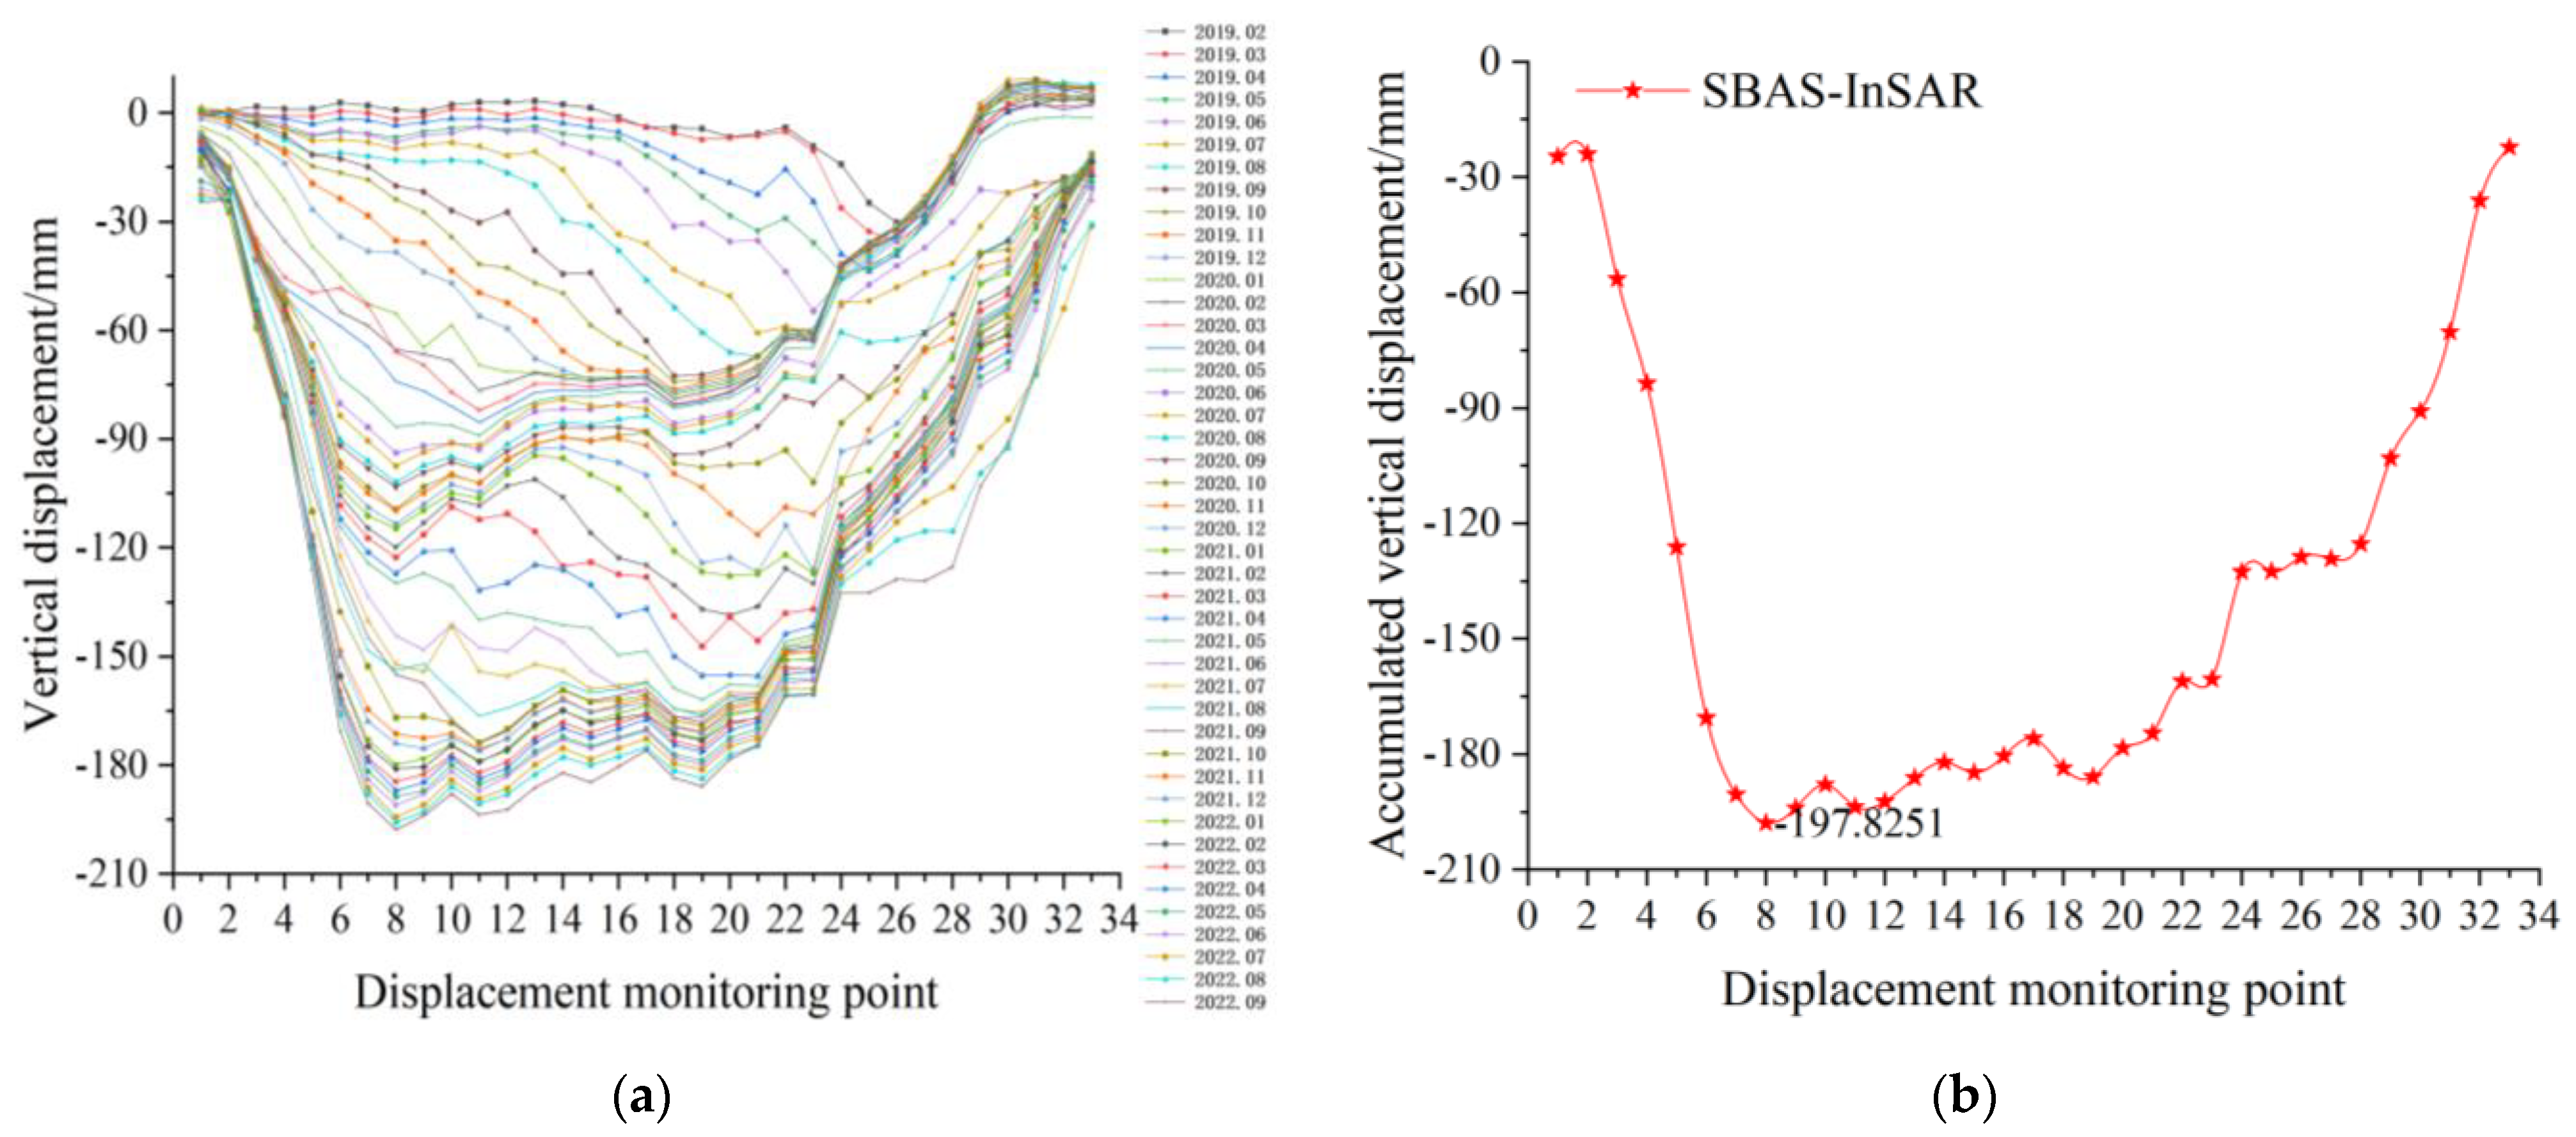
The land subsidence results of the Ehuobulake Coal Mine monitored by SBAS-InSAR technology were of high accuracy. The results showed two obvious subsidence areas of 1# and 2# in the mining area during the study period. The maximum displacement was −225 mm, and the maximum displacement rate was −67 mm/a. With the advancement of underground mining working face, the range of land subsidence area gradually expanded.
(3)
The method of combining FLAC3D and InSAR technology can accurately and reliably monitor and analyze the land subsidence situation under the repeated mining of multiple coal seams in mining areas, as well as provide an effective approach for the prediction of the land subsidence law in the later period.

Author Contributions

Conceptualization, S.Z. and H.W.; methodology, H.W. and S.Z.; validation, S.Z., C.S., H.K. and H.L.; investigation, S.Z., G.L. and Y.L.; data curation, S.Z., F.Y. and G.X.; writing—original draft preparation, S.Z., H.L. and G.L.; writing—review and editing, S.Z., H.W. and H.L. All authors have read and agreed to the published version of the manuscript.

Funding

This research was funded by the National Natural Science Foundation of China, grant numbers 51964043, the Natural Science Foundation of Xinjiang Uyghur Autonomous Region (2022D01E31), the Xinjiang Uygur Autonomous Region “Tianshan Talent Training” Program (2022TSYCCX0037), and the Xinjiang Uygur Autonomous Region Special Program for Key R&D Tasks (2022B01034,2022B01051).

Data Availability Statement

The research data used to support the findings of this study are currently under embargo while the research findings are commercialized. Requests for data, 12 months after publication of this article, will be considered by the corresponding author.

Conflicts of Interest

The authors declare no conflict of interest.

References

  1. Guo, G.L.; Wang, Y.H.; Ma, Z.G. A new approach to effective control of coal mining subsidence. J. China Univ. Min. Technol. 2004, 2, 26–29. [Google Scholar]
  2. Przyłucka, M.; Herrera, G.; Graniczny, M.; Colombo, D.; Béjar-Pizarro, M. Combination of conventional and advanced DInSAR to monitor very fast mining subsidence with TerraSAR-X data: Bytom City (Poland). Remote Sens. 2015, 7, 5300–5328. [Google Scholar] [CrossRef] [Green Version]
  3. Qu, F.; Zhang, Q.; Niu, Y. Mapping the recent vertical crustal deformation of the Weihe Basin (China) using Sentinel-1 and ALOS-2 ScanSAR imagery. Remote Sens. 2022, 14, 3182. [Google Scholar] [CrossRef]
  4. Zhao, M. Research on Extraction Method of Surface Deformation in Mining Area Based on SBAS-InSAR Technology. Master’s Thesis, Henan Polytechnic University, Zhengzhou, China, 2017. [Google Scholar]
  5. Xiang, W.; Zhang, R.; Liu, G.; Wang, X.; Mao, W.; Zhang, B.; Fu, Y.; Wu, T. Saline-Soil deformation extraction based on an improved time-series InSAR approach. ISPRS Int. J. Geo-Inf. 2021, 10, 112. [Google Scholar] [CrossRef]
  6. Zhang, P.; Guo, Z.; Guo, S.; Xia, J. Land subsidence monitoring method in regions of variable radar reflection characteristics by integrating PS-InSAR techniques. Remote Sens. 2022, 14, 3265. [Google Scholar] [CrossRef]
  7. Zhou, C.; Cao, Y.; Yin, K.; Wang, Y. Landslide characterization applying Sentinel-1 images and InSAR technique: The muyubao landslide in the three gorges reservoir area, China. Remote Sens. 2020, 12, 3385. [Google Scholar] [CrossRef]
  8. Carnec, C.; Delacourt, C. Three years of mining subsidence monitored by SAR interferometry, Near Gardanne, France. J. Appl. Geophys. 2000, 43, 43–54. [Google Scholar] [CrossRef]
  9. Wegmuller, U.; Werner, C.; Strozzi, T.; Wiesmann, A. Monitoring mining induced surface deformation. IEEE Proc. Geosci. Remote Sens. Symp. 2004, 3, 1933–1935. [Google Scholar]
  10. Herrera, G.; Tomás, R.; Vicente, F.; Lopez-Sanchez, J.M.; Mallorquí, J.J.; Mulas, J. Mapping ground movements in open pit mining areas using differential SAR interferometry. Int. J. Rock Mech. Min. Sci. 2010, 47, 1114–1125. [Google Scholar] [CrossRef]
  11. Benecke, N.; Bateson, L.; Browitt, C.; Declercq, P.; Graniczny, M.; Marsh, S.; Zimmermann, K. Perspectives concerning satellite EO and geohazard risk management: The way forward—Community paper concerning inactive mines hazards. In Proceedings of the the InternatIonal Forum on Satellite EO and Geohazardas, Forum on Satellite EO and Geohazards, Santorini, Greece, 21–23 May 2012. [Google Scholar]
  12. Engelbrecht, J.; Inggs, M. Differential interferometry techniques on L-band data employed for the monitoring of surface subsidence due to mining. S. Afr. J. Geomat. 2013, 2, 82–93. [Google Scholar]
  13. Fernandez, J.; Tizanni, P.; Manzo, M.; Borgia, A.; Gonzalez, P.J.; Marti, J.; Pepe, A.; Camacho, A.G.; Casu, F.; Berardino, P.; et al. Gravity-driven deformation of Tenerife measured by InSAR time series analysis. Geophys. Res. Lett. 2009, 36, L04306. [Google Scholar] [CrossRef] [Green Version]
  14. Berardino, P.; Fornaro, G.; Lanari, R.; Sansoti, E. A new algorithm for surface deformation monitoring based on small baseline differential SAR interferograms. Remote Sens. 2002, 40, 2375–2383. [Google Scholar] [CrossRef] [Green Version]
  15. Nadudvari, A. Using radar interferometry and SBAS technique to detect surface subsidence relating to coal mining in Upper Silesia from 1993–2000 and 2003–2010. Environ. Socio-Econ. Stud. 2016, 4, 24–34. [Google Scholar] [CrossRef] [Green Version]
  16. Trasatti, E.; Casu, F.; Giunchi, C.; Pepe, S.; Solaro, G.; Tagliaventi, S.; Berardino, P.; Manzo, M.; Pepe, A.; Ricciardi, G.P.; et al. The 2004-2006 uplift episode at Campi Flegrei caldera (Italy): Constraints from SBAS-DInSAR ENVISAT data and Bayesian source Inference. Geophys. Res. Lett. 2008, 35, L07308. [Google Scholar] [CrossRef] [Green Version]
  17. Lee, C.W.; Lu, Z.; Jung, H.S.; Won, J.S.; Dzurisin, D. Surface deformation of Augustine Volcano, 1992–2005, from multipleinterferogram processing using a refined small baseline subset (SBAS). U.S. Geol. Surv. 2010, 17, 453–465. [Google Scholar]
  18. Shanker, P.; Casu, F.; Zebker, H.A.; Lanari, R. Comparison of Persistent Scatterers and Small Baseline Time-Series InSAR Results: A Case Study of the San Francisco Bay Area. IEEE Geosci. Remote Sens. Lett. 2011, 8, 592–596. [Google Scholar] [CrossRef]
  19. Biggs, J.; Wright, T.J. How satellite InSAR has grown from opportunistic science to routine monitoring over the last decade. Nat. Commun. 2020, 11, 3863. [Google Scholar] [CrossRef] [PubMed]
  20. Ma, P.; Lin, H. Robust Detection of Single and Double Persistent Scatterers in Urban Built Environment. IEEE Trans. Geosci. Remote Sens. 2016, 54, 2124–2139. [Google Scholar] [CrossRef]
  21. Yasitli, N.E.; Unver, B. 3D numerical modeling of longwall mining with top-coal caving. Int. J. Rock Mech. Min. Sci. 2005, 42, 219–235. [Google Scholar] [CrossRef]
  22. Del Soldato, M.; Solari, L.; Raspini, F.; Bianchini, S.; Ciampalini, A. Monitoring Ground Instabilities Using SAR Satellite Data: A Practical Approach. ISPRS Int. J. Geo-Inf. 2019, 8, 307. [Google Scholar] [CrossRef] [Green Version]
  23. Raucoules, D.; Maisons, C.; Garnec, C.; Le Mouelic, S.; King, C.; Hosford, S. Monitoring of slow ground deformation by ERS Radar interferometry on the Vauvert Salt Mine (France)-comparison with ground-based measurement. Remote Sens. Environ. 2003, 88, 468–478. [Google Scholar] [CrossRef]
  24. Baek, J.; Kim, S.W.; Park, H.J.; Jung, H.S.; Kim, K.D. Analysis of ground subsidence in coal mining area using SAR interferometry. Geosci. J. 2008, 12, 277–284. [Google Scholar] [CrossRef]
  25. Niu, Y.F. Applications of SAR interferometry for co-seismic, interseismic and volcano deformation monitoring, modeling and interpretation. Acta Geod. Cartogr. Sin. 2022, 51, 471. [Google Scholar]
  26. Jessica, M.W.; Mccarter, M.K. Comparison of L-band and X-band differential interferometric synthetic aperture radar for mine subsidence monitoring in central Utah. Int. J. Min. Sci. Technol. 2017, 27, 159–163. [Google Scholar]
  27. Mohammadimanesh, F.; Salehi, B.; Mahdianpari, M.; English, J.; Chamberland, J. Monitoring surface changes in discontinuous permafrost terrain using small baseline SAR interferometry, object-based classification, and geological features: A case study from Mayo, Yukon Territory, Canada. GIScience Remote Sens. 2018, 56, 485–510. [Google Scholar] [CrossRef]
  28. Bock, S.H. New open-source ANSYS-SolidWorks-FLAC3D geometry conversion peograms. J. Sustain. Min. 2015, 14, 124–132. [Google Scholar] [CrossRef] [Green Version]
  29. Ji, H.; Yu, X.Y. Research on mining influence mechanism based on FLAC computer numerical simulation. J. Shanxi Coal 2011, 30, 70–71+74. [Google Scholar]
  30. Jin, F. Numerical Simulation Analysis of Surface Movement Deformation with Coal Seam Dip Angle and Surface Slope. Master’s Thesis, Taiyuan University of Technology, Taiyuan, China, 2016. [Google Scholar]
  31. Deng, X.L.; Li, L.H.; Tan, Y.F. Numerical simulation of surface subsidence induced by underground mining. J. Min. Saf. Eng. 2018, 49, 188–192. [Google Scholar]
  32. Yan, D.P. Application research of mining subsidence monitoring in Yunjaling Coal Mine based on D-InSAR technology. Master’s Thesis, China University of Geosciences, Beijing, China, 2011. [Google Scholar]
  33. Liu, Y.L. Monitoring and Inversion Analysis of Large-Scale Deformation of Mining Subsidence in Mining Area. Master’s Thesis, Chang’an University, Xi’an, China, 2013. [Google Scholar]
Figure 1. Distribution of working faces in the research area.
Applsci 13 08804 g001
Figure 2. Schematic diagram of the mined-out area distribution.
Applsci 13 08804 g002
Figure 3. Arrangement of the measuring line.
Applsci 13 08804 g003
Figure 4. Vertical displacement of the overlying rock under different working conditions: (a) working condition 1; (b) working condition 2.
Applsci 13 08804 g004
Figure 5. Vertical displacement curve for different working conditions.
Applsci 13 08804 g005
Figure 6. Ground-based vertical displacement increment curve.
Applsci 13 08804 g006
Figure 7. Technical flow of SBAS-InSAR.
Applsci 13 08804 g007
Figure 8. Spatial baseline distribution and temporal baseline distribution: (a) spatial baseline distribution; (b) temporal baseline distribution.
Applsci 13 08804 g008
Figure 9. Filtered interferogram (August 2019–November 2019).
Applsci 13 08804 g009
Figure 10. Accumulated vertical displacement of the mining area.
Applsci 13 08804 g010
Figure 11. Ground average annual vertical displacement velocity in the mining area.
Applsci 13 08804 g011
Figure 12. SBAS-InSAR versus GPS vertical displacement: (a) GPS station 1; (b) GPS station 2.
Applsci 13 08804 g012
Figure 13. Filtered interferogram: (a) January 2019–March 2019; (b) January 2019–January 2020.
Applsci 13 08804 g013
Figure 14. Line arrangement in the deformation area.
Applsci 13 08804 g014
Figure 15. Vertical displacement curve of the 1–1′ measuring line: (a) time series vertical displacement curve; (b) accumulated vertical displacement curve.
Applsci 13 08804 g015
Figure 16. Vertical displacement curve of the 2–2′ measuring line: (a) time series vertical displacement curve; (b) accumulated vertical displacement curve.
Applsci 13 08804 g016
Figure 17. Vertical displacement curve of the 3–3′ measuring line: (a) time series vertical displacement curve; (b) accumulated vertical displacement curve.
Applsci 13 08804 g017
Figure 18. FLAC3D numerical simulation versus SBAS-InSAR monitoring ground vertical displacement.
Applsci 13 08804 g018
Table 1. Lithology and mechanical parameters.
LithologyThickness (m)Density (kg·m−3)Bulk Modulus (GPa)Shear Modulus (GPa)Cohesion (MPa)Internal Friction Angle (°)Tensile Strength(MPa)
A-horizon3820003.12.21.1150.18
Sandstone12828507.65.25.5386.8
Medium fine sandstone5226505.65.05.6386.7
Kern stone3228505.34.56.5364.9
The first layer of coal3.513502.61.52.0221.4
Mudstone325435.34.12.9322.0
Post stone24.528006.64.04.5355.1
Kern stone1127507.55.55.0366.0
Medium coarse sandstone17.528506.34.55.8374.9
Fine sandstone1628008.66.019.84210.0
Sandy mudstone326005.63.87.9402.9
The fifth layer of coal8.513504.62.87.5392.0
Mudstone2.525004.32.14.5331.8
Medium coarse sandstone2627509.65.89.8405.0
Table 2. Sentinel-lA image parameters table.
Serial NumberData TypeDatePolarization ModeTrack ConfigurationSpatial Baseline (m)
1IW2019/1/1VVAscending−48.8038
2IW2019/2/6VVAscending40.7249
3IW2019/3/2VVAscending−111.4171
4IW2019/4/7VVAscending−80.8265
5IW2019/5/1VVAscending−141.0416
6IW2019/6/6VVAscending−61.6024
7IW2019/7/12VVAscending−86.6237
8IW2019/8/5VVAscending−127.5768
9IW2019/9/10VVAscending−110.7101
10IW2019/10/4VVAscending−222.6741
11IW2019/11/9VVAscending−93.2896
12IW2019/12/3VVAscending−85.9224
13IW2020/1/8VVAscending0
14IW2020/2/1VVAscending−80.3267
15IW2020/3/8VVAscending−77.1596
16IW2020/4/1VVAscending−140.8206
17IW2020/5/7VVAscending−37.0035
18IW2020/6/12VVAscending−96.7407
19IW2020/7/6VVAscending17.7273
20IW2020/8/11VVAscending−193.3529
21IW2020/9/4VVAscending−31.4781
22IW2020/10/10VVAscending−229.5516
23IW2020/11/3VVAscending−44.8282
24IW2020/12/9VVAscending−82.3615
25IW2021/1/2VVAscending−64.9575
26IW2021/2/7VVAscending−53.6469
27IW2021/3/3VVAscending−84.0527
28IW2021/4/8VVAscending−148.4881
29IW2021/5/2VVAscending−24.3244
30IW2021/6/7VVAscending−99.6694
31IW2021/7/1VVAscending−121.5081
32IW2021/8/6VVAscending−63.1232
33IW2021/9/11VVAscending−118.5095
34IW2021/10/5VVAscending−22.7560
35IW2021/11/10VVAscending−144.0481
36IW2021/12/4VVAscending−22.2346
37IW2022/1/9VVAscending−13.2906
38IW2022/2/2VVAscending57.3173
39IW2022/3/10VVAscending−126.0634
40IW2022/4/3VVAscending−122.9171
41IW2022/5/9VVAscending−99.0737
42IW2022/6/2VVAscending−155.8066
43IW2022/7/8VVAscending−165.9644
44IW2022/8/1VVAscending−105.5399
45IW2022/9/6VVAscending−301.3169
Disclaimer/Publisher’s Note: The statements, opinions and data contained in all publications are solely those of the individual author(s) and contributor(s) and not of MDPI and/or the editor(s). MDPI and/or the editor(s) disclaim responsibility for any injury to people or property resulting from any ideas, methods, instructions or products referred to in the content.

