
Listeners’ Spectral Reallocation Preferences for Speech in Noise

Abstract
:1. Introduction
2. Outline of the Experiments
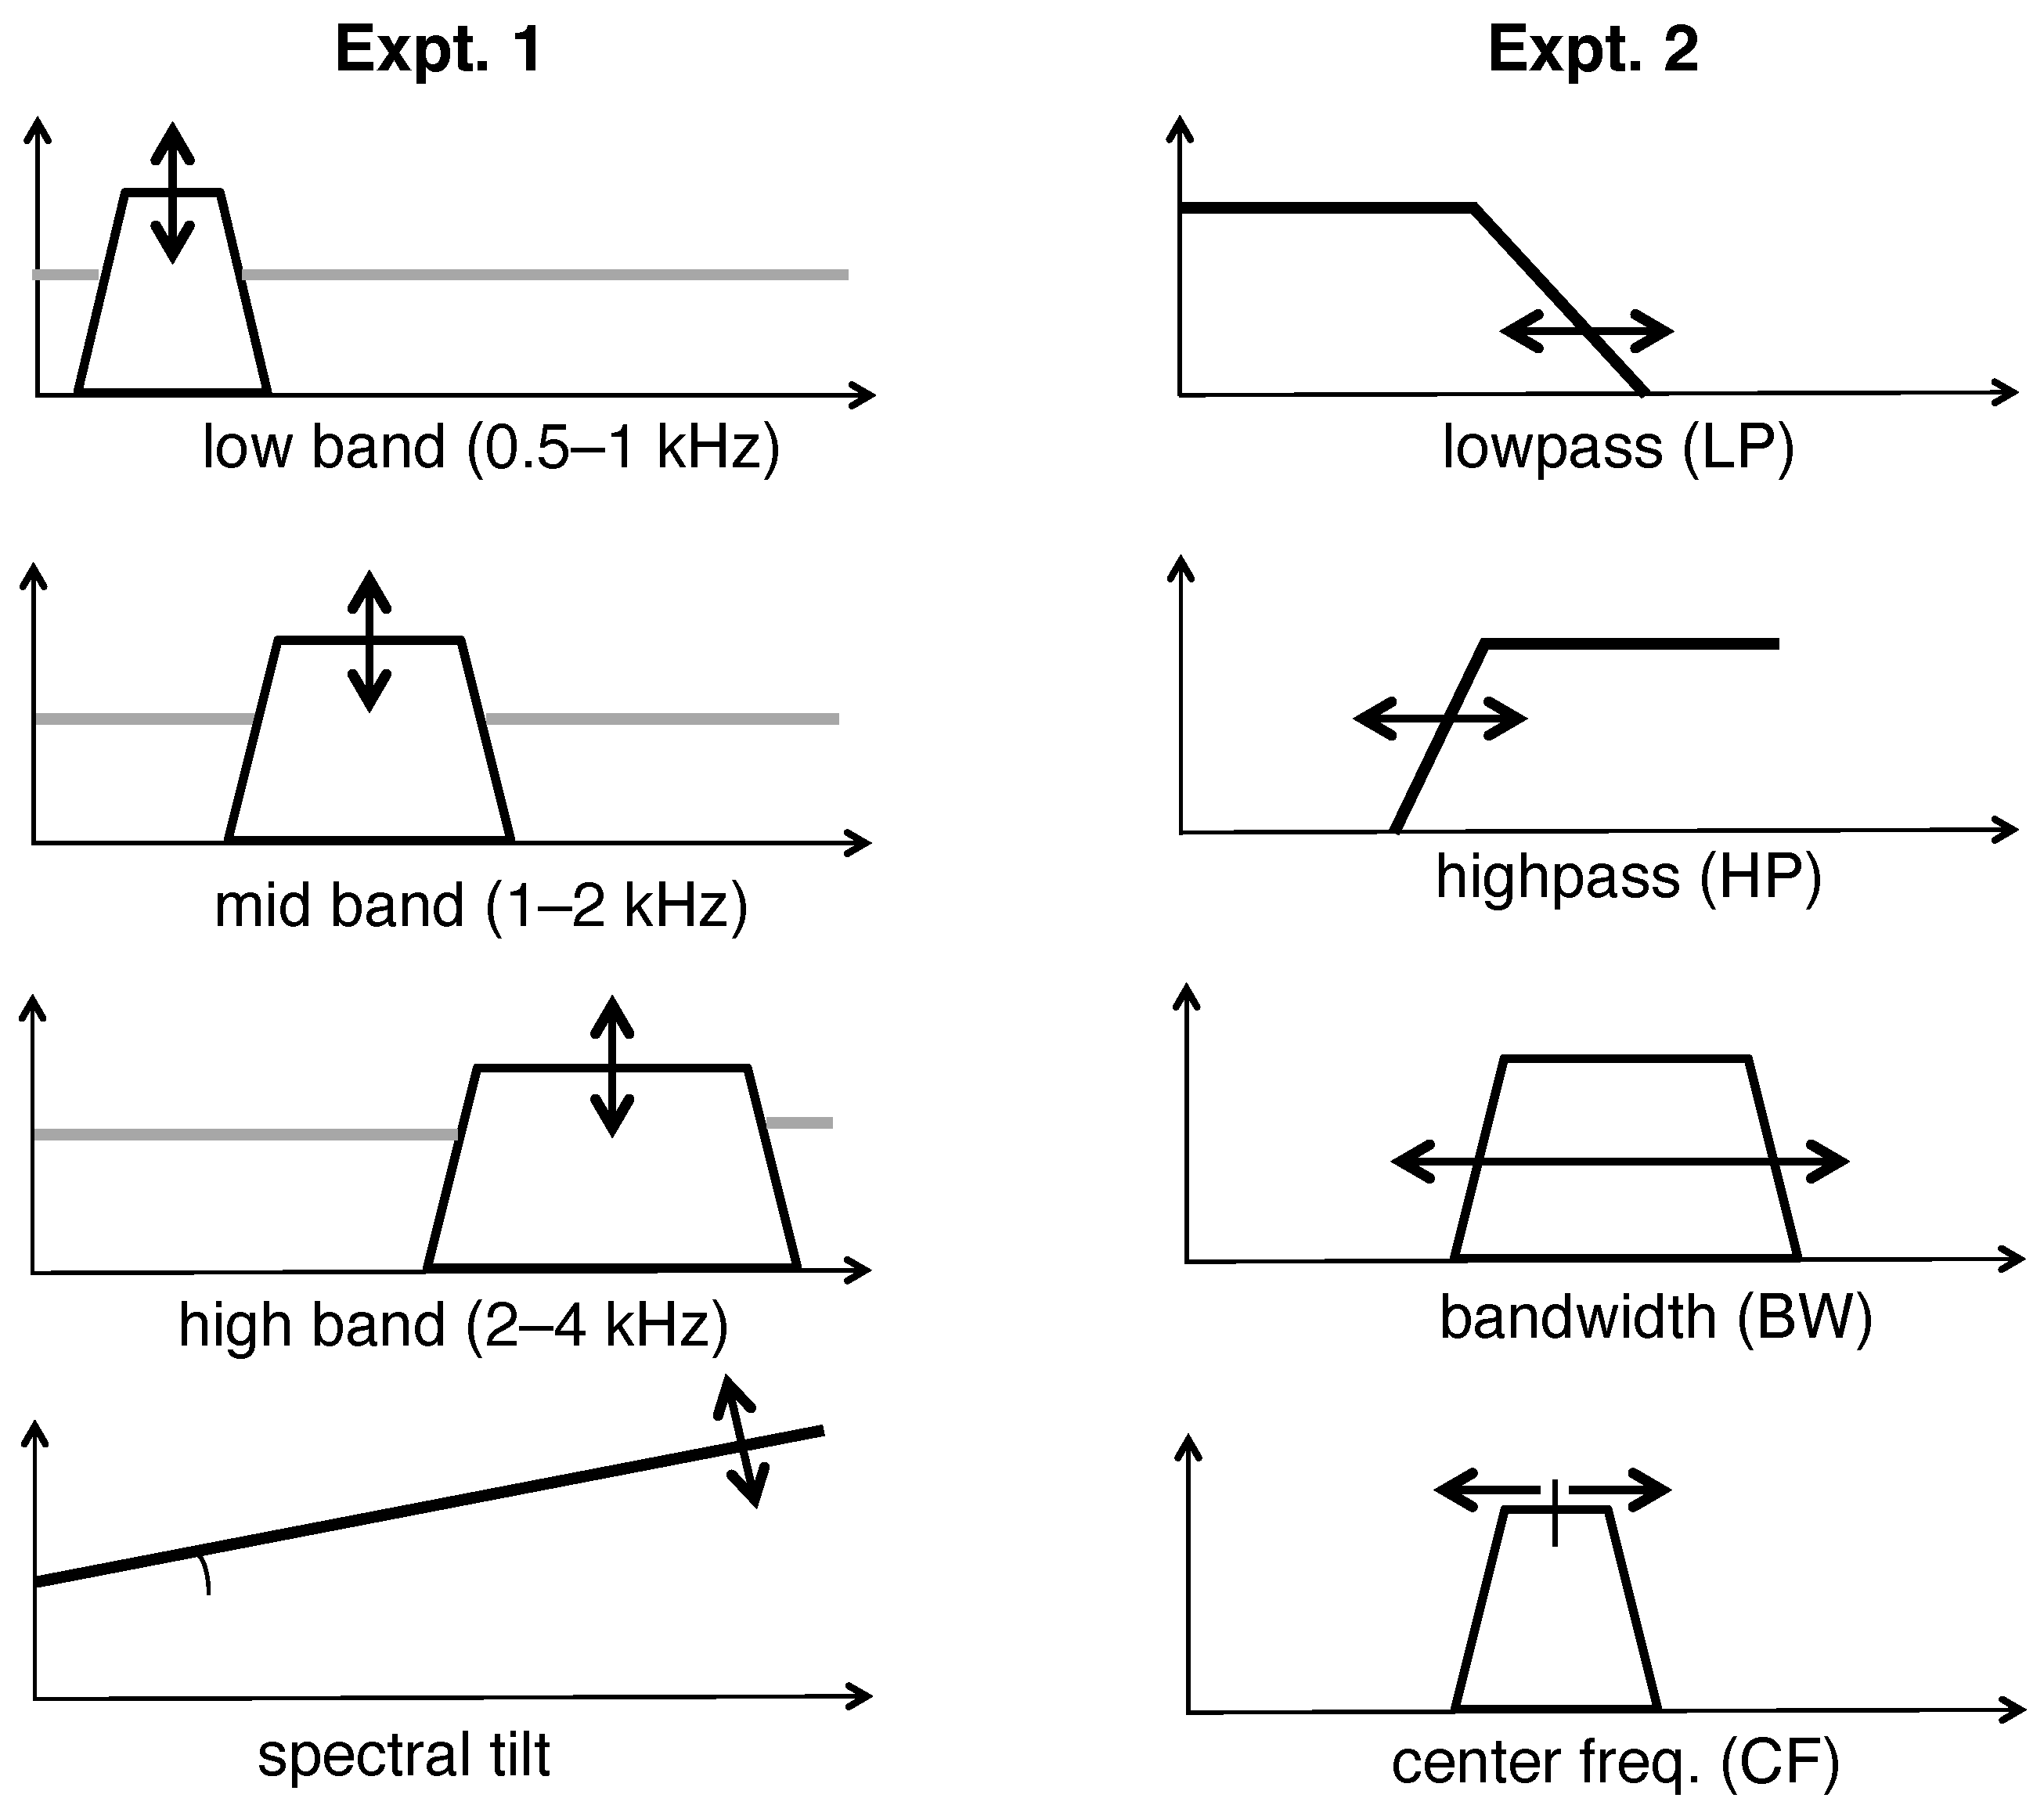
3. Expt. 1: Spectral Reallocation Preferences for Full-Bandwidth Speech
3.1. Listeners
3.2. Stimuli
3.2.1. Spectral Tilt Adjustment
3.2.2. Spectral Band Filtering
3.3. Procedure
3.4. Postprocessing
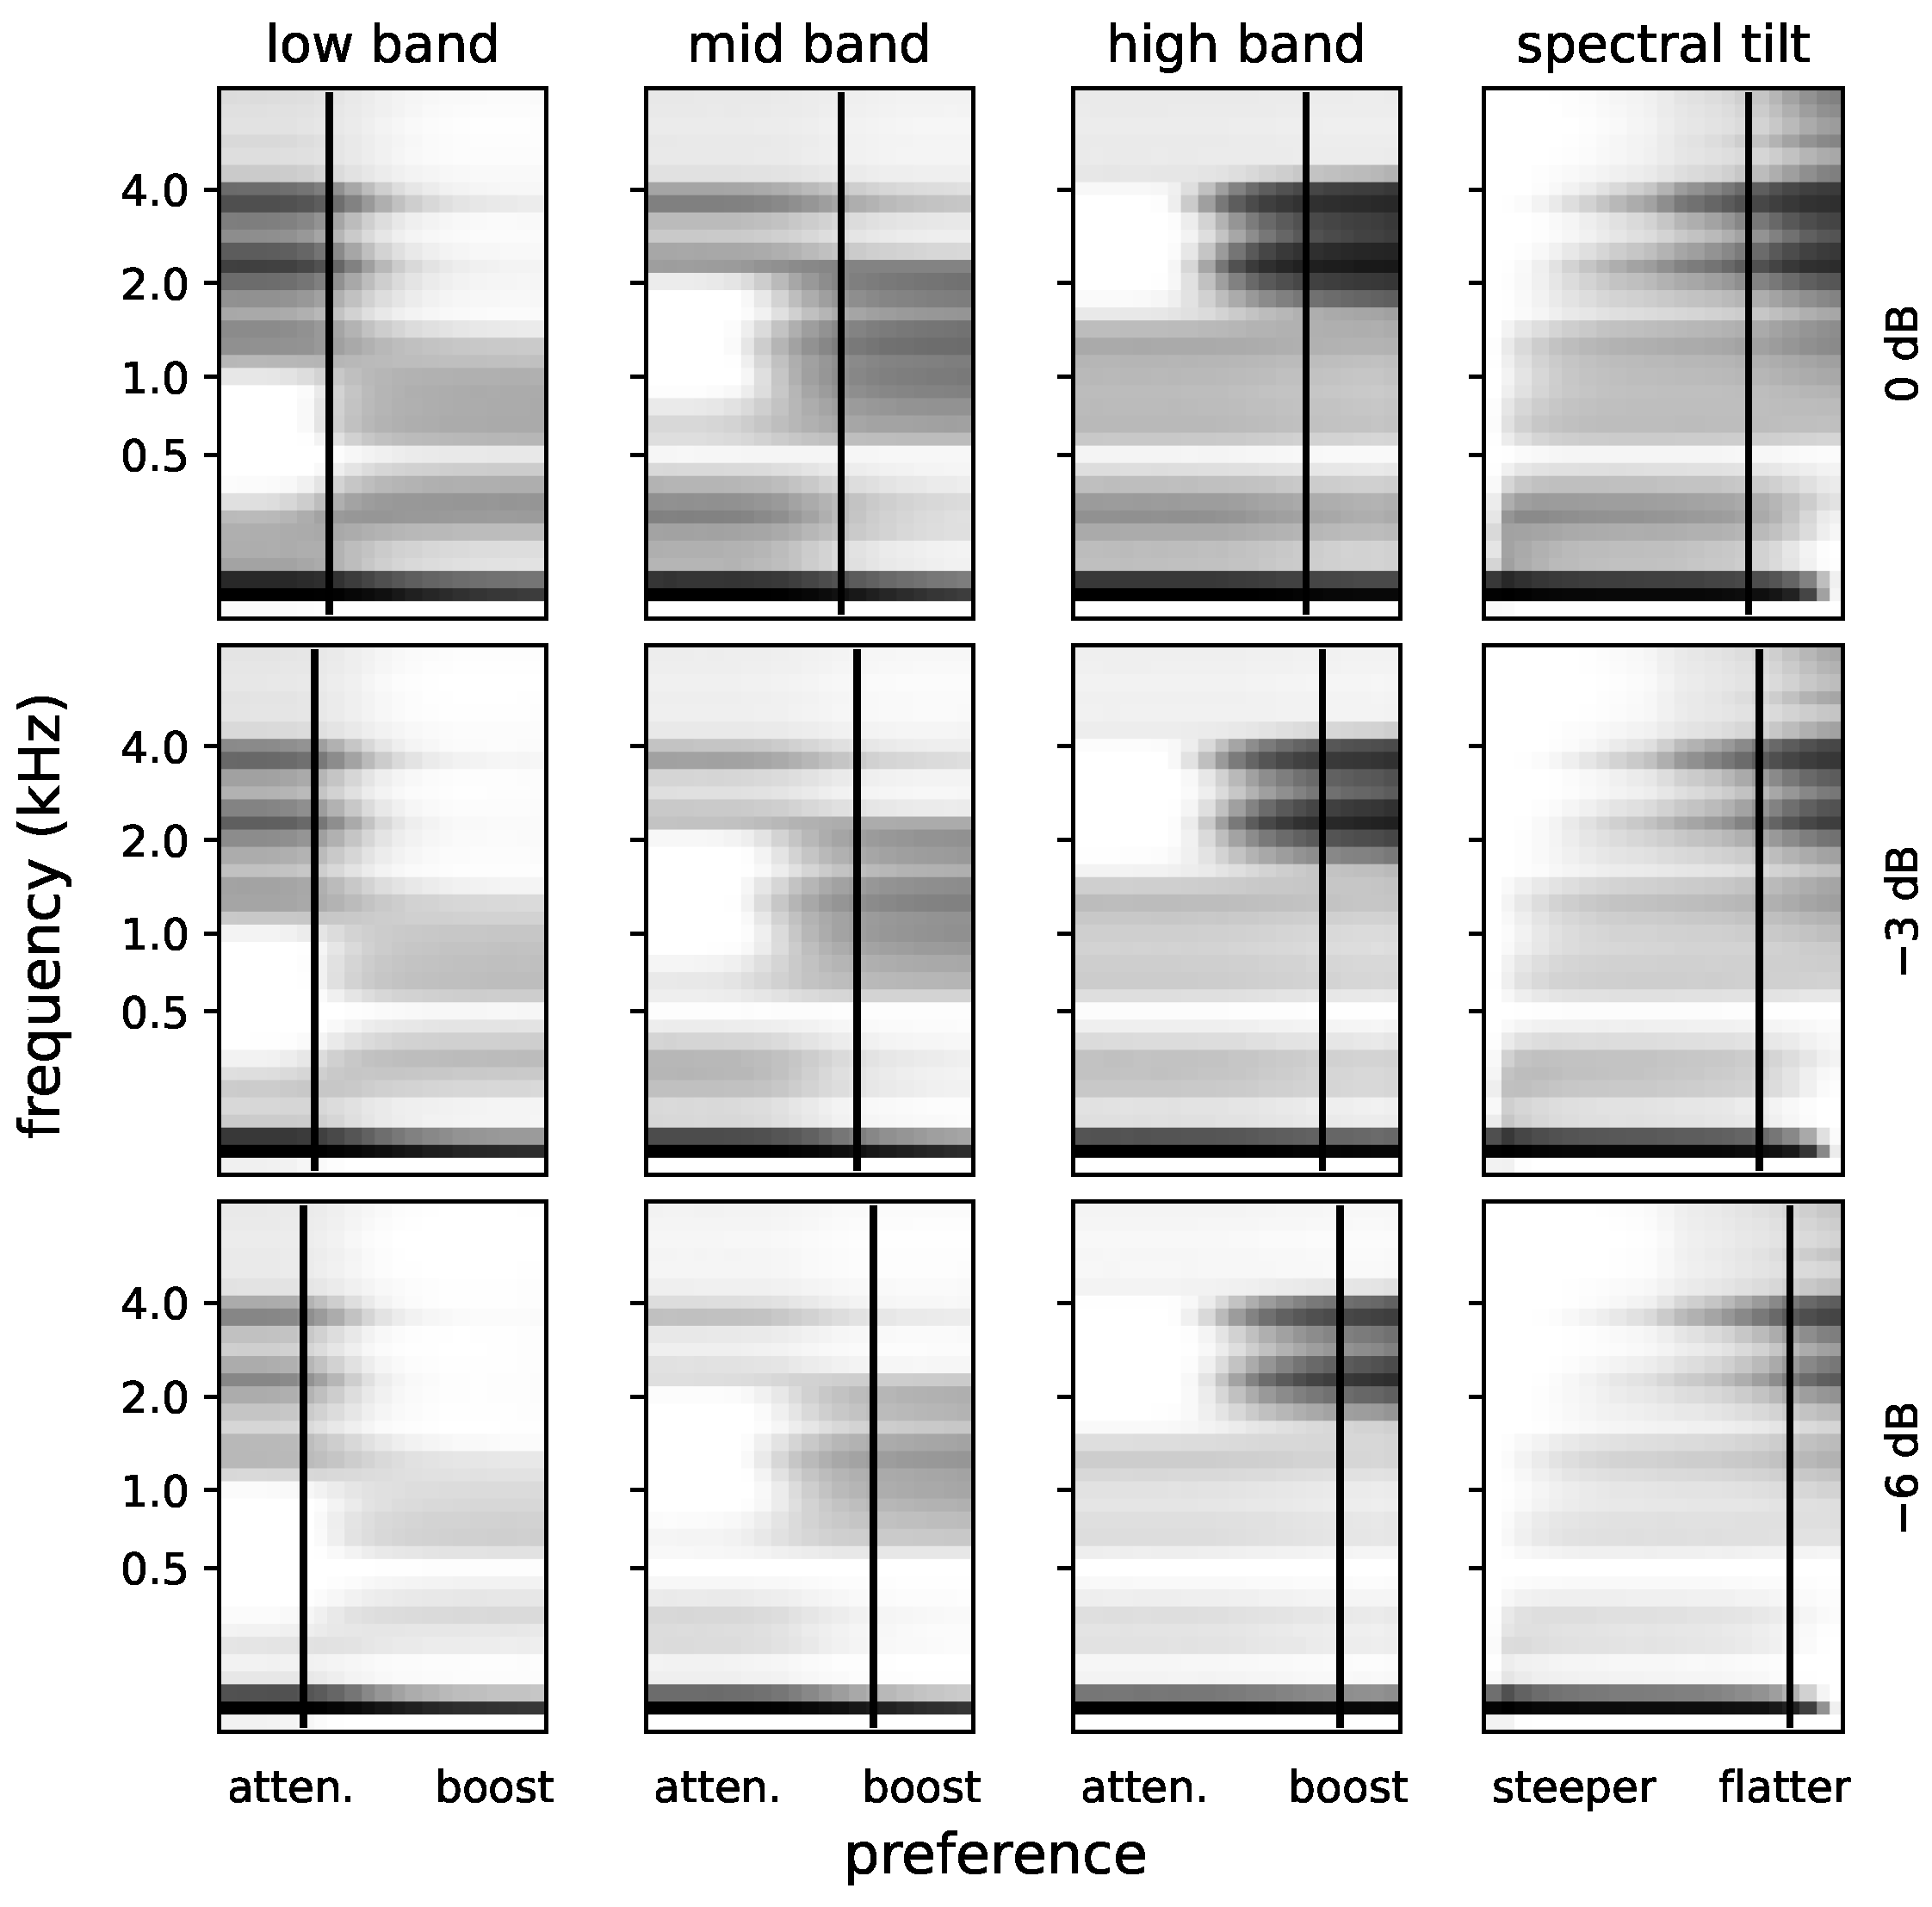
3.5. Results
3.5.1. Preferences
3.5.2. Intelligibility
3.5.3. Adjustment Time
3.5.4. Relationship between Preference and Intelligibility
3.5.5. Energetic Masking
3.6. Interim Discussion
4. Expt. 2: Spectral Reallocation Preferences for Band-Limited Speech
4.1. Listeners
4.2. Stimuli
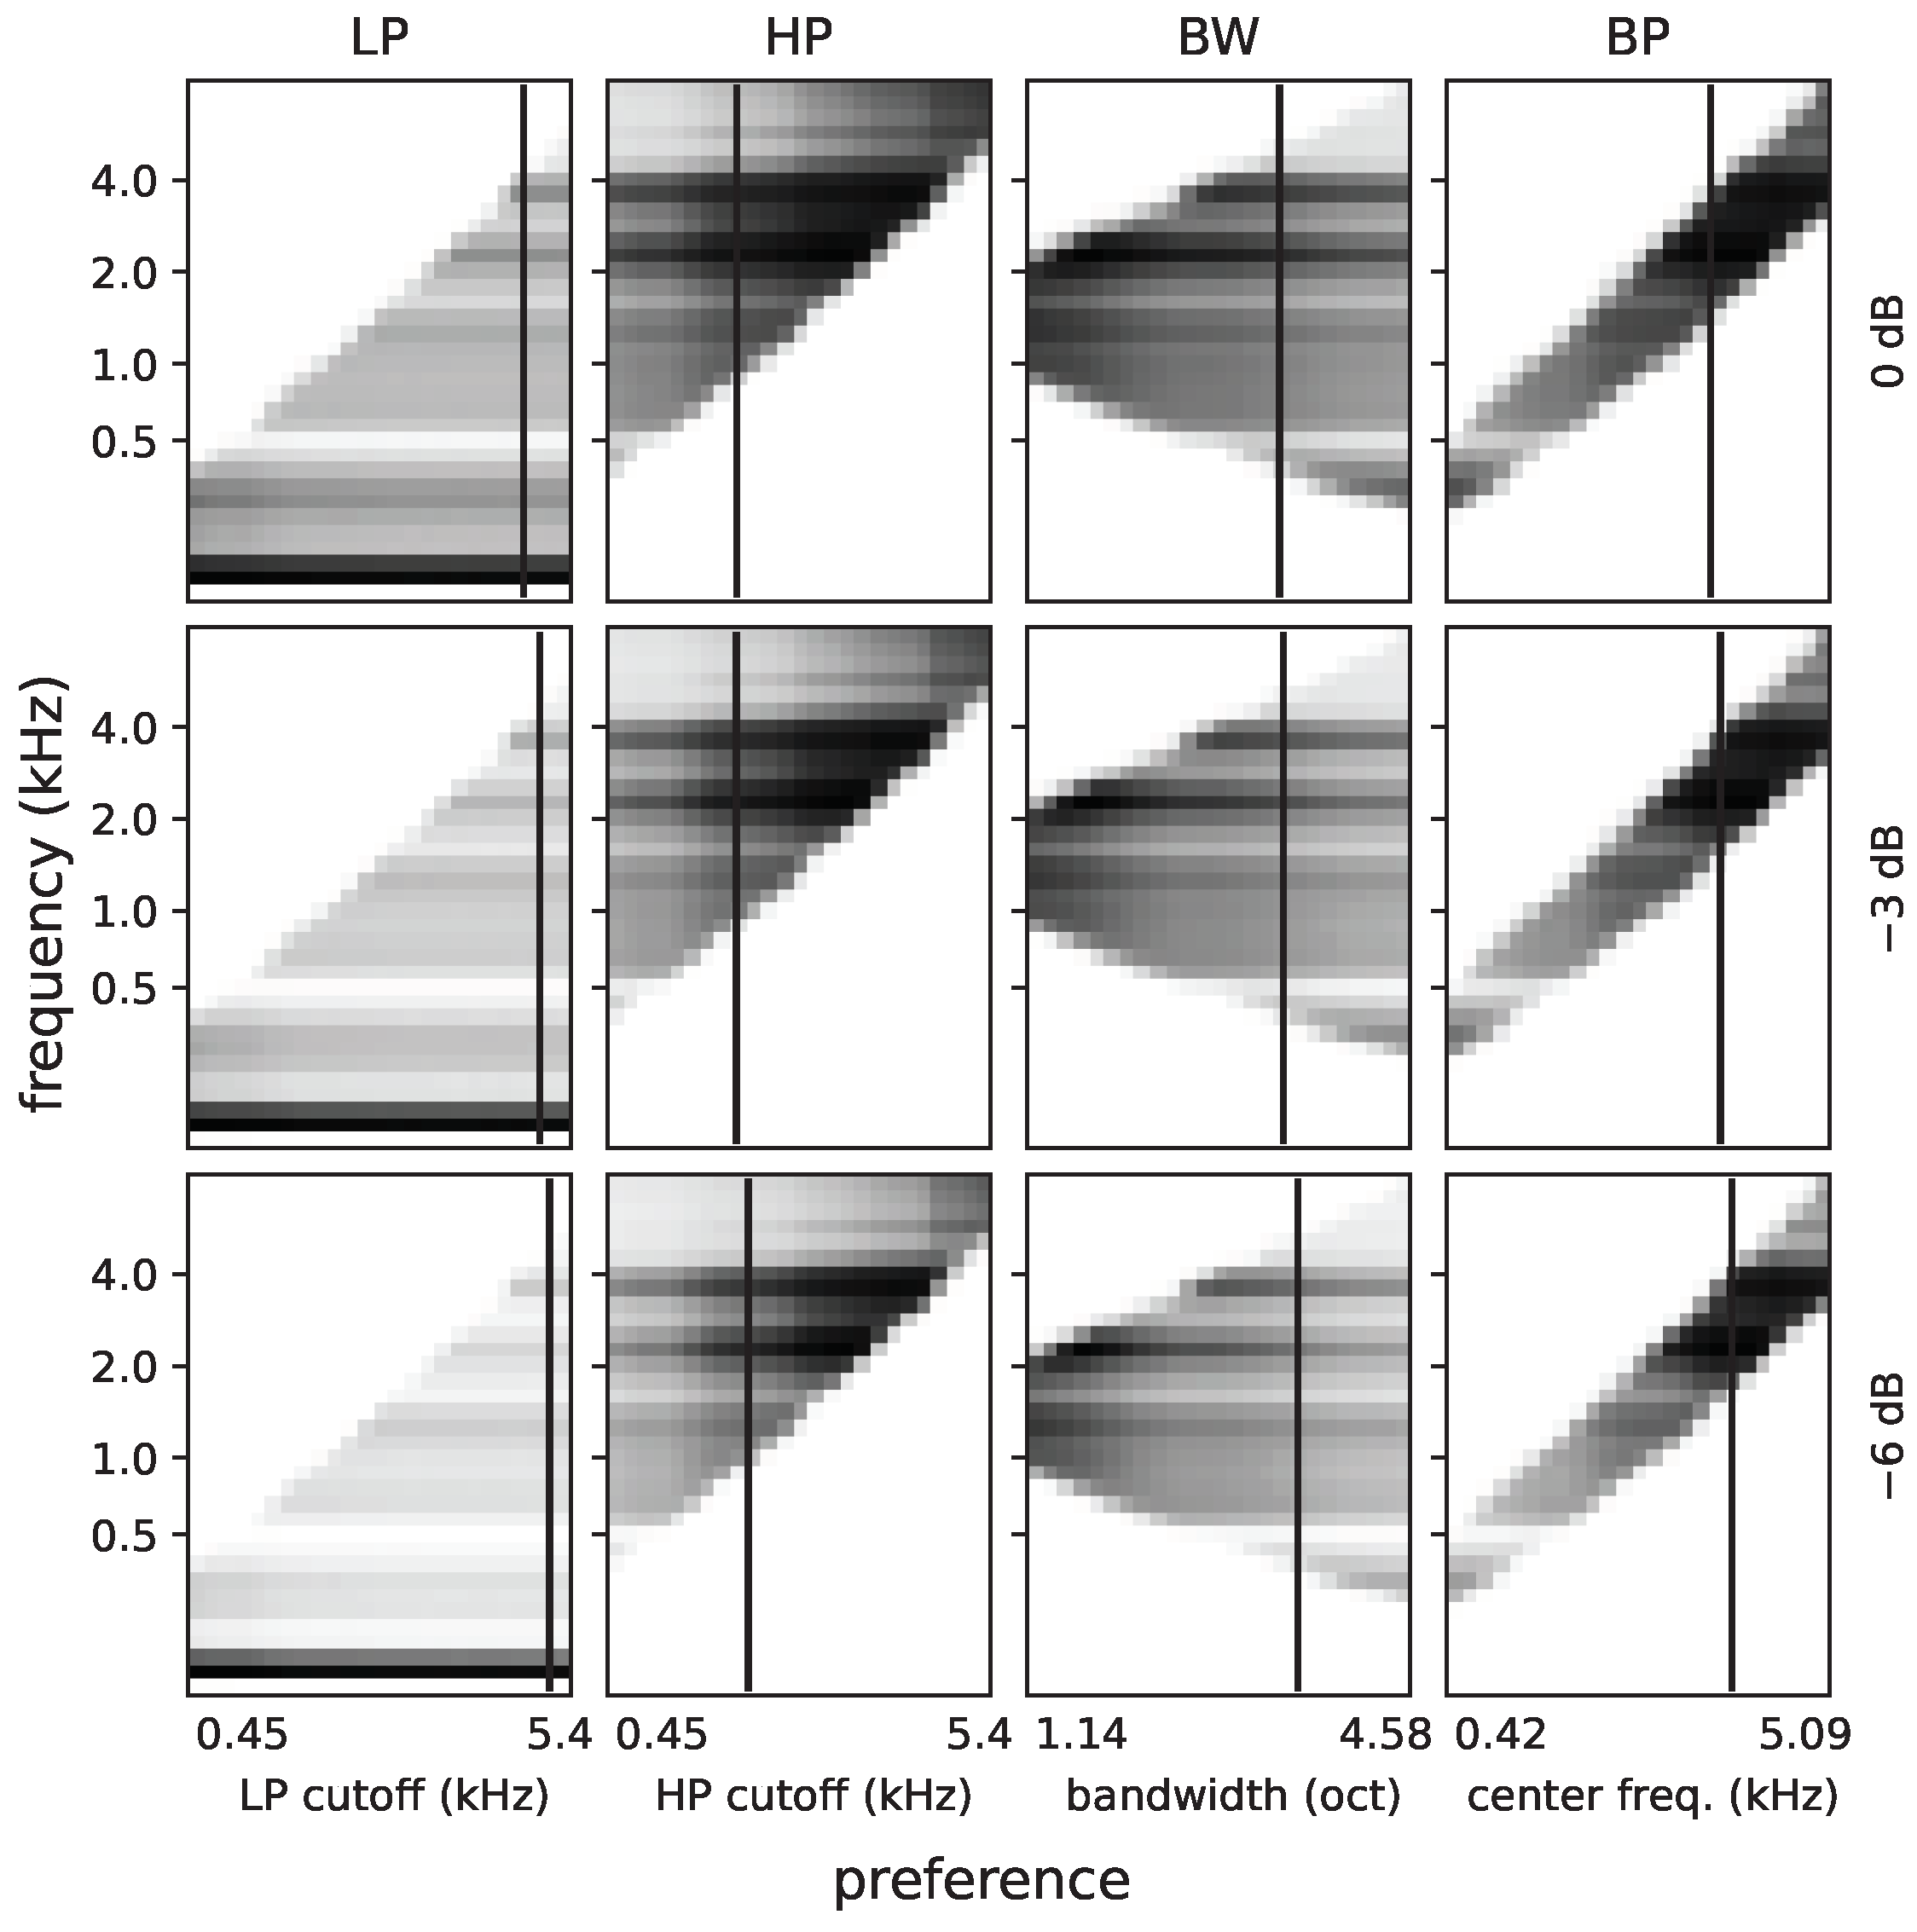
4.3. Results
4.3.1. Preferences
4.3.2. Intelligibility
4.3.3. Adjustment Time
4.3.4. Relationship between Preference and Intelligibility
4.3.5. Energetic Masking
4.4. Interim Discussion
5. General Discussion
5.1. Do Listeners’ Preferences Optimise Intelligibility?
5.2. Do Listeners Solely Optimise Intelligibility?
5.3. How Do Preferences Change When Listening in Noise?
5.4. Limitations and Further Studies
5.5. Potential Impact
6. Conclusions
Author Contributions
Funding
Institutional Review Board Statement
Informed Consent Statement
Data Availability Statement
Conflicts of Interest
Abbreviations
| RMS | Root-Mean-Square |
| SNR | Signal-to-Noise Ratio |
| LP | Low-pass |
| HP | High-pass |
| BW | Bandwidth |
| CF | Centre Frequency |
| SSN | Speech-Shaped Noise |
| NELE | Near-End Listening Enhancement |
| OIM | Objective Intelligibility Measures |
References
- Sauert, B.; Vary, P. Near end listening enhancement: Speech intelligibility improvement in noisy environments. In Proceedings of the International Conference on Acoustics, Speech and Signal Processing, Toulouse, France, 14–19 May 2006; pp. 493–496. [Google Scholar]
- Skowronski, M.D.; Harris, J.G. Applied principles of clear and Lombard speech for automated intelligibility enhancement in noisy environments. Speech Commun. 2006, 48, 549–558. [Google Scholar] [CrossRef]
- Yoo, S.D.; Boston, J.R.; El-Jaroudi, A.; Li, C.C.; Durrant, J.D.; Kovacyk, K.; Shaiman, S. Speech signal modification to increase intelligibility in noisy environments. J. Acoust. Soc. Am. 2007, 122, 1138–1149. [Google Scholar] [CrossRef] [PubMed]
- Brouckxon, H.; Verhelst, W.; Schuymer, B.D. Time and frequency dependent amplification for speech intelligibility enhancement in noisy environments. In Proceedings of the Ninth Annual Conference of the International Speech Communication Association, Brisbane, Australia, 22–26 September 2008; pp. 557–560. [Google Scholar] [CrossRef]
- Zorila, T.C.; Kandia, V.; Stylianou, Y. Speech-in-noise intelligibility improvement based on spectral shaping and dynamic range compression. In Proceedings of the Thirteenth Annual Conference of the International Speech Communication Association, Portland, OR, USA, 9–13 September 2012; pp. 635–638. [Google Scholar] [CrossRef]
- Taal, C.H.; Hendriks, R.C.; Heusdens, R. Speech energy redistribution for intelligibility improvement in noise based on a perceptual distortion measure. Comp. Speech Lang. 2014, 28, 858–872. [Google Scholar] [CrossRef]
- Schepker, H.; Rennies, J.; Doclo, S. Speech-in-noise enhancement using amplification and dynamic range compression controlled by the speech intelligibility index. J. Acoust. Soc. Am. 2015, 138, 2692–2706. [Google Scholar] [CrossRef] [PubMed]
- Cooke, M.; Mayo, C.; Valentini-Botinhao, C.; Stylianou, Y.; Sauert, B.; Tang, Y. Evaluating the intelligibility benefit of speech modifications in known noise conditions. Speech Commun. 2013, 55, 572–585. [Google Scholar] [CrossRef]
- Rennies, J.; Schepker, H.; Valentini-Botinhao, C.; Cooke, M. Intelligibility-enhancing speech modifications—The Hurricane Challenge 2.0. In Proceedings of the Interspeech, Shanghai, China, 25–29 October 2020; pp. 1341–1345. [Google Scholar] [CrossRef]
- Chermaz, C.; King, S. A sound engineering approach to near end listening enhancement. In Proceedings of the Interspeech, Shanghai, China, 25–29 October 2020; pp. 1356–1360. [Google Scholar] [CrossRef]
- Valentini-Botinhao, C.; Yamagishi, J.; King, S.; Stylianou, Y. Combining perceptually-motivated spectral shaping with loudness and duration modification for intelligibility enhancement of HMM-based synthetic speech in noise. In Proceedings of the Interspeech, Lyon, France, 25–29 August 2013; pp. 3567–3571. [Google Scholar] [CrossRef]
- Erro, D.; Zorila, T.C.; Stylianou, Y. Enhancing the intelligibility of statistically generated synthetic speech by means of noise-independent modifications. IEEE/ACM Trans. Audio Speech Lang. Process. 2014, 22, 2101–2111. [Google Scholar] [CrossRef]
- Paul, D.; Shifas, M.P.; Pantazis, Y.; Stylianou, Y. Enhancing speech intelligibility in text-to-speech synthesis using speaking style conversion. In Proceedings of the Interspeech, Shanghai, China, 25–29 October 2020; pp. 1361–1365. [Google Scholar] [CrossRef]
- García Lecumberri, M.L.; Cooke, M.; Cutler, A. Non-native speech perception in adverse conditions: A review. Speech Commun. 2010, 52, 864–886. [Google Scholar] [CrossRef] [Green Version]
- Stilp, C.E.; Kluender, K.R. Cochlea-scaled entropy, not consonants, vowels, or time, best predicts speech intelligibility. Proc. Natl. Acad. Sci. USA 2010, 107, 12387–12392. [Google Scholar] [CrossRef]
- Drullman, R.; Festen, J.M.; Plomp, R. Effect of reducing slow temporal modulations on speech reception. J. Acoust. Soc. Am. 1994, 95, 2670–2680. [Google Scholar] [CrossRef]
- Ghitza, O. On the Role of Theta-Driven Syllabic Parsing in Decoding Speech: Intelligibility of Speech with a Manipulated Modulation Spectrum. Front. Psychol. 2012, 3, 238. [Google Scholar] [CrossRef] [Green Version]
- Fogerty, D.; Kewley-Port, D. Perceptual contributions of the consonant-vowel boundary to sentence intelligibility. J. Acoust. Soc. Am. 2009, 126, 847–857. [Google Scholar] [CrossRef]
- Stevens, K. Acoustic Phonetics; Current Studies in Linguistics; MIT Press: Cambridge, MA, USA, 2000. [Google Scholar]
- Kent, R.; Read, C. The Acoustic Analysis of Speech; Singular/Thomson Learning: London, UK, 2002. [Google Scholar]
- Johnson, K. Acoustic and Auditory Phonetics; Wiley-Blackwell: Hoboken, NJ, USA, 2011. [Google Scholar]
- Ladefoged, P.; Johnson, K. A Course in Phonetics; Cengage Learning: Boston, MA, USA, 2014. [Google Scholar]
- Shannon, R.V.; Zeng, F.G.; Kamath, V.; Wygonski, J.; Ekelid, M. Speech recognition with primarily temporal cues. Science 1995, 270, 303–304. [Google Scholar] [CrossRef]
- Warren, R.M.; Riener, K.R.; Bashford, J.A.; Brubaker, B.S. Spectral redundancy: Intelligibility of sentences heard through narrow spectral slits. Percept. Psychophys. 1995, 57, 175–182. [Google Scholar] [CrossRef]
- Lippmann, R.P. Accurate consonant perception without mid-frequency speech energy. IEEE Trans. Speech Audio 1996, 4, 66–69. [Google Scholar] [CrossRef]
- Cooke, M. A glimpsing model of speech perception in noise. J. Acoust. Soc. Am. 2006, 119, 1562–1573. [Google Scholar] [CrossRef]
- Kjems, U.; Boldt, J.B.; Pedersen, M.S.; Lunner, T.; Wang, D. Role of mask pattern in intelligibility of ideal binary-masked noisy speech. J. Acoust. Soc. Am. 2009, 126, 1415–1426. [Google Scholar] [CrossRef]
- French, N.R.; Steinberg, J.C. Factors governing the intelligibility of speech sounds. J. Acoust. Soc. Am. 1947, 19, 90–119. [Google Scholar] [CrossRef]
- Dau, T.; Püschel, D.; Kohlrausch, A. A quantitative model of the “effective” signal processing in the auditory system. I. Model structure. J. Acoust. Soc. Am. 1996, 99, 3615–3622. [Google Scholar] [CrossRef]
- ANSI S3.5-1997; American National Standard: Methods for Calculation of Speech Intelligibility Index. American Natlonal Standards Institute, Inc.: New York, NY, USA, 1997.
- Christiansen, C.; Pedersen, M.S.; Dau, T. Prediction of speech intelligibility based on an auditory preprocessing model. Speech Commun. 2010, 52, 678–692. [Google Scholar] [CrossRef]
- Tang, Y.; Cooke, M. Glimpse-based metrics for predicting speech intelligibility in additive noise conditions. In Proceedings of the Interspeech, San Francisco, CA, USA, 8–12 September 2016; pp. 2488–2492. [Google Scholar] [CrossRef] [Green Version]
- Kryter, K.D. Methods for the calculation and use of the articulation index. J. Acoust. Soc. Am. 1962, 34, 1689–1697. [Google Scholar] [CrossRef]
- Ma, J.; Hu, Y.; Loizou, P. Objective measures for predicting speech intelligibility in noisy conditions based on new band-importance functions. J. Acoust. Soc. Am. 2009, 125, 3387–3405. [Google Scholar] [CrossRef] [PubMed]
- Healy, E.W.; Yoho, S.E.; Apoux, F. Band importance for sentences and words reexamined. J. Acoust. Soc. Am. 2013, 133, 463–473. [Google Scholar] [CrossRef] [PubMed] [Green Version]
- Krause, J.C.; Braida, L.D. Acoustic properties of naturally produced clear speech at normal speaking rates. J. Acoust. Soc. Am. 2004, 115, 362–378. [Google Scholar] [CrossRef]
- Uchanski, R.M. Clear speech. In The Handbook of Speech Perception; John Wiley & Sons, Ltd: Hoboken, NJ, USA, 2005; pp. 207–235. [Google Scholar]
- Summers, W.V.; Pisoni, D.B.; Bernacki, R.H.; Pedlow, R.I.; Stokes, M.A. Effects of noise on speech production: Acoustic and perceptual analyses. J. Acoust. Soc. Am. 1988, 84, 917–928. [Google Scholar] [CrossRef] [PubMed]
- Junqua, J.C. The Lombard reflex and its role on human listeners and automatic speech recognizers. J. Acoust. Soc. Am. 1993, 93, 510–524. [Google Scholar] [CrossRef]
- Garnier, M.; Henrich, N. Speaking in noise: How does the Lombard effect improve acoustic contrasts between speech and ambient noise? Comp. Speech Lang. 2014, 28, 580–597. [Google Scholar] [CrossRef]
- Takou, R.; Seiyama, N.; Imai, A. Improvement of speech intelligibility by reallocation of spectral energy. In Proceedings of the Interspeech, Lyon, France, 25–29 August 2013; pp. 3605–3607. Available online: https://www.isca-speech.org/archive/interspeech_2013/takou13_interspeech.html (accessed on 20 July 2023).
- Cooke, M.; Mayo, C.; Villegas, J. The contribution of durational and spectral changes to the Lombard speech intelligibility benefit. J. Acoust. Soc. Am. 2014, 135, 874–883. [Google Scholar] [CrossRef] [PubMed] [Green Version]
- Jokinen, E.; Takanen, M.; Vainio, M.; Alku, P. An adaptive post-filtering method producing an artificial Lombard-like effect for intelligibility enhancement of narrowband telephone speech. Comp. Speech Lang. 2014, 28, 619–628. [Google Scholar] [CrossRef]
- Tang, Y.; Cooke, M. Learning static spectral weightings for speech intelligibility enhancement in noise. Comp. Speech Lang. 2018, 49, 1–16. [Google Scholar] [CrossRef] [Green Version]
- Hall, J.L.; Flanagan, J.L. Intelligibility and listener preference of telephone speech in the presence of babble noise. J. Acoust. Soc. Am. 2010, 127, 280–285. [Google Scholar] [CrossRef]
- Moller, S. Assessment and Prediction of Speech Quality in Telecommunications; Springer: Berlin, Germany, 2000. [Google Scholar]
- Zekveld, A.A.; Kramer, S.E.; Festen, J.M. Pupil response as an indication of effortful listening: The influence of sentence intelligibility. Ear Heart 2010, 31, 480–490. [Google Scholar] [CrossRef] [PubMed]
- Dall, R.; Yamagishi, J.; King, S. Rating naturalness in speech synthesis: The effect of style and expectation. In Proceedings of the Speech Prosody 2014, Dublin, Ireland, 20–23 May 2014; pp. 1012–1016. [Google Scholar] [CrossRef]
- Zorilă, T.C.; Stylianou, Y. On the quality and intelligibility of noisy speech processed for near-end listening enhancement. In Proceedings of the Interspeech, Stockholm, Sweden, 20–24 August 2017; pp. 2023–2027. [Google Scholar] [CrossRef] [Green Version]
- Tang, Y.; Arnold, C.; Cox, T. A study on the relationship between the intelligibility and quality of algorithmically-modified speech for normal hearing listeners. J. Otorhinolaryngol. Hear. Balance Med. 2018, 1, 5. [Google Scholar] [CrossRef] [Green Version]
- Delogu, C.; Conte, S.; Sementina, C. Cognitive factors in the evaluation of synthetic speech. Speech Commun. 1998, 24, 153–168. [Google Scholar] [CrossRef]
- Govender, A.; King, S. Using pupillometry to measure the cognitive load of synthetic speech. In Proceedings of the Interspeech, Hyderabad, India, 2–6 September 2018; pp. 2838–2842. [Google Scholar] [CrossRef] [Green Version]
- Simantiraki, O.; Cooke, M.; King, S. Impact of different speech types on listening effort. In Proceedings of the Interspeech, Hyderabad, India, 2–6 September 2018; pp. 2267–2271. [Google Scholar] [CrossRef] [Green Version]
- Rennies, J.; Pusch, A.; Schepker, H.; Doclo, S. Evaluation of a near-end listening enhancement algorithm by combined speech intelligibility and listening effort measurements. J. Acoust. Soc. Am. 2018, 144, EL315–EL321. [Google Scholar] [CrossRef]
- Brons, I.; Houben, R.; Dreschler, W.A. Perceptual effects of noise reduction with respect to personal preference, speech intelligibility, and listening effort. Ear Heart 2013, 34, 29–41. [Google Scholar] [CrossRef] [PubMed]
- Zekveld, A.A.; Kramer, S.E. Cognitive processing load across a wide range of listening conditions: Insights from pupillometry. Psychophysiology 2014, 51, 277–284. [Google Scholar] [CrossRef] [PubMed]
- Sarampalis, A.; Kalluri, S.; Edwards, B.; Hafter, E. Objective measures of listening effort: Effects of background noise and noise reduction. J. Speech Lang. Hear. Res. 2009, 52, 1230–1240. [Google Scholar] [CrossRef]
- Govender, A.; King, S. Measuring the cognitive load of synthetic speech using a dual task paradigm. In Proceedings of the Interspeech, Hyderabad, India, 2–6 September 2018; pp. 2843–2847. [Google Scholar] [CrossRef] [Green Version]
- McGarrigle, R.; Munro, K.J.; Dawes, P.; Stewart, A.J.; Moore, D.R.; Barry, J.G.; Amitay, S. Listening effort and fatigue: What exactly are we measuring? A British Society of Audiology Cognition in Hearing Special Interest Group white paper. Int. J. Audiol. 2014, 53, 433–440. [Google Scholar] [CrossRef]
- Assmann, P.F.; Nearey, T.M. Relationship between fundamental and formant frequencies in voice preference. J. Acoust. Soc. Am. 2007, 122, EL35–EL43. [Google Scholar] [CrossRef]
- Wingfield, A.; Ducharme, J.L. Effects of age and passage difficulty on listening-rate preferences for time-altered speech. J. Gerontol. Ser. B 1999, 54B, P199–P202. [Google Scholar] [CrossRef] [Green Version]
- Novak, J.S.; Kenyon, R.V. Effects of user controlled speech rate on intelligibility in noisy environments. In Proceedings of the Interspeech, Hyderabad, India, 2–6 September 2018; pp. 1853–1857. [Google Scholar]
- Simantiraki, O.; Cooke, M. Exploring listeners’ speech rate preferences. In Proceedings of the Interspeech, Shanghai, China, 25–29 October 2020; pp. 1346–1350. [Google Scholar] [CrossRef]
- Torcoli, M.; Freke-Morin, A.; Paulus, J.; Simon, C.; Shirley, B. Preferred levels for background ducking to produce esthetically pleasing audio for tv with clear speech. J. Audio. Eng. Soc. 2019, 67, 1003–1011. [Google Scholar] [CrossRef] [Green Version]
- Zhang, Z.; Shen, Y. Listener preference on the local criterion for ideal binary-masked speech. In Proceedings of the Interspeech, Graz, Austria, 15–19 September 2019; pp. 1383–1387. [Google Scholar] [CrossRef] [Green Version]
- Boothroyd, A.; Mackersie, C. A “Goldilocks” Approach to Hearing-Aid Self-Fitting: User Interactions. Am. J. Audiol. 2017, 26, 430–435. [Google Scholar] [CrossRef] [PubMed] [Green Version]
- Sabin, A.T.; Tasell, D.J.V.; Rabinowitz, B.; Dhar, S. Validation of a Self-Fitting Method for Over-the-Counter Hearing Aids. Trends Heart 2020, 24, 2331216519900589. [Google Scholar] [CrossRef]
- Simantiraki, O.; Cooke, M.; Pantazis, Y. Effects of spectral tilt on listeners’ preferences and intelligibility. In Proceedings of the International Conference on Acoustics, Speech and Signal Processing, Barcelona, Spain, 4–8 May 2020; pp. 6254–6258. [Google Scholar]
- Simantiraki, O.; Cooke, M. SpeechAdjuster: A tool for investigating listener preferences and speech intelligibility. In Proceedings of the Interspeech, Brno, Czechia, 30 August–3 September 2021; pp. 1718–1722. [Google Scholar] [CrossRef]
- Aubanel, V.; García Lecumberri, M.L.; Cooke, M. The Sharvard Corpus: A phonemically-balanced Spanish sentence resource for audiology. Int. J. Audiol. 2014, 53, 633–638. [Google Scholar] [CrossRef] [PubMed]
- Rothauser, E.H.; Chapman, W.D.; Guttman, N.; Silbiger, H.R.; Hecker, M.H.L.; Urbanek, G.E.; Nordby, K.S.; Weinstock, M. IEEE recommended practice for speech quality measurements. IEEE Trans. Audio Electroacoust. 1969, 17, 225–246. [Google Scholar]
- Cooke, M.; García Lecumberri, M.L. How reliable are online speech intelligibility studies with known listener cohorts? J. Acoust. Soc. Am. 2021, 150, 1390–1401. [Google Scholar] [CrossRef]
- Holm, S. A simple sequentially rejective multiple test procedure. Scand. J. Stat. 1979, 6, 65–70. [Google Scholar]
- Virtanen, P.; Gommers, R.; Oliphant, T.E.; Haberland, M.; Reddy, T.; Cournapeau, D.; Burovski, E.; Peterson, P.; Weckesser, W.; Bright, J.; et al. SciPy 1.0: Fundamental algorithms for scientific computing in Python. Nat. Methods 2020, 17, 261–272. [Google Scholar] [CrossRef] [Green Version]
- Bates, D.; Mächler, M.; Bolker, B.; Walker, S. Fitting linear mixed-effects models using lme4. J. Stat. Softw. 2015, 67, 1–48. [Google Scholar] [CrossRef]
- R Core Team. R: A Language and Environment for Statistical Computing; R Foundation for Statistical Computing: Vienna, Austria, 2021. [Google Scholar]
- Lenth, R.V. Emmeans: Estimated Marginal Means, aka Least-Squares Means, R Package Version 1.5.5-1; 23-06-2023; 2021. Available online: https://cran.r-project.org/web/packages/emmeans/index.html (accessed on 20 July 2023).
- Lu, Y.; Cooke, M. Speech production modifications produced by competing talkers, babble, and stationary noise. J. Acoust. Soc. Am. 2008, 124, 3261–3275. [Google Scholar] [CrossRef] [Green Version]
- Warren, R.M.; Bashford, J.A., Jr.; Lenz, P.W. Intelligibilities of 1-octave rectangular bands spanning the speech spectrum when heard separately and paired. J. Acoust. Soc. Am. 2005, 118, 3261–3266. [Google Scholar] [CrossRef] [PubMed]
- Lu, Y.; Cooke, M. Speech production modifications produced in the presence of low-pass and high-pass filtered noise. J. Acoust. Soc. Am. 2009, 126, 1495–1499. [Google Scholar] [CrossRef]
- Bilger, R.C.; Nuetzel, J.M.; Rabinowitz, W.M.; Rzeczkowski, C. Standardization of a test of speech perception in noise. J. Speech Heart Res. 1984, 27, 32–48. [Google Scholar] [CrossRef] [PubMed]
- Moore, B.C.J.; Tan, C.T. Perceived naturalness of spectrally distorted speech and music. J. Acoust. Soc. Am. 2003, 114, 408–419. [Google Scholar] [CrossRef] [PubMed]
- Gabrielsson, A.; Schenkman, B.; Hagerman, B. The effects of different frequency responses on sound quality judgments and speech intelligibility. J. Speech Lang. Heart Res. 1988, 31, 166–177. [Google Scholar] [CrossRef]
- Rönnberg, J.; Lunner, T.; Zekveld, A.; Sörqvist, P.; Danielsson, H.; Lyxell, B.; Dahlström, O.; Signoret, C.; Stenfelt, S.; Pichora-Fuller, M.; et al. The Ease of Language Understanding (ELU) model: Theoretical, empirical, and clinical advances. Front. Syst. Neurosci. 2013, 7, 31. [Google Scholar] [CrossRef] [PubMed] [Green Version]
- Borghini, G.; Hazan, V. Effects of acoustic and semantic cues on listening effort during native and non-native speech perception. J. Acoust. Soc. Am. 2020, 147, 3783–3794. [Google Scholar] [CrossRef] [PubMed]
- Assmann, P.F.; Dembling, S.; Nearey, T.M. Effects of frequency shifts on perceived naturalness and gender information in speech. In Proceedings of the Ninth International Conference on Spoken Language Processing, Pittsburgh, PA, USA, 17–21 September 2006; pp. 889–892. [Google Scholar]


Disclaimer/Publisher’s Note: The statements, opinions and data contained in all publications are solely those of the individual author(s) and contributor(s) and not of MDPI and/or the editor(s). MDPI and/or the editor(s) disclaim responsibility for any injury to people or property resulting from any ideas, methods, instructions or products referred to in the content. |
© 2023 by the authors. Licensee MDPI, Basel, Switzerland. This article is an open access article distributed under the terms and conditions of the Creative Commons Attribution (CC BY) license (https://creativecommons.org/licenses/by/4.0/).
Share and Cite
Simantiraki, O.; Cooke, M. Listeners’ Spectral Reallocation Preferences for Speech in Noise. Appl. Sci. 2023, 13, 8734. https://doi.org/10.3390/app13158734
Simantiraki O, Cooke M. Listeners’ Spectral Reallocation Preferences for Speech in Noise. Applied Sciences. 2023; 13(15):8734. https://doi.org/10.3390/app13158734
Chicago/Turabian StyleSimantiraki, Olympia, and Martin Cooke. 2023. "Listeners’ Spectral Reallocation Preferences for Speech in Noise" Applied Sciences 13, no. 15: 8734. https://doi.org/10.3390/app13158734