
Pointer Meter Recognition Method Based on Yolov7 and Hough Transform
Abstract
:1. Introduction
- Yolov7 object detection technology is employed, which is the latest Yolo technology, to accurately and quickly locate instruments in complex backgrounds and enhance instrument recognition accuracy.
- Relatively little research has been conducted on square pointer gauges to provide a formula for pointer readings. This formula fills the research gap in the field of square pointer instruments and provides an effective method for accurately reading the value indicated by the pointer.
- For instruments of different models and ranges, the PGNet method is used to identify scale values and models, which exhibits high robustness.
2. Related Work
3. Pointer Meter Recognition Method
3.1. Yolov7
3.2. DeepLabv3+
3.3. Thinning
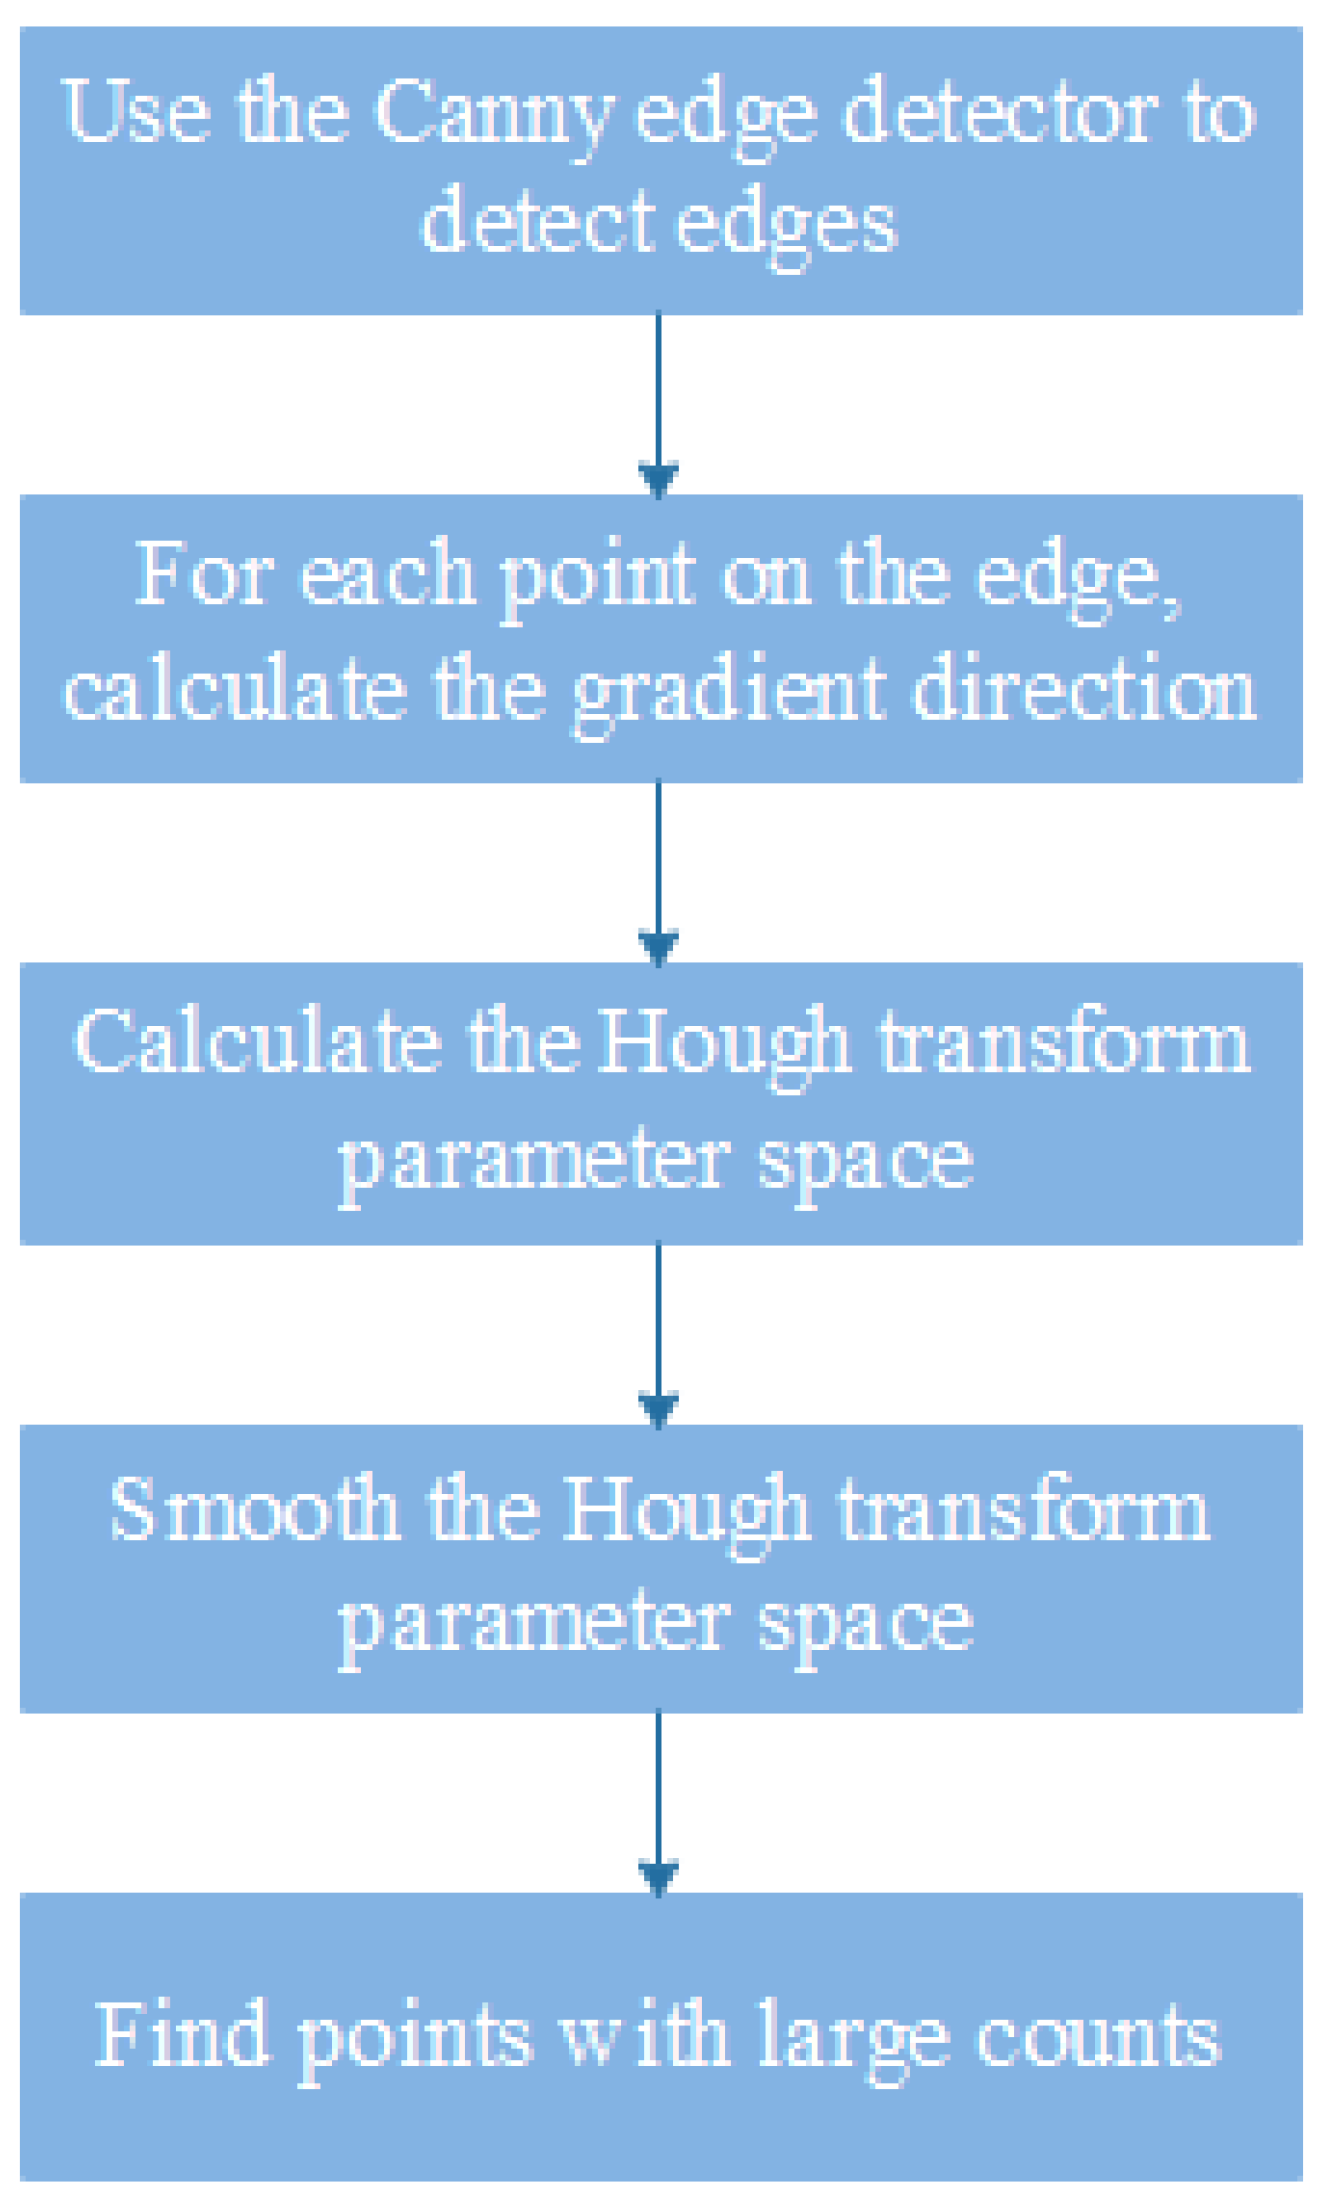
3.4. Hough Transform
3.5. PGNet
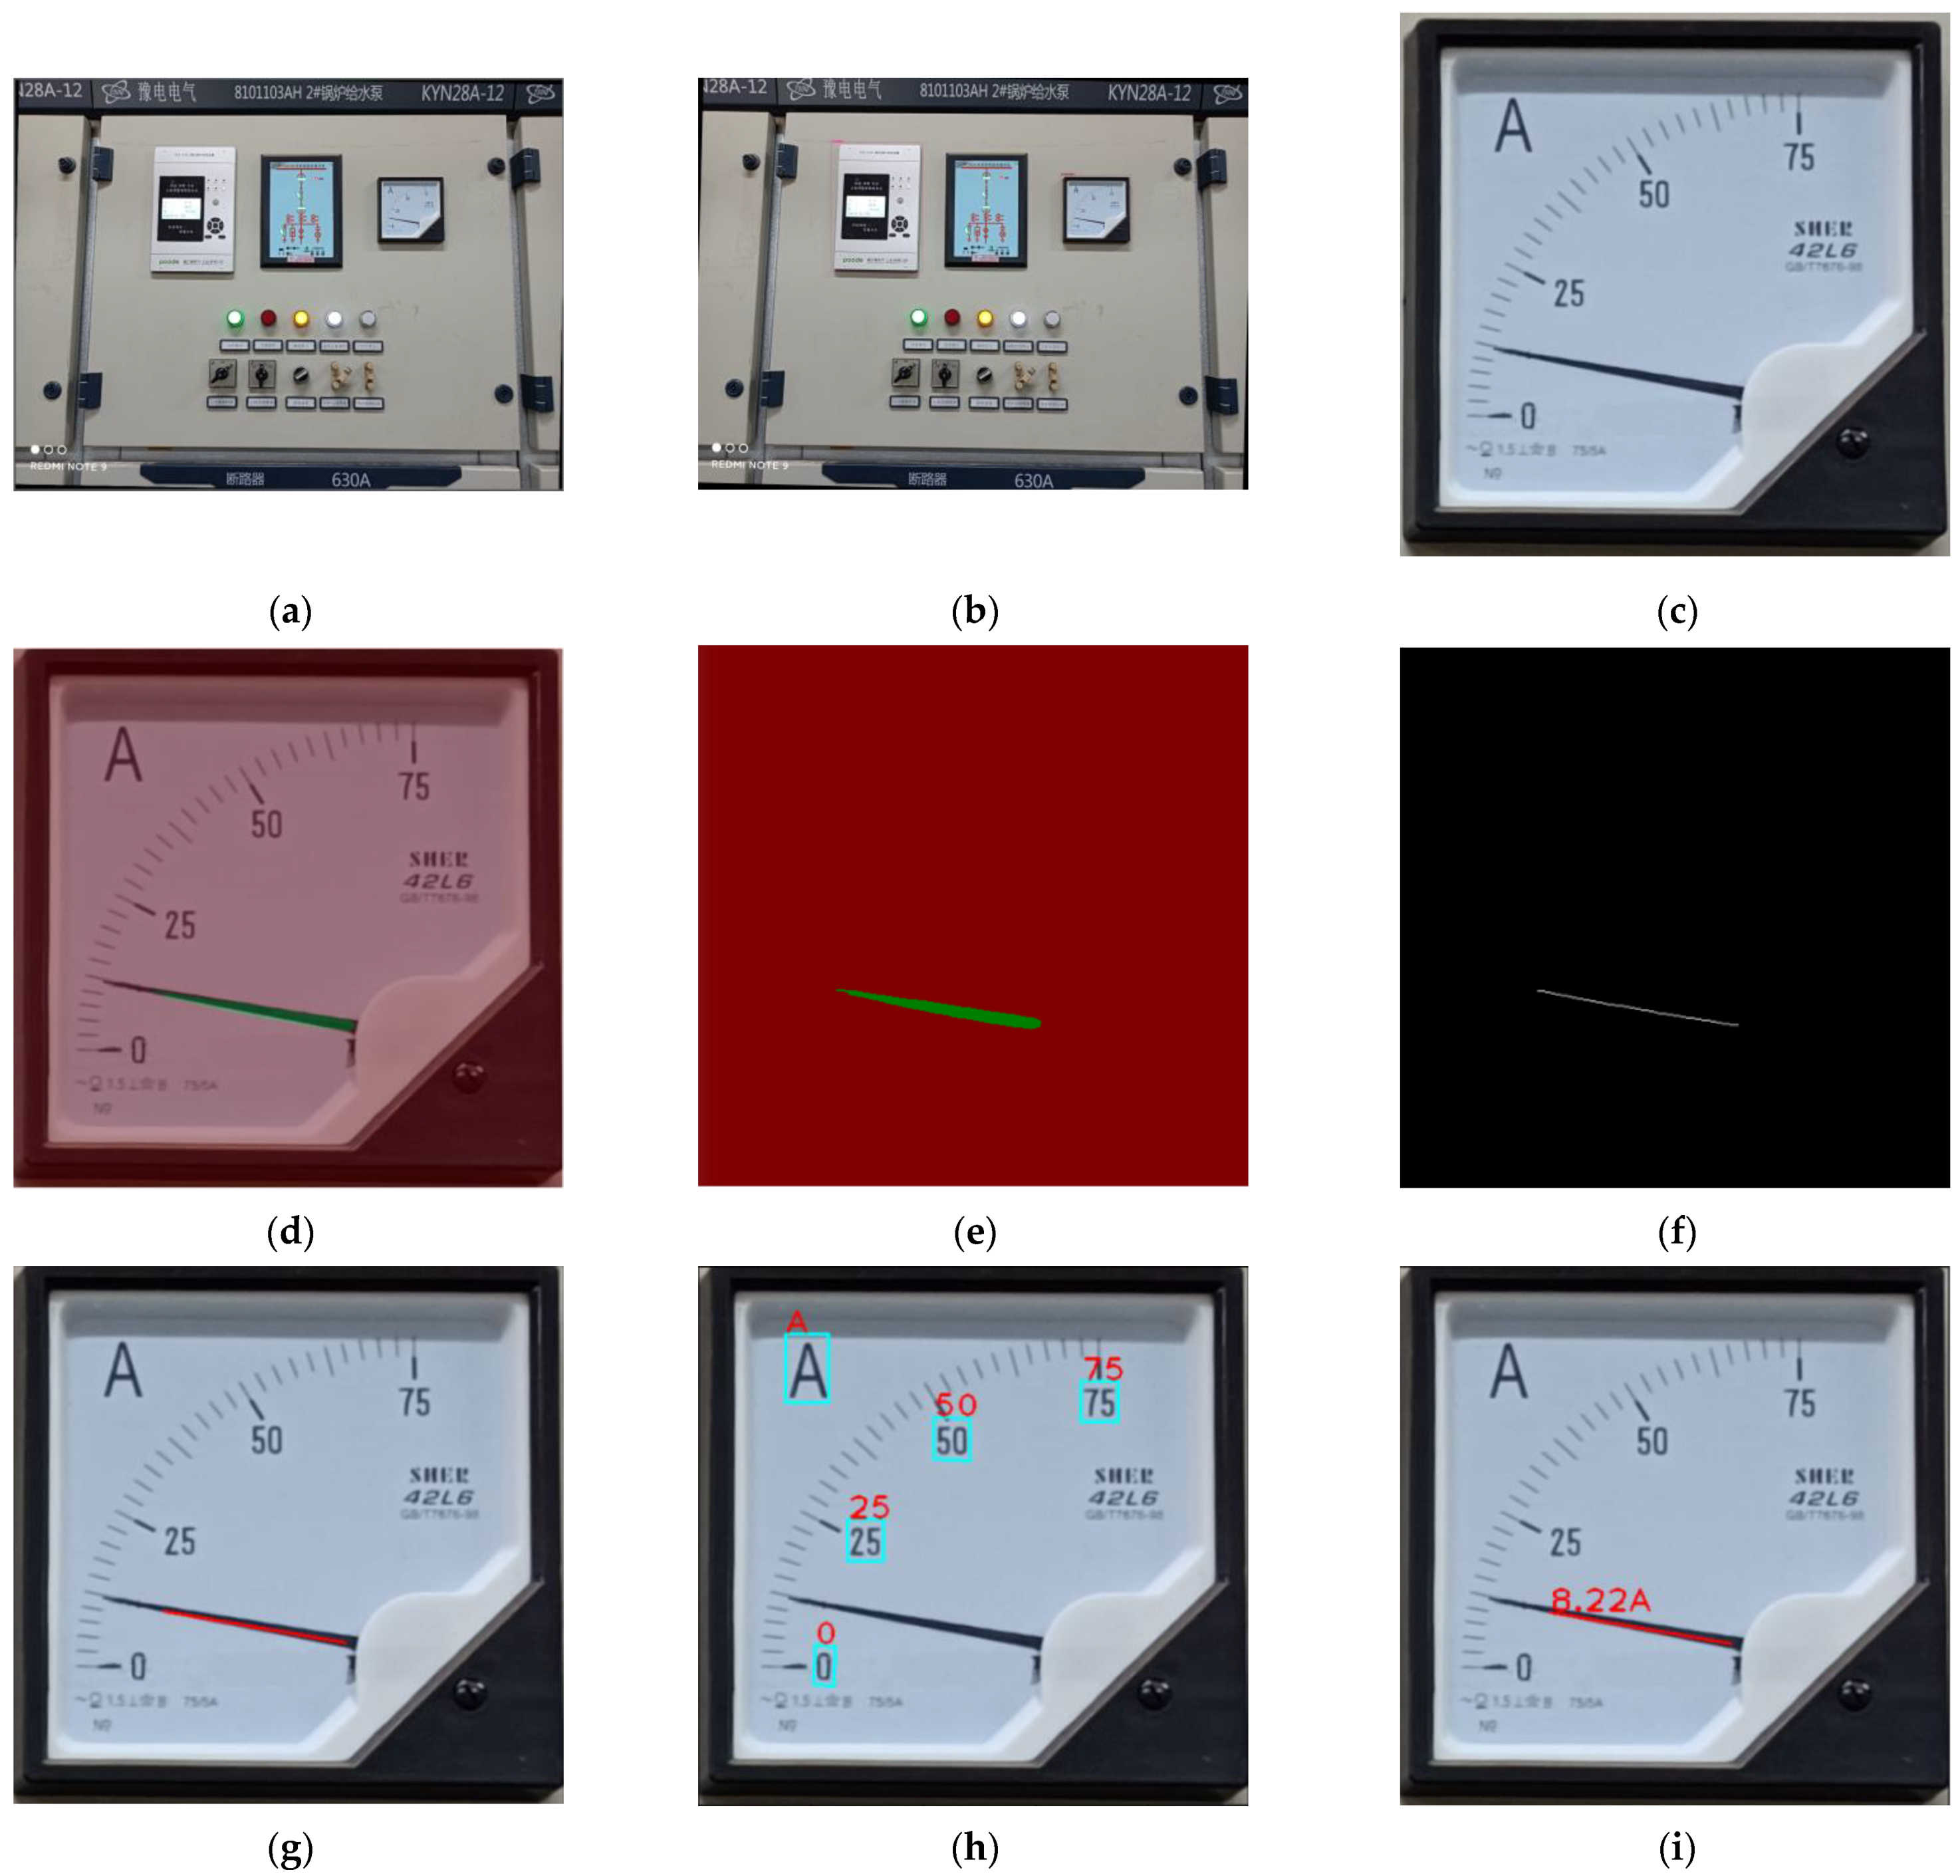
3.6. Reading
3.7. Comparison with Existing Technology
4. Experiment
4.1. Experimental Environment
4.2. Experimental Dataset
4.3. Experimental Results
4.4. Analysis of Experimental Results
4.4.1. Object Detection Evaluation Index
4.4.2. Image Segmentation Evaluation Index
4.4.3. OCR Evaluation Index
4.4.4. Meter Automatic Reading Evaluation Index
5. Conclusions
Author Contributions
Funding
Informed Consent Statement
Data Availability Statement
Conflicts of Interest
References
- Zhang, Z.Y.; Hua, Z.X.; Tang, Y.C.; Zhang, Y.J.; Lu, W.J.; Dai, C.F. Recognition Method of Digital Meter Readings in Substation Based on Connected Domain Analysis Algorithm. Actuators 2021, 10, 170. [Google Scholar] [CrossRef]
- Wang, L.; Wang, P.; Wu, L.H.; Xu, L.J.; Huang, P.; Kang, Z.L. Computer Vision Based Automatic Recognition of Pointer meters: Data Set Optimization and Reading. Entropy 2021, 23, 272. [Google Scholar] [CrossRef]
- Salomon, G.; Laroca, R.; Menotti, D. Deep Learning for Image-based Automatic Dial Meter Reading: Dataset and Baselines. arXiv 2020, arXiv:2005.03106. Available online: https://ui.adsabs.harvard.edu/abs/2020arXiv200503106S (accessed on 25 April 2023).
- Brunelli, R. Template Matching Techniques in Computer Vision: Theory and Practice; John Wiley & Sons: Hoboken, NJ, USA, 2009. [Google Scholar]
- Abiodun, O.I.; Jantan, A.; Omolara, A.E.; Dada, K.V.; Umar, A.M.; Linus, O.U.; Arshad, H.; Kazaure, A.A.; Gana, U.; Kiru, M.U. Comprehensive review of artificial neural network applications to pattern recognition. IEEE Access 2019, 7, 158820–158846. [Google Scholar] [CrossRef]
- Zheng, Y.; Li, G.; Li, Y. Review of the Application of Deep Learning in Image Recognition. Comput. Eng. Appl. 2019, 55, 20–36. [Google Scholar]
- Bhatt, D.; Patel, C.; Talsania, H.; Patel, J.; Vaghela, R.; Pandya, S.; Modi, K.; Ghayvat, H. CNN variants for computer vision: History, architecture, application, challenges and future scope. Electronics 2021, 10, 2470. [Google Scholar] [CrossRef]
- Liu, Y.; Liu, J.; Ke, Y.C. A detection and recognition system of pointer meters in substations based on computer vision. Measurement 2020, 152, 107333. [Google Scholar] [CrossRef]
- Wu, X.; Shi, X.; Jiang, Y.; Gong, J. A High-Precision Automatic Pointer Meter Reading System in Low-Light Environment. Sensors 2021, 21, 4891. [Google Scholar] [CrossRef]
- Li, Z.; Zhou, Y.; Sheng, Q.; Chen, K.; Huang, J. A High-Robust Automatic Reading Algorithm of Pointer Meters Based on Text Detection. Sensors 2020, 20, 5946. [Google Scholar] [CrossRef]
- Liu, Z.; Huang, H.; Wang, N.; Cao, Y.; Zeng, L.; Zhang, J.; Zhang, C. A pointer meter reading recognition method based on improved ORB algorithm for substitution inspection robot. J. Phys. Conf. Ser. 2022, 2189, 012027. [Google Scholar] [CrossRef]
- Cai, W.D.; Ma, B.; Zhang, L.; Han, Y.M. A pointer meter recognition method based on virtual sample generation technology. Measurement 2020, 163, 107962. [Google Scholar] [CrossRef]
- Zuo, L.; He, P.; Zhang, C.; Zhang, Z. A Robust Approach to Reading Recognition of Pointer Meters Based on Improved Mask-RCNN. Neurocomputing 2020, 388, 90–101. [Google Scholar] [CrossRef]
- Laroca, R.; Barroso, V.; Diniz, M.A.; Gonçalves, G.R.; Schwartz, W.R.; Menotti, D. Convolutional neural networks for automatic meter reading. J. Electron. Imaging 2019, 28, 013023. [Google Scholar] [CrossRef]
- Salomon, G.; Laroca, R.; Menotti, D. Image-based Automatic Dial Meter Reading in Unconstrained Scenarios. arXiv 2022, arXiv:2201.02850. Available online: https://ui.adsabs.harvard.edu/abs/2022arXiv220102850S (accessed on 2 April 2023). [CrossRef]
- Bishwokarma, R.; Paudyal, B.; Chapagain, P.; Bajgain, S.; Shakya, H.D. Deep Neural Network based Automatic System for Electricity Meter Reading in Nepal. In Proceedings of the International Conference on “Role of Energy for Sustainable Social Development in New Normal Era”, Kathmandu, Nepal, 28–29 December 2021. [Google Scholar]
- Yan, X.; Wei, L.; Li, J.; Jia, G.; Yang, J. Research on Automatic Recognition of Pointer Meter Reading Based on Deep Learning Algorithm. J. Phys. Conf. Ser. 2021, 1865, 042017. [Google Scholar] [CrossRef]
- Meng, X.; Cai, F.; Wang, J.; Lv, C.; Liu, H.; Liu, H.; Shuai, M. Research on Reading Recognition Method of Pointer Meters Based on Deep Learning Combined with Rotating Virtual Pointer. In Proceedings of the 5th International Conference on Information Science, Computer Technology and Transportation (ISCTT), Shenyang, China, 13–15 November 2020; pp. 115–118. [Google Scholar] [CrossRef]
- Zhang, X.; Dang, X.; Lv, Q.; Liu, S. A pointer meter recognition algorithm based on deep learning. In Proceedings of the 2020 3rd International Conference on Advanced Electronic Materials, Computers and Software Engineering (AEMCSE), Shenzhen, China, 24–26 April 2020; pp. 283–287. [Google Scholar]
- Laroca, R.; Araujo, A.B.; Zanlorensi, L.A.; de Almeida, E.C.; Menotti, D. Towards Image-based Automatic Meter Reading in Unconstrained Scenarios: A Robust and Efficient Approach. arXiv 2020, arXiv:2009.10181. Available online: https://ui.adsabs.harvard.edu/abs/2020arXiv200910181L (accessed on 5 April 2023). [CrossRef]
- Dong, Z.; Gao, Y.; Yan, Y.; Chen, F. Vector Detection Network: An Application Study on Robots Reading Analog Meters in the Wild. arXiv 2021, arXiv:2105.14522. Available online: https://ui.adsabs.harvard.edu/abs/2021arXiv210514522D (accessed on 15 April 2023). [CrossRef]
- Bayhan, E.; Ozkan, Z.; Namdar, M.; Basgumus, A. Deep learning based object detection and recognition of unmanned aerial vehicles. In Proceedings of the IEEE 2021 3rd International Congress on Human-Computer Interaction, Optimization and Robotic Applications (HORA), Ankara, Turkey, 11–13 June 2021; pp. 1–5. [Google Scholar]
- Ozkan, Z.; Bayhan, E.; Namdar, M.; Basgumus, A. Object detection and recognition of unmanned aerial vehicles using Raspberry Pi platform. In Proceedings of the 2021 IEEE 5th International Symposium on Multidisciplinary Studies and Innovative Technologies (ISMSIT), Ankara, Turkey, 21–23 October 2021; pp. 467–472. [Google Scholar]
- Girshick, R. Fast r-cnn. In Proceedings of the IEEE International Conference on Computer Vision, Santiago, Chile, 7–13 December 2015; pp. 1440–1448. [Google Scholar]
- Liu, W.; Anguelov, D.; Erhan, D.; Szegedy, C.; Reed, S.; Fu, C.Y.; Berg, A.C. Ssd: Single shot multibox detector. In Proceedings of the Computer Vision—ECCV 2016: 14th European Conference, Amsterdam, The Netherlands, 11–14 October 2016; Part I 14. Springer: Berlin/Heidelberg, Germany; pp. 21–37. [Google Scholar]
- Jiang, P.; Ergu, D.; Liu, F.; Cai, Y.; Ma, B. A Review of Yolo algorithm developments. Procedia Comput. Sci. 2022, 199, 1066–1073. [Google Scholar] [CrossRef]
- Wang, C.-Y.; Bochkovskiy, A.; Liao, H.-Y.M. Yolov7: Trainable bag-of-freebies sets new state-of-the-art for real-time object detectors. arXiv 2022, arXiv:2207.02696. [Google Scholar]
- Bian, H.; Liu, Y.; Shi, L.; Lin, Z.; Huang, M.; Zhang, J.; Weng, G.; Zhang, C.; Gao, M. Detection Method of Helmet Wearing Based on UAV Images and Yolov7. In Proceedings of the 2023 IEEE 6th Information Technology, Networking, Electronic and Automation Control Conference (ITNEC), Chongqing, China, 24–26 February 2023; Volume 6, pp. 1633–1640. [Google Scholar]
- Ding, L.; Wang, J.; Wu, Y. Electric power line patrol operation based on vision and laser SLAM fusion perception. In Proceedings of the 2021 IEEE 4th International Conference on Automation, Electronics and Electrical Engineering (AUTEEE), Shenyang, China, 19–21 November 2021; pp. 125–129. [Google Scholar]
- Wang, P.; Zhang, C.; Qi, F.; Liu, S.; Zhang, X.; Lyu, P.; Han, J.; Liu, J.; Ding, E.; Shi, G. Pgnet: Real-time arbitrarily-shaped text spotting with point gathering network. In Proceedings of the AAAI Conference on Artificial Intelligence, Virtual, 2–9 February 2021; Volume 35, pp. 2782–2790. [Google Scholar]
- Ma, Y.; Yu, D.; Wu, T.; Wang, H. PaddlePaddle: An open-source deep learning platform from industrial practice. Front. Data Domputing 2019, 1, 105–115. [Google Scholar]
- Torralba, A.; Russell, B.C.; Yuen, J. Labelme: Online image annotation and applications. Proc. IEEE 2010, 98, 1467–1484. [Google Scholar] [CrossRef]
- Liu, Y.; Chu, L.; Chen, G.; Wu, Z.; Chen, Z.; Lai, B.; Hao, Y. Paddleseg: A high-efficient development toolkit for image segmentation. arXiv 2021, arXiv:2101.06175. [Google Scholar]
- Du, Y.; Li, C.; Guo, R.; Cui, C.; Liu, W.; Zhou, J.; Lu, B.; Yang, Y.; Liu, Q.; Ma, Y.; et al. Pp-ocrv2: Bag of tricks for ultra lightweight ocr system. arXiv 2021, arXiv:2109.03144. [Google Scholar]
- Hu, Z.; Deng, Y.; Lan, J.; Wang, T.; Han, Z.; Huang, Y.; Zhang, H.; Wang, J.; Cheng, M.; Chen, G.; et al. A multi-task deep learning framework for perineural invasion recognition in gastric cancer whole slide images. Biomed. Signal Process. Control. 2023, 79, 104261. [Google Scholar] [CrossRef]
- Shuo, H.; Ximing, Y.; Donghang, L.; Shaoli, L.; Yu, P. Digital recognition of electric meter with deep learning. In Proceedings of the 2019 14th IEEE International Conference on Electronic Measurement & Instruments (ICEMI), Changsha, China, 1–3 November 2019; pp. 600–607. [Google Scholar]
- Liang, Q.; Wang, W.; Liu, X.; Na, Z.; Jia, M.; Zhang, B. (Eds.) Communications, Signal Processing, and Systems: Proceedings of the 8th International Conference on Communications, Signal Processing, and Systems; Springer Nature: Berlin/Heidelberg, Germany, 2020. [Google Scholar]
- Yan, X.; Jia, L.; Cao, H.; Yu, Y.; Wang, T.; Zhang, F.; Guan, Q. Multitargets joint training lightweight model for object detection of substation. IEEE Trans. Neural Netw. Learn. Syst. 2022, 1–12. [Google Scholar] [CrossRef]
- Liang, C.M.; Li, Y.W.; Liu, Y.H.; Wen, P.F.; Yang, H. Segmentation and weight prediction of grape ear based on SFNet-ResNet18. Syst. Sci. Control Eng. 2022, 10, 722–732. [Google Scholar] [CrossRef]
- Cheng, Z.; Wang, Z.; Huang, H.; Liu, Y. Dense-acssd for end-to-end traffic scenes recognition. In Proceedings of the 2019 IEEE Intelligent Vehicles Symposium (IV), Paris, France, 9–12 June 2019; pp. 460–465. [Google Scholar]
- Bashyam, V.; Taira, R.K. Identifying Anatomical Phrases in Clinical Reports by Shallow Semantic Parsing Methods. In Proceedings of the 2007 IEEE Symposium on Computational Intelligence and Data Mining, Honolulu, HI, USA, 1–5 April 2007; pp. 210–214. [Google Scholar]
- Peng, H.; Yu, J.; Nie, Y. Efficient Neural Network for Text Recognition in Natural Scenes Based on End-to-End Multi-Scale Attention Mechanism. Electronics 2023, 12, 1395. [Google Scholar] [CrossRef]


| Previous Research | Type | Positioning Instrumentation | Identification Pointers and Readings |
|---|---|---|---|
| Wang et al. [2] | Round pointer instrument | Faster-RCNN | Hough transform |
| Salomon et al. [3] | water meter | Faster-RCNN, Yolov3 | Classification |
| Liu et al. [8] | Round pointer instrument | Faster R-CNN | Hough transform |
| Liu et al. [11] | Round pointer instrument | ORB algorithm | Hough transform |
| Zuo et al. [13] | Round pointer instrument | Mask RCNN | angle method |
| Meng et al. [18] | Round pointer instrument | / | key point detection |
| Name | Type |
|---|---|
| CPU | i7-12700KF |
| Graphics card | R TX-3090 |
| Memory | 64G |
| Hard disk | 6T |
| Model | Map50 | FPS | Params | Gflops | Map5095 |
|---|---|---|---|---|---|
| Yolov5-s | 99.5 | 204.08 | 7.03 m | 15.8 | 99.1 |
| Yolov5-m | 99.5 | 85.47 | 20.87 m | 47.9 | 99.2 |
| Yolov5-l | 99.3 | 51.02 | 46.14 m | 107.7 | 99.2 |
| Yolox-s | 96.7 | 25.63 | 8.94 m | 26.77 | 94.51 |
| Yolov7 | 99.8 | 92.59 | 36.51 m | 103.2 | 99.5 |
| Model | MioU | Acc | Kappa | Dice | Class IoU | Class Precision | Class Recall |
|---|---|---|---|---|---|---|---|
| ann | 0.8084 | 0.9967 | 0.7639 | 0.8819 | [0.9967, 0.6202] | [0.9984, 0.7609] | [0.9983, 0.7703] |
| pspnet | 0.807 | 0.9966 | 0.7618 | 0.8809 | [0.9966, 0.6175] | [0.9985, 0.7431] | [0.9981, 0.7851] |
| deplabv3 | 0.8029 | 0.9966 | 0.7555 | 0.8777 | [0.9966, 0.6093] | [0.9984, 0.7475] | [0.9982, 0.7672] |
| deplabv3+ | 0.8773 | 0.9981 | 0.8604 | 0.9302 | [0.998, 0.7565] | [0.9991, 0.8577] | [0.999, 0.865] |
| danet | 0.8059 | 0.9965 | 0.7601 | 0.88 | [0.9965, 0.6153] | [0.9985, 0.7337] | [0.998, 0.7921] |
| AR | MR | AT | MT | AM | MM | WT | WM | AE | RE | ACC |
|---|---|---|---|---|---|---|---|---|---|---|
| 8.22 | 11.90 | A | A | 75 | 75 | Y | Y | 3.68 | 0.05 | 95.09 |
| 9.18 | 8.76 | kV | kV | 12 | 12 | Y | Y | 0.42 | 0.04 | 96.50 |
| 10.55 | 10.40 | kV | kV | 12 | 12 | Y | Y | 0.15 | 0.01 | 98.75 |
| 71.32 | 73.10 | A | A | 150 | 150 | Y | Y | 1.78 | 0.01 | 98.81 |
| 21.75 | 23.32 | A | A | 50 | 50 | Y | Y | 1.57 | 0.03 | 96.86 |
| 120.78 | 115.25 | V | V | 300 | 300 | Y | Y | 5.53 | 0.02 | 98.16 |
| 10.68 | 10.05 | A | A | 15 | 15 | Y | Y | 0.63 | 0.04 | 95.80 |
| 161.35 | 155.88 | V | V | 250 | 250 | Y | Y | 5.47 | 0.02 | 97.81 |
| 3.47 | 3.05 | A | A | 20 | 20 | Y | Y | 0.42 | 0.02 | 97.90 |
| 123.56 | 128.92 | V | V | 150 | 150 | Y | Y | 5.36 | 0.04 | 96.43 |
| Name | Explanation |
|---|---|
| AR | automatic reading |
| MR | manual reading |
| AT | automatic identification of meter model |
| MT | manual recognition of meter model |
| AM | automatic recognition of the maximum range |
| MM | manual recognition of the maximum range |
| WT | whether the type is the same |
| WM | whether the maximum value is the same |
| AE | absolute error |
| RE | relative error |
| ACC | accuracy |
Disclaimer/Publisher’s Note: The statements, opinions and data contained in all publications are solely those of the individual author(s) and contributor(s) and not of MDPI and/or the editor(s). MDPI and/or the editor(s) disclaim responsibility for any injury to people or property resulting from any ideas, methods, instructions or products referred to in the content. |
© 2023 by the authors. Licensee MDPI, Basel, Switzerland. This article is an open access article distributed under the terms and conditions of the Creative Commons Attribution (CC BY) license (https://creativecommons.org/licenses/by/4.0/).
Share and Cite
Zhang, C.; Shi, L.; Zhang, D.; Ke, T.; Li, J. Pointer Meter Recognition Method Based on Yolov7 and Hough Transform. Appl. Sci. 2023, 13, 8722. https://doi.org/10.3390/app13158722
Zhang C, Shi L, Zhang D, Ke T, Li J. Pointer Meter Recognition Method Based on Yolov7 and Hough Transform. Applied Sciences. 2023; 13(15):8722. https://doi.org/10.3390/app13158722
Chicago/Turabian StyleZhang, Chuanlei, Lei Shi, Dandan Zhang, Ting Ke, and Jianrong Li. 2023. "Pointer Meter Recognition Method Based on Yolov7 and Hough Transform" Applied Sciences 13, no. 15: 8722. https://doi.org/10.3390/app13158722