
Hydro–Mechanical Behaviour of a Rainfall-Induced Landslide by Instrumental Monitoring: Landslide–Rainfall Threshold of the Western Black Sea Bartin Region of Türkiye
Abstract
:1. Introduction
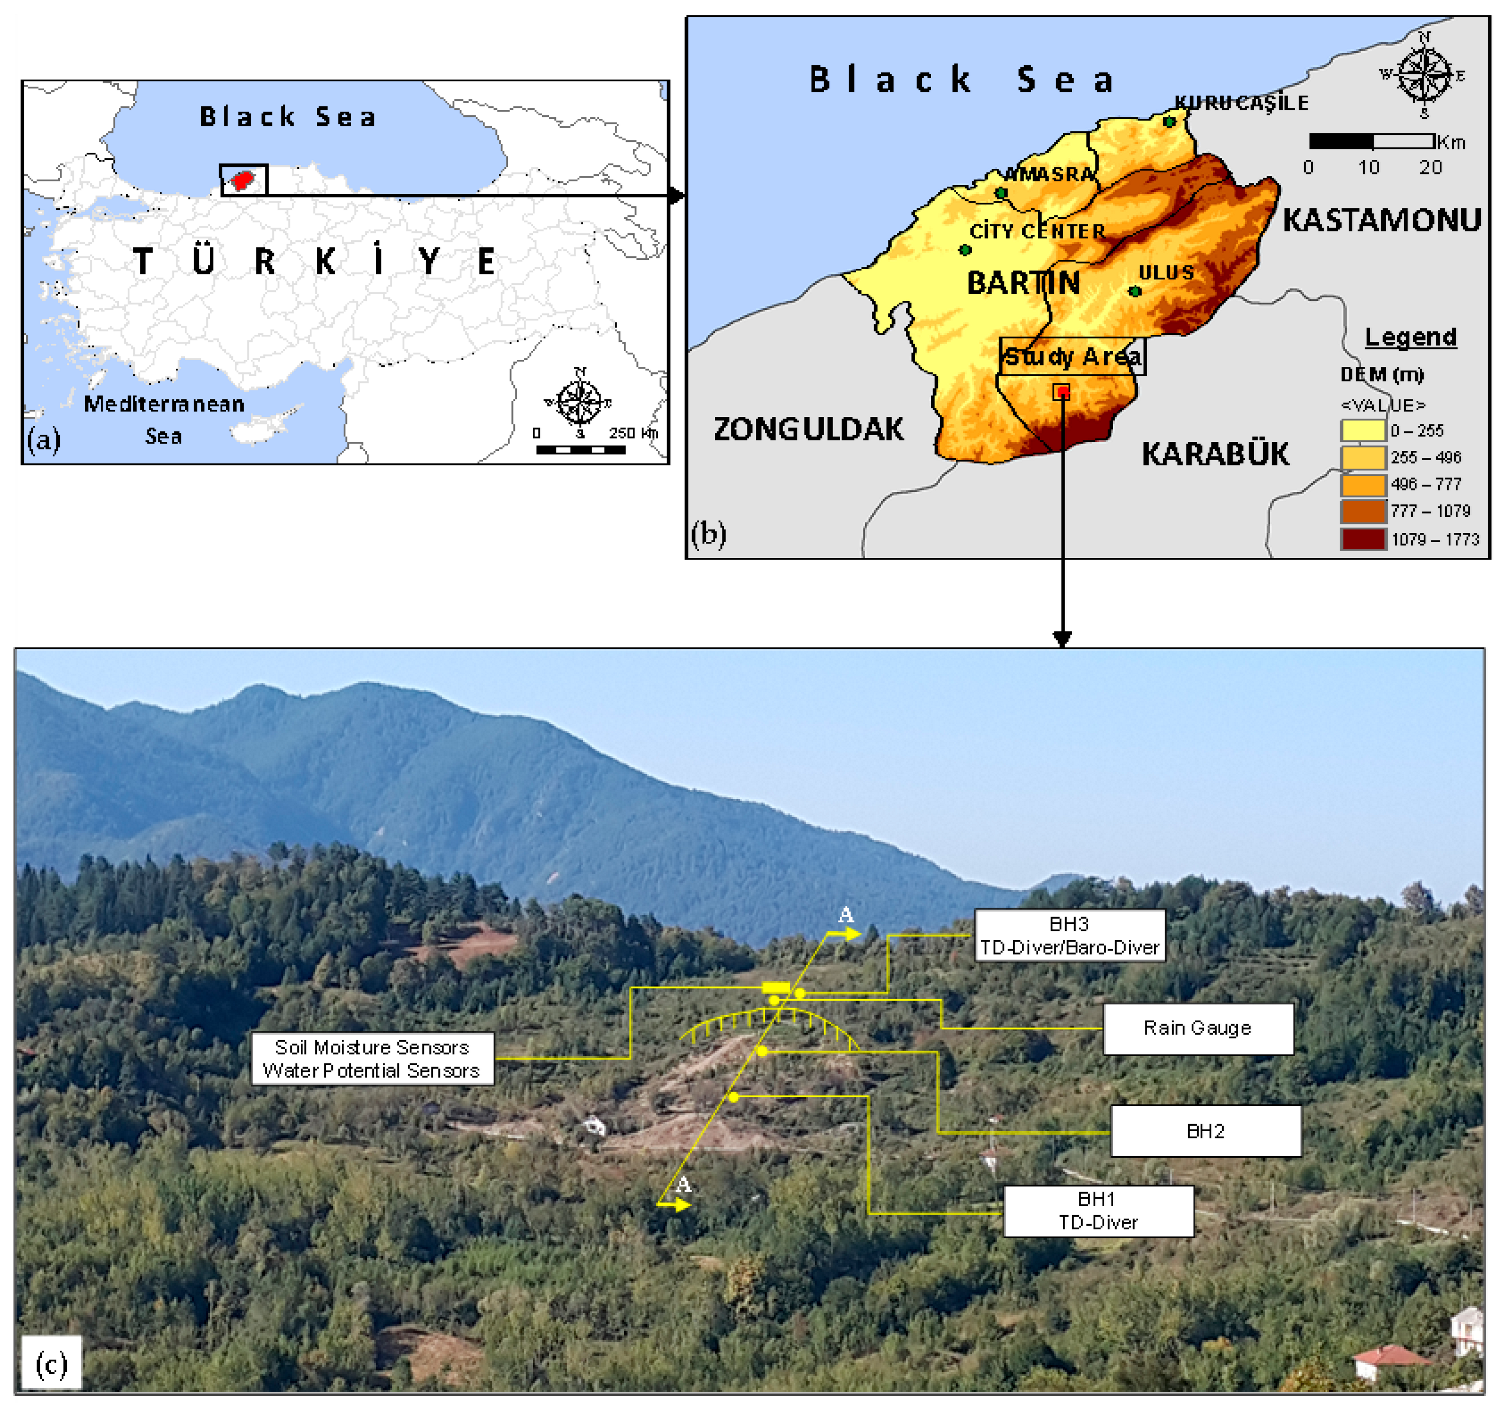
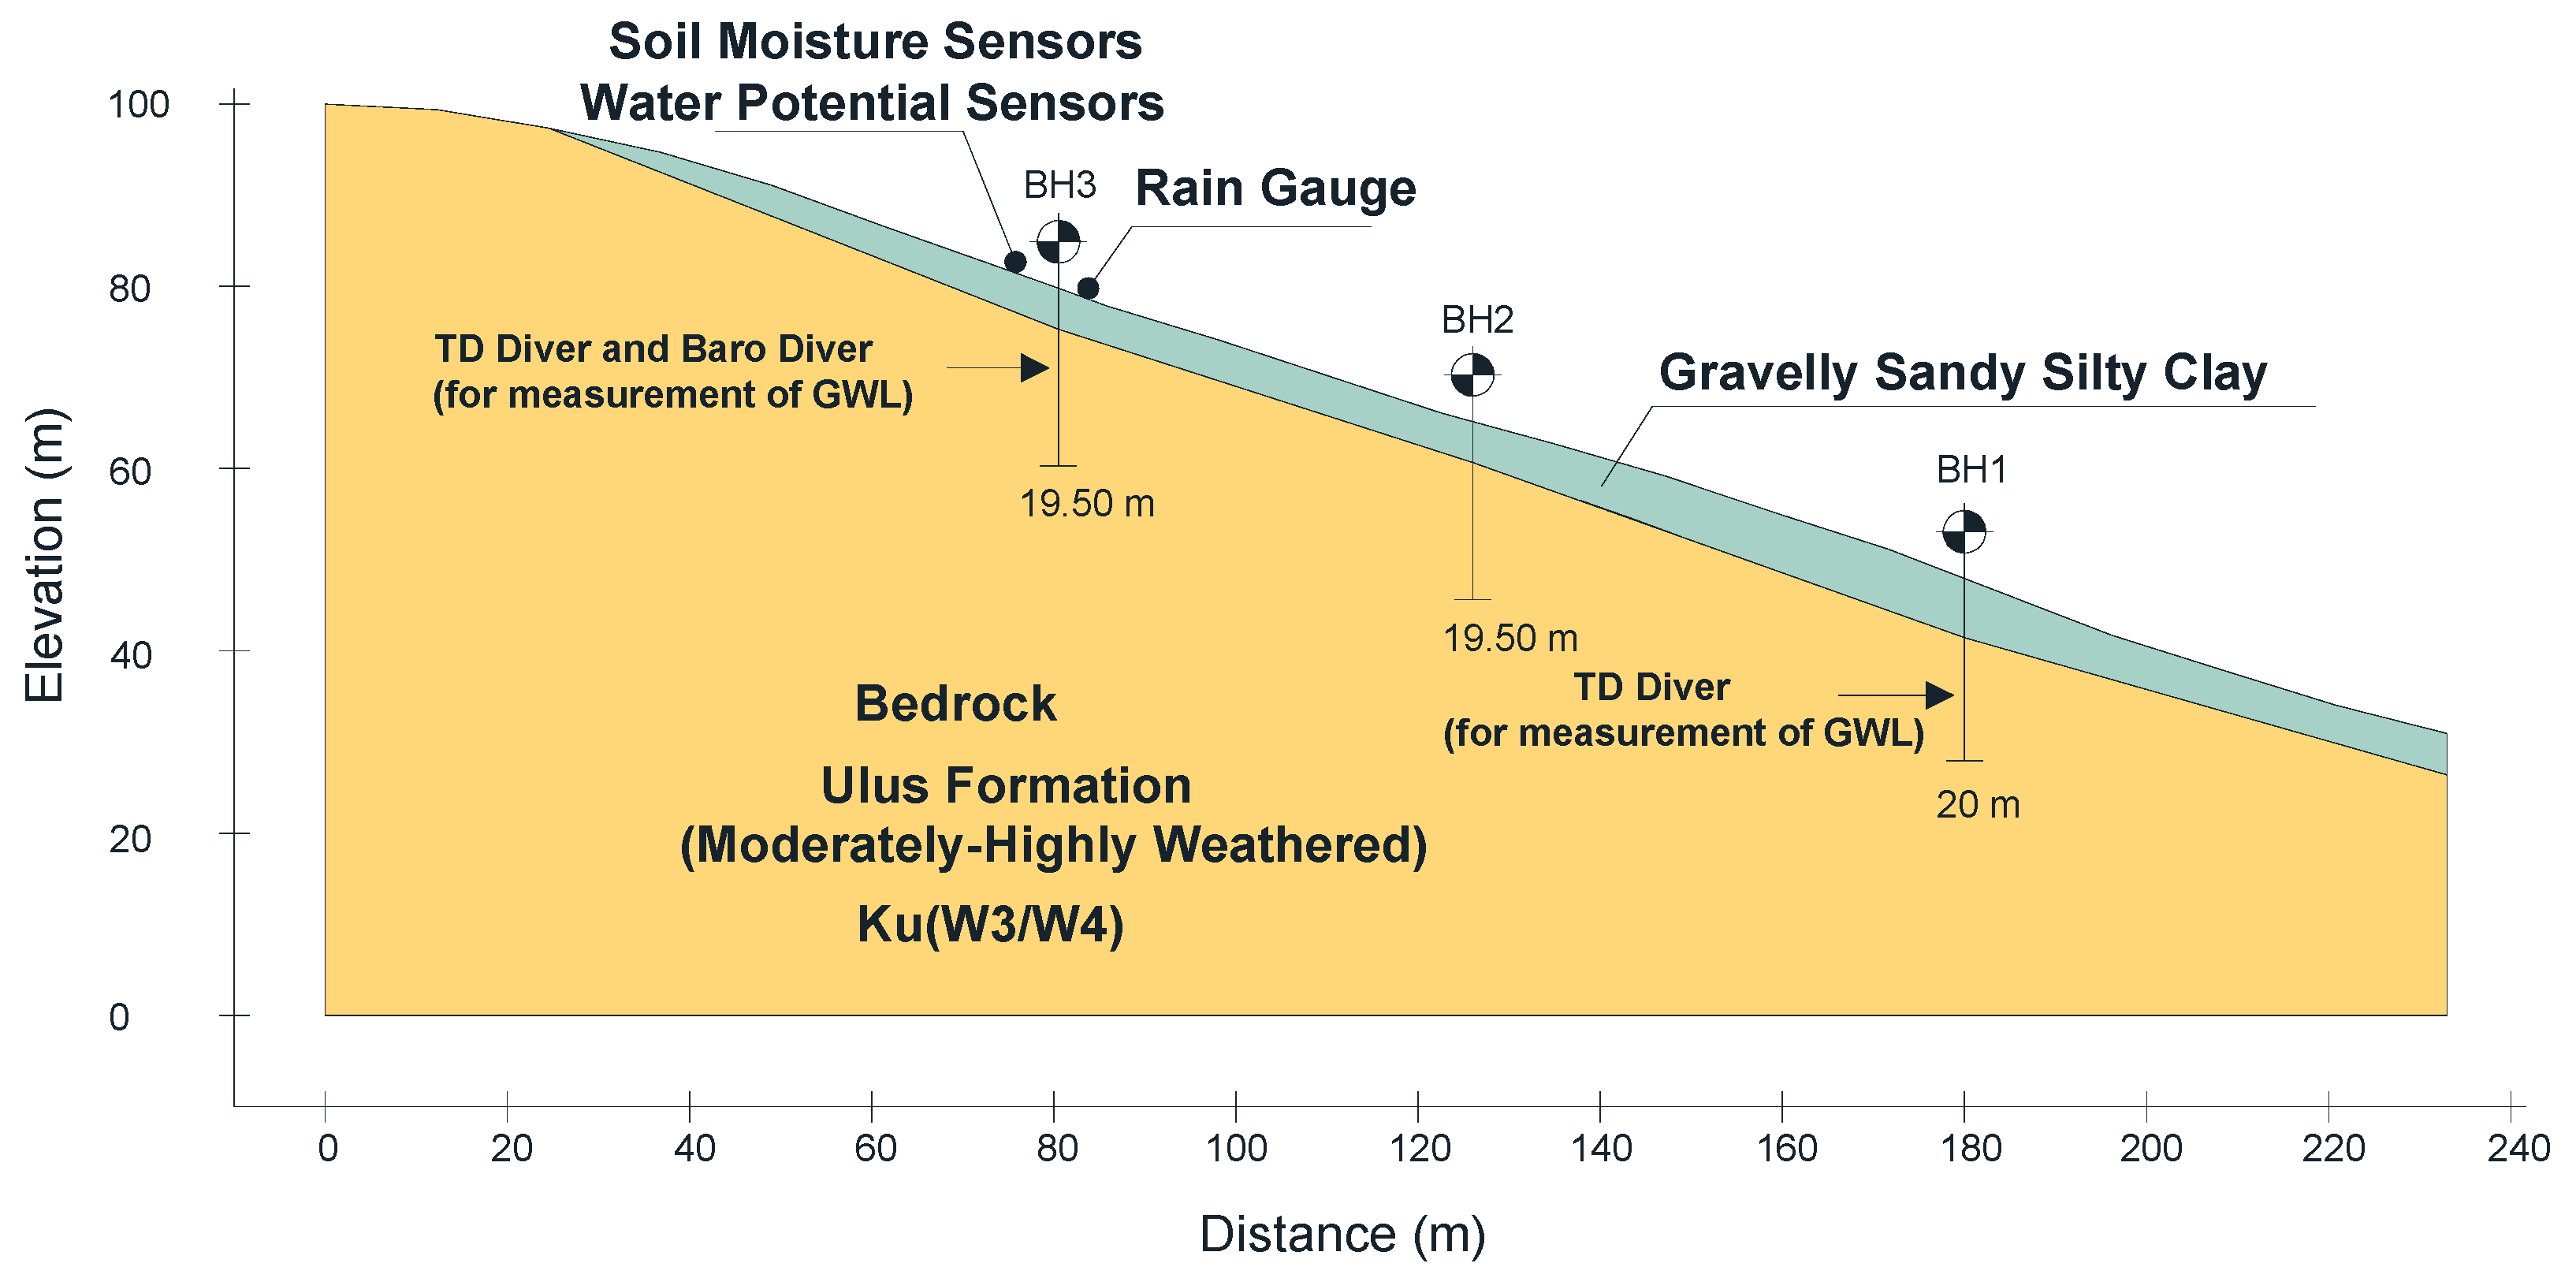
2. Site Description
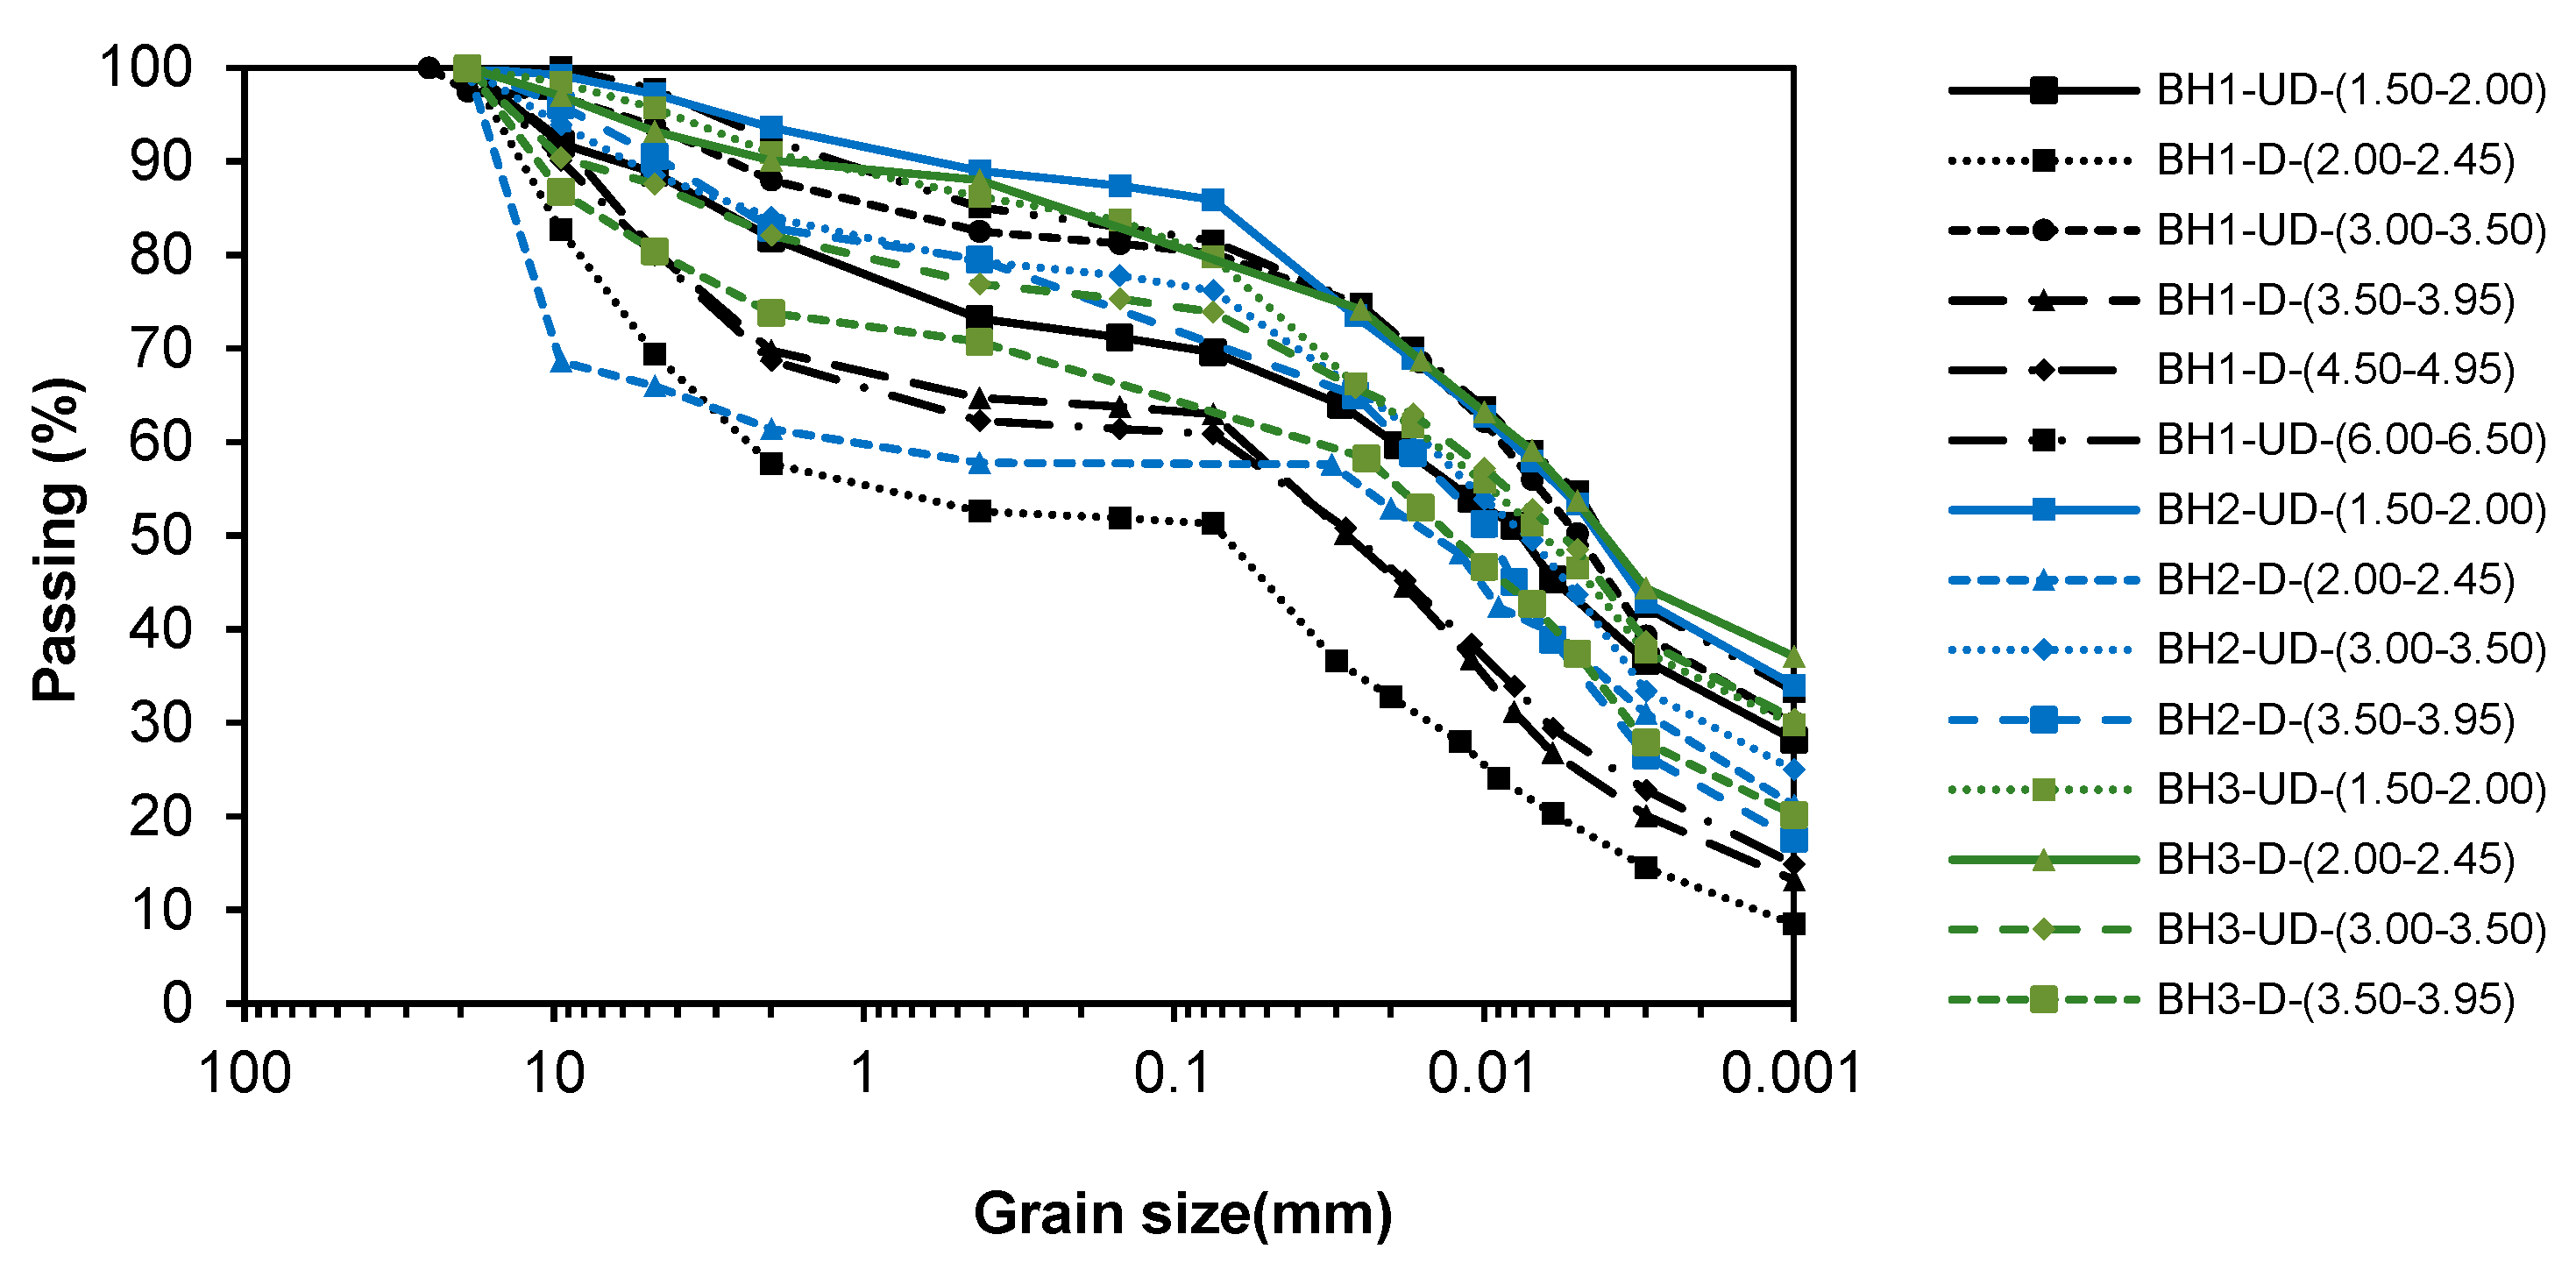
3. Geotechnical Investigations
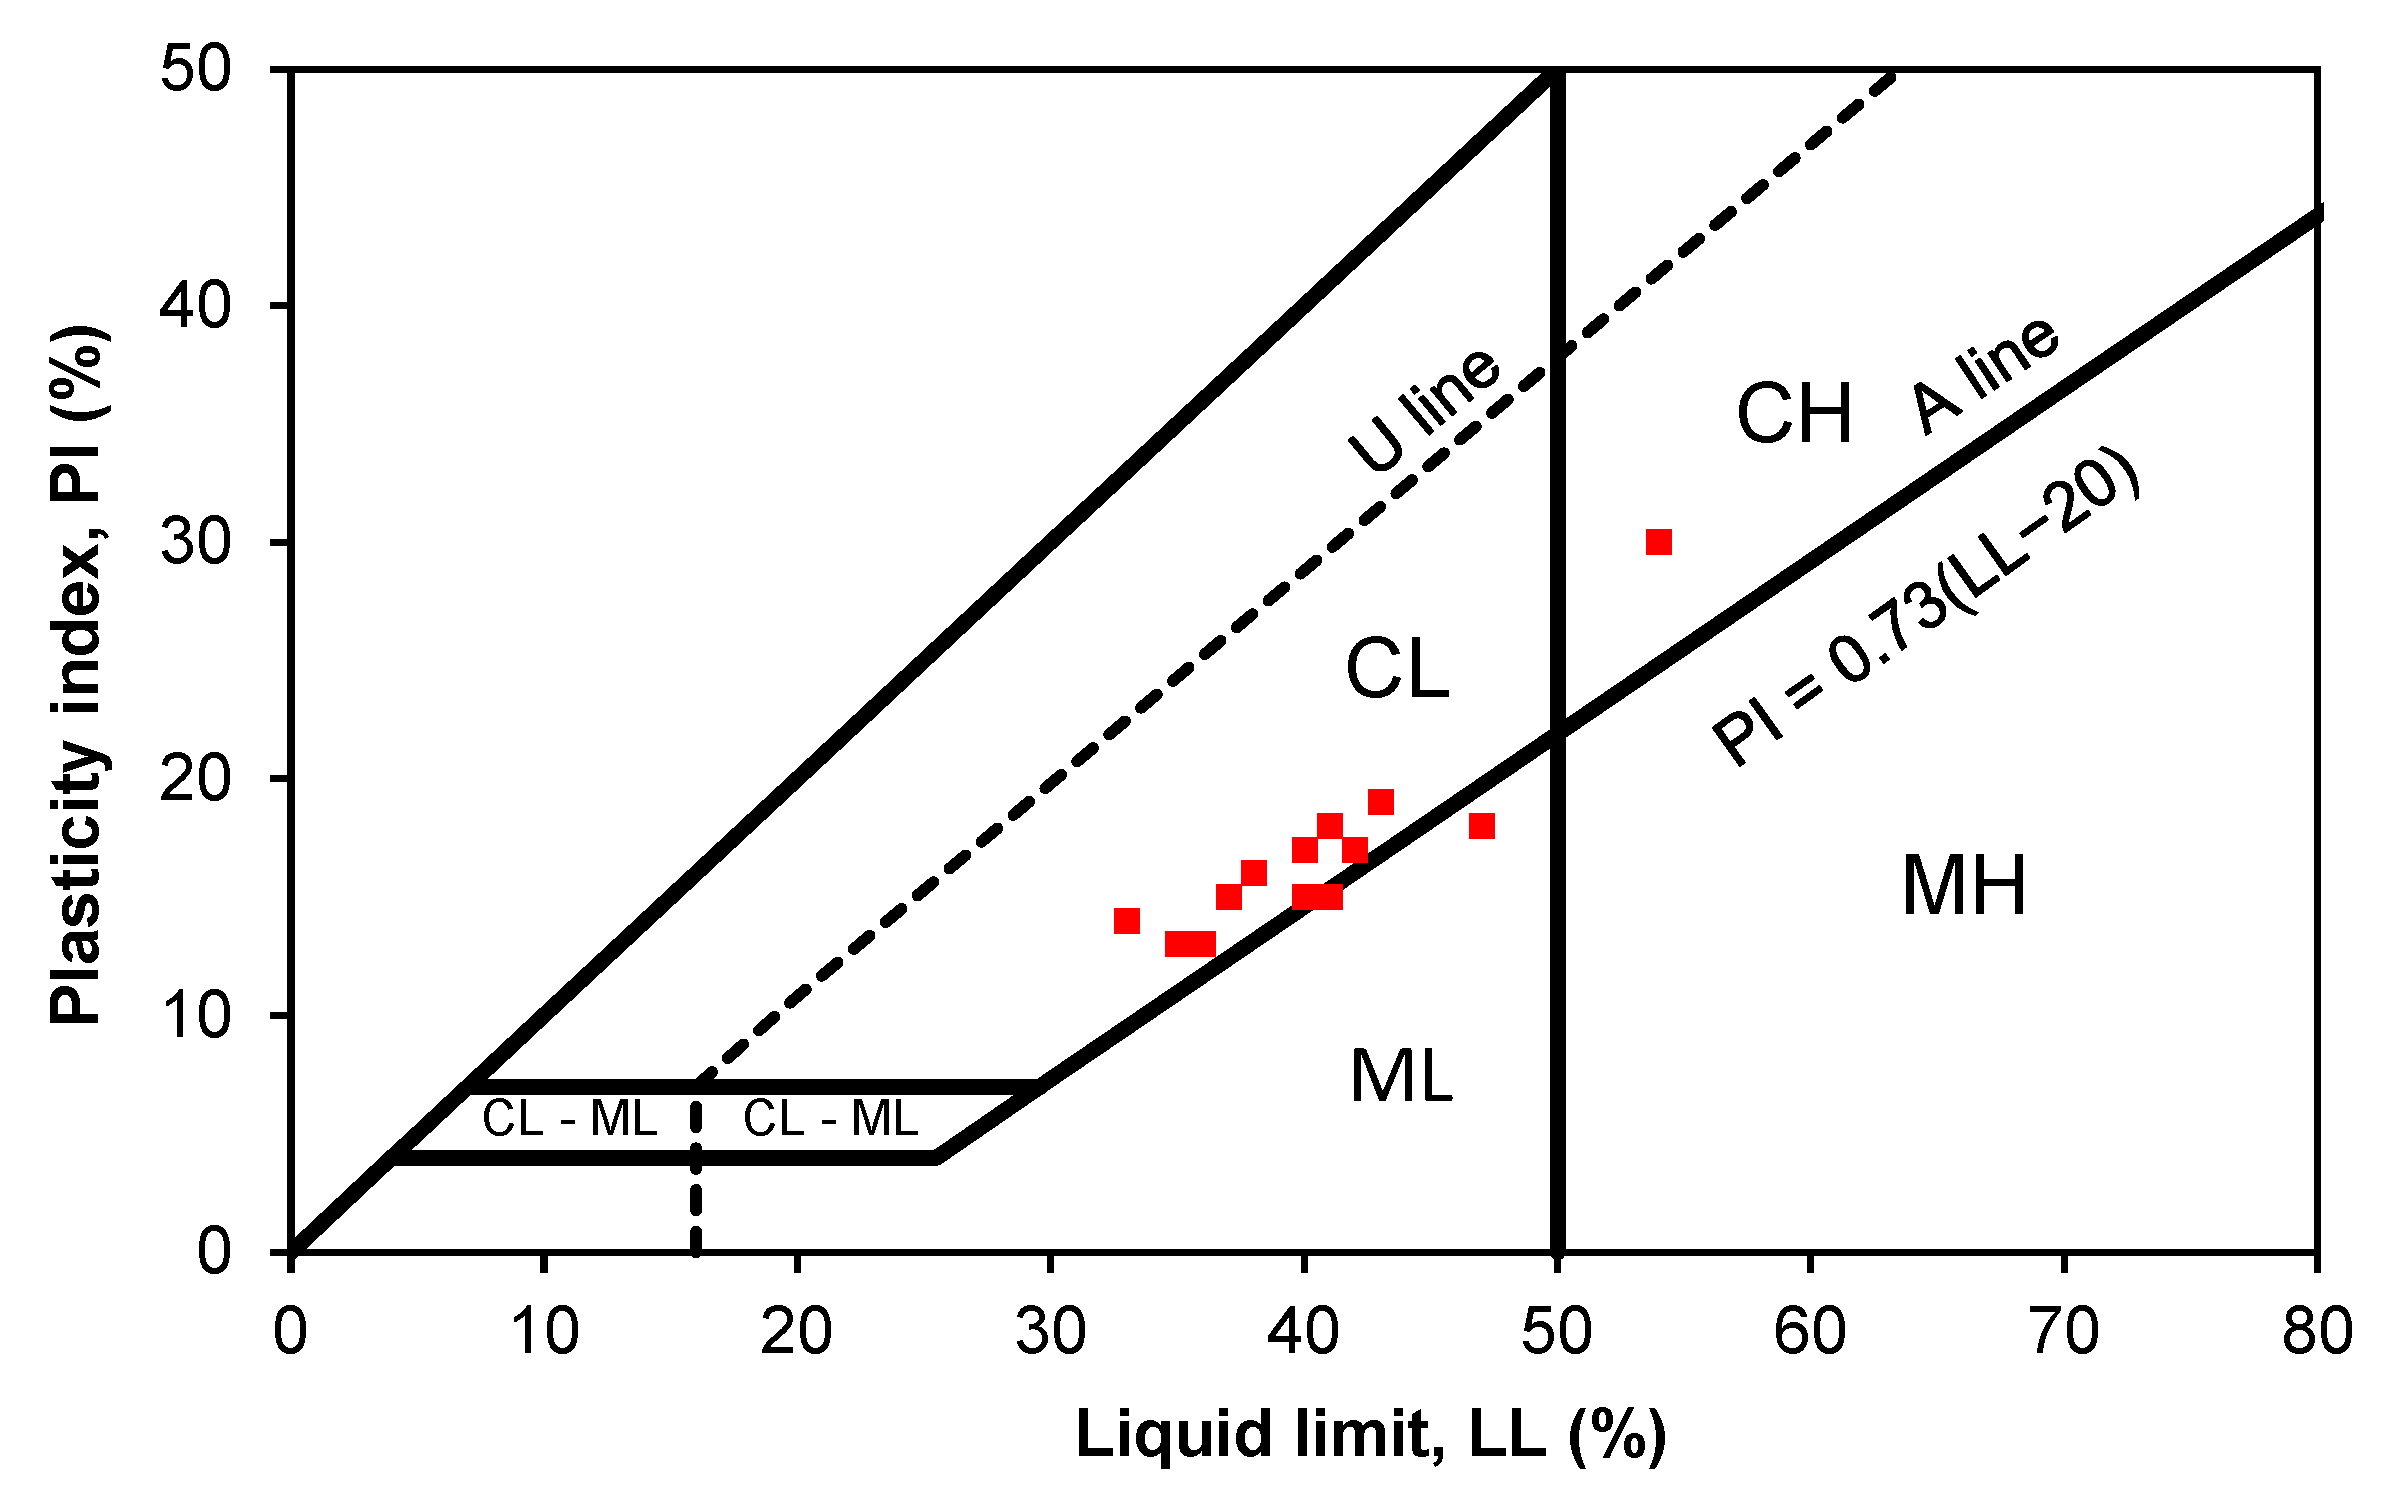
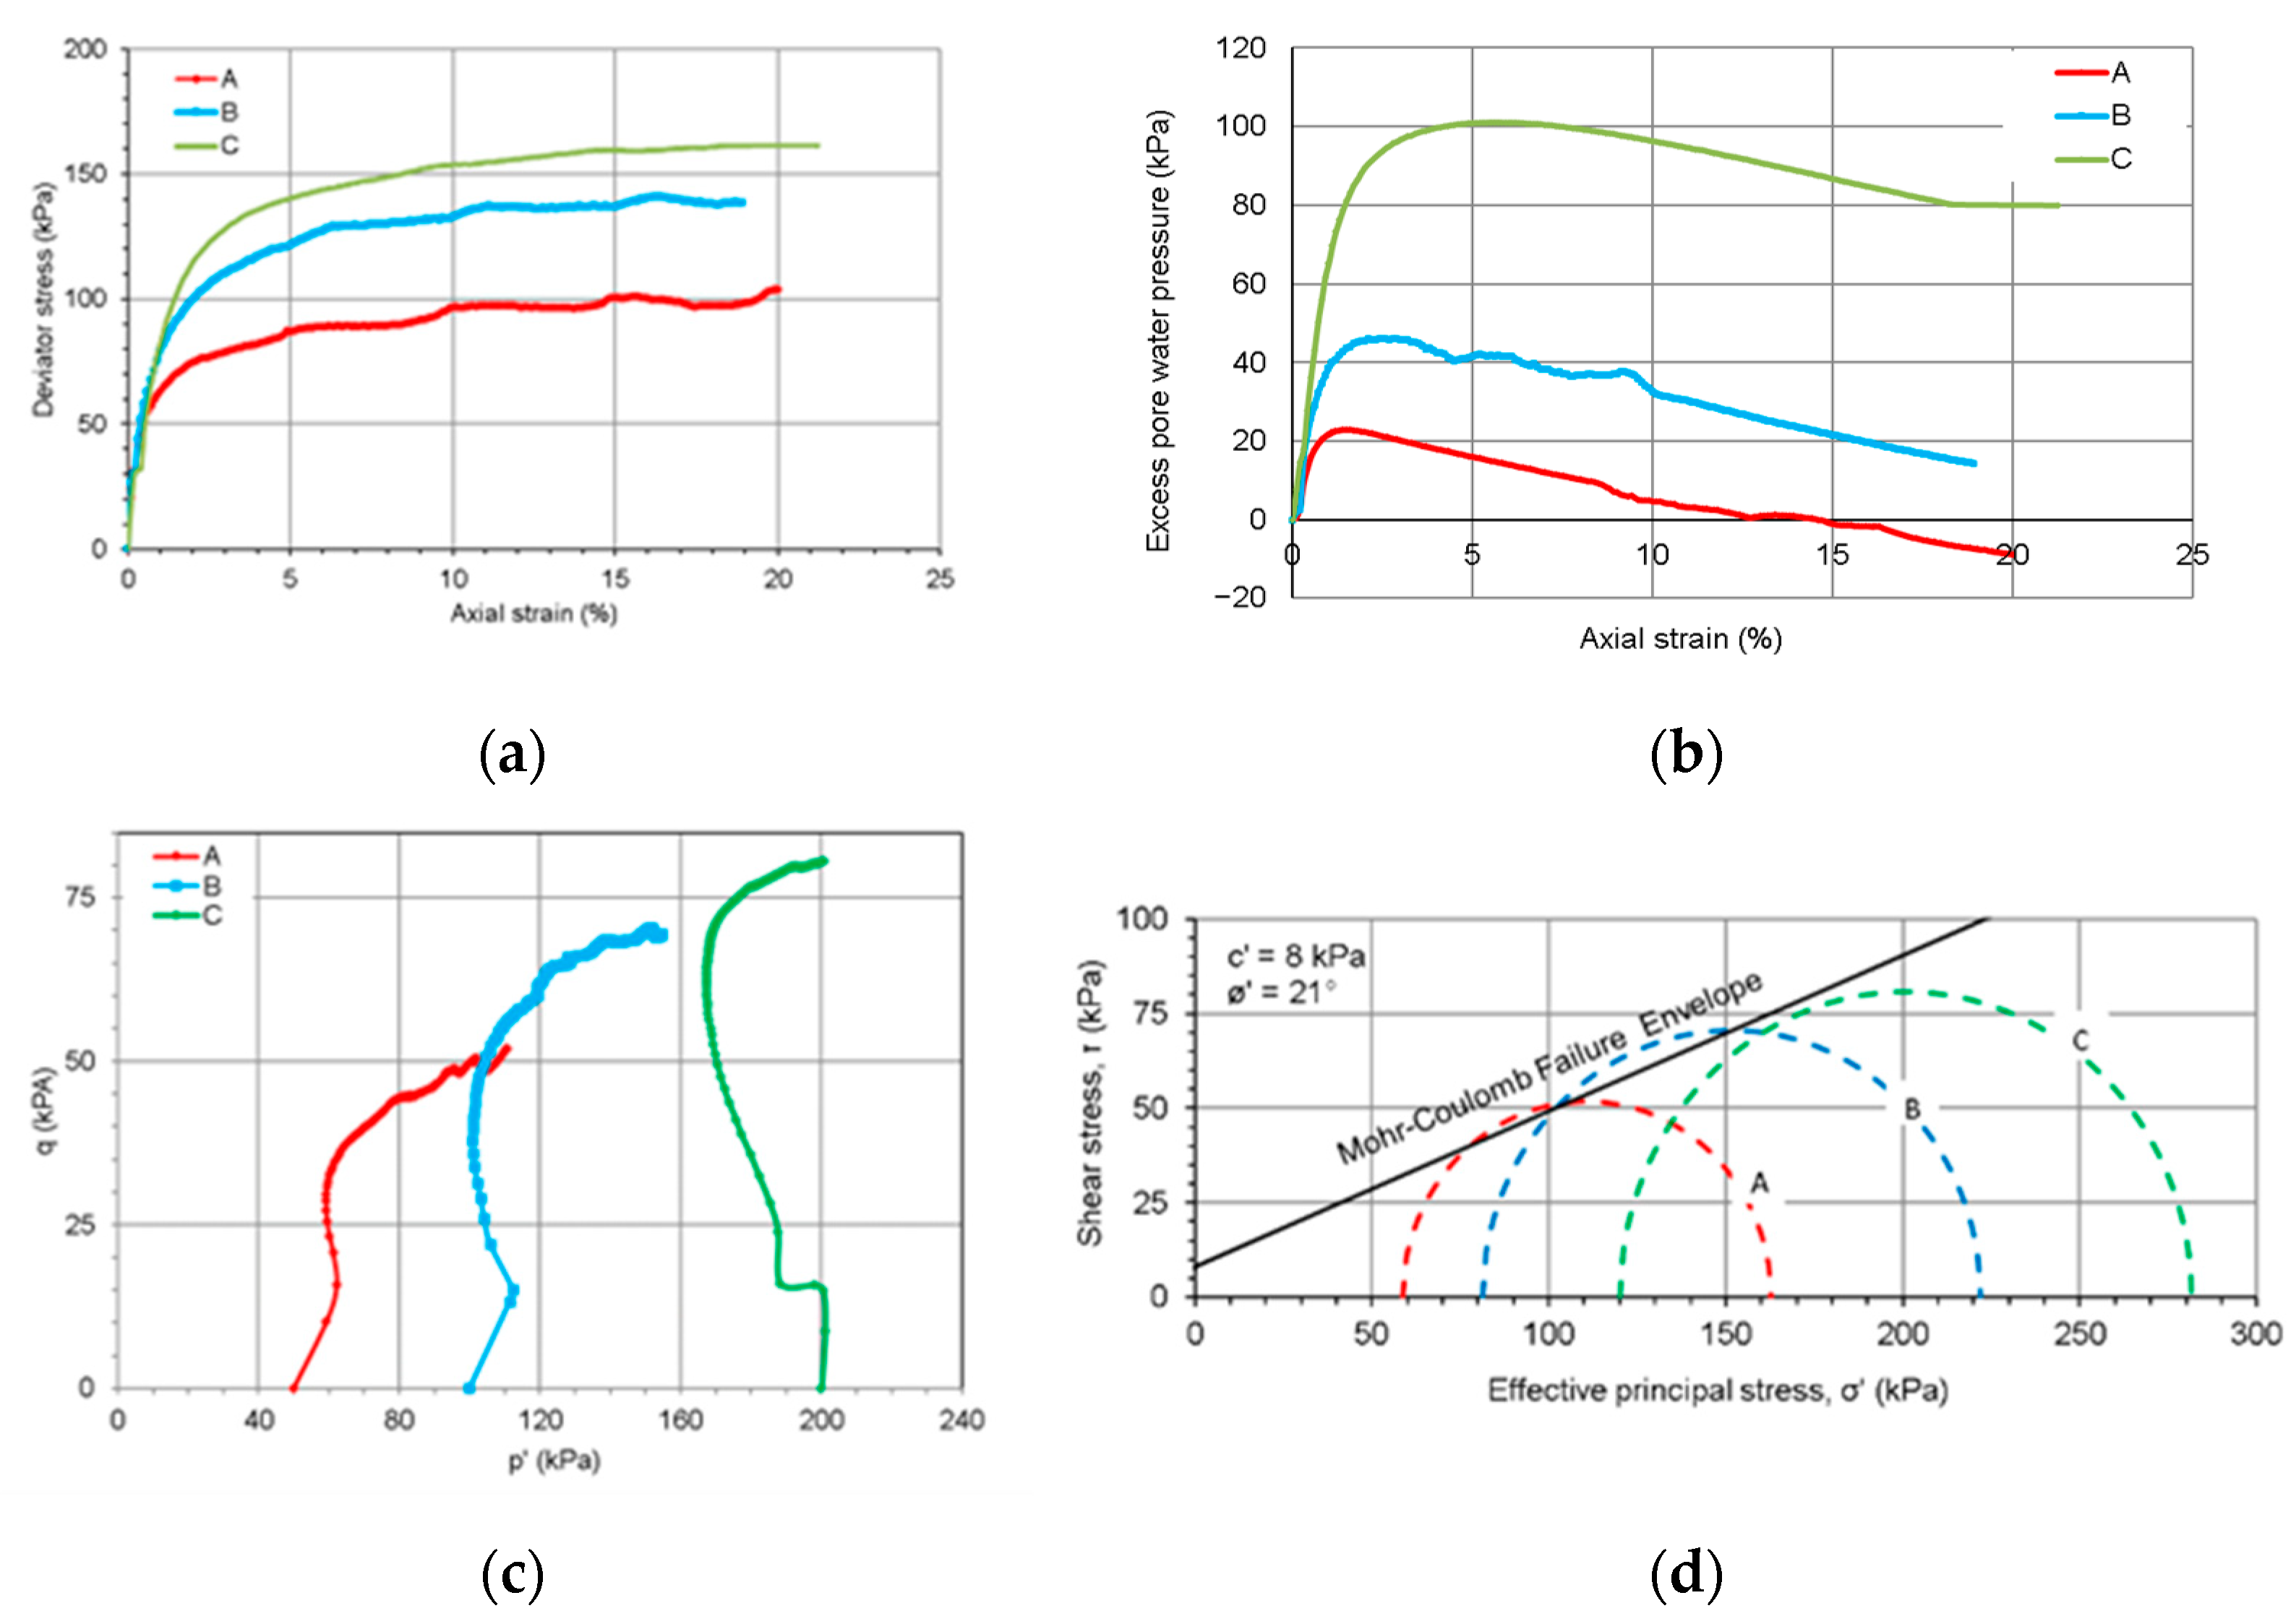
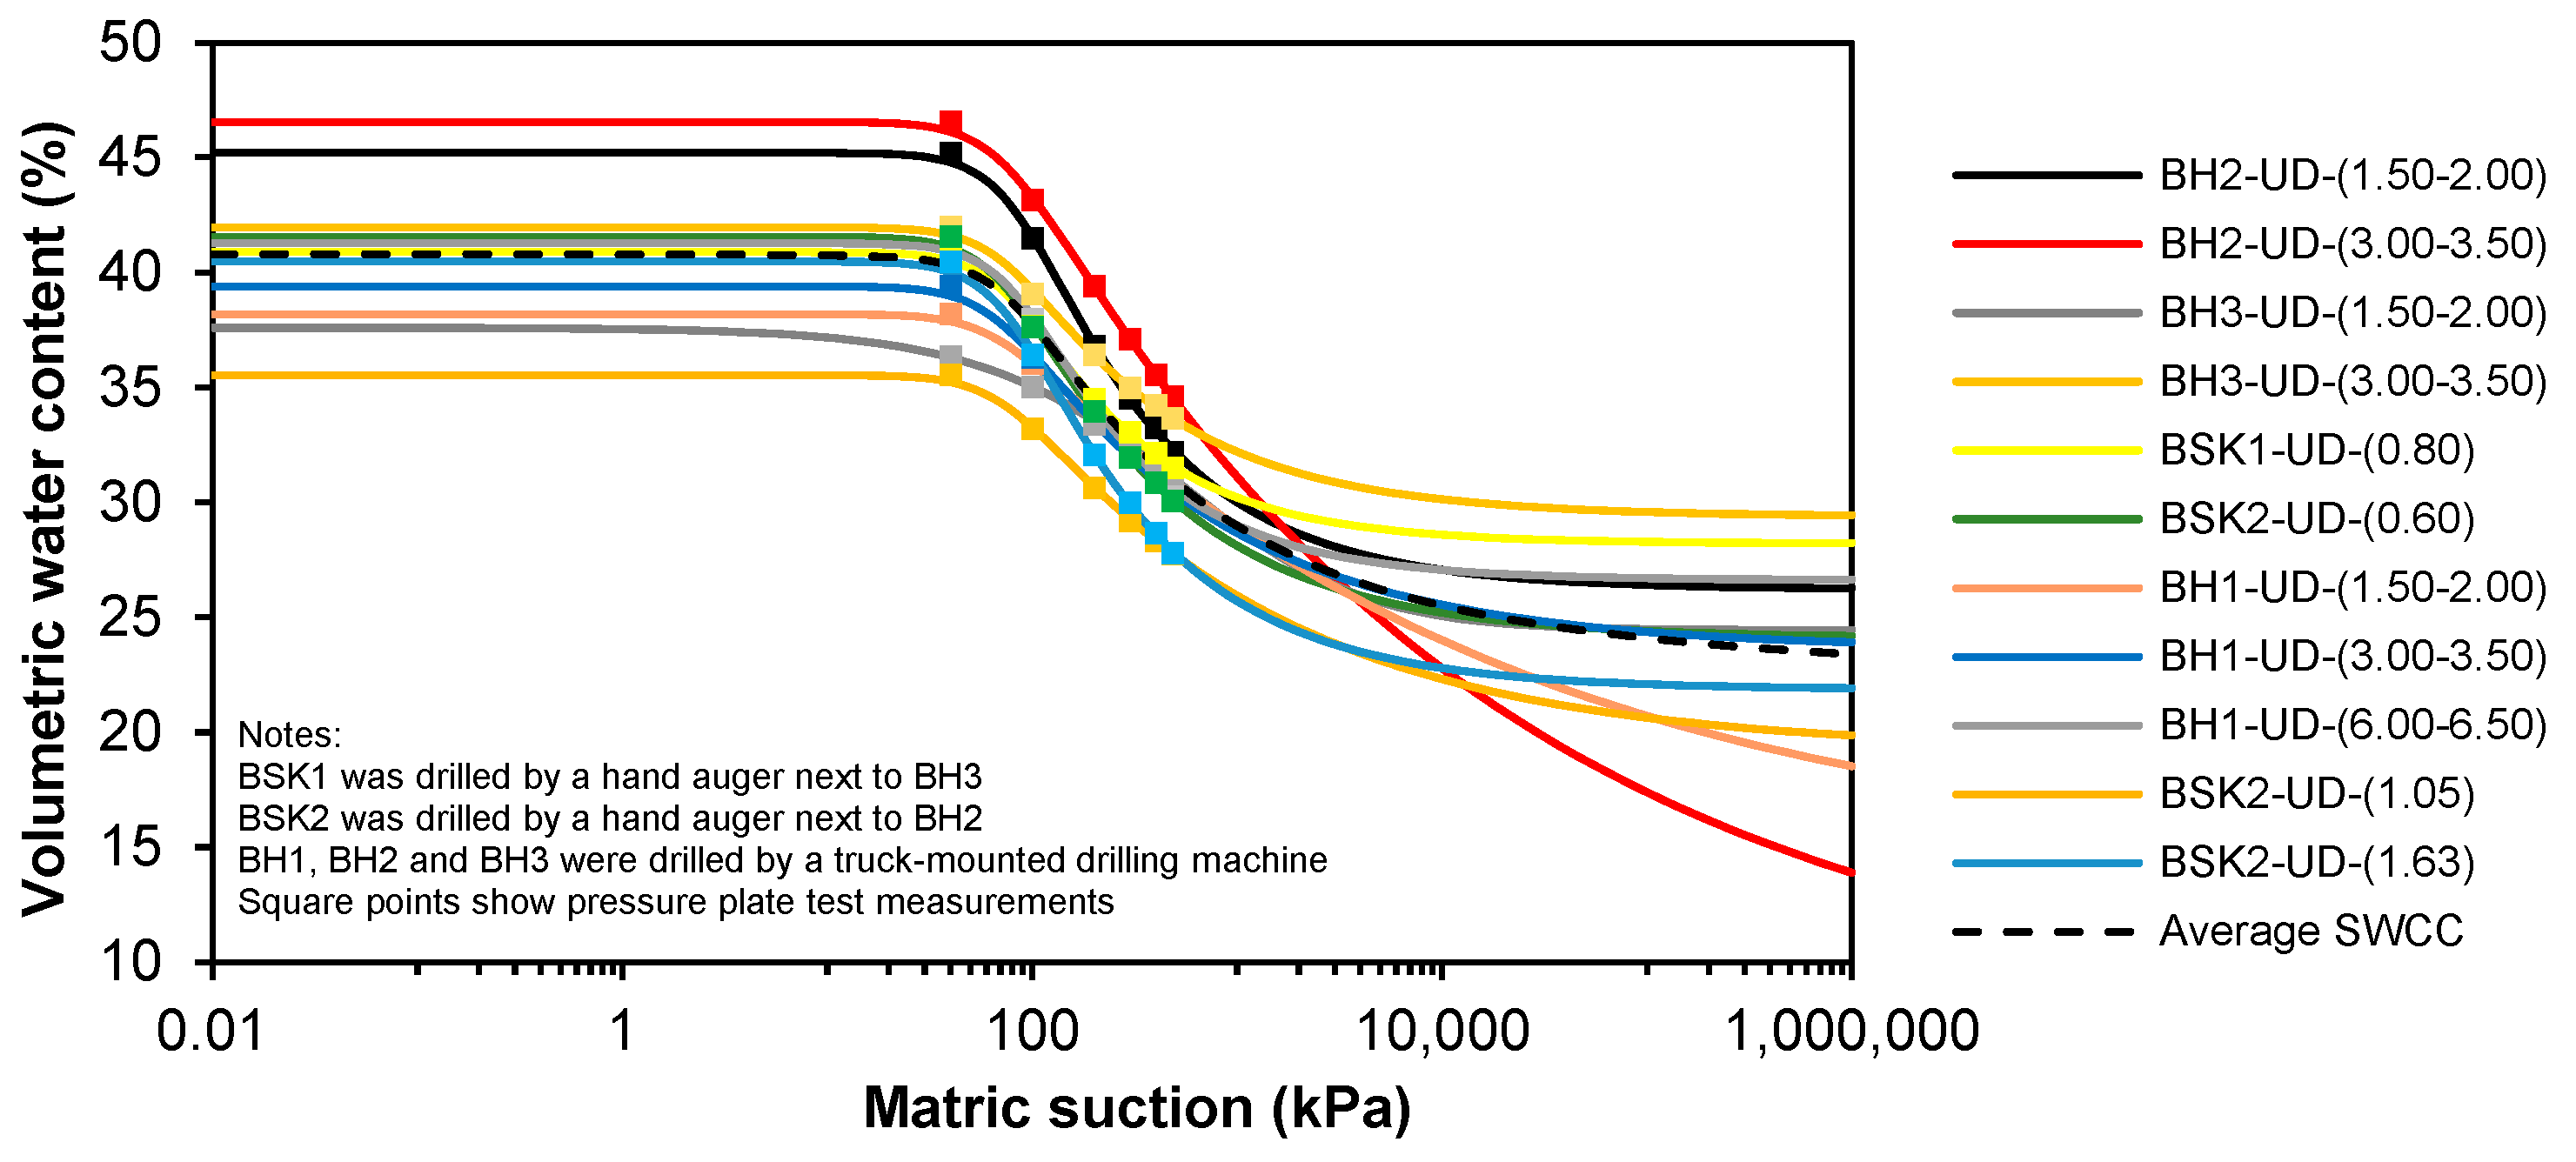
4. Laboratory Tests
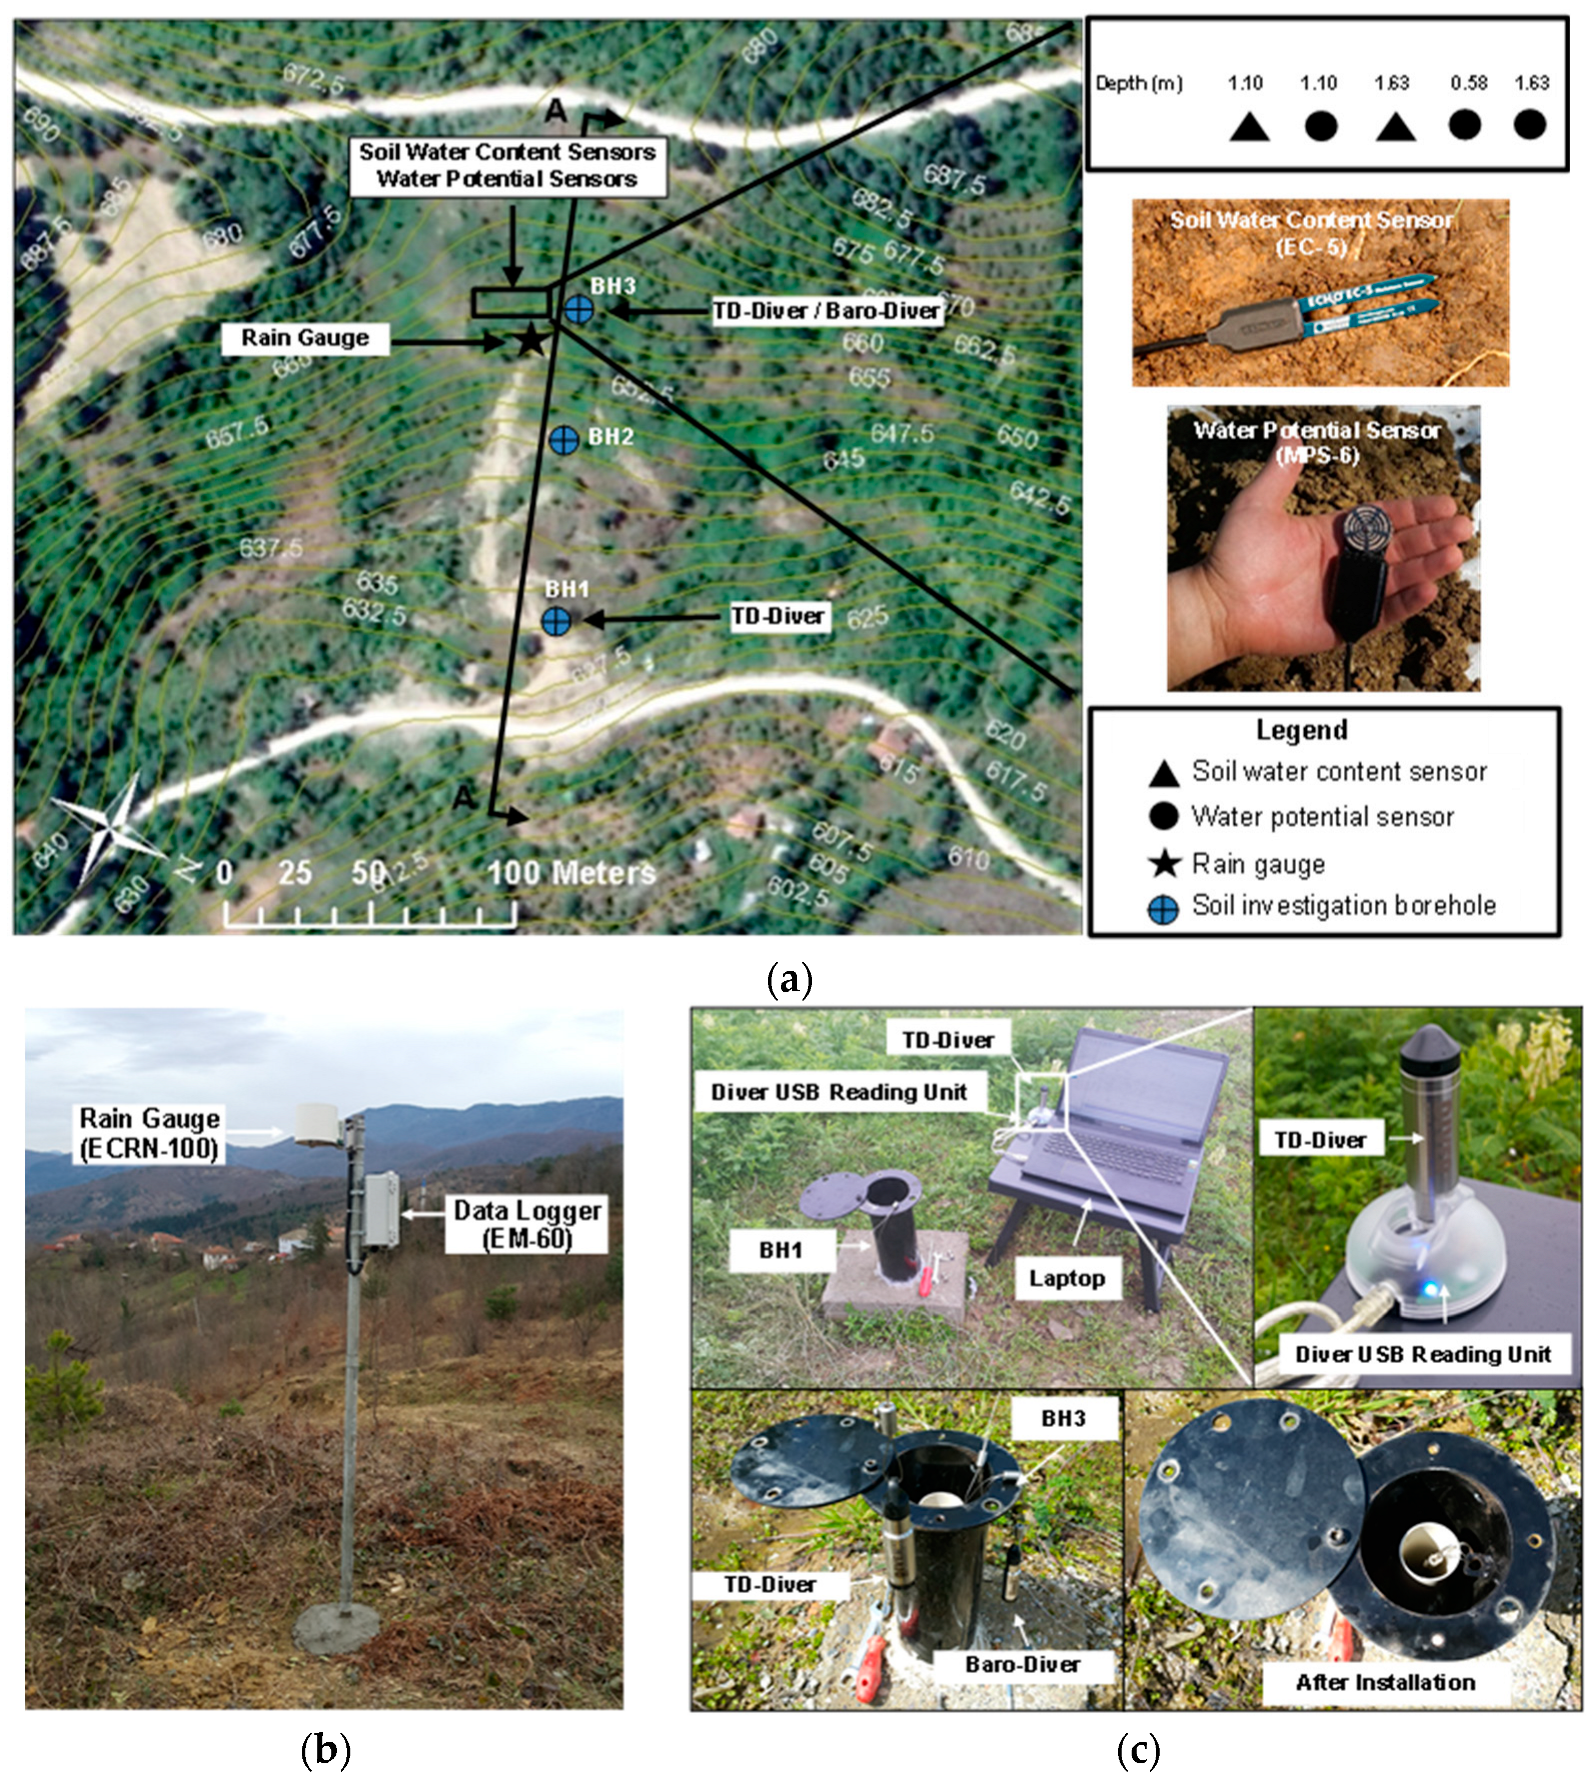
5. Instrumental Monitoring
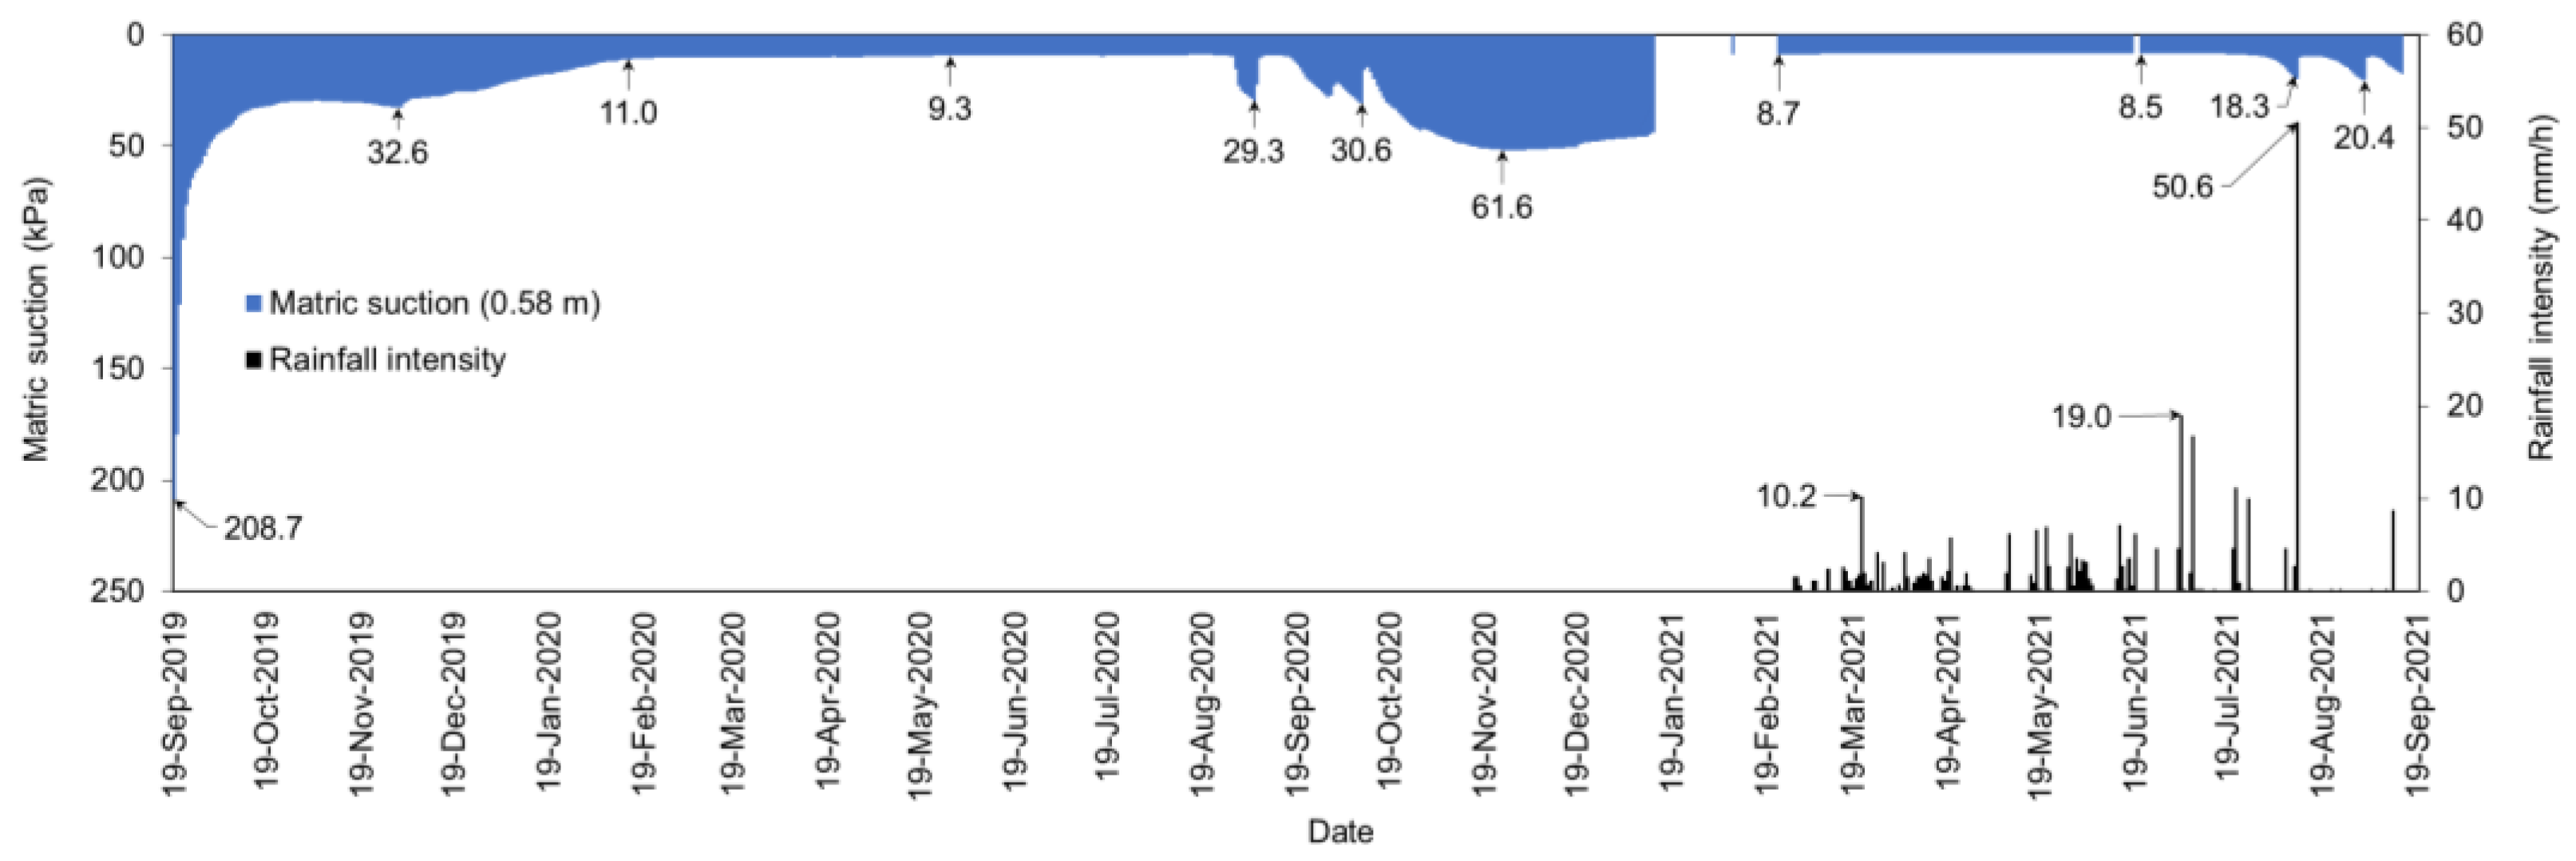
5.1. Monitoring of Volumetric Water Content and Matric Suction
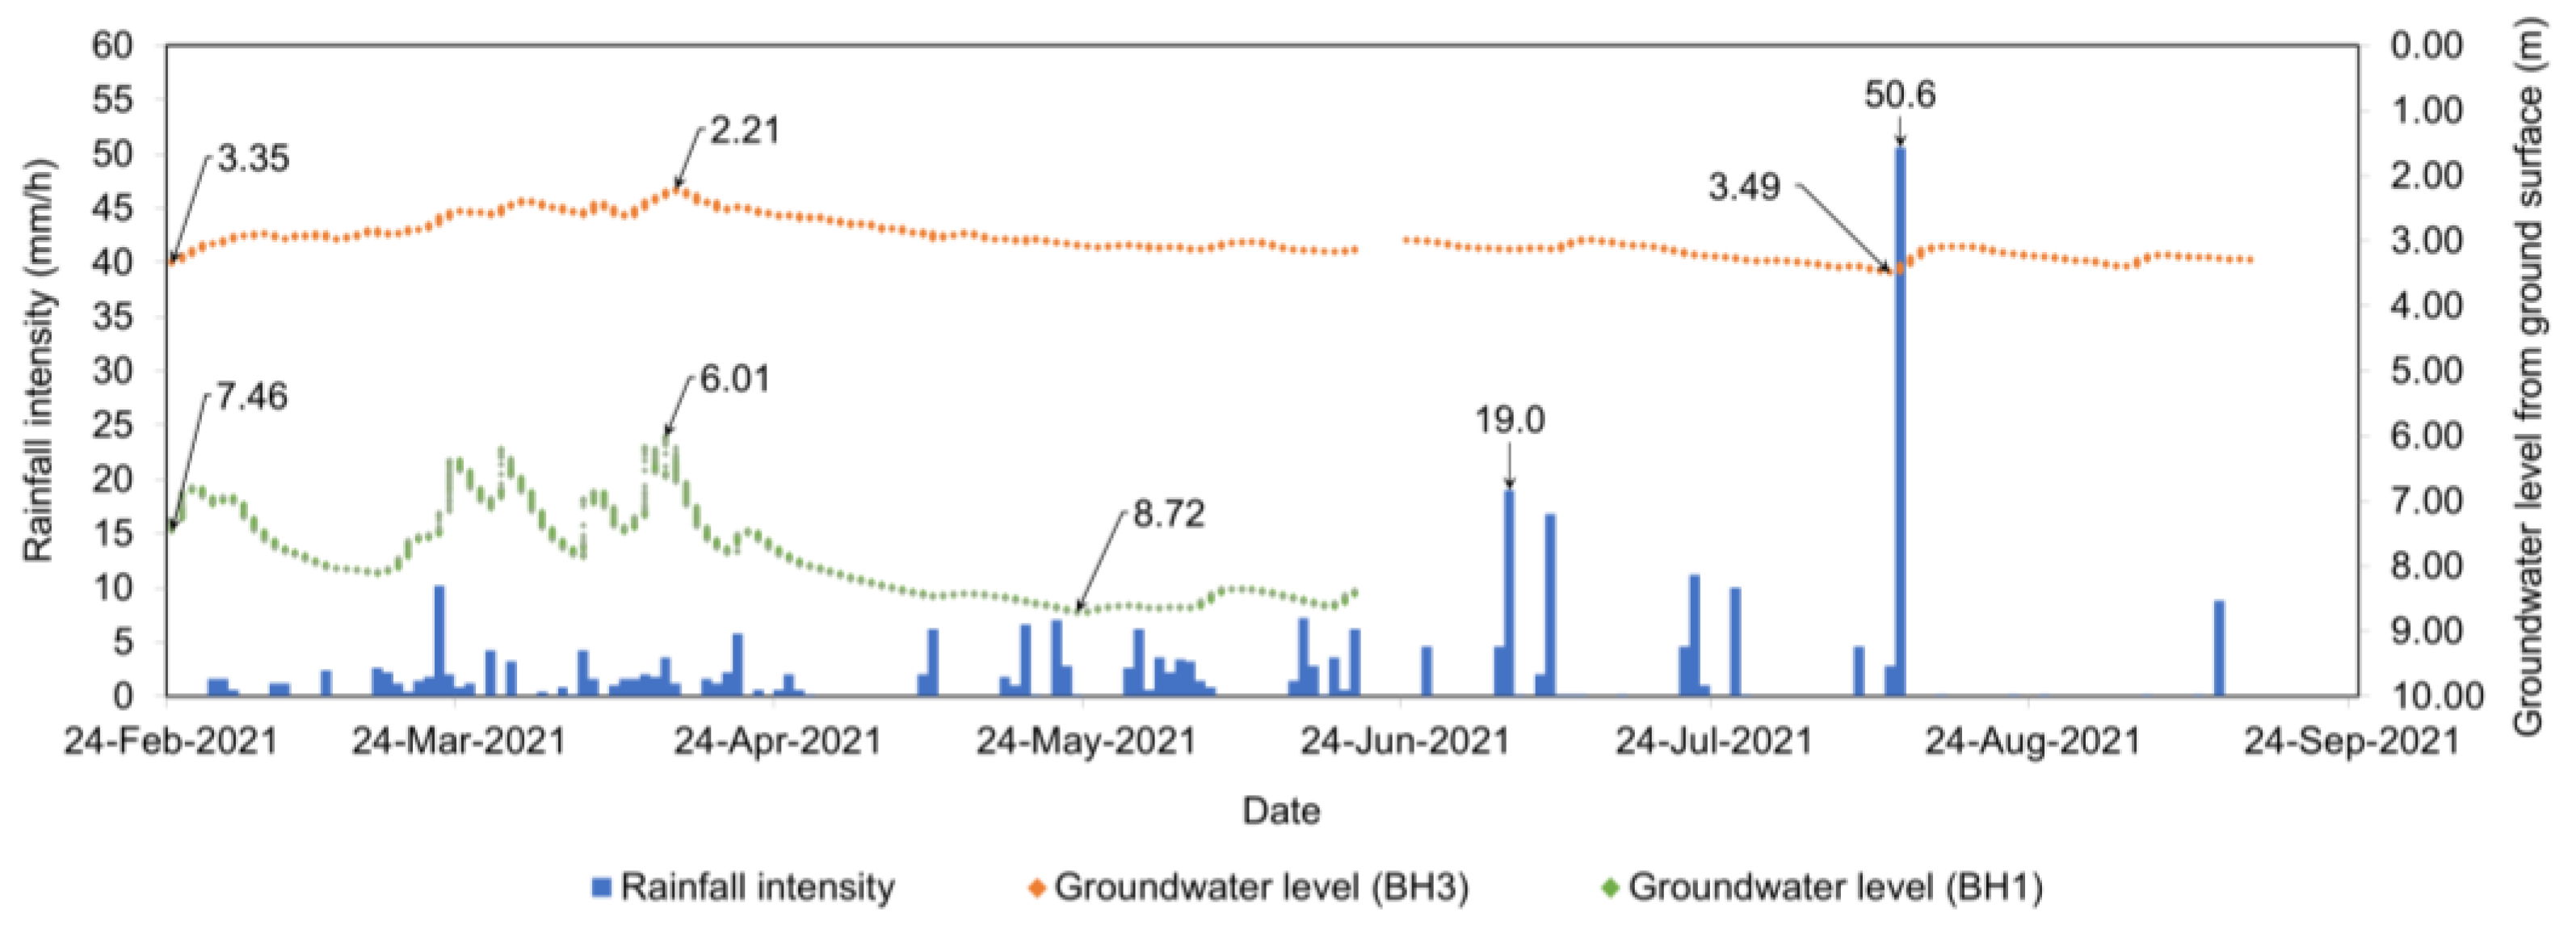
5.2. Monitoring of Groundwater Level
6. Numerical Modeling
6.1. Stability Analyses
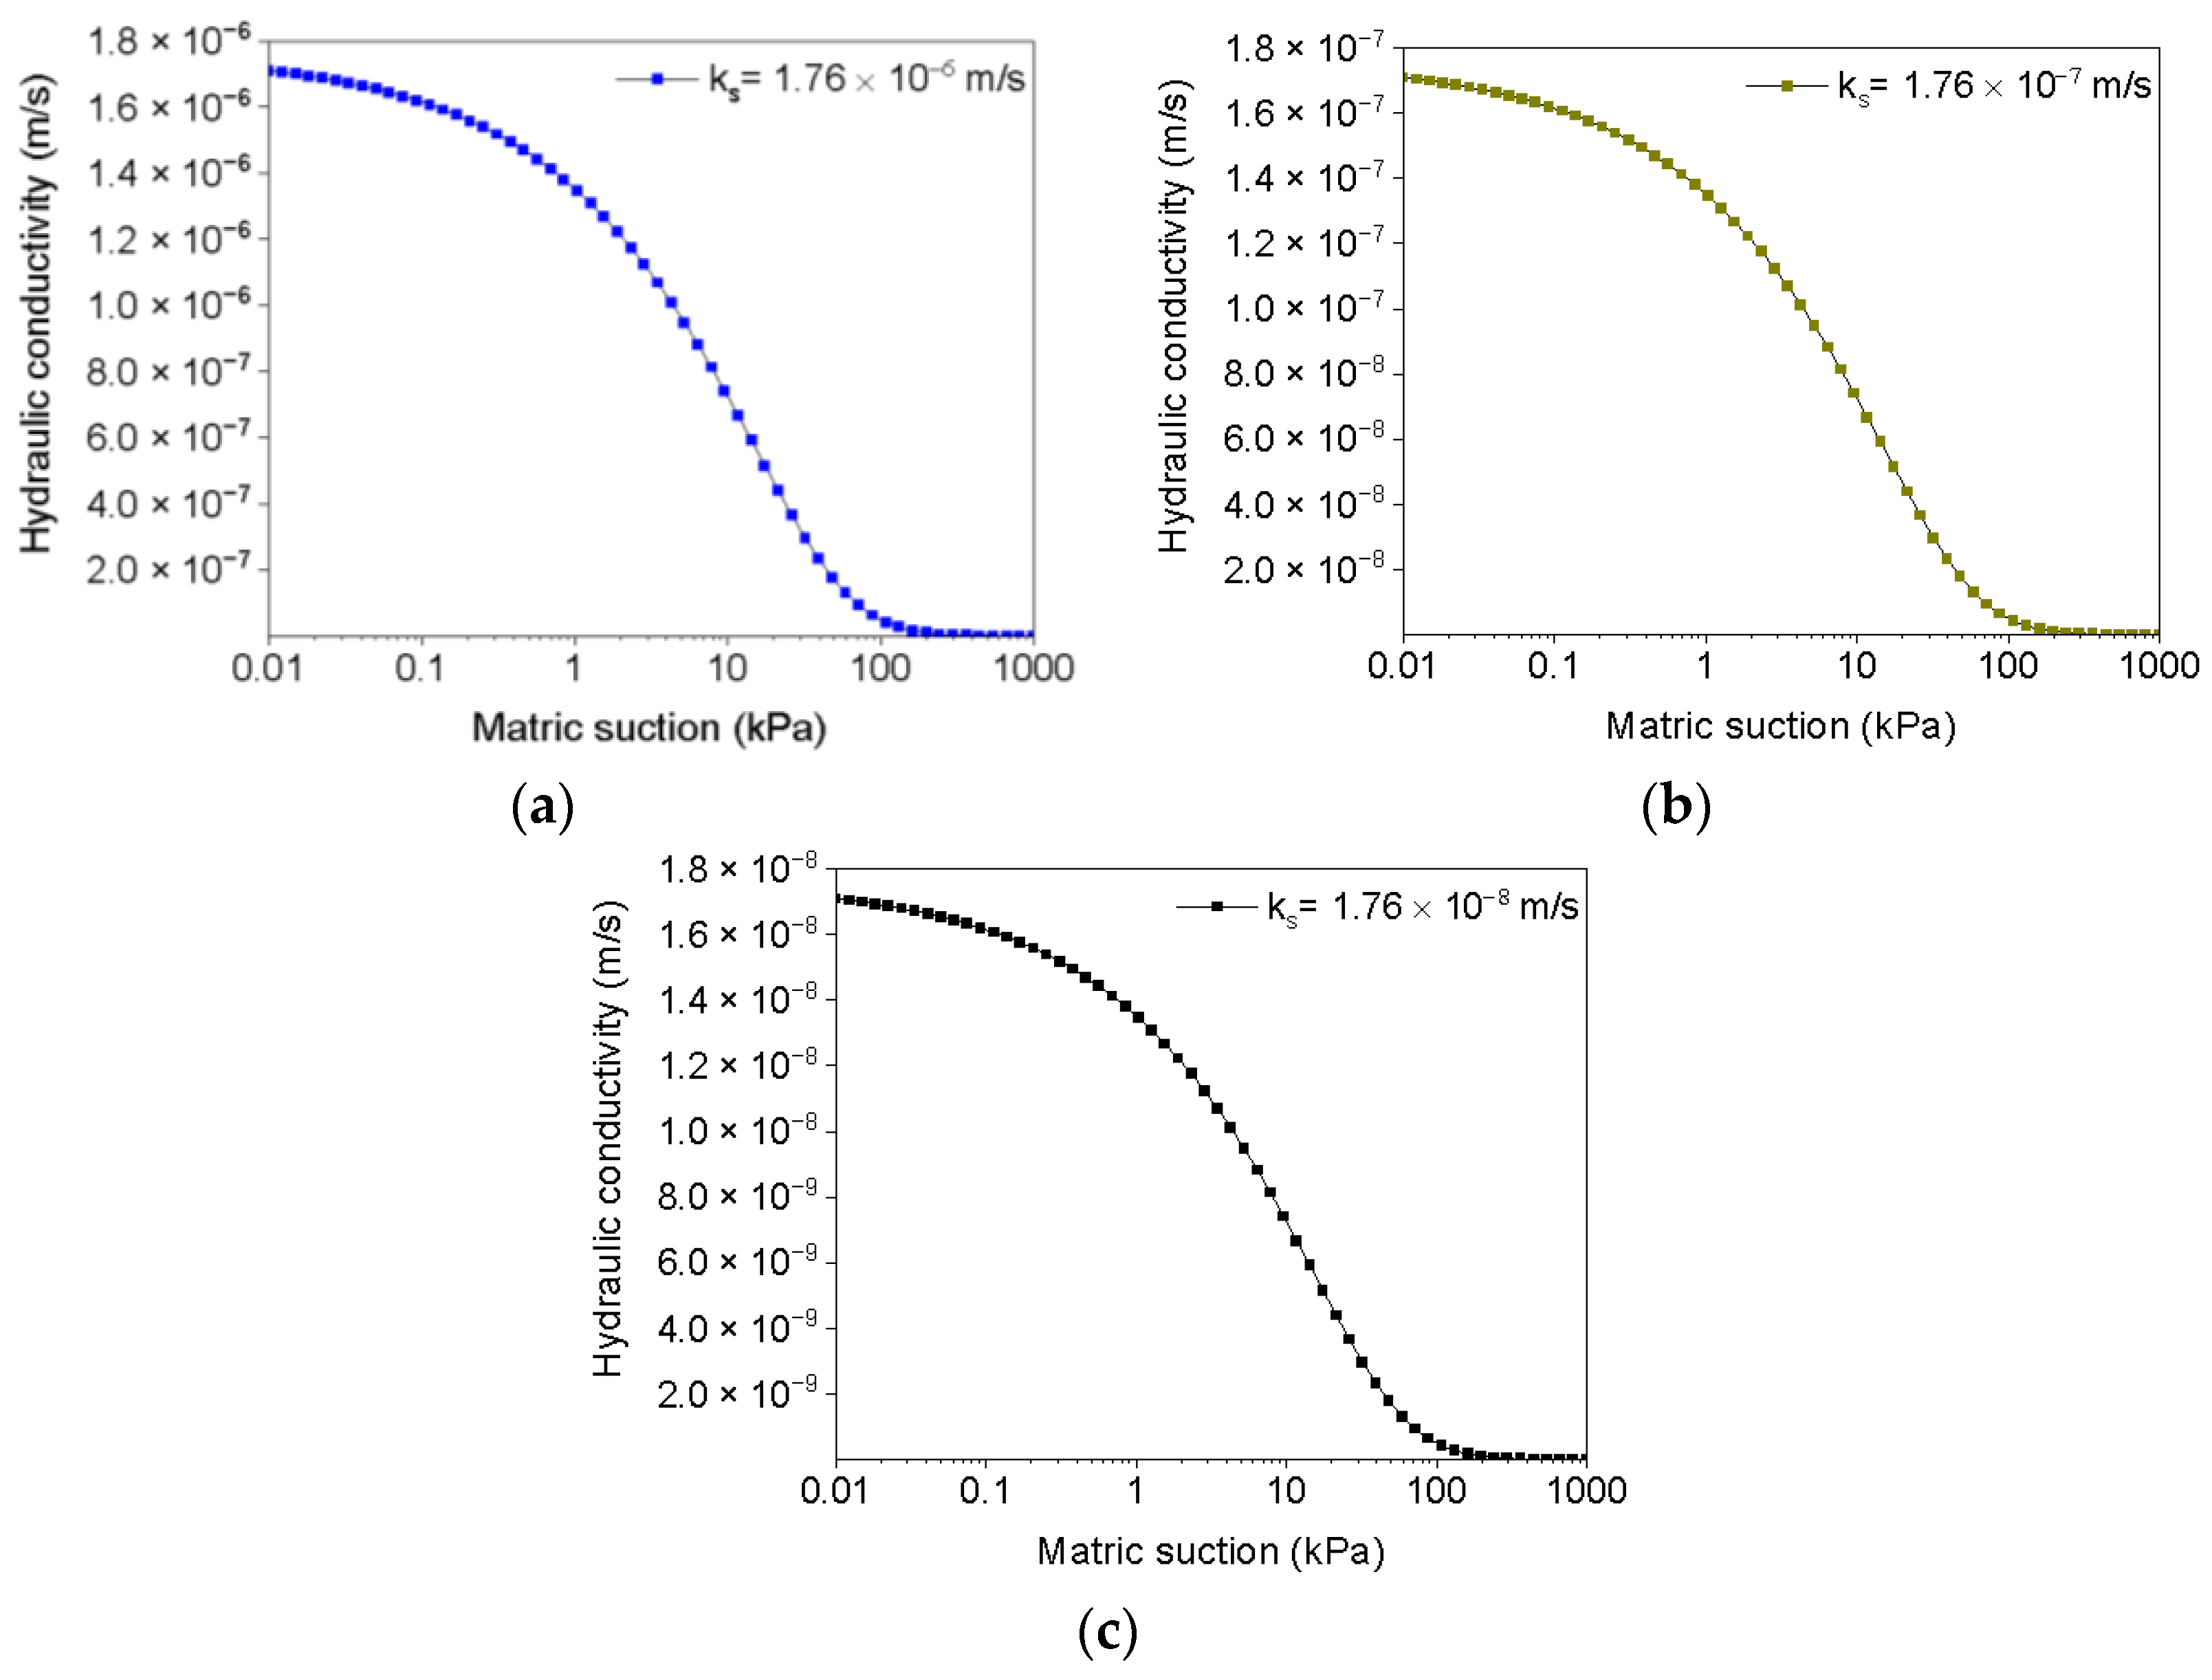
6.2. Seepage Analysis
7. Results and Discussion
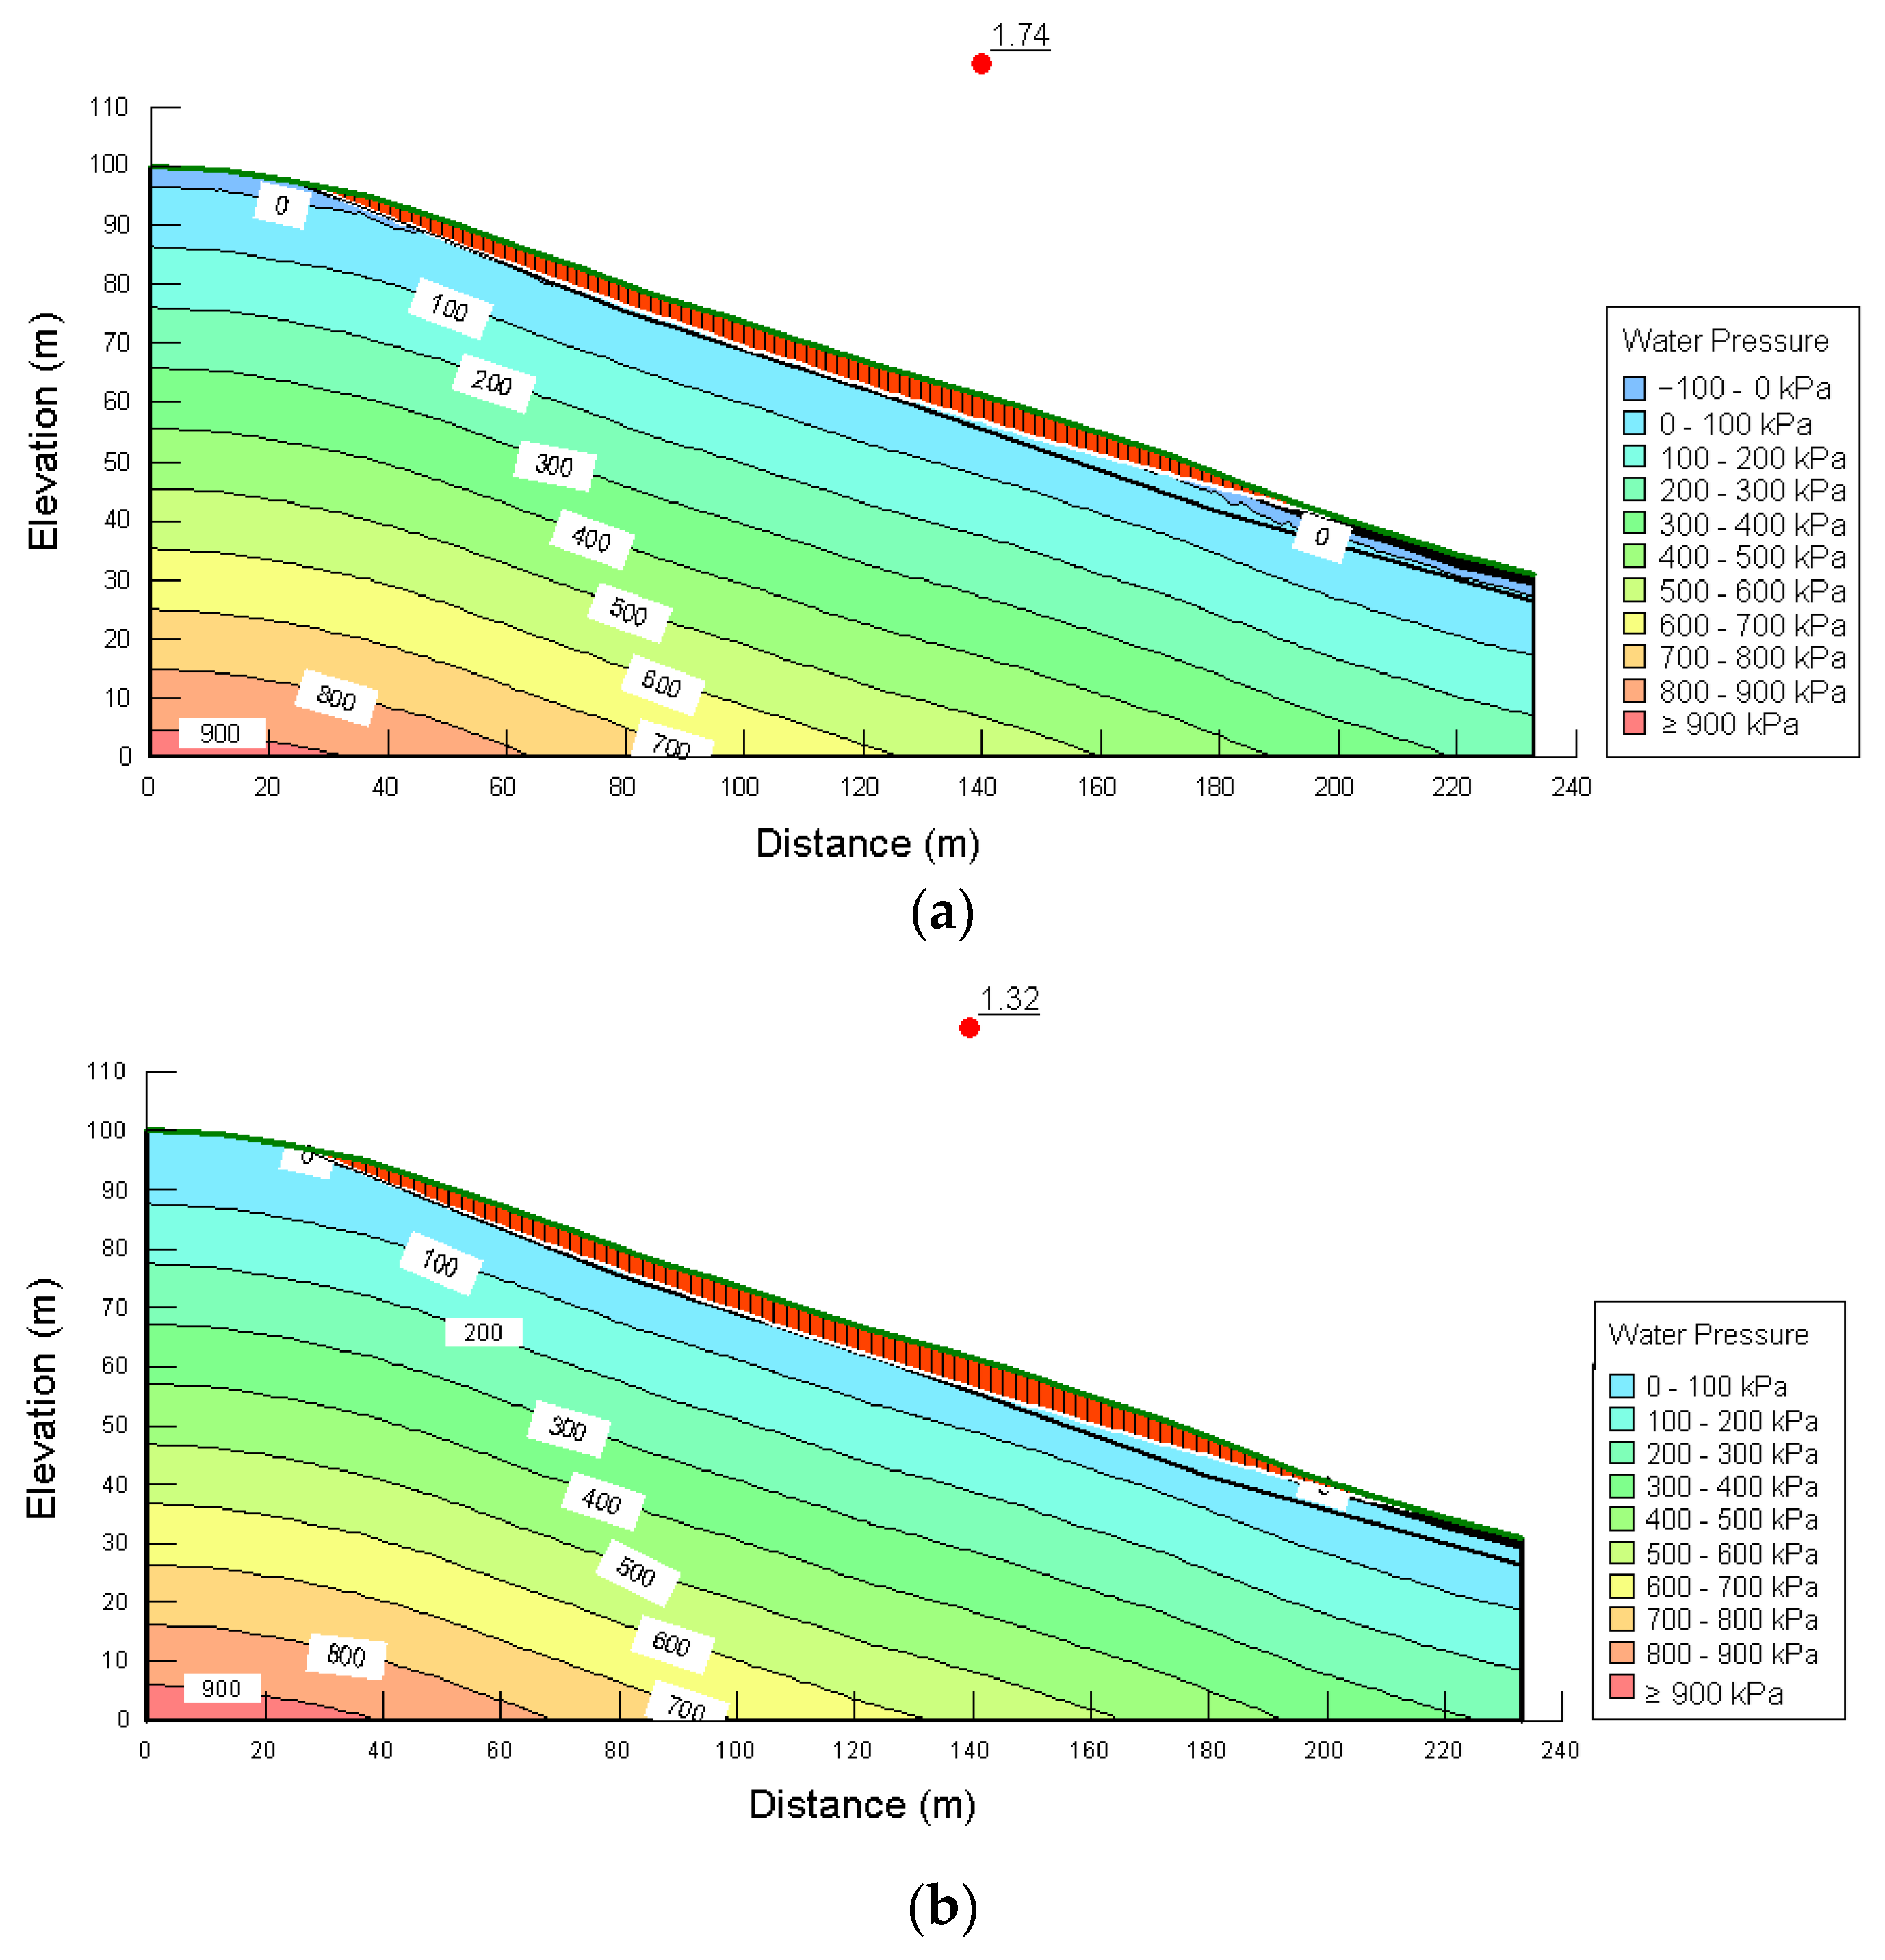
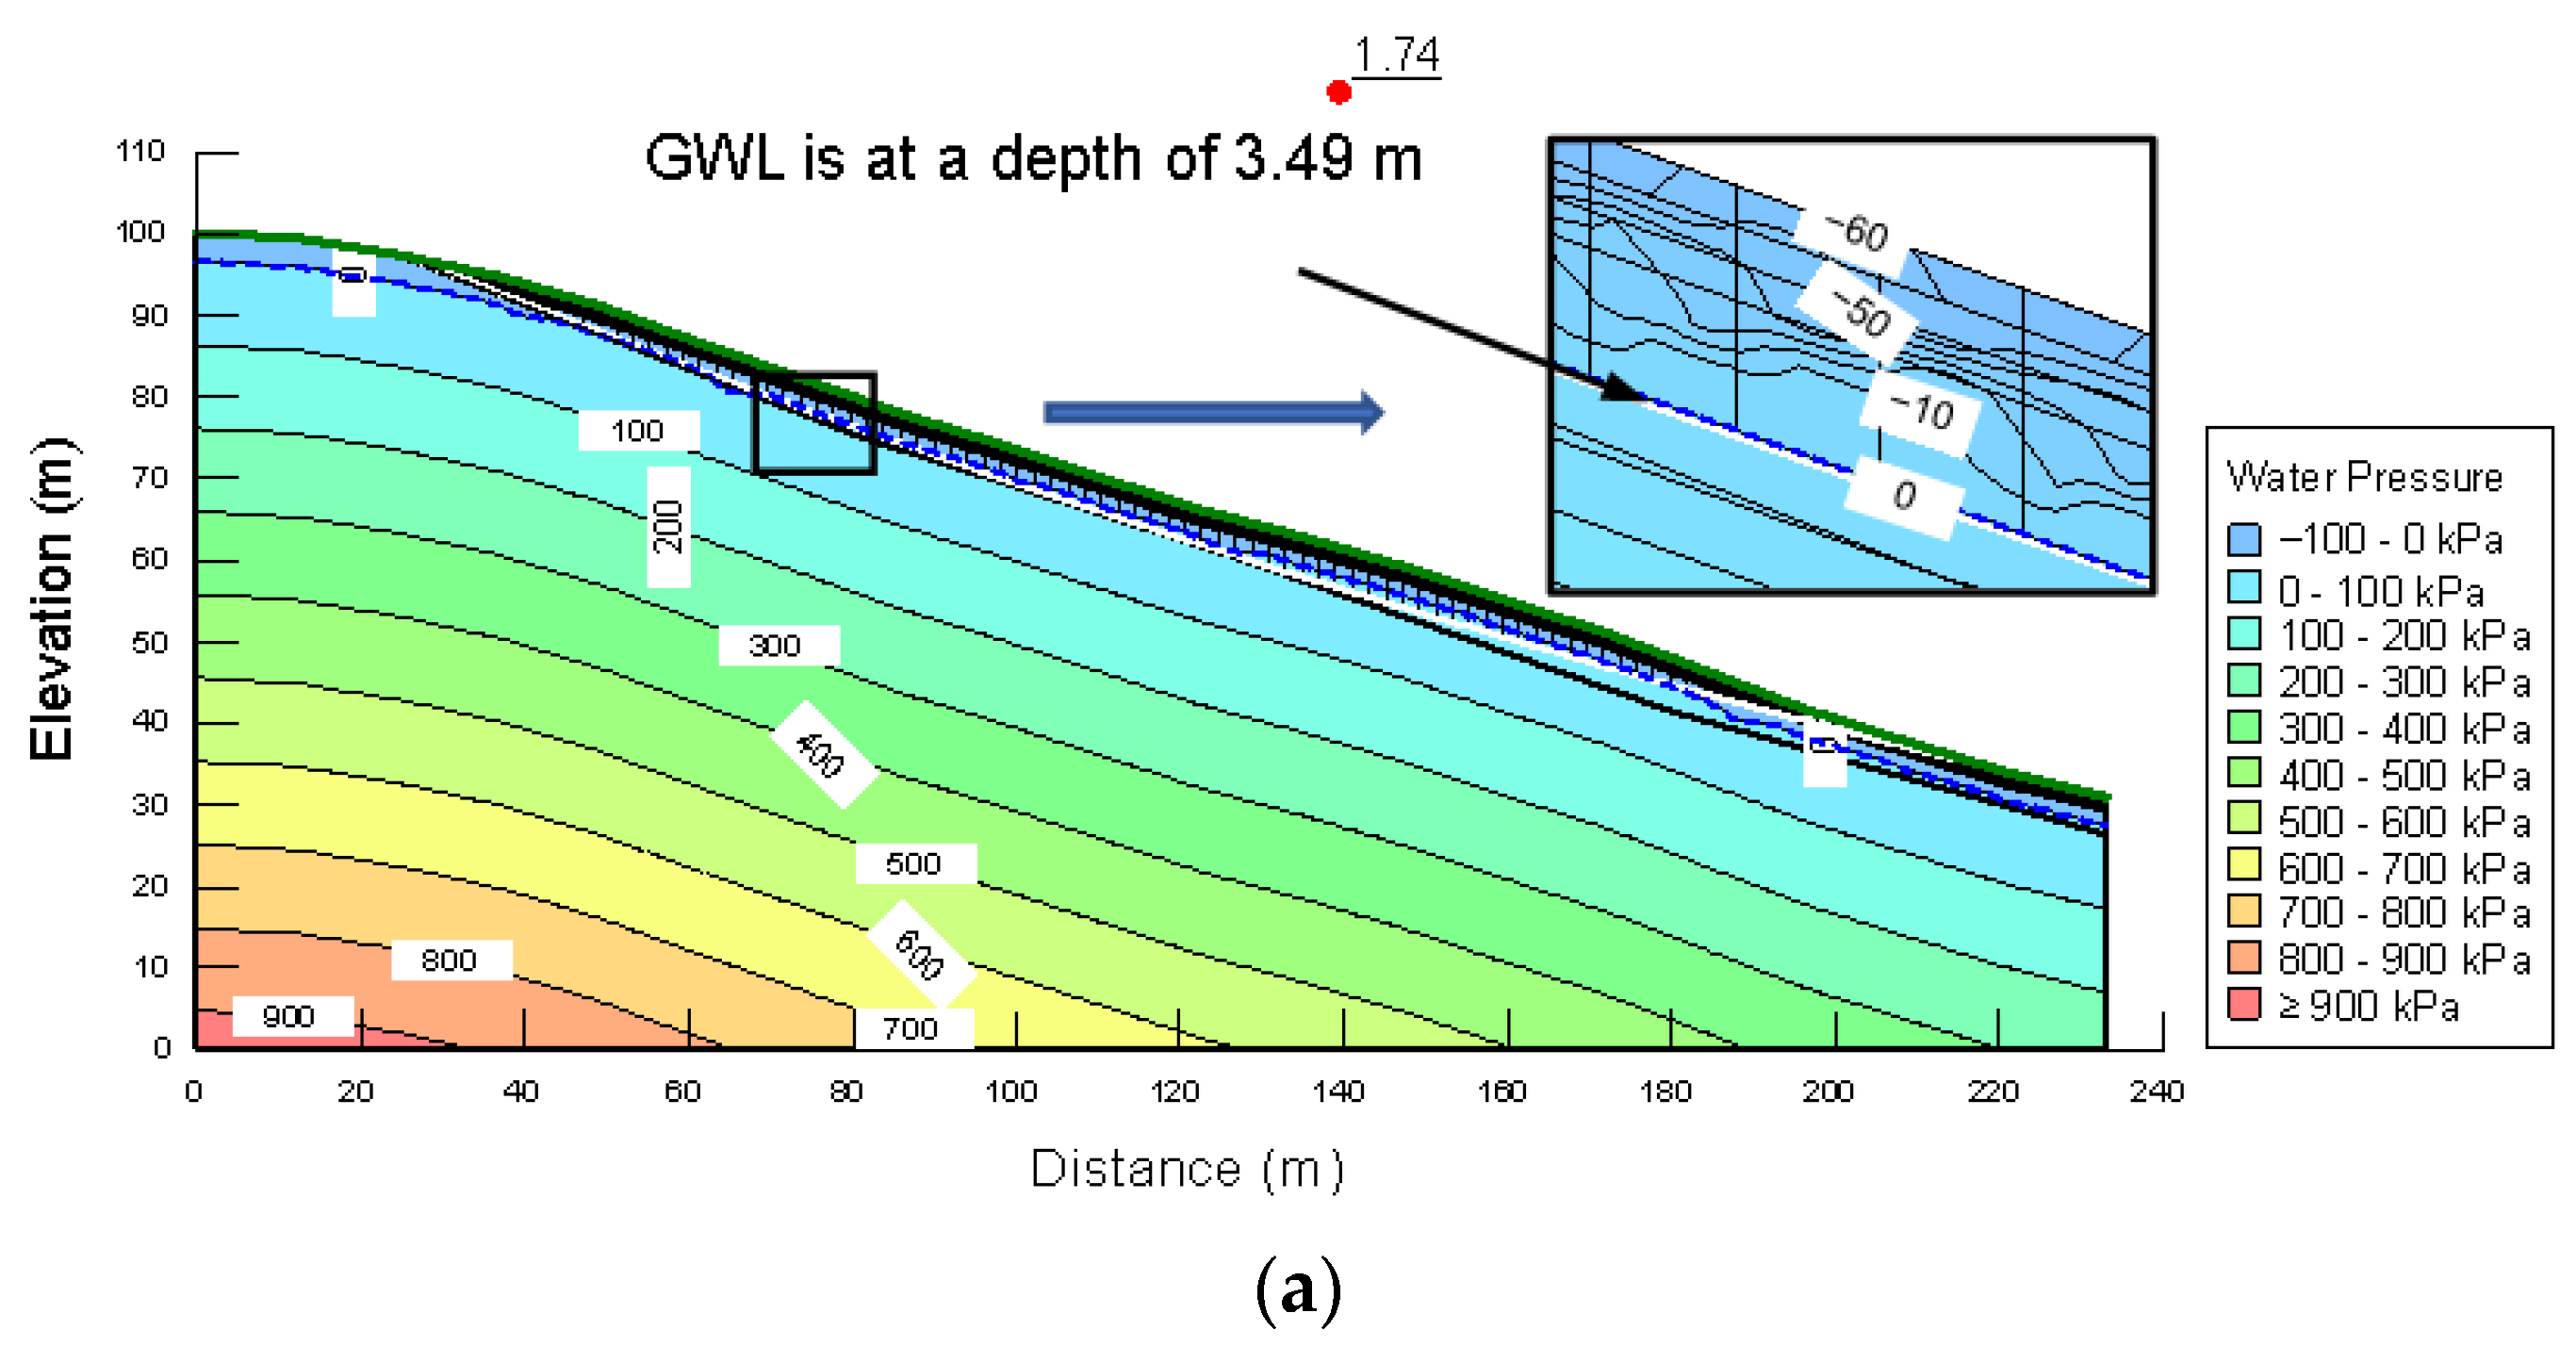
7.1. Dry Period and Wet Period Stability Analyses
7.2. Rainfall Infiltration Stability Analyses
8. Conclusions
Author Contributions
Funding
Institutional Review Board Statement
Informed Consent Statement
Data Availability Statement
Conflicts of Interest
References
- Gofar, N.; Lee, L.M. Extreme Rainfall Characteristics for Surface Slope Stability in the Malaysian Peninsular. Georisk Assess. Manag. Risk Eng. Syst. Geohazards 2008, 2, 65–78. [Google Scholar] [CrossRef]
- Leung, A.K.; Sun, H.W.; Millis, S.W.; Pappin, J.W.; Ng, C.W.W.; Wong, H.N. Field Monitoring of an Unsaturated Saprolitic Hillslope. Can. Geotech. J. 2011, 353, 339–353. [Google Scholar] [CrossRef]
- Kassim, A.; Gofar, N.; Min, L.; Rahardjo, H. Modeling of Suction Distributions in an Unsaturated Heterogeneous Residual Soil Slope. Eng. Geol. 2012, 131–132, 70–82. [Google Scholar] [CrossRef]
- Jeong, S.; Lee, K.; Kim, J.; Kim, Y. Analysis of Rainfall-Induced Landslide on Unsaturated Soil Slopes. Sustainability 2017, 9, 1280. [Google Scholar] [CrossRef] [Green Version]
- Senthilkumar, V.; Chandrasekaran, S.S.; Maji, V.B. Rainfall-Induced Landslides: Case Study of the Marappalam Landslide, Nilgiris District, Tamil Nadu, India. Int. J. Géoméch. 2018, 18, 05018006. [Google Scholar] [CrossRef]
- Das, T.; Dilli, V.; Deepankar, R. Numerical Investigation of the Stability of Landslide—Affected Slopes in Kerala, India, under Extreme Rainfall Event. Nat. Hazards 2022, 114, 751–785. [Google Scholar] [CrossRef]
- Leung, A.K.; Wang, C.; Ng, W. Field Investigation of Deformation Characteristics and Stress Mobilisation of a Soil Slope. Landslides 2016, 55, 229–240. [Google Scholar] [CrossRef] [Green Version]
- Suradi, M.; Fourie, A.B.; Saynor, M.J. An Experimental and Numerical Study of a Landslide Triggered by an Extreme Rainfall Event in Northern. Landslides 2016, 2007, 1125–1138. [Google Scholar] [CrossRef]
- Caine, N. The Rainfall Intensity: Duration Control of Shallow Landslides and Debris Flows. Geogr. Ann. Ser. A Phys. Geogr. 1980, 62, 23. [Google Scholar] [CrossRef]
- Corominas, J. Quantitative assessment of landslide risk: How well are we doing? In Proceedings of the SCG-XIII International Symposium On Landslides, Cartagena, Colombia, 15–19 June 2020. [Google Scholar]
- Aleotti, P. A Warning System for Rainfall-Induced Shallow Failures. Eng. Geol. 2004, 73, 247–265. [Google Scholar] [CrossRef]
- Wieczorek, G.F.; Glade, T. Climatic Factors Influencing Occurrence of Debris Flows. In Debris-Flow Hazards and Related Phenomena; Jakob, M., Hungr, O., Eds.; Praxis Publishing: Chichester, UK, 2005; pp. 325–362. [Google Scholar]
- Tiranti, D.; Rabuffetti, D. Estimation of Rainfall Thresholds Triggering Shallow Landslides for an Operational Warning System Implementation. Landslides 2010, 7, 471–481. [Google Scholar] [CrossRef]
- Guzzetti, F.; Peruccacci, S.; Rossi, M.; Stark, C.P. Rainfall Thresholds for the Initiation of Landslides in Central and Southern Europe. Meteorol. Atmos. Phys. 2007, 98, 239–267. [Google Scholar] [CrossRef]
- Crosta, G.B.; Frattini, P. Rainfall Thresholds for Soil Slip and Debris Flow Triggering. In Proceedings of the 2nd Plinius Conference on Mediterranean Storms, Perugia, Italy, 1–3 October 2001; pp. 463–487. [Google Scholar]
- Zêzere, J.L.; Trigo, R.M.; Trigo, I.F. Shallow and Deep Landslides Induced by Rainfall in the Lisbon Region (Portugal): Assessment of Relationships with the North Atlantic Oscillation. Nat. Hazards Earth Syst. Sci. 2005, 5, 331–344. [Google Scholar] [CrossRef]
- Akcali, E.; Arman, H. Landslide Early Warning System Suggestion Based on Landslide—Rainfall Threshold: Trabzon Province. Turk. J. Civ. Eng. 2013, 24, 6307–6332. [Google Scholar]
- Cancelli, A.; Nova, R. Landslides in Soil Debris Cover Triggered by Rainstorms in Valtellina (Central Alps—Italy). In Proceedings of the 4th International Conference and Field Workshop on Landslides, Tokyo, Japan, 23–31 August 1985; pp. 267–272. [Google Scholar]
- Brunetti, M.T.; Peruccacci, S.; Rossi, M.; Luciani, S.; Valigi, D.; Guzzetti, F. Rainfall Thresholds for the Possible Occurrence of Landslides in Italy. Nat. Hazards Earth Syst. Sci. 2010, 10, 447–458. [Google Scholar] [CrossRef]
- Coppola, L.; Reder, A.; Tarantino, A.; Mannara, G.; Pagano, L. Pre-Failure Suction-Induced Deformation to Inform Early Warning of Shallow Landslides: Proof of Concept at Slope Model Scale. Eng. Geol. 2022, 309, 106834. [Google Scholar] [CrossRef]
- Jiang, Z.; Fan, X.; Siva Subramanian, S.; Yang, F.; Tang, R.; Xu, Q.; Huang, R. Probabilistic Rainfall Thresholds for Debris Flows Occurred after the Wenchuan Earthquake Using a Bayesian Technique. Eng. Geol. 2021, 280, 105965. [Google Scholar] [CrossRef]
- Intrieri, E.; Carlà, T.; Gigli, G. Forecasting the Time of Failure of Landslides at Slope-Scale: A Literature Review. Earth-Sci. Rev. 2019, 193, 333–349. [Google Scholar] [CrossRef]
- Fourie, A.B. Predicting Rainfall-Induced Slope Instability. Proc. Inst. Civ. Eng. Geotech. Eng. 1996, 119, 211–218. [Google Scholar] [CrossRef]
- Chang, K.T.; Chiang, S.H. An Integrated Model for Predicting Rainfall-Induced Landslides. Geomorphology 2009, 105, 366–373. [Google Scholar] [CrossRef]
- Manconi, A.; Giordan, D. Landslide Failure Forecast in Near-Real-Time. Geomat. Nat. Hazards Risk 2016, 7, 639–648. [Google Scholar] [CrossRef] [Green Version]
- Das, P.; Patwa, D.; Tadikonda, V.G.; Bharat, V. Influencing Factors on the Simulation of Rainfall—Induced Landslide Prediction Based on Case Study. Bull. Eng. Geol. Environ. 2022, 81, 194. [Google Scholar] [CrossRef]
- Baum, R.L.; Savage, W.Z.; Godt, J.W. TRIGRS—A Fortran Program for Transient Rainfall Infiltration and Grid-Based Regional Slope-Stability Analysis, Version 2.0.; Open-File Report No. 2008–1159; U.S. Geological Survey: Reston, Virginia, 2008; 75p. [Google Scholar]
- Crosta, G.B.; Frattini, P. Distributed Modelling of Shallow Landslides Triggered by Intense Rainfall. Nat. Hazards Earth Syst. Sci. 2003, 3, 81–93. [Google Scholar] [CrossRef] [Green Version]
- Wilson, R.C.; Wieczorek, G.F. Rainfall Thresholds for the Initiation of Debris Flows at La Honda, California. Environ. Eng. Geosci. 1995, 1, 11–27. [Google Scholar] [CrossRef]
- Tsaparas, I.; Rahardjo, H.; Toll, D.G.; Leong, E.C. Infiltration Characteristics of Two Instrumented Residual Soil Slopes. Can. Geotech. J. 2003, 40, 1012–1032. [Google Scholar] [CrossRef]
- Ng, C.W.W.; Menzies, B. Advanced Unsaturated Soil Mechanics and Engineering; CRC Press: Boca Raton, FL, USA, 2007. [Google Scholar] [CrossRef]
- Fredlund, D.G.; Rahardjo, H.; Fredlund, M.D. Unsaturated Soil Mechanics in Engineering Practice; John Wiley & Sons, Inc.: Hoboken, NJ, USA, 2012. [Google Scholar] [CrossRef]
- Ng, C.W.W.; Shi, Q. A Numerical Investigation of the Stability of Unsaturated Soil Slopes Subjected to Transient Seepage. Comput. Geotech. 1998, 22, 1–28. [Google Scholar] [CrossRef]
- Yeh, H.-F.; Chang, P.-H.; Chen, J.-F.; Lee, C.-H. Instability of Unsaturated Soil Slopes Due to Infiltration. In Proceedings of the International Symposium on Geohazards Mitigation, Tainan, Taiwan, 1 November 2006; p. 6. [Google Scholar]
- Sharma, R.H.; Nakagawa, H. Numerical Model and Flume Experiments of Single- and Two-Layered Hillslope Flow Related to Slope Failure. Landslides 2010, 7, 425–432. [Google Scholar] [CrossRef]
- Oh, S.; Lu, N. Slope Stability Analysis under Unsaturated Conditions: Case Studies of Rainfall-Induced Failure of Cut Slopes. Eng. Geol. 2015, 184, 96–103. [Google Scholar] [CrossRef]
- Pramusandi, S.; Rifa’i, A.; Suryolelono, K.B. Determination of Unsaturated Soil Properties and Slope Deformation Analysis Due to the Effect of Varies Rainfall. Procedia Eng. 2015, 125, 376–382. [Google Scholar] [CrossRef] [Green Version]
- Song, Y.S.; Chae, B.G.; Lee, J. A Method for Evaluating the Stability of an Unsaturated Slope in Natural Terrain during Rainfall. Eng. Geol. 2016, 210, 84–92. [Google Scholar] [CrossRef]
- Tran, A.T.P.; Sim, Y.; Kim, A.-R.; Cho, G.-C.; Kim, D.-H. Numerical Modeling of Rainfall-Induced Slope Failure. In Proceedings of the the 2016 World Congress on Advances in Civil, Environmental, and Materials Research (ACEM16), Jeju Island, Republic of Korea, 28 August–1 September 2016; pp. 1–10. [Google Scholar]
- Zaky, F.A.; Oh, S. Transient Infiltration and Stability Analysis of Unsaturated Soils in Busan Landslide Area. Int. J. Environ. Sci. 2017, 2, 40–44. [Google Scholar]
- Li, H.; He, Y.; Xu, Q.; Deng, J.; Li, W.; Wei, Y. Detection and Segmentation of Loess Landslides via Satellite Images: A Two-Phase Framework. Landslides 2022, 19, 673–686. [Google Scholar] [CrossRef]
- Li, H.; He, Y.; Yang, H.; Wei, Y.; Li, S.; Xu, J. Rainfall Prediction Using Optimally Pruned Extreme Learning Machines. Nat. Hazards 2021, 108, 799–817. [Google Scholar] [CrossRef]
- Li, H.; He, Y.; Xu, Q.; Deng, J.; Li, W.; Wei, Y.; Zhou, J. Sematic Segmentation of Loess Landslides with STAPLE Mask and Fully Connected Conditional Random Field. Landslides 2023, 20, 367–380. [Google Scholar] [CrossRef]
- Gokce, O.; Ozden, S.; Demir, A. Spatial and Statistical Distribution of Disasters in Türkiye, Disaster Information Inventory. Türkiye General Directorate of Disaster Works, Ankara. 2008. Available online: https://www.afad.gov.tr/kurumlar/AFAD.gov.tr/3491/xfiles/abep_kitap_matbaa_final_04122008_small.pdf (accessed on 18 May 2023).
- ASTM D1587/D1587M-15; Standard Practice for Thin-Walled Tube Sampling of Fine-Grained Soils for Geotechnical Purposes. The American Society for Testing and Materials: West Conshohocken, PA, USA, 2016.
- ASTM D422/D422-63; Standard Test Method for Particle-Size Analysis of Soils. The American Society for Testing and Materials: West Conshohocken, PA, USA, 2007.
- ASTM D4318/ASTM D4318-17e1; Standard Test Methods for Liquid Limit, Plastic Limit, and Plasticity Index of Soils. The American Society for Testing and Materials: West Conshohocken, PA, USA, 2018.
- Fratta, D.; Aguettant, J.; Roussel-Smith, L. Introduction to Soil Mechanics Laboratory Testing; CRC Press: Boca Raton, FL, USA, 2007. [Google Scholar] [CrossRef]
- ASTM D4767/D4767-11; Standard Test Method for Consolidated Undrained Triaxial Compression Test For Cohesive Soils. The American Society for Testing and Materials: West Conshohocken, PA, USA, 2020.
- ASTM D6836/D6836-16; Standard Test Methods for Determination of the Soil Water Chararcteristic Curve for Desorption Using a Hanging Column, Pressure Extractor, Chilled Mirror Hygrometer, or Centrifuge. The American Society for Testing and Materials: West Conshohocken, PA, USA, 2016.
- ASTM D7012/D7012-14e1; Standard Test Method for Compressive Strength and Elastic Moduli of Intact Rock Core Specimens under Varying States of Stress and Temperatures. The American Society for Testing and Materials: West Conshohocken, PA, USA, 2017.
- Fredlund, D.G.; Xing, A.; Huang, S. Predicting the Permeability Function for Unsaturated Soils Using the Soil-Water Characteristic Curve. Can. Geotech. J. 1994, 31, 533–546. [Google Scholar] [CrossRef] [Green Version]
- Genuchten, V.A.N. A Closed-Form Equation for Predicting the Hydraulic Conductivity of Unsaturated Soils 1. Soil Sci. Soc. Am. J. 1980, 44, 892–898. [Google Scholar] [CrossRef] [Green Version]
- Tay, Y.Y.; Stewart, D.I.; Cousens, T.W. Shrinkage and Desiccation Cracking in Bentonite-Sand Landfill Liners. Eng. Geol. 2001, 60, 263–274. [Google Scholar] [CrossRef]
- Li, J.H.; Zhang, L.M. Study of Desiccation Crack Initiation and Development at Ground Surface. Eng. Geol. 2011, 123, 347–358. [Google Scholar] [CrossRef]
- Fredlund, D.G.; Houston, S.L.; Nguyen, Q.; Fredlund, M.D. Moisture Movement Through Cracked Clay Soil Profiles. Geotech. Geol. Eng. 2010, 28, 865–888. [Google Scholar] [CrossRef]
- Li, J.H.; Zhang, L.M.; Li, X. Soil-Water Characteristic Curve and Permeability Function for Unsaturated Cracked Soil. Can. Geotech. J. 2011, 48, 1010–1031. [Google Scholar] [CrossRef]
- Wang, Y.; Li, J.H.; Zhang, L.M.; Li, X.; Cai, C.Z. Measuring Water Retention Curves for Rough Joints with Random Apertures. Geotech. Test. J. 2013, 36, 929–938. [Google Scholar] [CrossRef]
- Zornberg, J.G.; Kuhn, J.; Wright, S.G. Determination of Field Suction Values, Hydraulic Properties, and Shear Strength in High PI Clays; Center for Transportation Research Technical Report; The University of Texas: Austin, TX, USA, 2007; Report Number: 0-5202-1. [Google Scholar]
- Li, J.H.; Lu, Z.; Guo, L.B.; Zhang, L.M. Experimental Study on Soil-Water Characteristic Curve for Silty Clay with Desiccation Cracks. Eng. Geol. 2017, 218, 70–76. [Google Scholar] [CrossRef]
- Geoslope International Ltd. Geostudio 2018 R2 Version. Available online: https://www.geoslope.com/ (accessed on 20 May 2019).
- Vanapalli, S.K.; Fredlund, D.G.; Pufahl, D.E.; Clifton, A.W. Model for the Prediction of Shear Strength with Respect to Soil Suction. Can. Geotech. J. 1996, 33, 379–392. [Google Scholar] [CrossRef]
- Hoek, E.; Brown, E.T. The Hoek–Brown Failure Criterion and GSI—2018 Edition. J. Rock Mech. Geotech. Eng. 2019, 11, 445–463. [Google Scholar] [CrossRef]
- Hoek, E. Practical Rock Engineering. Available online: https://www.rocscience.com/assets/resources/learning/hoek/Practical-Rock-Engineering-Full-Text.pdf (accessed on 28 April 2023).
- Daniel, D.E. Predicting Hydraulic Conductivity of Clay Liners. J. Geotech. Eng. 1984, 110, 285–300. [Google Scholar] [CrossRef]
- Shaker, A.A.; Dafalla, M.; Al-Mahbashi, A.M.; Al-Shamrani, M.A. Predicting Hydraulic Conductivity for Flexible Wall Conditions Using Rigid Wall Permeameter. Water 2022, 14, 286. [Google Scholar] [CrossRef]
- Aubeny, C.; Lytton, R. Long-Term Strength of Compacted High-Pi Clays; Texas Department of Transportation Technical Report; Texas Transportation Institute, Texas A & M University System: Austin, TX, USA, 2003; Report Number: 2100-1. [Google Scholar]
- Zhan, T.L.T.; Ng, C.W.W.; Fredlund, D.G. Field Study of Rainfall Infiltration into a Grassed Unsaturated Expansive Soil Slope. Can. Geotech. J. 2007, 44, 392–408. [Google Scholar] [CrossRef] [Green Version]
- Cascini, L.; Sorbino, G.; Cuomo, S.; Ferlisi, S. Seasonal Effects of Rainfall on the Shallow Pyroclastic Deposits of the Campania Region (Southern Italy). Landslides 2014, 11, 779–792. [Google Scholar] [CrossRef]
- Rahardjo, H.; Leong, E.C.; Deutscher, M.S.; Gasmo, J.M.; Tang, S.K. Rainfall-Induced Slope Failures; NTU-PWD Geotechnical Research Centre, Nanyang Technological University: Singapore, 2000. [Google Scholar]
- Collins, B.D.; Znidarcic, D. Stability Analyses of Rainfall Induced Landslides. J. Geotech. Geoenviron. Eng. 2004, 130, 362–372. [Google Scholar] [CrossRef]
- Fannin, R.J.; Jaakkola, J. Hydrological Response of Hillslope Soils above a Debris-Slide Headscarp. Can. Geotech. J. 1999, 36, 1111–1122. [Google Scholar] [CrossRef]
- Johnson, K.A.; Sitar, N. Hydrologic Conditions Leading to Debris-Flow Initiation. Can. Geotech. J. 1990, 27, 789–801. [Google Scholar] [CrossRef]
- Keefer, D.K.; Wilson, R.C.; Mari, R.K.; Brabb, E.E.; Iii, W.M.B.; Ellen, S.D.; Harp, E.L.; Wieczorek, G.F.; Alger, C.S.; Zatkint, R.S. Real-Time Landslide Warning during Heavy Rainfall. Science 1987, 238, 921–925. [Google Scholar] [CrossRef] [PubMed]
- Premchitt, J.; Brand, E.W.; Chen, P.Y.M. Rain-Induced Landslides in Hong Kong, 1972–1992. Asia Eng. 1994, 1994, 43–51. [Google Scholar]
- Ortigao, B.; Justi, M.G. Rio-Watch: The Rio de Janeiro Landslide Alarm System. Geotech. News 2004, 22, 28–31. [Google Scholar]


| Borehole No | Depth (m) | Liquid Limit (%) | Plastic Limit (%) | Plasticity Index (%) | Soil Classification (USCS) |
|---|---|---|---|---|---|
| BH1 | 1.50–6.50 | 36–42 | 22–25 | 13–18 | CL |
| BH2 | 1.50–3.95 | 33–41 | 19–26 | 13–15 | CL, ML |
| BH3 | 1.50–3.95 | 40–54 | 24–29 | 15–30 | CL, CH, ML |
| α | n | m | Ѳs (%) | R2 | |
|---|---|---|---|---|---|
| BH1-UD-(1.50–2.00) | 0.016 | 2.997 | 0.059 | 38.2 | 0.996 |
| BH1-UD-(3.00–3.50) | 0.015 | 3.0 | 0.141 | 39.4 | 0.996 |
| BH1-UD-(6.00–6.50) | 0.012 | 2.995 | 0.244 | 41.3 | 0.998 |
| BH2-UD-(1.50–2.00) | 0.012 | 3.0 | 0.217 | 45.2 | 0.998 |
| BH2-UD-(3.00–3.50) | 0.014 | 2.982 | 0.063 | 46.6 | 0.998 |
| BH3-UD-(1.50–2.00) | 0.001 | 0.844 | 1.370 | 37.6 | 0.995 |
| BH3-UD-(3.00–3.50) | 0.014 | 2.956 | 0.194 | 42.0 | 0.997 |
| BSK1-UD-(0.80) | 0.013 | 3.0 | 0.240 | 40.9 | 0.997 |
| BSK2-UD-(0.60) | 0.014 | 3.0 | 0.187 | 41.6 | 0.997 |
| BSK2-UD-(1.05) | 0.014 | 2.962 | 0.113 | 35.5 | 0.998 |
| BSK2-UD-(1.63) | 0.013 | 3.0 | 0.206 | 40.5 | 0.998 |
| Average SWCC | 0.015 | 3.045 | 0.134 | 40.8 | - |
| Borehole No | Rock Type | Depth (m) | Natural Unit Weight (kN/m3) | Uniaxial Compression Strength (MPa) |
|---|---|---|---|---|
| BH3 | Siltstone/Claystone | 15.50 | 22.58 | 4.03 |
| BH2 | Sandstone | 12.50 | 25.40 | 57.97 |
| BH2 | Siltstone/Claystone | 6.50 | 22.73 | 4.88 |
| Instrument | Measurements | Measurement Range | Resolution | Source |
|---|---|---|---|---|
| EC-5 soil water content sensors | Volumetric water content | 0–60% | 0.001 m3/m3 | Meter Group Inc. Pullman, WA, USA |
| MPS-6 water-potential sensors | Matric suction | 9 kPa–100,000 kPa | 0.1 kPa | Meter Group Inc. Pullman, WA, USA |
| ECRN-100 rain gauge | Rain depth | N/A | 0.2 mm | Meter Group Inc. Pullman, WA, USA |
| TD-Diver pressure sensors | Water pressure + Atmospheric pressure | 0–50 m H2O | 1 cm H2O | Van Essen Inst. Delft, The Netherlands |
| Baro-Diver atmospheric pressure sensor | Atmospheric pressure | 0–1.5 m H2O | 0.1 cm H2O | Van Essen Inst. Delft, The Netherlands |
| EM-60 data logger | Input port: six, each supporting meter analog, digital, or pulse sensors | 1 min. to 12 h. | N/A | Meter Group Inc. Pullman, WA, USA |
| Depth (m) | Dry Period | Wet Period | ||
|---|---|---|---|---|
| Matric Suction (kPa) | Groundwater Level (m) | Matric Suction (kPa) | Groundwater Level (m) | |
| 0.58 | 60 | 3.49 | 0 | 2.21 |
| 1.10 | 60 | 0 | ||
| 1.63 | 15 | 0 | ||
| Parameters | Soil |
|---|---|
| Material Model | Mohr-Coulomb |
| c′ (kPa) | 8 |
| 21 | |
| γ (kN/m3) | 20 |
| SWCC | Figure 6 (average SWCC) |
| Parameters | Rock |
|---|---|
| Material Model | Hoek Brown |
| γ (kN/m3) | 23 |
| (°) | 0 |
| GSI | 30 |
| D | 0 |
| mi | 6.65 |
| (MPa) | 9.81 |
Disclaimer/Publisher’s Note: The statements, opinions and data contained in all publications are solely those of the individual author(s) and contributor(s) and not of MDPI and/or the editor(s). MDPI and/or the editor(s) disclaim responsibility for any injury to people or property resulting from any ideas, methods, instructions or products referred to in the content. |
© 2023 by the authors. Licensee MDPI, Basel, Switzerland. This article is an open access article distributed under the terms and conditions of the Creative Commons Attribution (CC BY) license (https://creativecommons.org/licenses/by/4.0/).
Share and Cite
Taskiran, T.; Alli, S.; Yilmaz, Y. Hydro–Mechanical Behaviour of a Rainfall-Induced Landslide by Instrumental Monitoring: Landslide–Rainfall Threshold of the Western Black Sea Bartin Region of Türkiye. Appl. Sci. 2023, 13, 8703. https://doi.org/10.3390/app13158703
Taskiran T, Alli S, Yilmaz Y. Hydro–Mechanical Behaviour of a Rainfall-Induced Landslide by Instrumental Monitoring: Landslide–Rainfall Threshold of the Western Black Sea Bartin Region of Türkiye. Applied Sciences. 2023; 13(15):8703. https://doi.org/10.3390/app13158703
Chicago/Turabian StyleTaskiran, Taha, Serdar Alli, and Yuksel Yilmaz. 2023. "Hydro–Mechanical Behaviour of a Rainfall-Induced Landslide by Instrumental Monitoring: Landslide–Rainfall Threshold of the Western Black Sea Bartin Region of Türkiye" Applied Sciences 13, no. 15: 8703. https://doi.org/10.3390/app13158703