Article

Design and Experimental Validation of a Scaled Test Bench for the Emulation of a Hybrid Fuel Cell Powertrain for Agricultural Tractors

Department of Mechanical and Aerospace Engineering, Politecnico di Torino, Corso Duca degli Abruzzi 24, 10129 Torino, Italy
*
Author to whom correspondence should be addressed.
These authors contributed equally to this work.
Appl. Sci. 2023, 13(15), 8582; https://doi.org/10.3390/app13158582
Submission received: 22 May 2023 / Revised: 24 July 2023 / Accepted: 24 July 2023 / Published: 25 July 2023
(This article belongs to the Special Issue Novel Developments in Agricultural Machinery and Technology)

Abstract

:
Hybrid fuel cell powertrains are a promising strategy to reduce the environmental impact of vehicles and non-road mobile machinery. To preserve the state-of-health of fuel cells, an energy storage system with sufficient power capacity, such as ultra-capacitors or batteries, should be introduced in the system to help the fuel cell during sudden and abrupt changes in power demands. However, the presence of two or more energy sources necessitates the development of an energy management strategy. The energy management strategy should properly split the power request between the different energy sources. In this paper, the design and the experimental validation of a scaled test bench for the emulation of a fuel cell/battery powertrain for a vehicular application is presented. The fuel cell is emulated through an analogically controlled DC power source that reproduces its real voltage–current curve. To split the power between the emulated fuel cell and the batteries, controlled DC-DC is used and a simple energy management strategy based on a proportional-integral controller is developed. The external load is reproduced using a load unit composed of a programmable electronic load and a power supply. Experimental tests are performed to evaluate the system behaviour and to characterize its main components. The experimental results show that the system successfully emulates the powertrain in accordance with the proposed energy management strategy.

1. Introduction

Electrification has become one of the most-chosen paths to limit the air pollution derived from vehicles. As stated in [1,2], electric and hybrid powertrains allow for a reduction in the environmental impact of vehicles on climate change and global warming. Recently, the increasing demand for more-efficient and less-polluting vehicles has also involved the sector of non-road mobile machinery (NRMM) [3,4,5,6]. Among NRMM, agricultural tractors play an important role since they are a key element in the food supply chain. To reduce the impact of these vehicles and to be compliant with the increasingly stringent regulations, different strategies have been proposed, analysed and evaluated by studies available in the literature. Apart from electrification, alternative possible paths to follow are to adopt exhaust gas aftertreatment systems [7] or to use biofuels, such as biodiesel and biogas [8,9], instead of traditional diesel. However, these strategies do not completely overcome the problem: the adoption of complex and bulky exhaust gas aftertreatment systems is often limited by the efficiency of the system and by on-board space availability, while the use of biofuels could led to an increase in emission levels of certain chemical species. Thus, other studies focused on the hybridization of tractor powertrains [10,11,12], which allows for downsizing of the thermal engine and show promising results in terms of fuel savings and efficiency improvements. However, these studies focused on hybrid architectures in which there is an internal combustion engine; therefore, the vehicle still produces harmful products deriving from the combustion process. In this context, fuel cell (FC) vehicles have gained a growing interest because they locally produce zero emissions and their refuelling time is comparable to that of a conventional powertrain with an internal combustion engine [13]. As a consequence, several studies have been carried out regarding the development and the analysis of fuel cell powertrains, including in passenger cars, light vehicles, trucks and off-road vehicles [14,15,16,17,18,19,20,21,22,23]. In particular, off-road vehicles and NRMM may require high operational time that, considering actual state-of-the-art battery technology, may not be compatible with pure battery electric vehicles due to high charging time and low endurance. On the contrary, fuel cell powertrains could be an alternative that at the same time meets the advantages of having no combustion processes, thus zero tank-to-wheel emissions, and high productivity [24]. However, to properly evaluate the environmental impact of fuel cell powertrains, the various hydrogen production methods should be taken into account using a life-cycle approach and exergy-based analysis [25,26,27], giving particular attention to innovative, less-pollutant and more-efficient processes [28,29]. In order to avoid fast degradation, fuel cells alone cannot follow the almost instantaneous changes in power demands that are typical of a vehicular application; therefore, other on-board energy sources, such as batteries and ultra-capacitors, must be introduced [30,31]. Thus, technological efforts are also being carried out to try to improve these additional on-board power sources that are necessary for the optimal operation of a fuel-cell-powered vehicle [32]. The introduction of one or more additional power sources leads to the necessary development of a proper energy management strategy (EMS) that determines the power split among the different sources [33,34]. The development of the EMS is crucial for the optimal operation of the fuel cell hybrid power system [35,36,37]. With a view of analysing and optimizing the EMS of a hybrid fuel cell powertrain, the development of a scaled test bench for experimental measurements is an effective strategy. Vural et al. [38] tested four hybrid fuel cell powertrain configurations with different batteries, supercapacitors and power converter combinations on a test bench. As for the power sources, the experimental setup consisted of a 1.2 kW air-cooled proton-exchange membrane fuel cell system, two series-connected valve-regulated lead acid (VRLA) batteries and four series-connected ultracapacitor modules. To simulate the power demand, a DC load was used, while for emulating the braking operation, a motor/generator unit was exploited. Wang et al. [39] developed an experimental setup to evaluate the behaviour of a battery/fuel cell hybrid powertrain and a battery/supercapacitor/fuel cell hybrid powertrain, applying an EMS based on a finite state machine. Xun et al. [40] experimentally investigated the behaviour of a fuel cell/supercapacitor hybrid system under an adaptive power split control strategy. Iqbal et al. [41] explored a composite cost-optimal energy management strategy based on a load-following control for a fuel cell/battery powertrain. The EMS principle was to split the power among the two power sources such that the lower frequency part of the power demand was handled by the FC, while the higher frequency part was followed by the battery pack. Moreover, the EMS took into account both hydrogen consumption and source ageing to optimize the power distribution. For the experimental tests, a test bench was developed. In this case, the fuel cell was emulated by a programmable DC power supply, while on the load side, an electronic load was employed. An Arduino was used to collect data from the sensors in the power stage, to communicate with a personal computer and to control the DC-DC converter according to the EMS. Graf et al. [
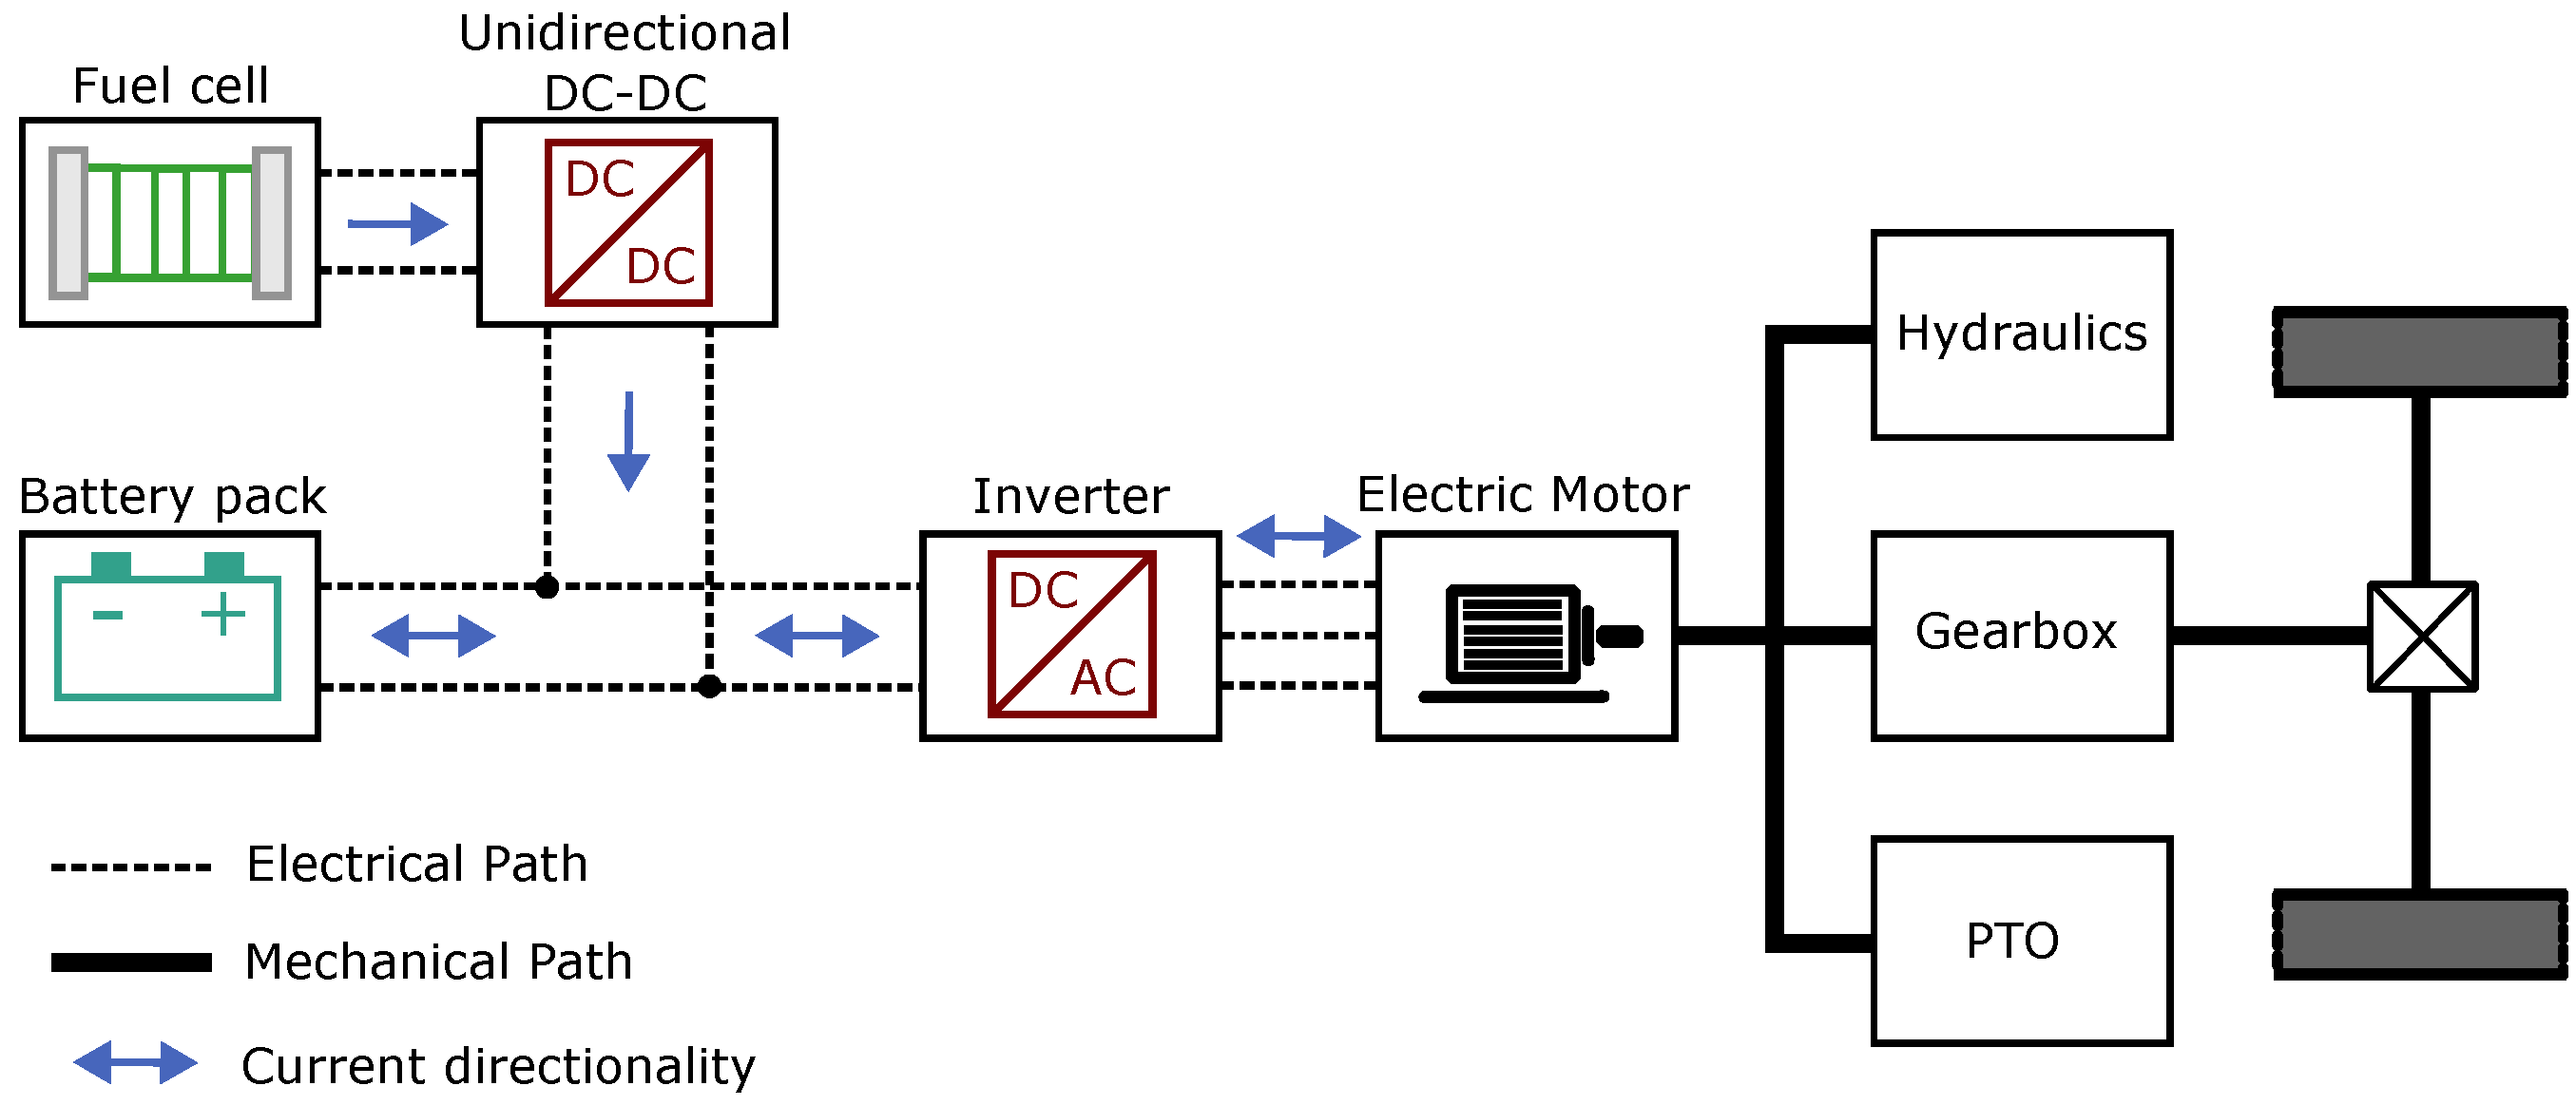
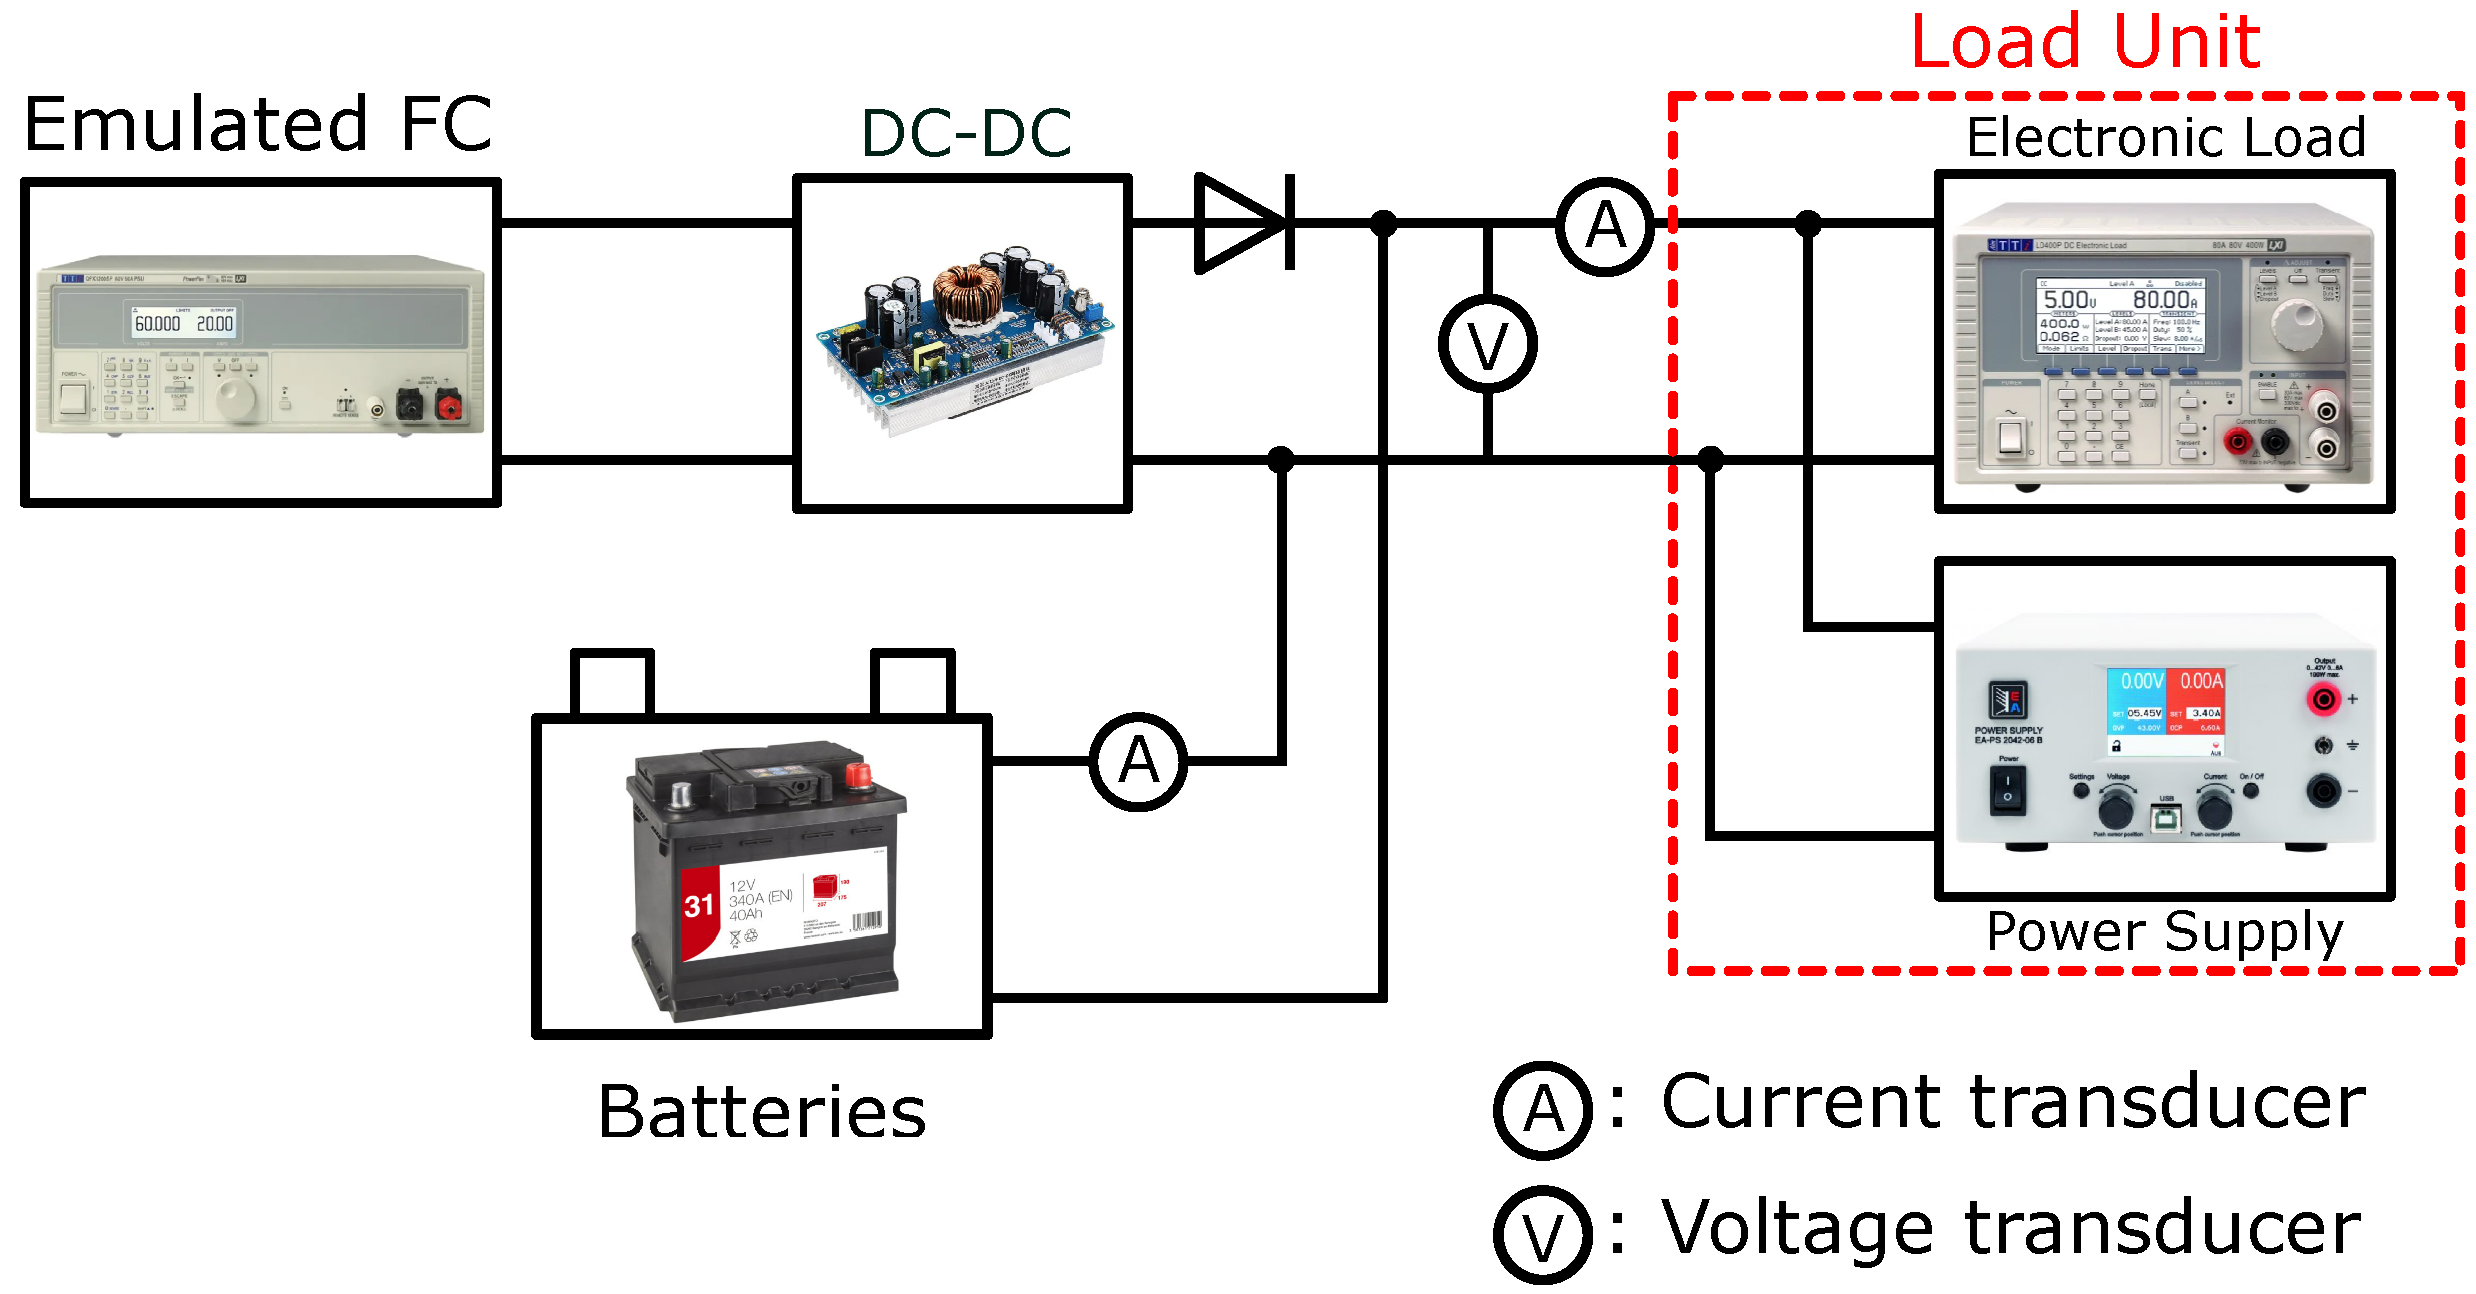
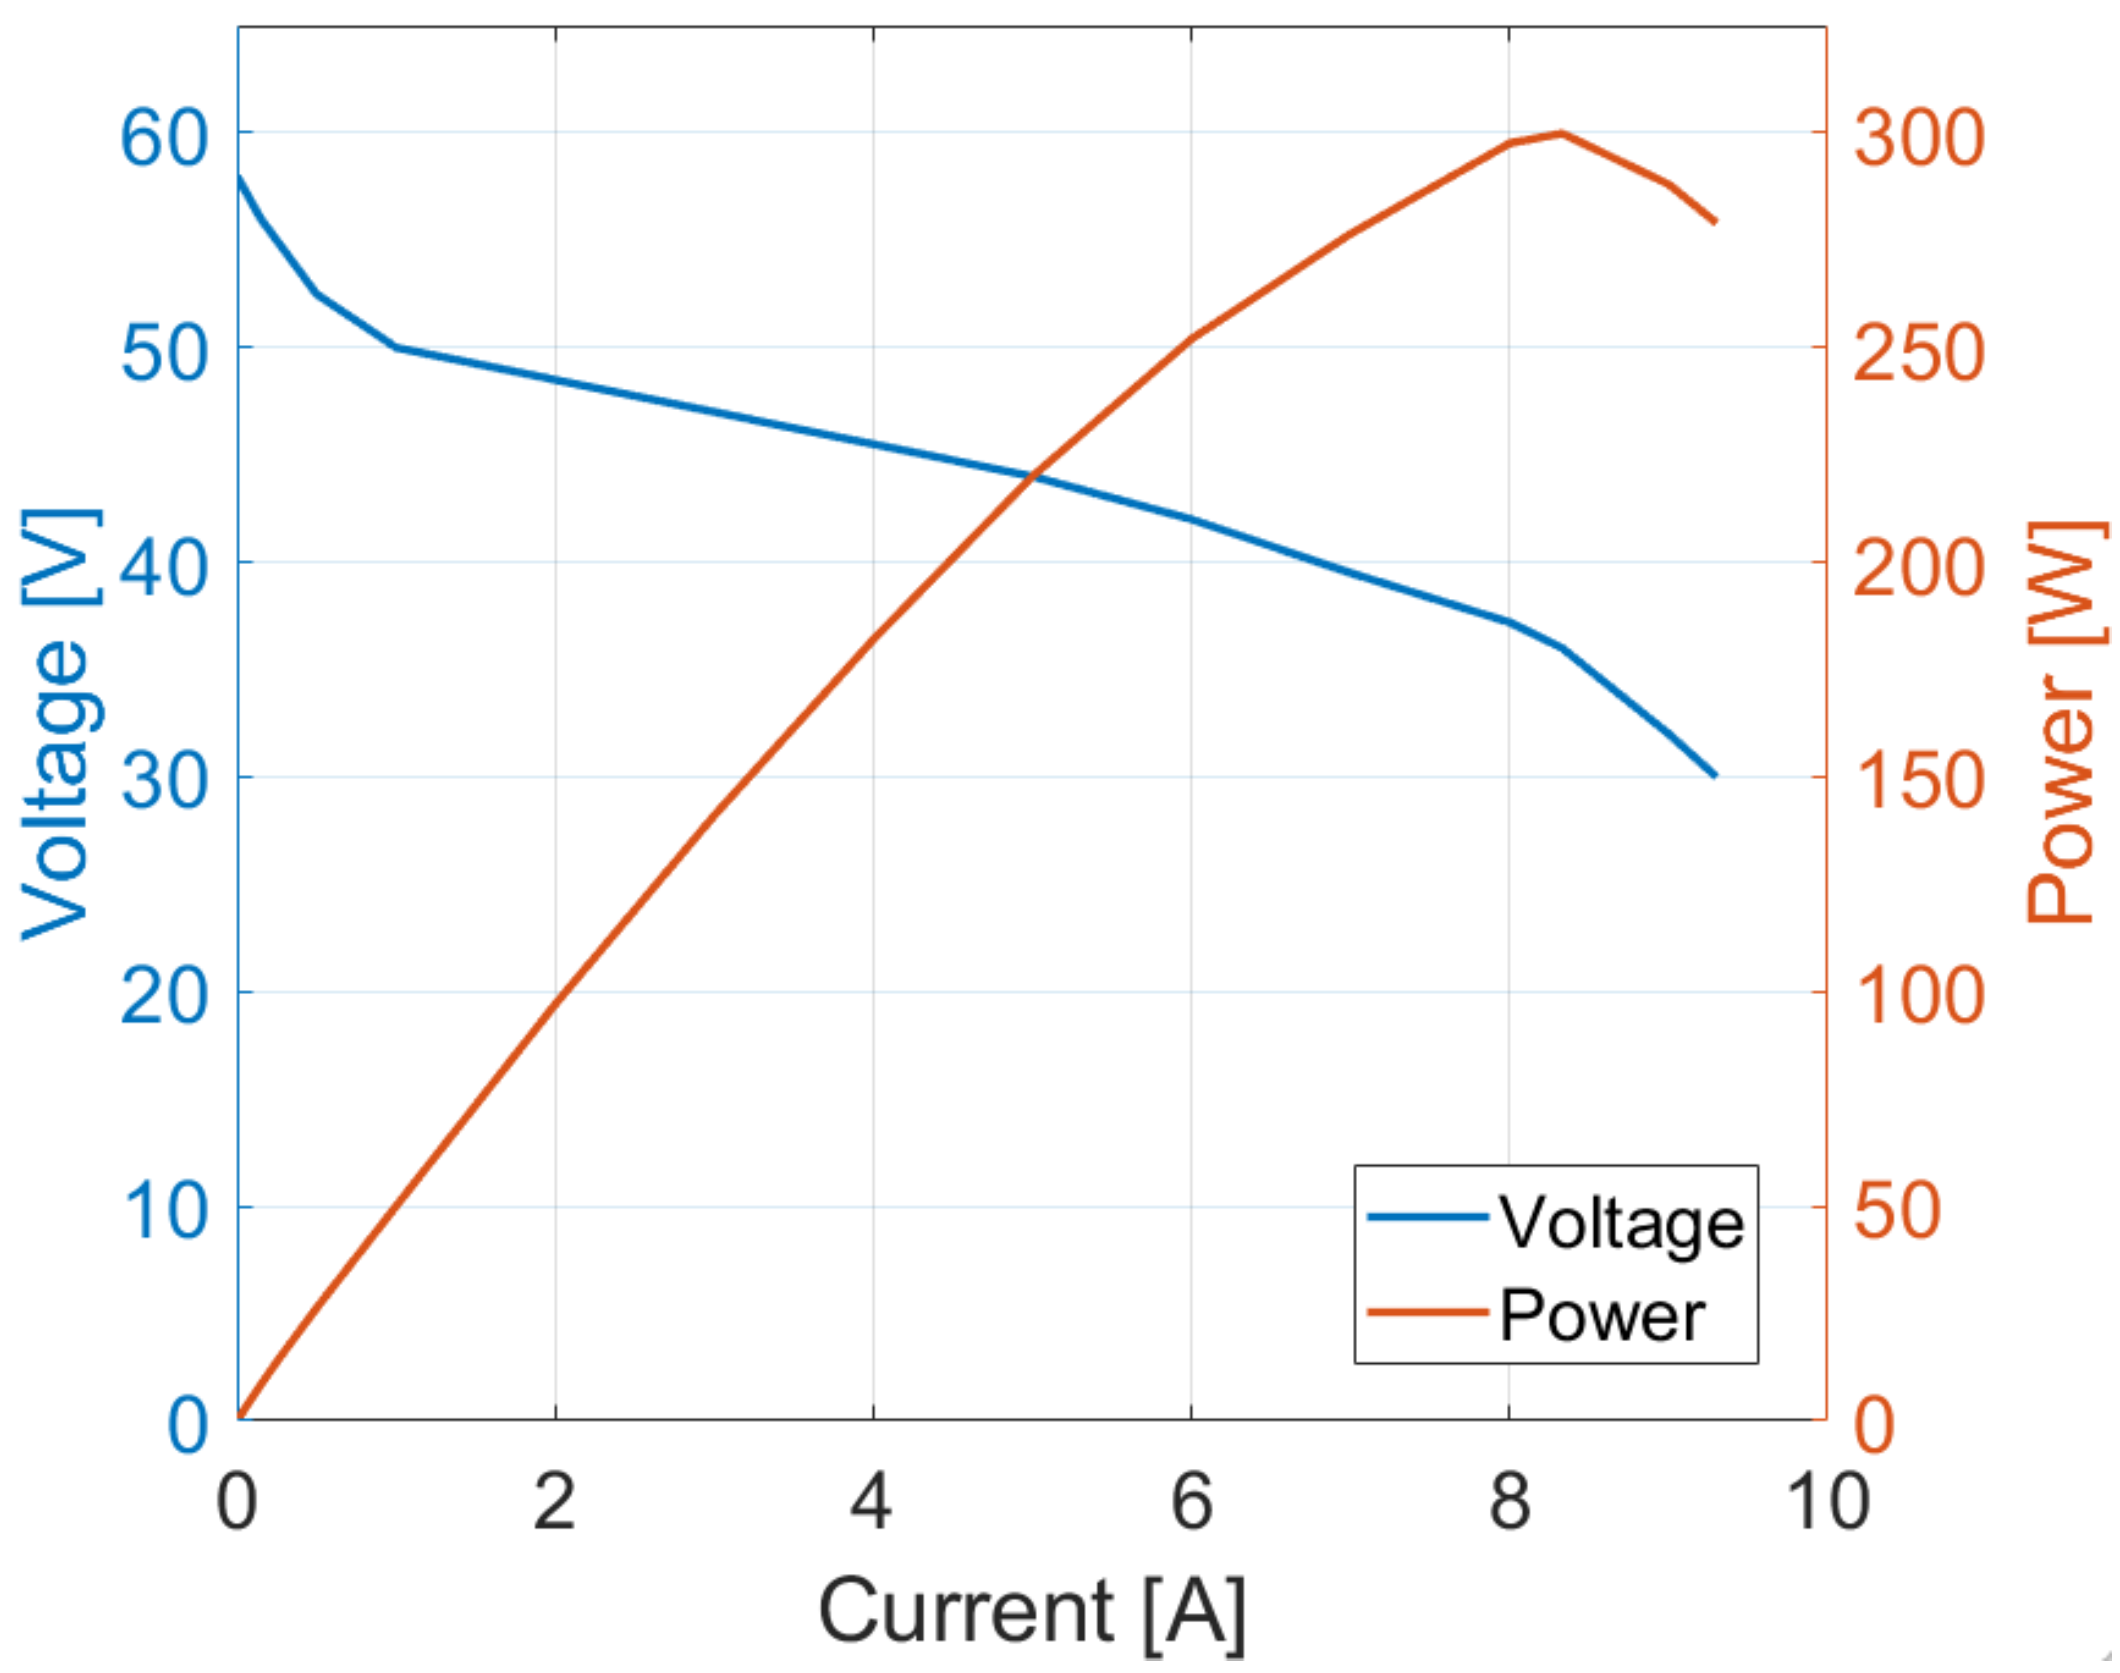
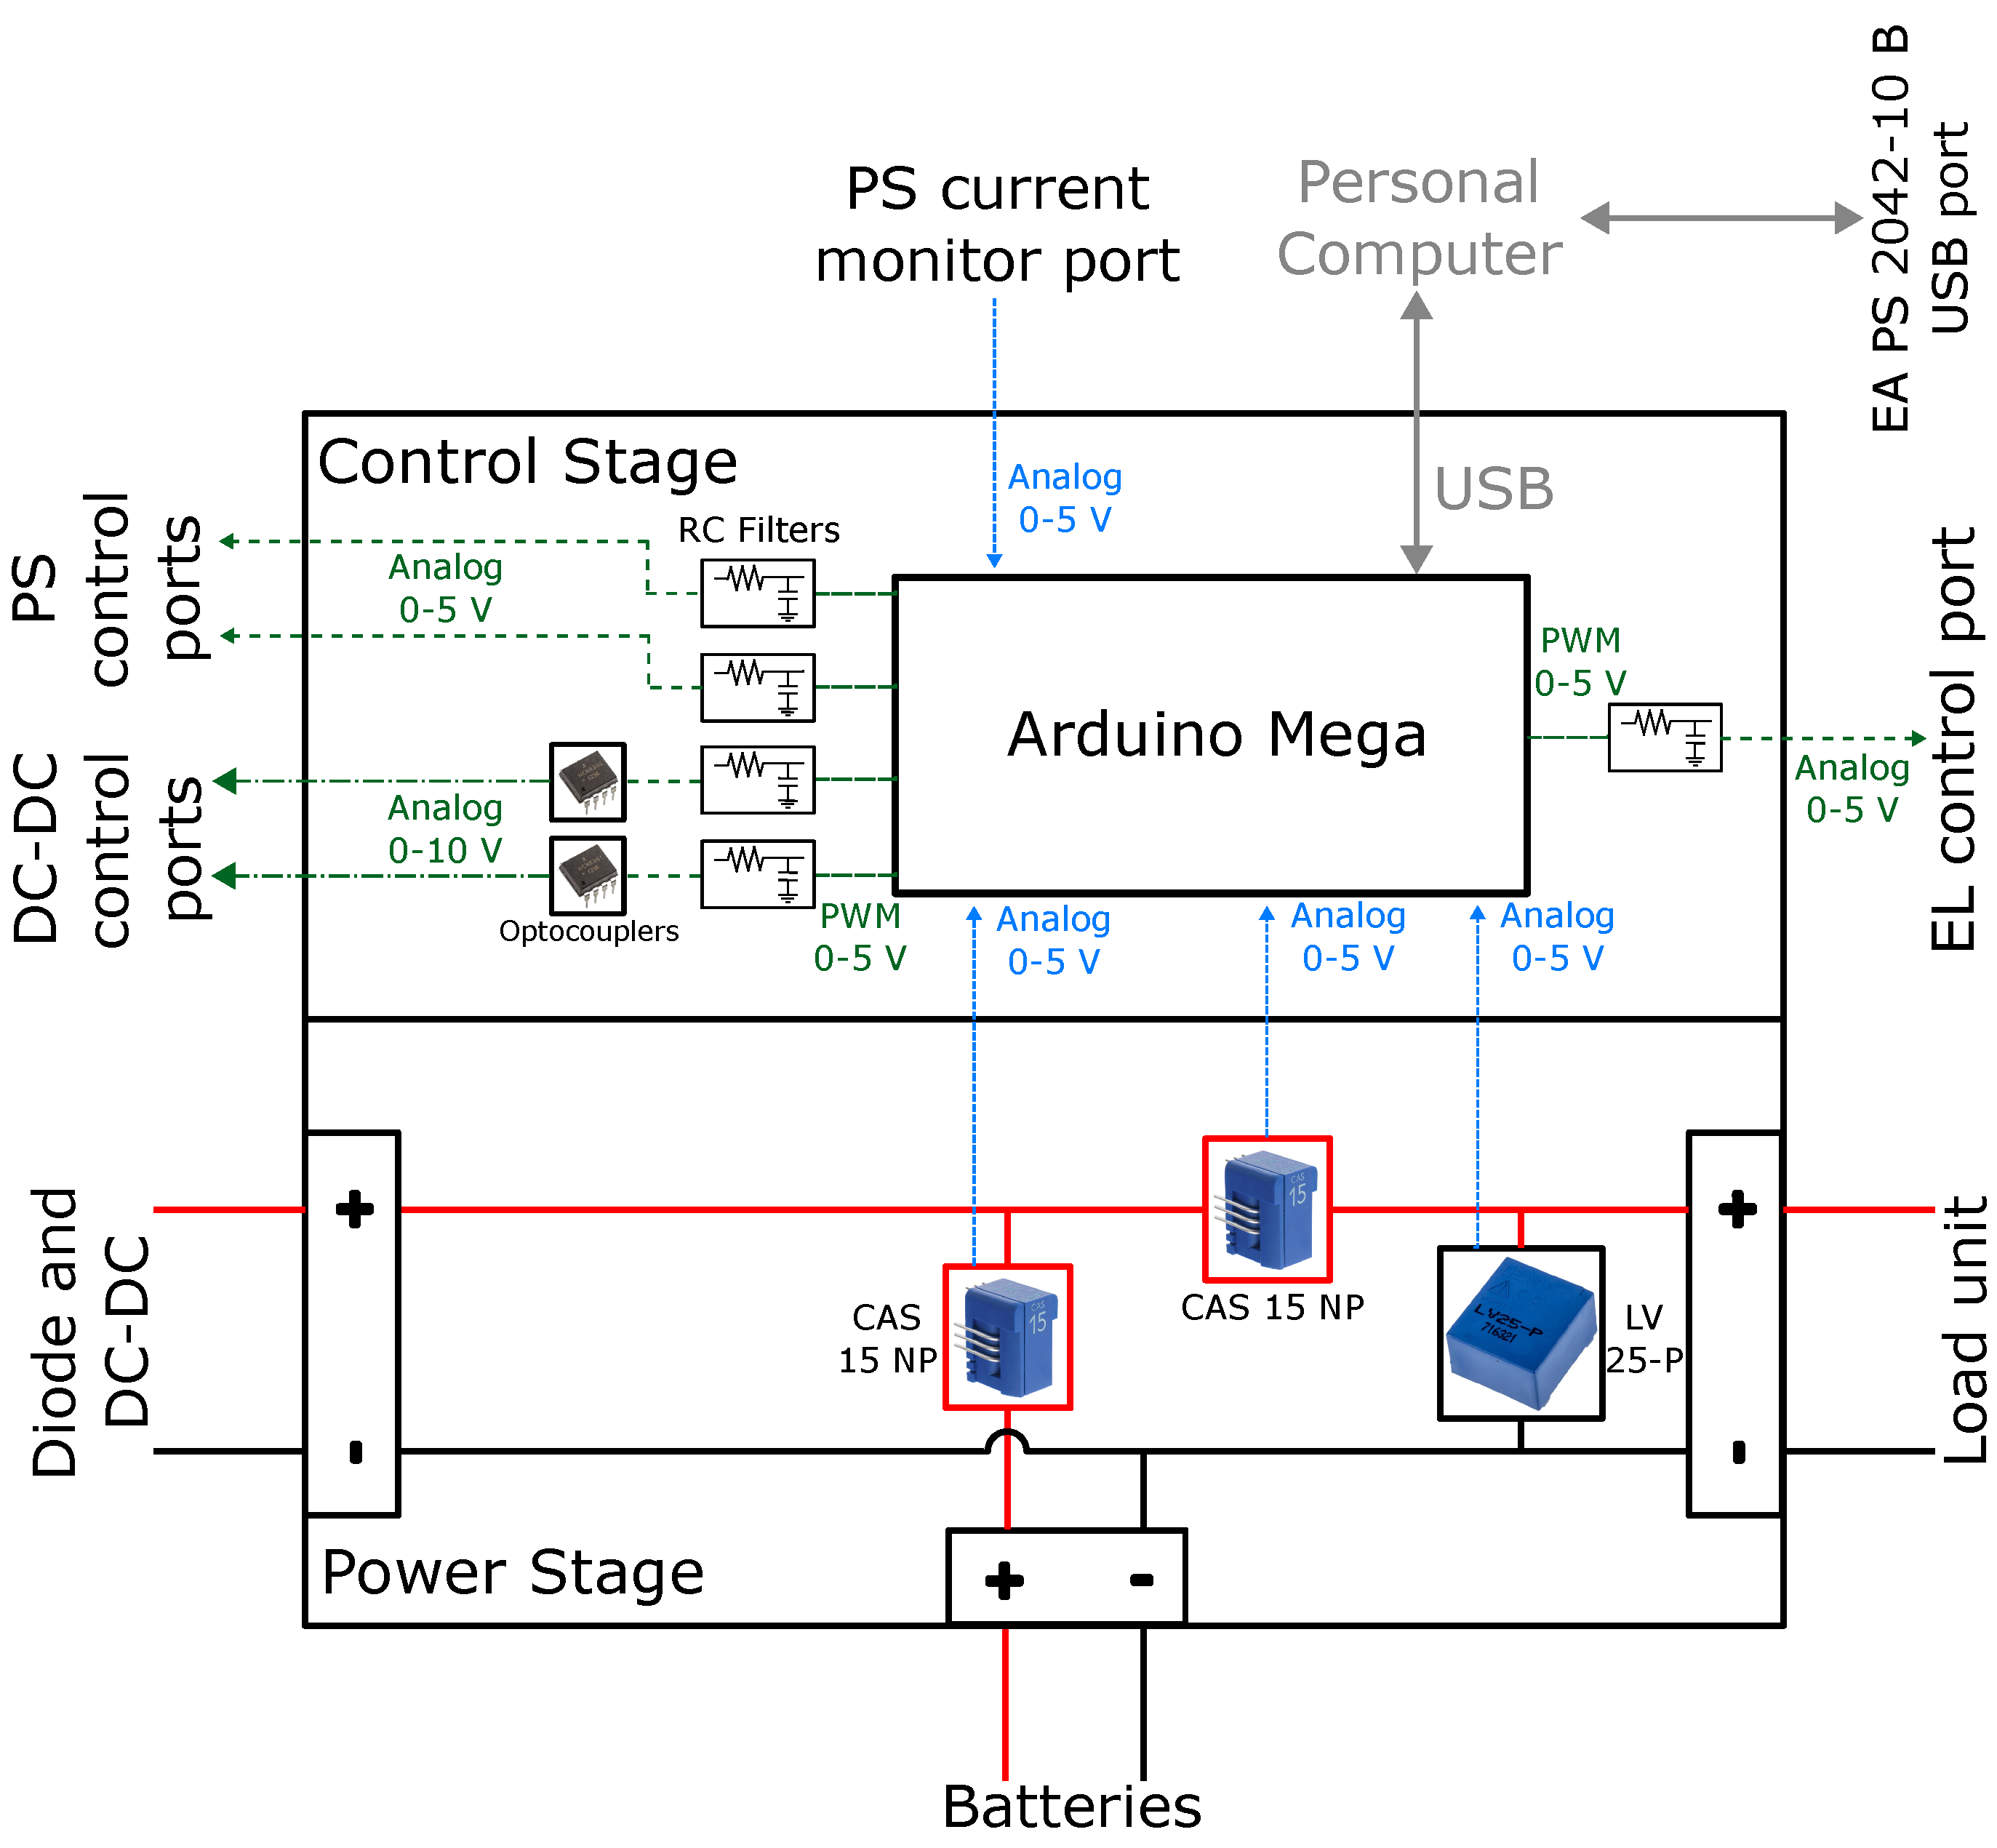
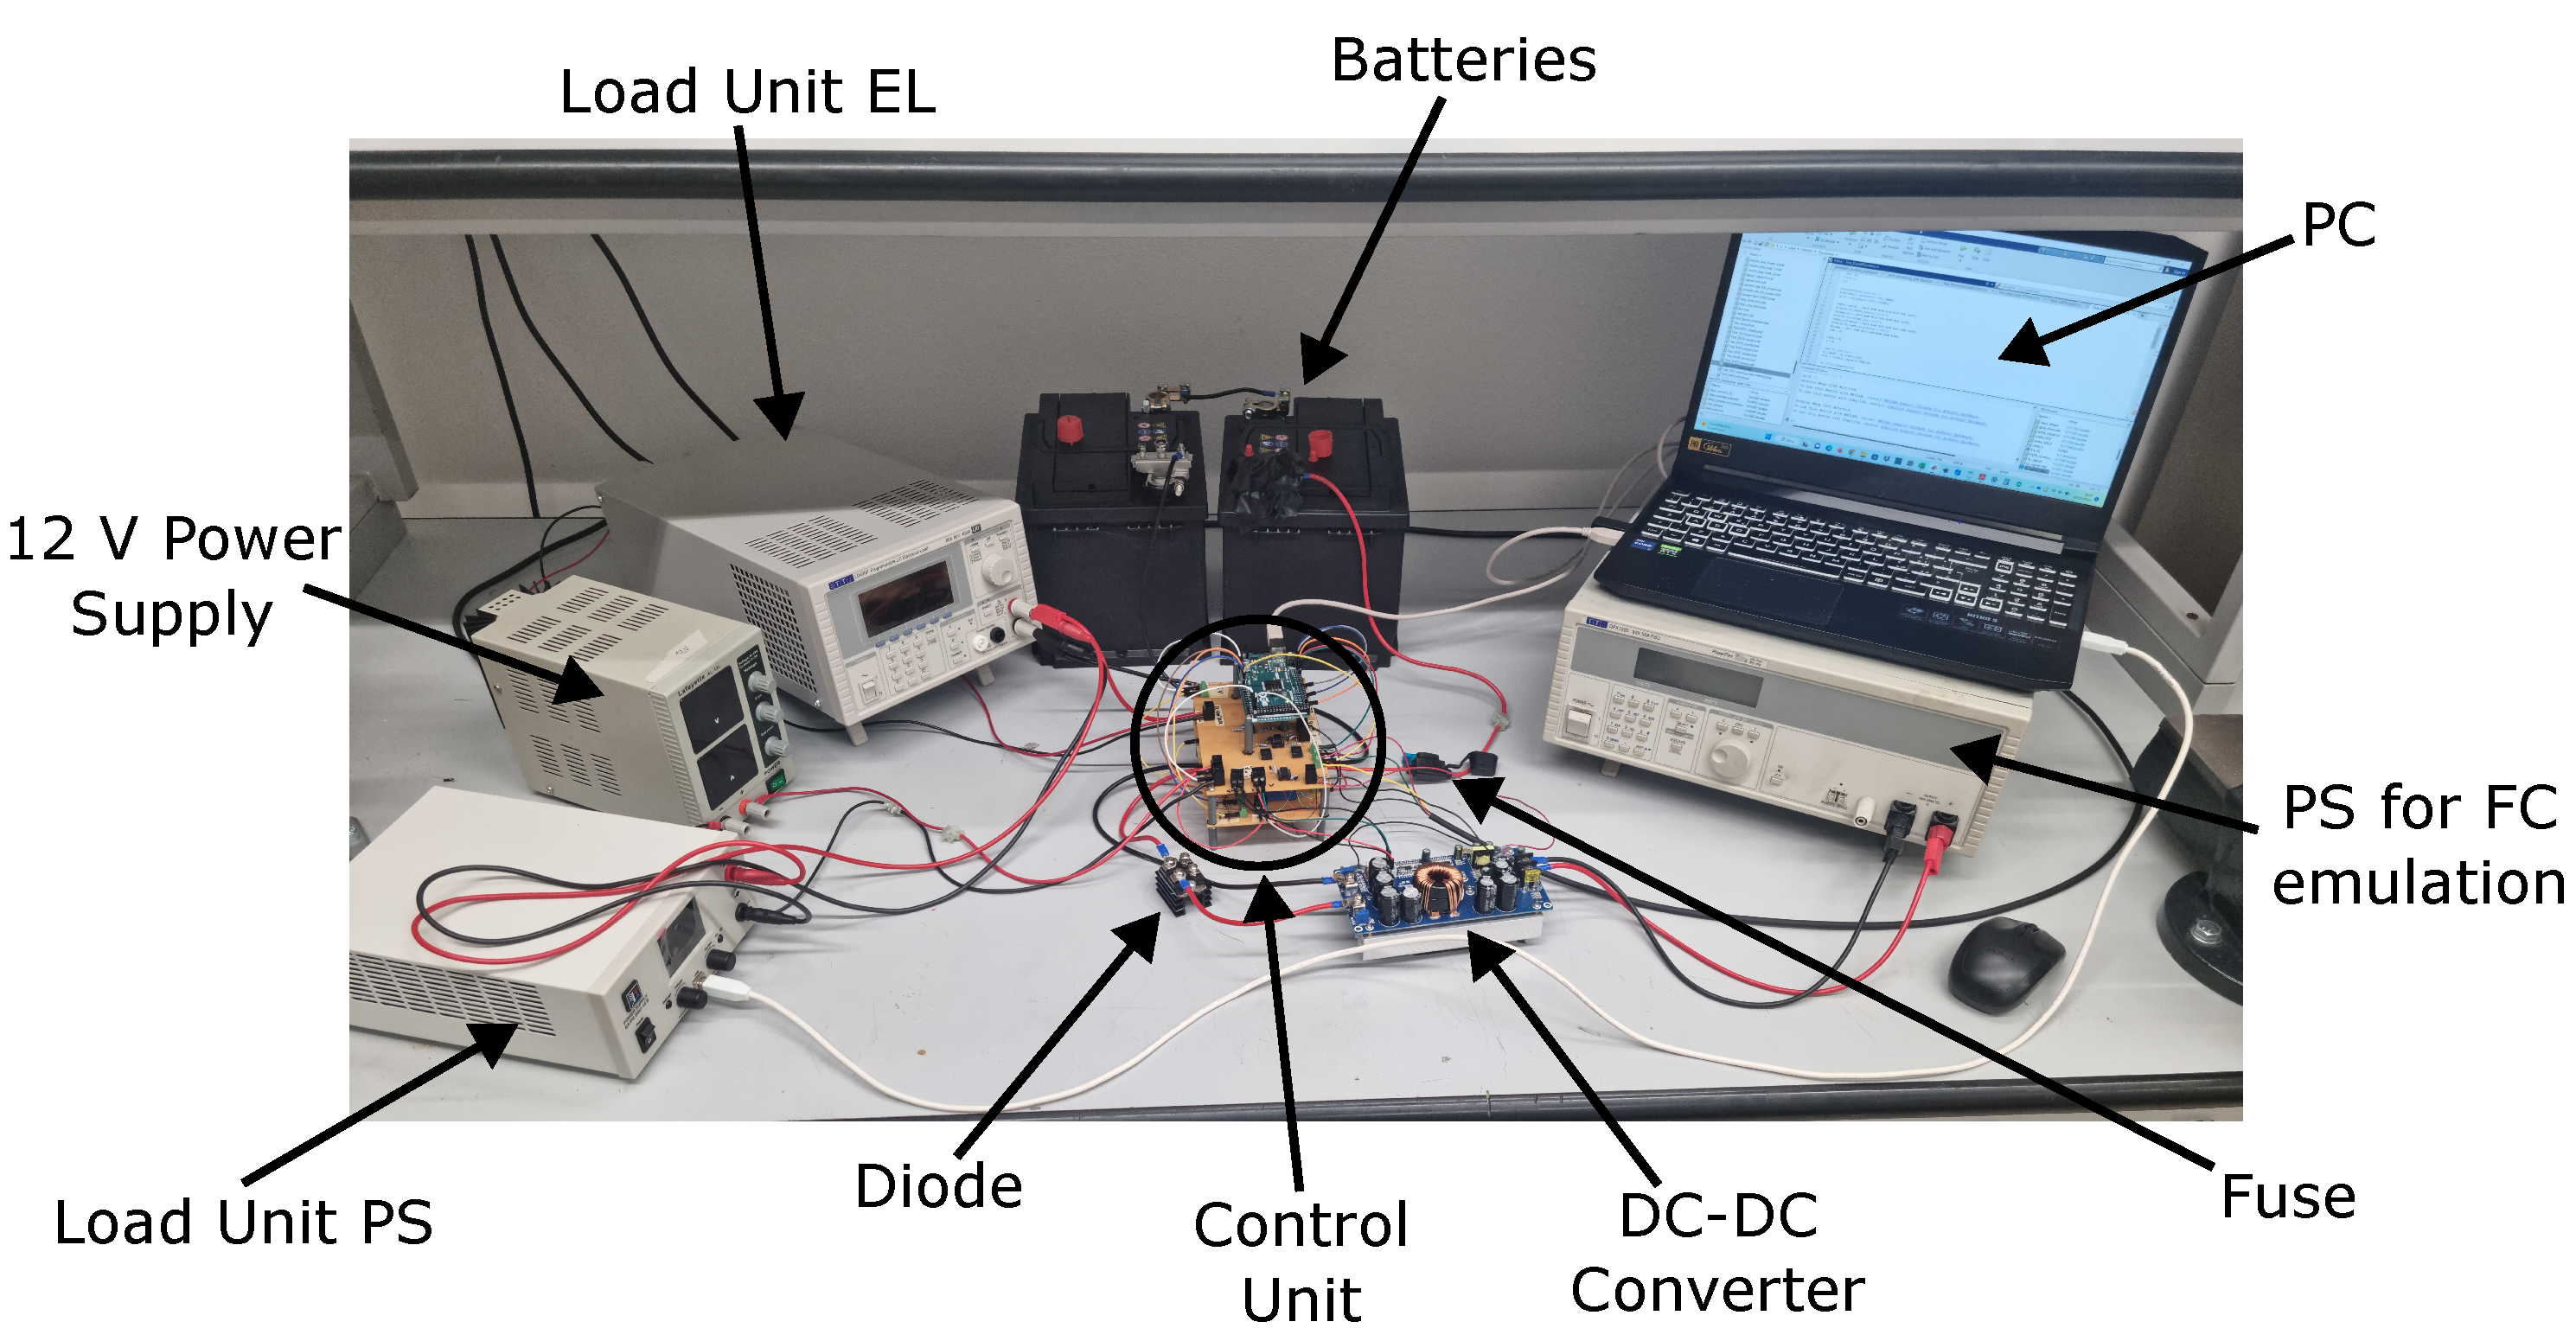
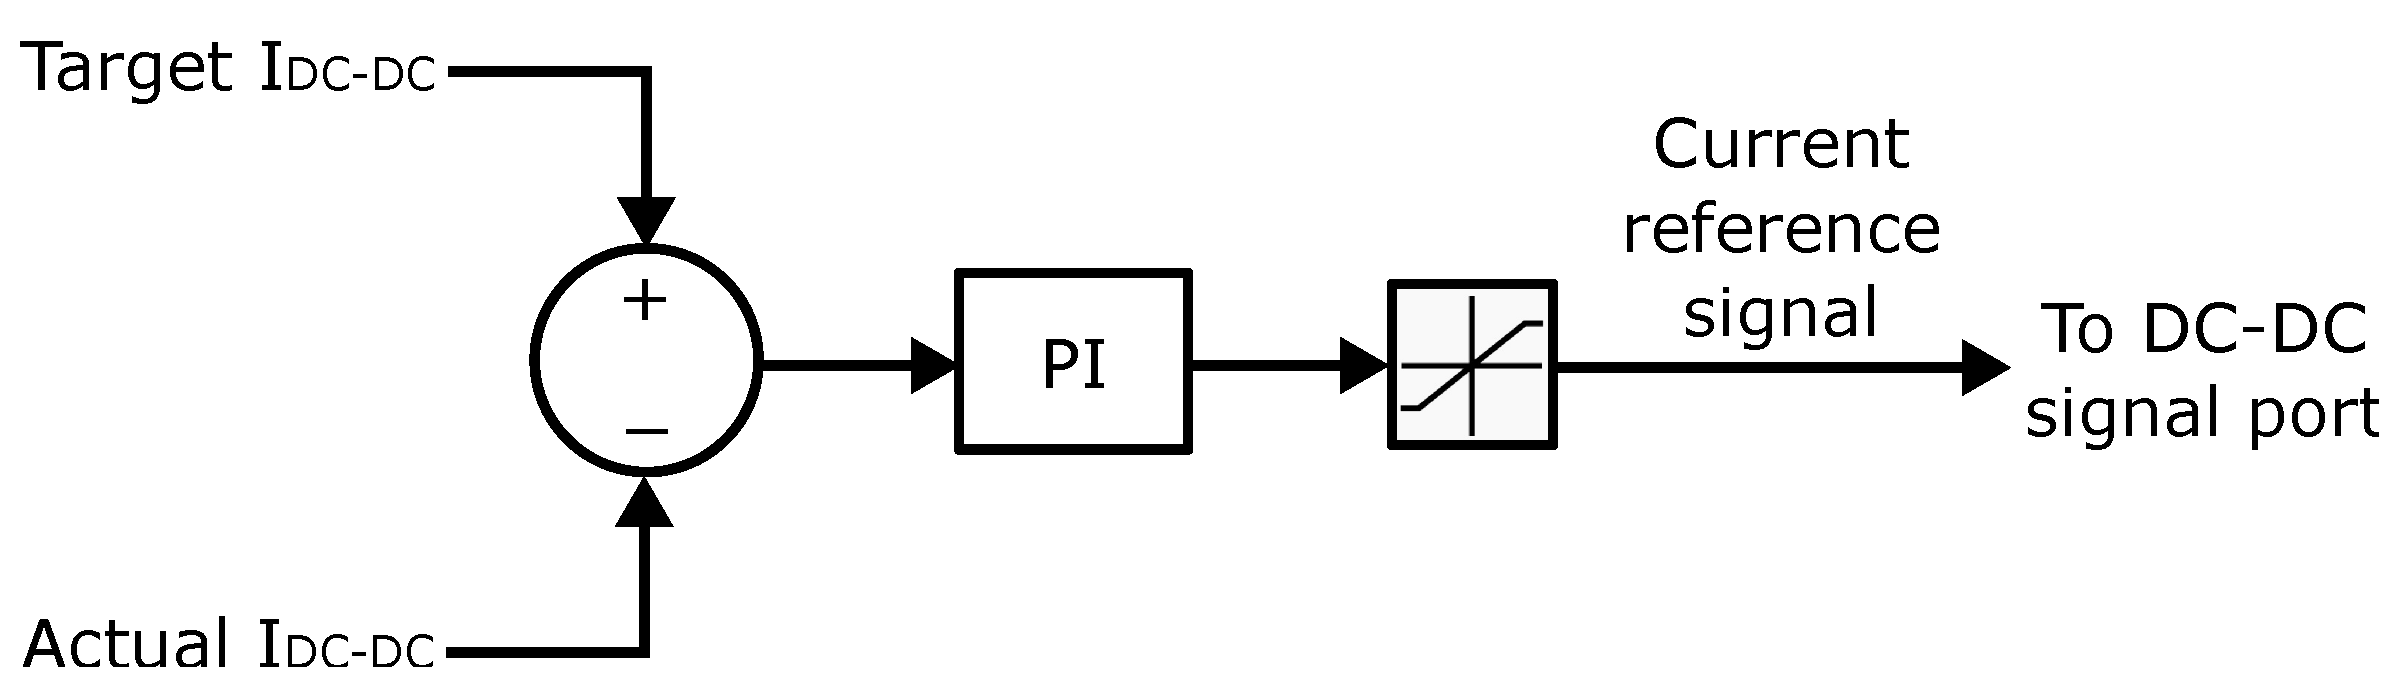
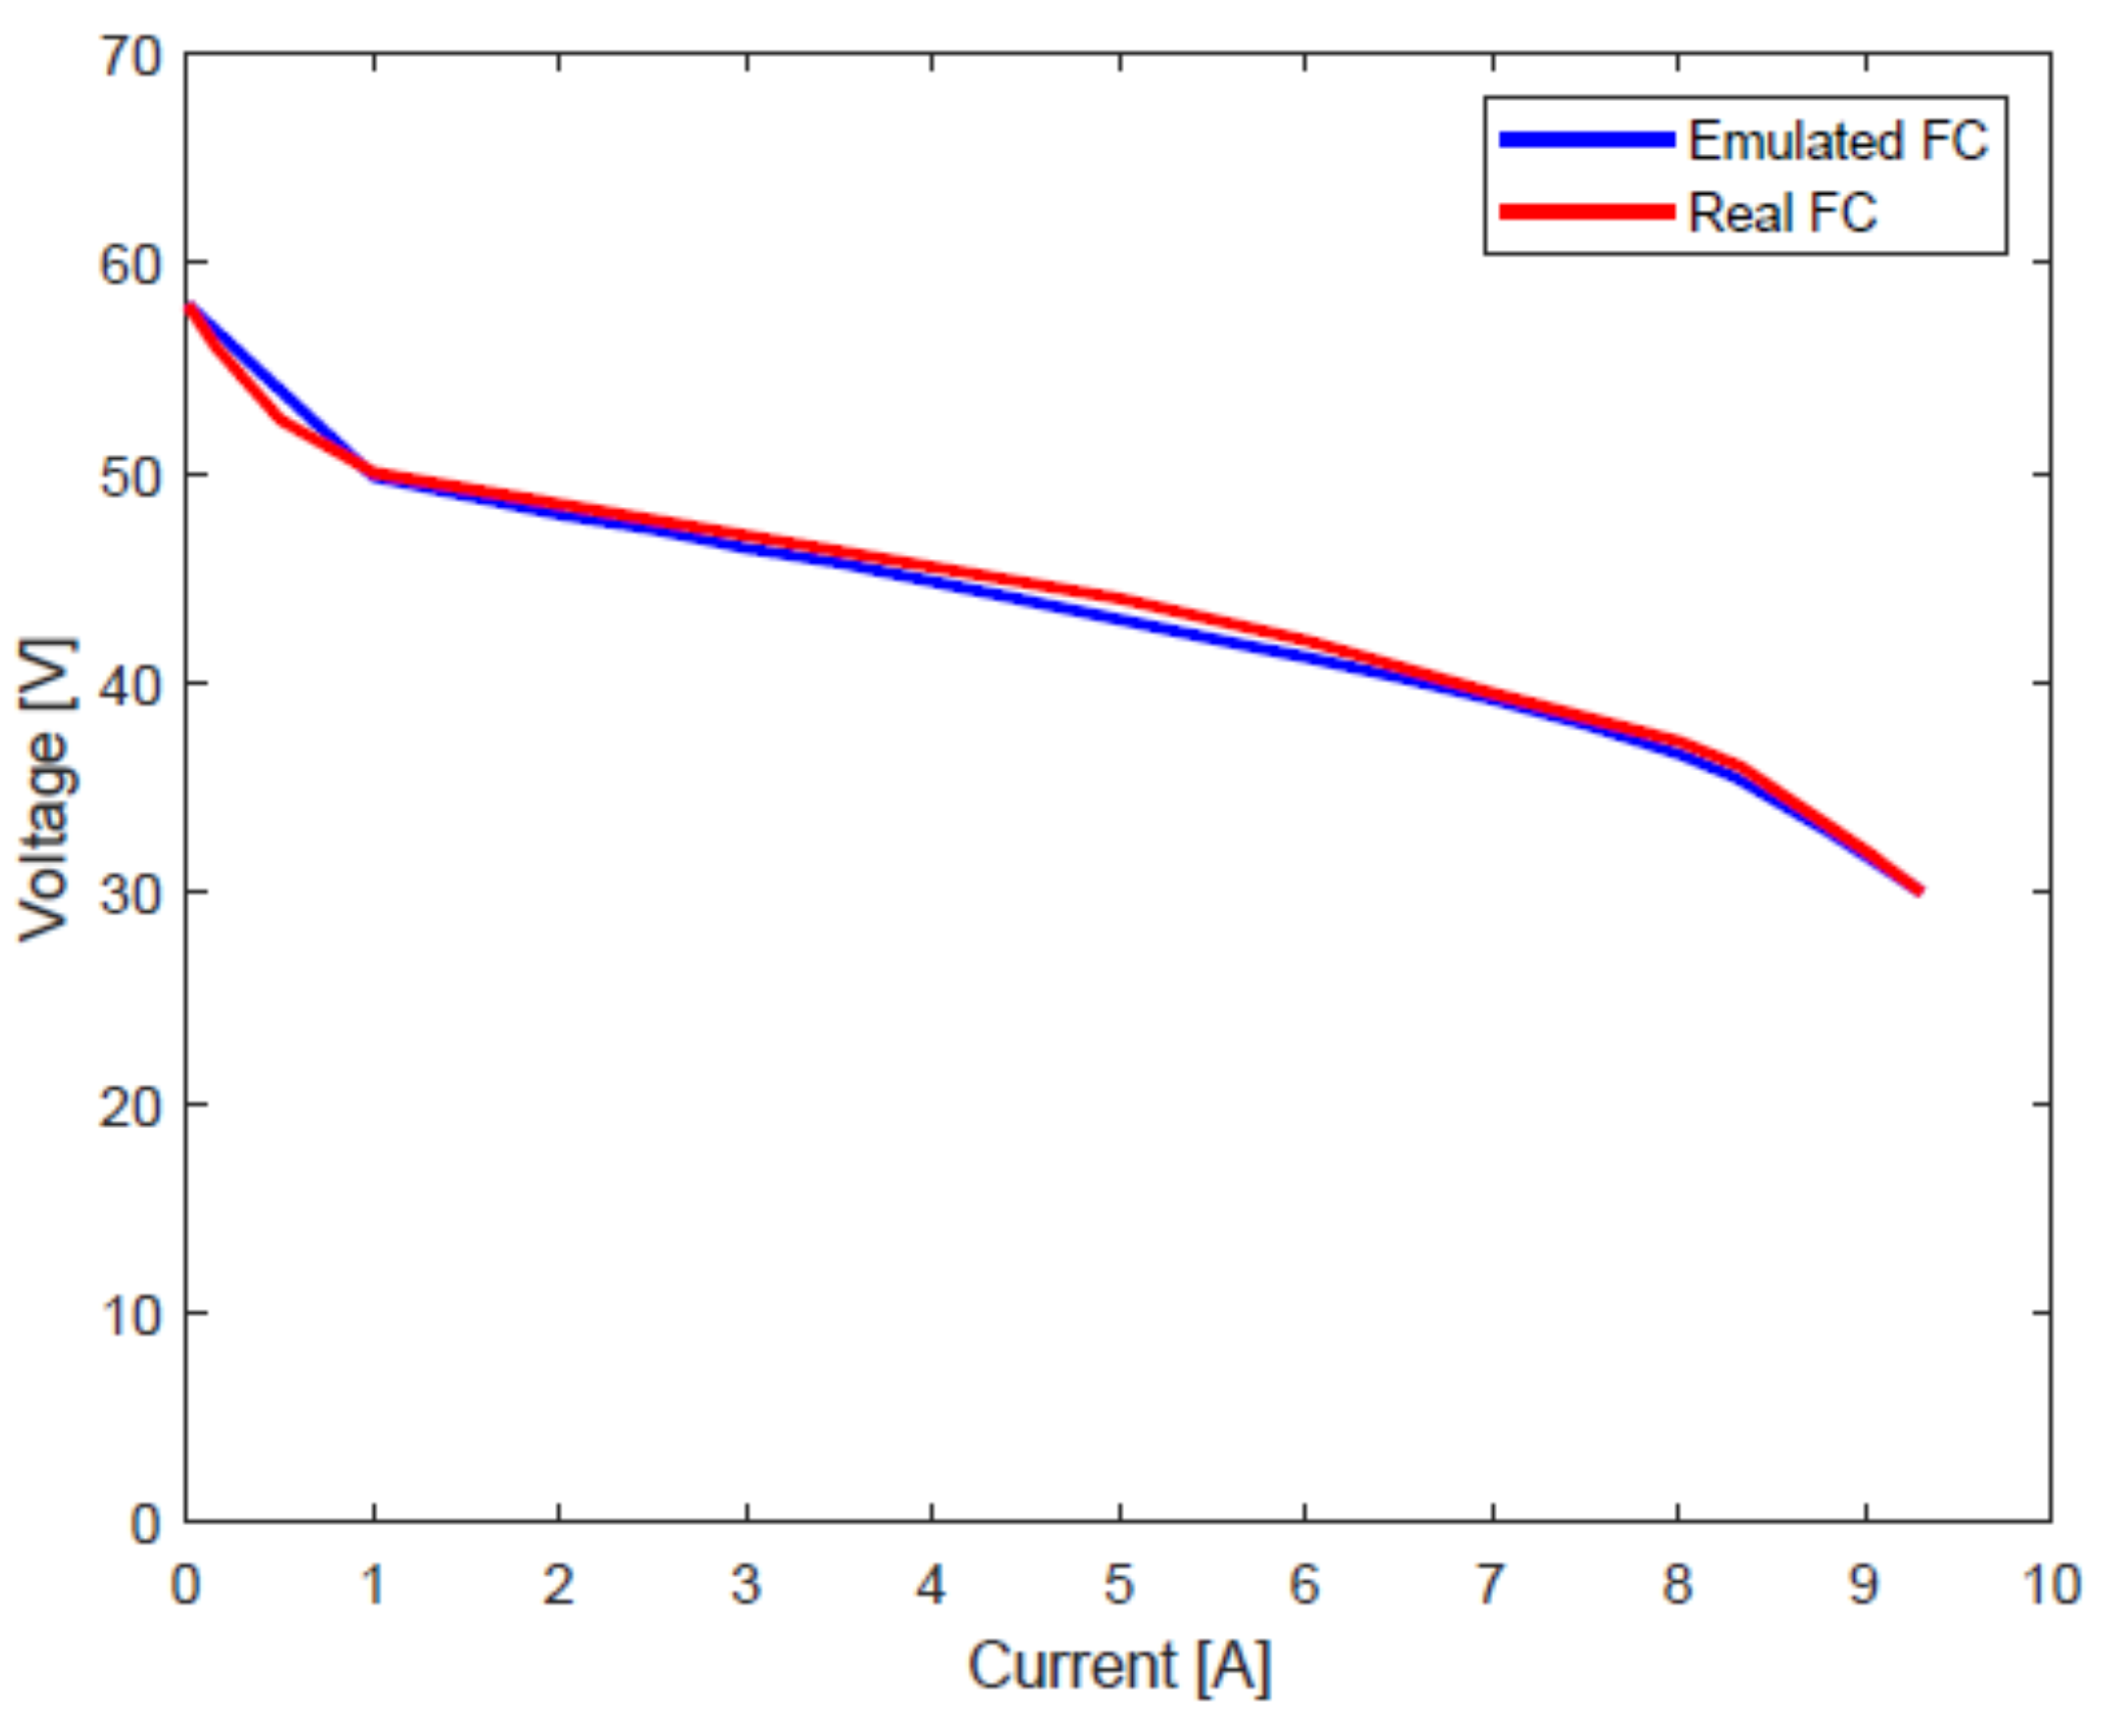
42] developed a laboratory test setup for the emulation of a direct hybrid electric powertrain. In this work, both the fuel cell and the batteries were emulated by programmable DC power sources, whose control was based on a database of their characteristic voltage–current curves. Moreover, both of the power sources were connected without DC-DC converters. It can be stated that in the literature there are many papers that have investigated the topologies and the energy management strategies of hybrid fuel cell powertrains through experimental test benches. However, little attention has been dedicated to the development of software and hardware tools for the realization of the experimental setup. As a matter of fact, most of the existing studies do not provide significant information about the realization of the experimental setups for powertrain testing. Thus, the novelty of this paper lies in providing a simple design procedure for the development of a scaled test bench for the emulation of a fuel cell/battery powertrain. In the proposed setup, the FC is connected to the DC bus through a DC-DC converter, while the batteries are directly connected. The external load is emulated using a DC electronic load and a power supply, which are both programmable. The fuel cell is emulated by another programmable DC power supply controlled so that it reproduces the realistic voltage–current (V-I) curve of a real fuel cell. The power conditioning unit is represented by the DC-DC connection, which is controlled by two signals: a voltage reference signal and a current reference signal. In order to collect data from the power stage, current and voltage transducers are exploited. An Arduino is used as control unit of the test bench due to its easy programming. After defining a simple PI-based control strategy, the system is experimentally validated. The advantages of the proposed experimental setup are the simplicity and easy availability of the required components, the safety and the modularity. In particular, since the FC is emulated using a programmable power supply, all the issues related to the use of a real fuel cell system are not present. Going into detail, the paper is organized as follows: Section 2 briefly introduces the case study and the reference powertrain considered for the bench development. Section 3 describes the test bench layout and its main components. Section 4 explains the proposed PI-based control strategy. 
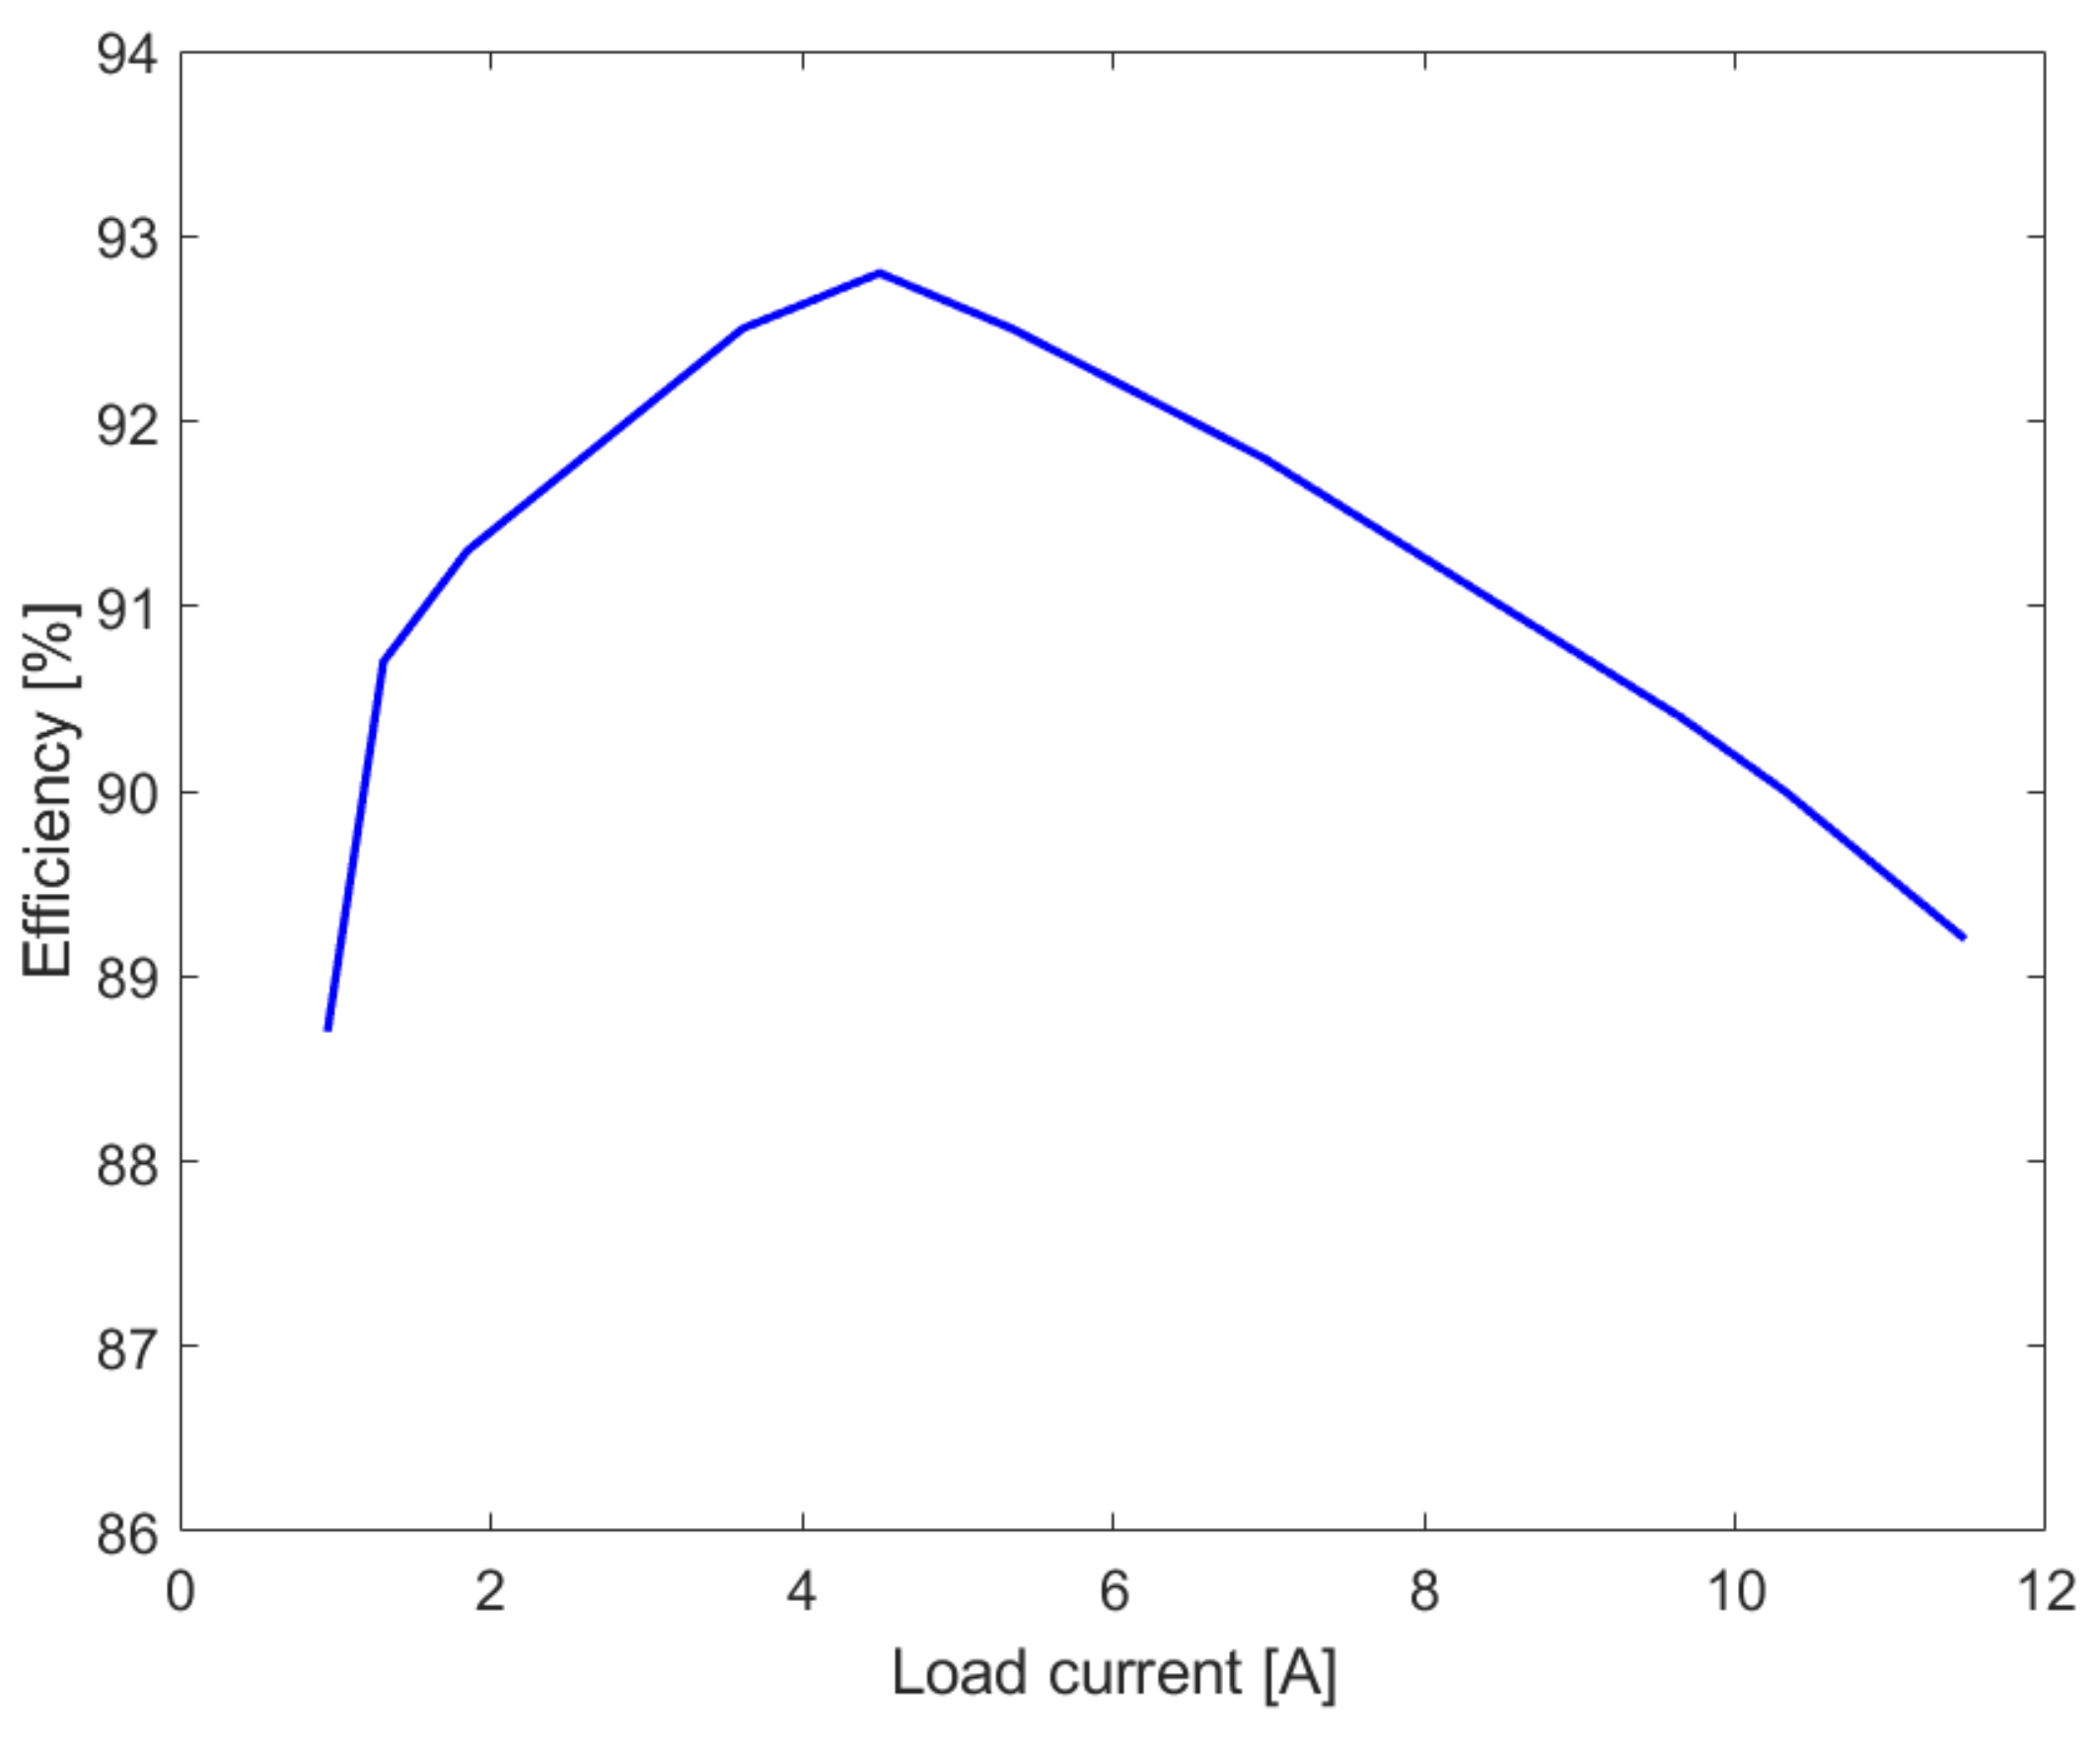
Section 5 describes the experimental tests carried out and the results obtained for the characterization and the validation of the test bench. Finally, Section 6 summarizes the conclusions.

2. Case Study

The reference powertrain for this work is a powertrain designed for agricultural tractors, in particular, orchard tractors. Compactness and manoeuvrability are crucial for these vehicles since they have to move with agility among the narrow orchard rows. Moreover, the powertrain must also provide mechanical power to the power take-off (PTO) shaft. Thus, component sizing must take into account the limits imposed by the vehicle functional requirements. Going into specifics, the case study regards the electrification with fuel cells of a powertrain with a nominal engine power of about 73 kW. As described in a previous work from the same authors [19], the reference fuel-cell-powered powertrain is characterized by an architecture in which there are two power sources: namely, a fuel cell and a battery pack. The first one is connected to the DC bus through a DC-DC power converter, while the batteries are directly connected, as shown in Figure 1.
The reference powertrain has a nominal motor power of 73 kW, a nominal fuel cell power of about 65 kW and a nominal battery pack capacity of 6 kWh. The battery pack capacity is limited compared to the electric motor nominal power; this is due to the low on-board space availability typical of orchard tractors, which imposes constraints on the batteries’ maximum physical dimensions. To properly emulate the reference fuel-cell-powered powertrain, a scale factor is applied to the components’ nominal powers. In particular, the test bench emulated fuel cell nominal power is fixed at 300 W; thus, the scale factor is approximately equal to 220.

3. Test Bench Layout

The proposed hybrid fuel cell topology is composed of an emulated fuel cell, whose role is to be the main power source and to follow the slow-dynamic part of the load, and two series-connected 12 V batteries that have to handle the fast-dynamic component of the load. The FC is interfaced with the DC bus through a DC-DC converter that brings the FC voltage to the level of the batteries’ voltage and acts as the power conditioning unit. On the contrary, no converter is used on the battery side. Downstream of the converter, a diode is placed to avoid current flow from the bus to the emulated FC. In this topology, the voltage of the DC bus is determined by the batteries and is characterized by some fluctuations due to changes in the power demand. A schematic representation of the powertrain structure is shown in Figure 2.

3.1. Fuel Cell Emulation

For the emulation of the fuel cell, a controlled DC power supply (PS) is used. For the experimental setup, the Aim-TTi QPX1200 power supply manufactured by Aim-TTi (Thurlby Thandar Instruments, Huntingdon, UK) is adopted and controlled analogically to reproduce a real FC V-I curve. This power supply has a rated power of 1200 W and operates with a current range of 0–50 A and a voltage range of 0–60 V. The current provided by the emulated FC is measured through a microcontroller using the power supply current monitor port, which generates a 0–5 V analogue signal proportional to the current. The microcontroller translates the analogue signal into the corresponding current value, then, through a 1-D look-up table that represents the V-I curve, evaluates the corresponding voltage. In the end, the microcontroller translates the voltage value into a 0–5 V analogue signal that is sent to the voltage control port of the power supply. The microcontroller adopted is an ATmega2560, and the microcontroller board is an Arduino Mega 2560. This microcontroller is not able to generate an analogue signal between 0–5 V, but it can generate a pulse-width modulation (PWM) signal. Therefore, the PWM signal is converted into a 0–5 V analogue signal by a resistor–capacitor (RC) filter with a cut-off frequency of 48 Hz. For the FC emulation, the FCS-C300 fuel cell manufactured by Horizon Fuel Cell Technologies (Horizon Fuel Cell Technologies, Singapore) is taken as a reference. Its main properties are reported in Table 1, while its characteristic curves are shown in Figure 3.

3.2. Batteries

The batteries are the auxiliary power source and must handle the high-frequency component of the power demand. For the experimental setup, two series-connected 12 V lead-acid batteries with a capacity of 40 Ah are adopted and directly connected to the DC bus. The main properties of the batteries are reported in Table 2. For this preliminary setup of the test bench, lead-acid batteries were preferred to other higher-performing technologies such as Li-ion or NiMH batteries. This choice was motivated by their easier implementation, lower costs and simple management, which does not require a battery management system. Future improvements might introduce batteries with different, higher-performing technologies. However, the implementation of batteries based on other technologies, such as Li-ion batteries, must be accompanied by additional elements to improve the system safety and management [43]. In order to take a precautionary approach, the batteries are connected to the DC bus through a fuse.

3.3. DC-DC Converter

The DC-DC converter is a key element of the architecture. Its main roles are to adjust the FC voltage level according to the DC bus voltage level and to be the power conditioning unit. The adopted DC-DC converter is controlled by two analogic signals: one that determines the voltage reference downstream from the converter and one that determines the current reference at the DC-DC output. The two controls always operate together, and the dominant one is the more-stringent between the two. Given a certain voltage reference and a certain current reference, if the load downstream from the converter is such that at the voltage reference the current is less than the current reference, the dominant parameter is the voltage reference and the current is determined as a consequence. On the contrary, if the load is such that the voltage reference causes a current that is greater than the current reference, the dominant signal is the current reference and the voltage is determined as a consequence of that limiting current. The DC-DC adopted on the setup has two ports for the voltage reference signal and the current reference signal, which require two 0–10 V analogue signals. The Arduino Mega generates two 0–5 V PWM signals that are firstly filtered by two RC filters (cut-off frequency fixed at 19.40 Hz) and are then multiplied by two through an operational amplifier (opamp). After that, since the adopted DC-DC converter has the negative pin of the signals in common with the negative output of the power stage, the signals are transmitted to the converter using two optocouplers. These optocouplers act as analogic isolators; therefore, the ground of the Arduino is not in common with the ground of the power stage. The adopted optocouplers are the HCNR201 manufactured by Broadcom (Broadcom Inc., San Jose, CA, USA). The main operational parameters of the DC-DC converter are shown in Table 3. Since the FC voltage level is in the range 60–30 V while the nominal voltage of the bus DC is 24 V, the adopted converter is a Buck converter. Downstream from the converter, a diode is placed to avoid current flow to the emulated FC, making the converter de facto unidirectional.

3.4. Load Unit

The load unit is composed of an electronic load (EL) and a power supply. The nominal properties of the elements of the load unit are reported in Table 4. The EL must reproduce the power demand deriving from the external load. The adopted EL is the Aim-TTi LD400P manufactured by Aim-TTi. As was done for the power supply for the FC emulation, to obtain precise and fast response control, the EL is controlled analogically through the Arduino Mega. The control signal must be a 0–5 V analogue signal; therefore, also in this case, the Arduino generates a 0–5 V PWM, which is then converted to an analogue signal using an RC filter (cut-off frequency of 48 Hz). However, the load profile must be provided to the Arduino by a personal computer (PC) through a USB connection. Thus, the Arduino receives the EL analogue signal values from the PC through the USB port then sends these signals to the EL in order to emulate the power demand.
However, in order to properly emulate the fuel cell powertrain, the power requested by the auxiliaries of the FC system must be taken into account since they have a non-negligible impact on the powertrain efficiency. These auxiliaries generally include the air compressor, the cooling pump, the hydrogen recirculating pump, etc., and according to studies available in the literature [14,44,45], they usually absorb about 10–20% of the gross power generated by the stack. However, the power consumption of these components is generally dependent on the operative conditions of the fuel cell system. For the FC system considered in [45], the power absorbed by the auxiliaries was approximately equal to around 13% at low loads and increased to around 19% at high loads. Thus, the power absorption was a function of the power delivered by the stack. According to this approach, an estimation of the power absorbed by the auxiliaries of the FC system was performed during the tests and was added to the external load profile in order to consider its impact on the overall efficiency of the emulated powertrain. The estimated power absorption was determined based on the power delivered by the stack so that, according to [45], it was approximately equal to 13% at low loads, or 10–20% of the stack nominal power, and increased linearly to 19% at high loads, or 90–100% of the stack nominal power. As a consequence, the power requested by the load unit was determined by the sum of the external load, which is provided to the Arduino by the PC, and the estimated absorption of the auxiliaries of the FC system, which is evaluated at each time step by the microcontroller based on the actual power delivered by the emulated FC. Therefore, the overall power requested by the EL was expressed by Equation (1).
P t o t = P E M + P a u x F C
where P t o t means the total power requested by the EL, P E M means the power requested by the electric motor of the emulated powertrain, and P a u x F C means the power absorption of the FC system auxiliaries. As for the power supply of the load unit, the adopted PS is the EA PS 2042-10 B manufactured by Elektro-Automatik (EA, Elektro-Automatik GmbH & Co. KG, Viersen, Germany). This unit must be introduced, since during regenerative phases, the external load is negative and it delivers power to the DC bus. Therefore, the role of the load-unit power supply is to emulate these regenerative phases. However, the EA PS 2042-10 B can be controlled only through USB communication; therefore, it is controlled directly by the PC instead of the Arduino.

3.5. Transducers

The transducers adopted in the setup are two current transducers and one voltage transducer. The selected sensors are the CAS 15-NP current transducer and the LV 25-P voltage transducer, both manufactured by LEM (LEM International SA, Meyrin, Switzerland). The transducers’ main properties are reported in Table 5. The current transducer generates a voltage output signal that is directly read by the Arduino. As for the voltage transducer, it is connected to the positive and negative terminals with a predetermined resistance and generates a current signal with a nominal value of 25 mA. To read this signal, the Arduino monitors the voltage drop caused by the generated current over a 150 Ω resistance. As for the experimental setup, the current transducers are supplied directly by the Arduino through its 5 V pin, while for the voltage transducer, an additional dedicated power supply is required. As for the monitored parameters, the voltage transducer measures the DC bus voltage, while the current transducers measure the battery currents and the load current.

3.6. Control Unit

The control unit is composed of an Arduino Mega 2560. The microcontroller has to:
  • Read and translates the measuring signals from the transducers;
  • Control the power supply in order to emulate the behaviour of a real fuel cell;
  • Control the load unit in order to simulate the external load and the auxiliary power absorption;
  • Determine and perform the power split between the batteries and the emulated fuel cell by controlling the DC-DC converter;
  • Communicate with the PC in order to receive the EL control signal values and to send the data collected by the transducers.
A schematic representation of the interactions between the control unit and the other components of the test bench is shown in Figure 4. PS control ports and PS current monitor port refer to the ports of the PS used for the FC emulation. As described in the previous sections, the Arduino can generate 0–5 V PWM signals but is not able to generate analogue signals. Thus, the Arduino generates the PWM signals with a duty cycle that is proportional to the desired signal amplitude; then, they are converted to analogue signals by filtering them through RC filters. Moreover, the analogue signals to the DC-DC are analogically isolated by means of two optocouplers in order to separate the ground of the power stage from the ground of the control stage. In addition, the signals to the DC-DC are doubled since the converter requires 0–10 V signals. As for the signals coming from the transducers and the PS current monitor port, they are 0–5 V analogue signals that can be directly read by the Arduino.
As for the USB connection with the PC, a MATLAB script is used to send, receive and save data. More specifically, to avoid problems in the EL control timing, when receiving data from the PC, the Arduino generates a buffer to temporarily store the next commands for the electronic load. In the performed tests, every 1 s, the PC sends to the control unit the next 20 EL control commands, which are stored in a buffer by the Arduino and then sent to the EL every 50 ms. This rate was considered sufficiently short for a proper emulation of the external load. The MATLAB script is also used to control the load unit power supply by USB communication. Figure 5 shows the experimental setup of the test bench.

4. Energy Management Strategy

The adopted EMS is based on a PI controller. Only proportional and integral action were considered sufficient for the case study of this paper. In the emulated powertrain, the FC is the primary energy source and must follow the low-dynamic part of the load. Thus, the EMS was developed such that the FC follows the load demand with a slow time of response. From the measurement of the batteries’ current and the load current, the control unit evaluates indirectly the current provided by the emulated fuel cell downstream from the power converter (IDC-DC). The PI controller evaluates the current reference signal (IDC-DC r e f ) to the DC-DC so that the batteries current is equal to zero or the power delivered by the emulated FC corresponds to the power demand. As a consequence, the adopted EMS behaves as a charge-sustaining strategy with low reactivity. If the external load power demand is negative, as during regenerative braking, the PI setpoint FC current is set equal to zero. If the external load power demand exceeds the power capabilities of the emulated FC, the reference current for the PI controlled is saturated to a value that corresponds to the nominal power of the emulated FC. The PI gains can be set such that the response time is slow, allowing for a significant reduction in the FC output power oscillations. However, a tuning procedure for the determination of the PI gains must be performed. Figure 6 shows a schematic representation of the control strategy for the current reference signal. As for the voltage reference signal, the value is set equal to the maximum allowable recharging voltage for the batteries. According to this, if the load demand drops abruptly so that the current provided by the emulated FC would exceed the maximum charging current for the batteries, the voltage reference becomes the limiting signal and the current does not exceed the limit.

5. Experimental Tests

To evaluate the behaviour of the test bench and to characterize its elements, a few experimental tests were performed. The tests regarded the analysis in terms of efficiency, a simple thermal analysis, the comparison between the real FC curve and the emulated one and the behaviour of the bench under different load profiles. In the following subsections, the results and the considerations obtained during the tests are presented and discussed.

5.1. Fuel Cell Emulation

Firstly, the fuel cell emulation was validated by comparing the emulated curve with the real FCS-C300 fuel cell curve provided by Horizon Fuel Cell Technologies. As described previously, the control unit evaluates the current delivered by the power supply through its monitoring port and then, after calculating the corresponding voltage, sends a signal to the PS control voltage port. The PS translates this signal and sets the output voltage in accordance to it. Figure 7 shows the comparison between the emulated FC V-I curve and the real FC V-I curve. The real FC curve was obtained from the datasheet of the fuel cell. It can be stated that the two curves are very close; thus, the FC is properly emulated. This test was repeated at least twice at different time periods in order to verify the capability of the system to provide approximately the same FC curve. Repetition of the test showed that the system provides approximately the same FC curve, with a max deviation of around 0.9% in terms of the voltage difference between the test repetitions. However, the max deviation was recorded at low loads, where the V-I curve slope is greater, while for medium–high loads, the difference was reduced to around 0.6%.

5.2. DC-DC and Diode Efficiency

The converter and diode assembly is characterized by a certain efficiency, which is a function of the output current and the output voltage. To measure and map the efficiency, a dedicated test was performed. Figure 8 reports the efficiency measured during the test of the converter and diode assembly as a function of the load current. The test was conducted by connecting the PS for the emulation of the FC to the input side of the power converter and the electronic load downstream from the diode; thus, the batteries were not included in this test setup. The output voltage of the converter was set equal to the nominal voltage of the test bench DC bus. The efficiency was measured at different load currents. During the test, the power supply followed the emulated FC V-I current so that the efficiency was evaluated with the proper input current and voltage to the converter. For each efficiency point, the system was brought to the regime. At low currents, the efficiency increases with the load and reaches its maximum of about 93% at approximately 4.5 A; then, it starts decreasing. However, the efficiency is more than 88% for almost the entire load spectrum.

5.3. Thermal Analysis

To evaluate the temperatures reached by the components, a thermal analysis test was performed. Since the most-critical elements of the bench are the power converter and the diode, the analysis focused on monitoring their temperatures during different levels of power flow. The tests were conducted with 100, 200 and 300 W flowing through the converter and the diode. The ambient temperature during the thermal analysis was equal to approximately 25 °C. For each level of power, the thermal regime was reached. A thermal camera was used to record the temperatures of the components during the test. The camera adopted wa the FLIR E4 manufactured by Teledyne FLIR (Teledyne FLIR LLC, Wilsonville, OR, USA). Figure 9 shows the images collected with the thermal camera. With 100 W of power flow, the maximum temperatures recorded were about 43.6 °C on the DC-DC converter and about 37–38 °C on the diode. With 200 W of power flow, the maximum temperatures reached 51 °C both on the converter and the diode. As expected, the maximum temperatures were recorded in the case of 300 W of power flow and corresponded to approximately 67.5 °C. This temperature was recorded on the diode, while a slightly lower temperature of about 60 °C was observed on the power converter. Moreover, with the increase in the load current, a rise in the wire temperature was noted. However, the temperatures reached during the test were considered acceptable.

5.4. Step-Load System Response

Tests were conducted to evaluate the system response to a step load. As described previously, the batteries must handle sudden changes in the external load, while the emulated FC has to follow the low-dynamic component of the power demand. Since the power split is performed by the power converter, the behaviour of the energy sources is determined by the energy management strategy. As described in Section 4, the EMS proposed for this preliminary test is a PI-based strategy. Thus, different parameters of the PI controller determine different time responses of the emulated fuel cell. To highlight this behaviour, the tests to evaluate the system response to a step load were performed with different parameter values of the PI controller. The external load power consumption for this test was determined as follows: from t = 0 s to t = 10 s, the external load was equal to zero; from t = 10.05 s to t = 100 s, the external load power was equal to approximately 50 W; from t = 100.05 s to t = 190 s, it was equal to 330 W; from t = 190.05 s to t = 280 s, it was equal to 50 W; and in the end, from t = 280.05 s to t = 370 s, it was equal to zero. However, the total power requested by the load unit is equal to the external load plus the estimated power requested by the auxiliaries of the FC system; thus, during the tests, it reached a maximum of approximately 390 W. This load profile is not realistic, but the aim of this test is to highlight the system behaviour in response to a high and sudden load variation rather than to a realistic load profile. The value of 330 W was chosen since it corresponded to the maximum power requested by the external load in the scaled reference powertrain. Figure 10 shows the system response to a step load with different PI gain parameters. The external load profile means the current requested without considering the FC auxiliaries’ current absorptions, while total load current means the overall current requested by the load unit during the test; thus, it comprises both the external load and the FC system auxiliaries’ absorptions. It can be stated that the power fluctuations of the emulated FC can be significantly reduced with proper tuning of the PI controller. On the contrary, if the gains are not properly tuned, the system may not be stable, and this translates into some oscillations in the power output.

5.5. Dynamic Stress Test

The dynamic stress test (DST) is a widely adopted driving cycle used to evaluate various battery models and state-of-charge (SOC) estimation algorithms [46,47,48]. The DST is defined by a 360 s sequence of power steps with seven discrete power levels, as shown in Figure 11. Even if this cycle is mainly used for testing batteries, the authors deem it useful for evaluating the emulated powertrain behaviour and also because of the lack of standardized drive cycles for agricultural tractors. The power sequence is composed of discharge and charge phases; thus, the load unit alternated between sequences in which it required power and sequences in which it provided power (as happens during regenerative braking). The results of the DST are shown in Figure 12. For the test, the PI gains adopted were derived from the step-load system response; thus, the configuration with Kp = 1 and Ki = 0.2 was adopted. It can be stated that even if the system was characterized by step-load variations, the emulated fuel cell did not have sudden changes in the power output. At the end of the test the FC was still providing power since the integral part of the PI controller was still discharging.
Figure 12 also shows the reference batteries’ SOC variation. Additionally, in this case, the total load power corresponds to the sum of the external load and the FC system auxiliaries’ power absorptions. This plot was obtained by considering the scaling of the nominal capacity of the reference powertrain. At the beginning of the test, the batteries discharged since the FC requires a certain time to reach the average power demand. Then, the FC starts recharging the batteries during low external power requests. Actually, the proposed PI-based strategy behaves similarly to a charge-sustaining strategy with a slow time response.

5.6. Real Work Scenarios

Since the reference powertrain is designed for agricultural tractors, tests regarding real work scenarios were performed on the test bench. Tractors are multi-purpose machines; thus, they perform several different tasks during their operative life both regarding field activities and road transportation [49]. For the real-work-scenario tests proposed by the authors in this subsection, the attention focused on five different tasks regarding both handling trailers and the use of attached implements through the PTO. To determine the load profiles, data were collected from a real agricultural tractor powered with a 73 kW diesel engine. In detail, the measurements were conducted on a Antonio Carraro TRG 10900 equipped with a Kubota V3800 engine whose characteristic curves are shown in Appendix A. To characterize the work scenarios, data were collected from the CAN BUS network using a USB CAN analyser connected to a personal computer installed on the vehicle. In detail, the attention focused on the monitoring of the following parameters: vehicle speed, engine speed and engine load. Engine load must be intended as the ratio between the actual torque delivered by the engine and the maximum torque at the actual engine rotational speed. From the engine load data and the actual engine speed data and knowing the torque–speed curve of the diesel engine, it was possible to evaluate the power delivered by the engine. As for the bench tests, the power profiles obtained from the experimental data collected on the tractor were scaled in accordance with the scale factor of the test bench. Additional details about the data acquisition system were described in a previous work from the same research group [50].

5.6.1. Handling of Trailers

As for the handling of trailers, two different conditions were considered: a 0–40 km/h acceleration test with a fully loaded trailer (6000 kg mass) and road transportation of an empty trailer. Figure 13 shows the experimental data for the road transportation test of an empty trailer, while Figure 14 shows the experimental data for the 0–40 km/h acceleration test with a fully loaded trailer. Both tests were conducted on a flat, paved road. At the beginning of both tests, the vehicle was in neutral gear. As for the empty trailer test, the acceleration phase was characterized by three gear changes around 6, 11 and 21 s. Additionally, in the case of the test with the fully loaded trailer, the same three gear ratios were used, with shifting at approximately 4, 10 and 18 s during the acceleration phase. During both tests, the PTO was disengaged. It can be stated that the proposed work scenarios were characterized by sudden variations in the engine load due to acceleration, deceleration and gearshifting phases. Thus, the authors deemed that these profiles were suitable for testing the system in order to evaluate the capacity of the load unit to reproduce the power demand of the work cycles and to analyse the behaviour of the EMS in terms of the power split between the emulated FC and the batteries.
However, it is necessary to point out that since the load profiles were extrapolated by monitoring a diesel-powered agricultural tractor, no regenerative braking was considered since the minimum value for the external load power was equal to zero. Figure 15 and Figure 16 show the results of the proposed work scenarios on the test bench. Additionally, in this case, the total load power corresponds to the sum of the external load and the FC system auxiliaries’ power absorptions. Analysing the results, the following elements were outlined:
  • The load unit successfully emulated the power demand with a good level of accuracy;
  • The proposed EMS was able to reduce the fluctuations to the power output of the emulated FC.

5.6.2. Use of Attached Implements

To perform on-field operations such as soil tillage or the application of fertilizer, implements are attached to the tractor and powered by the engine through the PTO. Three different tasks involving the use of PTO implements were considered: the use of an atomizer, the use of a shredder and the use of a rotary harrow. Figure 17 shows the experimental data recorded on the traditional tractor for the three proposed tasks. The rotary harrow implement was the one with the highest peaks in the power demand, while the shredder was the one that required the lowest power, showing an average engine load of around 50%.
As in the previous tests, the power profiles were extrapolated from the engine load and the engine speed knowing its characteristic curves. Then, the power profiles were scaled to the power level of the test bench and were performed. The results are shown in Figure 18. Analysing the results, some considerations can be made. Firstly, with the proposed EMS, the high time of response of the FC caused an initial drop in the SOC of the reference powertrain batteries, which was more than 10% for all the tested scenarios. Thus, future work should deeply investigate the EMS in order to reduce this effect. Secondly, for implements that require very high power, such as the rotary harrow, the FC system cannot provide enough power to satisfy the power request during the most-intense work conditions. This can be attributed to the efficiency of the DC-DC and to the power absorbed by the auxiliaries of the FC system, which can reduce the effective power that the FC delivers to satisfy the external load demand. However, in this paper, the power absorbed by the auxiliaries was estimated according to studies available in the literature; thus, a deeper investigation with further experimental data should be conducted.

5.7. Hydrogen Consumption Estimation

In order to implement a real FC on the test bench and to size the hydrogen storage system, an estimation of the H 2 consumption must be performed. Since the proposed layout is designed considering the fuel cell FCS-C300 manufactured by Horizion Fuel Cell Technologies as a reference, its consumption curve was used for the fuel consumption estimation. This curve was obtained from the datasheet of the fuel cell stack and is shown in Figure 19. Considering the power delivered by the emulated FC during the considered tests, the instantaneous and cumulative hydrogen consumptions were derived. Table 6 shows the results in terms of max and total consumption of hydrogen for the performed tests. Figure 20 and Figure 21 show the results for the real work scenarios in terms of hydrogen consumption. Assuming that the efficiency of the FC system adopted in the test bench is similar to the efficiency of the real FC system for the tractor, the hydrogen consumption can be scaled up to the consumption of the real FC tractor by multiplying it by the scale factor. According to this assumption and considering a medium work condition such as the use of a shredder, to guarantee 4 h of endurance of the real hydrogen tractor, approximately 7 kg of hydrogen should be stocked on-board. Considering stocking the hydrogen in gaseous form inside cylinder tanks at 700 bar, an estimated volume of about 200 L is required. In accordance with the actual state-of-art of hydrogen storage systems, a mass of around 120 kg is estimated for the tanks.

6. Conclusions

In this work, the development of a scaled test bench for the emulation of a hybrid fuel cell/battery powertrain was presented. The realization of this test bench was motivated by the need for proper instruments with easy implementation and component availability and with the ability to emulate the behaviour of the powertrain under certain external load profiles and with different EMSs. The paper focused on the design process and on the main practical challenges that can occur during the realization of the test bench. The topology under investigation was composed of a battery pack directly connected to the DC bus and an emulated FC connected to the DC bus through a DC-DC converter. As for the battery pack, two 12 V series-connected lead acid batteries were adopted, mainly because of their low cost and easy integration with the system. The fuel cell was emulated through a programmable power supply, while the external load was simulated using an electronic load and an additional power supply for the regenerative phases. The power conditioning unit was represented by the DC-DC converter, which was controlled by an Arduino microcontroller according to a PI-based energy management strategy. The microcontroller also had to programme the PS for the emulation of the FC so that it followed a real FC V-I curve to communicate with a PC for data logging, for determining the external load power demand and to control the electronic load. Instead, the load unit power supply was controlled by the PC through USB communication since it did not have the possibility to be analogically controlled. To monitor the main operating parameters of the test bench, voltage and current transducers were adopted, the signals of which were collected and translated by the microcontroller. To experimentally evaluate the behaviour of the system, a few tests were performed. Firstly, the FC emulation was validated by comparing the emulated FC curve with the real reference FC curve. Secondly, the DC-DC converter and diode assembly efficiency were evaluated. The results showed a peak efficiency of around 93%; however, the efficiency was greater than 88% over almost the entire load spectrum. Moreover, a thermal analysis was performed to monitor the temperatures reached by the components. The highest temperature recorded was approximately 67.5 °C and was reached with 300 W of power flow from the emulated FC, which corresponded to its nominal power. To calibrate the PI controller gains, a step-load system response test was exploited and a dynamic stress test was used to evaluate the behaviour of the system under discrete power level variations. Finally, two tests were conducted based on real work scenarios obtained by monitoring a real agricultural tractor with a 73 kW diesel engine. The results showed that the load unit successfully managed to perform the external load profile, and the power conditioning unit was able to split the power between the FC and the battery pack according to the EMS strategy and within the constraints regarding the low-dynamic behaviour of the fuel cell. Moreover, an estimation of the hydrogen consumed in the case of the implementation of the real FCS-C300 was performed, showing in the proposed test scenarios a peak virtual consumption of 4.2 × 10 3 g/s. Thus, it is possible to assert that the system successfully emulated the powertrain according to the following aspects:
  • The load unit was able to reproduce the power absorption with a good level of accuracy;
  • The power conditioning unit was able to perform the proposed EMS;
  • The control unit managed to monitor the main operational parameter of the system and to communicate with each subsystem.
Thus, the proposed experimental setup could be a useful instrument to evaluate the behaviour of the powertrain during investigation of different work cycles and with different EMSs. Moreover, the emulation of the FC allows for a reduction in terms of complexity and safety issues. However, there are some limitations of the proposed test bench that can be overcame in future work. Firstly, the emulation of the FC does not take into account some aspects that are typical for a real FC system, such as membrane drying or flooding, which could affect the dynamic behaviour of the system. As a consequence, future upgrades to the test bench could include the implementation of a real FC system in order to introduce elements related to hydrogen storage and reactant adduction systems. Other future work might regard performing more tests derived from real data collected on-field, including work activities with attached implements, and a deeper investigation of the EMS, introducing optimization algorithms and penalty factors related to the charge/discharge current and SOC level of the batteries. In addition, the modularity of the system allows for the introduction of other power sources, such as supercapacitors, or the substitution of the lead acid batteries with higher-performance batteries, for example, Li-ion batteries. In the end, the realization of a test bench with a scale factor of one could be an object of future works.

Author Contributions

Conceptualization, V.M., F.M. and A.S.; methodology, V.M., F.M. and A.S.; software, V.M., F.M. and A.S.; validation, V.M., F.M. and A.S.; formal analysis, V.M., F.M. and A.S.; investigation, V.M., F.M. and A.S.; resources, V.M., F.M. and A.S.; data curation, V.M., F.M. and A.S.; writing—original draft preparation, V.M., F.M. and A.S.; writing—review and editing, V.M., F.M. and A.S.; visualization, V.M., F.M. and A.S.; supervision, V.M., F.M. and A.S.; project administration, V.M., F.M. and A.S.; funding acquisition, V.M., F.M. and A.S. All authors contributed equally to this work. All authors have read and agreed to the published version of the manuscript.

Funding

This research received no external funding.

Institutional Review Board Statement

Not applicable.

Informed Consent Statement

Not applicable.

Data Availability Statement

Not applicable.

Conflicts of Interest

The authors declare no conflict of interest.

Abbreviations

The following abbreviations are used in this manuscript:
CANControlled Area Network
DCDirect Current
DSTDynamic Stress Test
ELElectronic Load
EMSEnergy Management Strategy
FCFuel Cell
Li-IonLithium-ion
NiMHNickel-metal Hydride
NRMMNon-Road Mobile Machineries
PIProportional-Integral
PSPower Supply
PTOPower Take-Off
PWM    Pulse-width Modulation
RCResistor–Capacitor
SOCState of Charge
V-IVoltage–Current
VRLAValve-regulated Lead Acid

Appendix A

Figure A1. Engine torque and power curves.
Applsci 13 08582 g0a1
Figure A2. Engine brake-specific fuel consumption (BSFC) curve.
Applsci 13 08582 g0a2

References

  1. Lombardi, L.; Tribioli, L.; Cozzolino, R.; Bella, G. Comparative environmental assessment of conventional, electric, hybrid, and fuel cell powertrains based on LCA. Int. J. Life Cycle Assess. 2017, 22, 1989–2006. [Google Scholar] [CrossRef]
  2. Buberger, J.; Kersten, A.; Kuder, M.; Eckerle, R.; Weyh, T.; Thiringer, T. Total CO2-equivalent life-cycle emissions from commercially available passenger cars. Renew. Sustain. Energy Rev. 2022, 159, 112158. [Google Scholar] [CrossRef]
  3. Somà, A. Trends and Hybridization Factor for Heavy-Duty Working Vehicles; IntechOpen: Rijeka, Croatia, 2017; p. 1. [Google Scholar] [CrossRef] [Green Version]
  4. Somà, A.; Bruzzese, F.; Mocera, F.; Viglietti, E. Hybridization Factor and Performance of Hybrid Electric Telehandler Vehicle. IEEE Trans. Ind. Appl. 2016, 52, 5130–5138. [Google Scholar] [CrossRef]
  5. Mocera, F.; Somà, A. A Review of Hybrid Electric Architectures in Construction, Handling and Agriculture Machines. In New Perspectives on Electric Vehicles; IntechOpen: Rijeka, Croatia, 2021. [Google Scholar] [CrossRef]
  6. Mocera, F.; Somà, A. Working Cycle requirements for an electrified architecture of a vertical feed mixer vehicle. Procedia Struct. Integr. 2018, 12, 213–223. [Google Scholar] [CrossRef]
  7. Bacenetti, J.; Lovarelli, D.; Facchinetti, D.; Pessina, D. An environmental comparison of techniques to reduce pollutants emissions related to agricultural tractors. Biosyst. Eng. 2018, 171, 30–40. [Google Scholar] [CrossRef]
  8. Tomic, M.; Savin, L.; Simikic, M.; Kiss, F.; Keselj, K.; Ivanisevic, M.; Ponjican, O.; Zoranovic, M.; Sedlar, A. Effects of biodiesel on changes in IC engine performances: A long-term experiment with farm tractors. Fuel 2021, 292, 120300. [Google Scholar] [CrossRef]
  9. Owczuk, M.; Matuszewska, A.; Kruczyński, S.; Kamela, W. Evaluation of Using Biogas to Supply the Dual Fuel Diesel Engine of an Agricultural Tractor. Energies 2019, 12, 1071. [Google Scholar] [CrossRef] [Green Version]
  10. Mocera, F. A Model-Based Design Approach for a Parallel Hybrid Electric Tractor Energy Management Strategy Using Hardware in the Loop Technique. Vehicles 2021, 3, 1–19. [Google Scholar] [CrossRef]
  11. Mocera, F.; Martini, V.; Somà, A. Comparative Analysis of Hybrid Electric Architectures for Specialized Agricultural Tractors. Energies 2022, 15, 1944. [Google Scholar] [CrossRef]
  12. Mocera, F.; Martini, V. Numerical Performance Investigation of a Hybrid eCVT Specialized Agricultural Tractor. Appl. Sci. 2022, 12, 2438. [Google Scholar] [CrossRef]
  13. Dash, S.K.; Chakraborty, S.; Roccotelli, M.; Sahu, U.K. Hydrogen Fuel for Future Mobility: Challenges and Future Aspects. Sustainability 2022, 14, 8285. [Google Scholar] [CrossRef]
  14. Lohse-Busch, H.; Stutenberg, K.; Duoba, M.; Liu, X.; Elgowainy, A.; Wang, M.; Wallner, T.; Richard, B.; Christenson, M. Automotive fuel cell stack and system efficiency and fuel consumption based on vehicle testing on a chassis dynamometer at min 18 °C to positive 35 °C temperatures. Int. J. Hydrogen Energy 2020, 45, 861–872. [Google Scholar] [CrossRef]
  15. Hsieh, C.-Y.; Pei, P.; Bai, Q.; Su, A.; Weng, F.-B.; Lee, C.-Y. Results of a 200 hours lifetime test of a 7 kW Hybrid-Power fuel cell system on electric forklifts. Energy 2021, 214, 118941. [Google Scholar] [CrossRef]
  16. Un-Noor, F.; Wu, G.; Perugu, H.; Collier, S.; Yoon, S.; Barth, M.; Boriboonsomsin, K. Off-Road Construction and Agricultural Equipment Electrification: Review, Challenges and Opportunities. Vehicles 2022, 4, 780–807. [Google Scholar] [CrossRef]
  17. Xun, Q.; Lundberg, S.; Liu, Y. Design and experimental verification of a fuel cell/supercapacitor passive configuration for a light vehicle. J. Energy Storage 2021, 33, 102110. [Google Scholar] [CrossRef]
  18. Zhang, Z.; Tang, J.; Zhang, T. Experimental Validation of Hydrogen Fuel-Cell and Battery-Based Hybrid Drive without DC-DC for Light Scooter under Two Typical Driving Cycles. Energies 2022, 15, 69. [Google Scholar] [CrossRef]
  19. Martini, V.; Mocera, F.; Somà, A. Numerical Investigation of a Fuel Cell-Powered Agricultural Tractor. Energies 2022, 15, 8818. [Google Scholar] [CrossRef]
  20. Ahluwalia, R.K.; Wang, X.; Star, A.G.; Papadias, D.D. Performance and cost of fuel cells for off-road heavy-duty vehicles. Int. J. Hydrogen Energy 2022, 47, 10990–11006. [Google Scholar] [CrossRef]
  21. Li, T.; Huang, L.; Liu, H. Energy management and economic analysis for a fuel cell supercapacitor excavator. Energy 2019, 172, 840–851. [Google Scholar] [CrossRef]
  22. Tritschler, P.J.; Bacha, S.; Rullière, E.; Husson, G. Energy Management Strategies for an embedded Fuel Cell System on Agricultural Vehicles. In Proceedings of the XIX International Conference on Electrical Machines-ICEM 2010, Rome, Italy, 6–8 September 2010. [Google Scholar] [CrossRef]
  23. Di Ilio, G.; Di Giorgio, P.; Tribioli, L.; Bella, G.; Jannelli, E. Preliminary design of a fuel cell/battery hybrid powertrain for a heavy-duty yard truck for port logistics. Energy Convers. Manag. 2021, 243, 114423. [Google Scholar] [CrossRef]
  24. Pardhi, S.; Chakraborty, S.; Tran, D.-D.; El Baghdadi, M.; Wilkins, S.; Hegazy, O. A Review of Fuel Cell Powertrains for Long-Haul Heavy-Duty Vehicles: Technology, Hydrogen, Energy and Thermal Management Solutions. Energies 2022, 15, 9557. [Google Scholar] [CrossRef]
  25. Ji, M.; Wang, J. Review and comparison of various hydrogen production methods based on costs and life cycle impact assessment indicators. Int. J. Hydrogen Energy 2021, 46, 38612–38635. [Google Scholar] [CrossRef]
  26. Aghbashlo, M.; Hosseinzadeh-Bandbafha, H.; Shahbeik, H.; Tabatabaei, M. The role of sustainability assessment tools in realizing bioenergy and bioproduct systems. Biofuel Res. J. 2022, 35, 1697–1706. [Google Scholar] [CrossRef]
  27. Aghbashlo, M.; Khounani, Z.; Hosseinzadeh-Bandbafha, H.; Gupta, V.K.; Amiri, H.; Lam, S.S.; Moorosuk, T.; Tabatabaei, M. Exergoenvironmental analysis of bioenergy systems: A comprehensive review. Renew. Sustain. Energy Rev. 2021, 149, 111399. [Google Scholar] [CrossRef]
  28. Xu, X.; Zhou, Q.; Yu, D. The future of hydrogen energy: Bio-hydrogen production technology. Int. J. Hydrogen Energy 2022, 47, 33677–33698. [Google Scholar] [CrossRef]
  29. Kumar, S.; Reddy, K.R.; Reddy, C.V.; Shetti, N.P.; Sadhu, V.; Shankar, M.V.; Reddy, V.G.; Raghu, A.V.; Aminabhavi, T.M. Metal Nitrides and Graphitic Carbon Nitrides as Novel Photocatalysts for Hydrogen Production and Environmental Remediation. In Nanostructured Materials for Environmental Applications; Springer: Cham, Switzerland, 2021; pp. 485–519. [Google Scholar]
  30. Chen, H.; Zhao, X.; Zhang, T.; Pei, P. The reactant starvation of the proton exchange membrane fuel cells for vehicular applications: A review. Energy Convers. Manag. 2019, 182, 282–298. [Google Scholar] [CrossRef]
  31. Das, H.S.; Tan, C.W.; Yatim, A.H.M. Fuel cell hybrid electric vehicles: A review on power conditioning units and topologies. Renew. Sustain. Energy Rev. 2017, 76, 268–291. [Google Scholar] [CrossRef]
  32. Reddy, K.R.; Hemavathi, B.; Balakrishna, G.R.; Raghu, A.V.; Naveen, S.; Shankar, M.V. 11—Organic Conjugated Polymer-Based Functional Nanohybrids: Synthesis Methods, Mechanisms and Its Applications in Electrochemical Energy Storage Supercapacitors and Solar Cells. In Polymer Composites with Functionalized Nanoparticles; Elsevier: Cham, Switzerland, 2019; pp. 357–379. [Google Scholar]
  33. Thounthong, P.; Rael, S.; Davat, B. Energy management of fuel cell/battery/supercapacitor hybrid power source for vehicle applications. J. Power Sources 2009, 193, 376–385. [Google Scholar] [CrossRef]
  34. Zhao, X.; Wang, L.; Zhou, Y.; Pan, B.; Wang, R.; Wang, L.; Yan, X. Energy management strategies for fuel cell hybrid electric vehicles: Classification, comparison, and outlook. Energy Convers. Manag. 2022, 270, 116179. [Google Scholar] [CrossRef]
  35. Trinh, H.-A.; Phan, V.-D.; Truong, H.-V.-A.; Ahn, K.K. Energy Management Strategy for PEM Fuel Cell Hybrid Power System Considering DC Bus Voltage Regulation. Electronics 2022, 11, 2722. [Google Scholar] [CrossRef]
  36. Yang, H.; Sun, Y.; Xia, C.; Zhang, H. Research on Energy Management Strategy of Fuel Cell Electric Tractor Based on Multi-Algorithm Fusion and Optimization. Energies 2022, 15, 6389. [Google Scholar] [CrossRef]
  37. Odeim, F.; Roes, J.; Heinzel, A. Power Management Optimization of an Experimental Fuel Cell/Battery/Supercapacitor Hybrid System. Energies 2015, 8, 6302–6327. [Google Scholar] [CrossRef] [Green Version]
  38. Vural, B.; Dusmez, S.; Uzunoglu, M.; Ugur, E.; Akin, B. Fuel Consumption Comparison of Different Battery/Ultracapacitor Hybridization Topologies for Fuel-Cell Vehicles on a Test Bench. IEEE Trans. Emerg. Sel. Top. Power Electron. 2014, 2, 552–561. [Google Scholar] [CrossRef]
  39. Wang, Y.; Sun, Z.; Chen, Z. Energy management strategy for battery/supercapacitor/fuel cell hybrid source vehicles based on finite state machine. Appl. Energy 2019, 254, 113707. [Google Scholar] [CrossRef]
  40. Xun, Q.; Roda, V.; Liu, Y.; Huang, X.; Costa-Castellò, R. An adaptive powersplit strategy with a load disturbance compensator for fuel cell/supercapacitor powertrains. J. Energy Storage 2021, 44, 103341. [Google Scholar] [CrossRef]
  41. Iqbal, M.; Laurent, J.; Benmouna, A.; Becherif, M.; Ramadan, H.S.; Claude, F. Ageing-aware load following for composite-cost optimal energy management of fuel cell hybrid electric vehicle. Energy 2022, 254, 124233. [Google Scholar] [CrossRef]
  42. Graf, T.; Fonk, R.; Schröter, J.; Hoenicke, P.; Bauer, C.; Kallo, J.; Willich, C. Investigation of a fuel cell hybrid system with a new modular test bench approach for all electric hybrid power train systems. J. Energy Storage 2022, 56, 105999. [Google Scholar] [CrossRef]
  43. Liu, C.; Xu, D.; Weng, J.; Zhou, S.; Li, W.; Wan, Y.; Jiang, S.; Zhou, D.; Wang, J.; Huang, Q. Phase Change Materials Application in Battery Thermal Management System: A Review. Materials 2020, 13, 4622. [Google Scholar] [CrossRef] [PubMed]
  44. Wu, D.; Gao, Y.; Yin, C.; Tang, H. Design and simulation of proton exchange membrane fuel cell system. Energy Rep. 2021, 7, 522–530. [Google Scholar] [CrossRef]
  45. Zhang, B.; Wang, X.; Gong, D.; Xu, S. Experimental analysis of the performance of the air supply system in a 120 kW polymer electrolyte membrane fuel cell system. Int. J. Hydrogen Energy 2022, 47, 21417–21434. [Google Scholar] [CrossRef]
  46. Xiong, R.; He, H.; Guo, H.; Ding, Y. Modeling for Lithium-Ion Battery used in Electric Vehicles. Procedia Eng. 2011, 15, 2869–2874. [Google Scholar] [CrossRef] [Green Version]
  47. Robertson, D.C.; Christophersen, J.P.; Bennett, T.; Walker, L.K.; Wang, F.; Liu, S.; Fan, B.; Bloom, I. A comparison of battery testing protocols: Those used by the U.S. advanced battery consortium and those used in China. J. Power Sources 2016, 306, 268–273. [Google Scholar] [CrossRef] [Green Version]
  48. Christopherson, J.P. Battery Test Manual for Electric Vehicles. 2015. Available online: https://inldigitallibrary.inl.gov/sites/sti/sti/6492291.pdf (accessed on 3 March 2023).
  49. Mattetti, M.; Maraldi, M.; Lenzini, N.; Fiorati, S.; Sereni, E.; Molari, G. Outlining the mission profile of agricultural tractors through CAN-BUS data analytics. Comput. Electron. Agric. 2021, 184, 106078. [Google Scholar] [CrossRef]
  50. Mocera, F.; Somà, A. Analysis of a Parallel Hybrid Electric Tractor for Agricultural Applications. Energies 2020, 13, 3055. [Google Scholar] [CrossRef]
Figure 1. Reference fuel-cell-powered powertrain schematic representation.
Applsci 13 08582 g001
Figure 2. System layout.
Applsci 13 08582 g002
Figure 3. FCS-C300 characteristic curves.
Applsci 13 08582 g003
Figure 4. Control unit scheme.
Applsci 13 08582 g004
Figure 5. Experimental setup of the scaled test bench.
Applsci 13 08582 g005
Figure 6. PI-based control strategy for the current reference signal.
Applsci 13 08582 g006
Figure 7. Emulated FC V-I curve vs. real FC V-I curve.
Applsci 13 08582 g007
Figure 8. DC-DC converter and diode assembly efficiency.
Applsci 13 08582 g008
Figure 9. Images collected during the thermal test with the thermal camera: (AC) correspond respectively to 100, 200 and 300 W of power flow.
Applsci 13 08582 g009
Figure 10. Step-load response test results with different parameters of the PI controller.
Applsci 13 08582 g010
Figure 11. DST power profile.
Applsci 13 08582 g011
Figure 12. DST results in terms of power distribution and reference batteries’ SOC variation.
Applsci 13 08582 g012
Figure 13. Experimental data for the road transportation of an empty trailer.
Applsci 13 08582 g013
Figure 14. Experimental data for the 0–40 km/h acceleration test with a fully loaded trailer (6000 kg mass).
Applsci 13 08582 g014
Figure 15. Experimental results on the test bench for the road transportation of an empty trailer.
Applsci 13 08582 g015
Figure 16. Experimental results on the test bench for the acceleration test with a fully loaded trailer.
Applsci 13 08582 g016
Figure 17. Experimental data for the three attached implements.
Applsci 13 08582 g017
Figure 18. Experimental results on the test bench for the PTO tests.
Applsci 13 08582 g018
Figure 19. Fuel cell FCS-C300 hydrogen consumption curve.
Applsci 13 08582 g019
Figure 20. Estimated hydrogen flow and total consumption for the FCS-C300 during the handling of a trailer work scenarios.
Applsci 13 08582 g020
Figure 21. Estimated hydrogen flow and total consumption for the FCS-C300 during the work cycles with attached implements.
Applsci 13 08582 g021
Table 1. FCS-C300 main properties.
Number of cells60
Rated Power300 W @ 36 V
Voltage range58–30 V
Current range0–9.3 A
Table 2. Single battery main properties.
Battery technologyLead-acid
Nominal Voltage12 V
Max discharge current340 A
Capacity40 Ah
Table 3. DC-DC converter main properties.
Nominal power800 W
Input Voltage range20–70 V
Output Voltage range2.5–58 V
Max Input current20 A
Max Output current30 A
Table 4. Load unit element main properties.
Aim-TTi LD400P
Nominal continuous power400 W
Max short-term power600 W (max 60 s)
Voltage range0–80 V
Current range0–80 A
Operative modesConstant current; Constant power; Constant voltage; Constant resistance; Constant conductance
EA PS 2042-10 B
Nominal continuous power160 W
Voltage range0–42 V
Current range0–10 A
Table 5. Transducers’ main properties.
CAS 15-NP
MeasurementCurrent
Measuring range−51 ÷ 51 A
Supply voltage5 V
Accuracy0.8%
Output signal0.375 ÷ 4.625 V
LV 25-P
MeasurementVoltage
Measuring range10 ÷ 500 V
Supply voltage±12 V
Accuracy0.9%
Nominal output signal25 mA
Table 6. Fuel cell FCS-C300 estimated hydrogen consumption during the proposed tests.
Max H 2 Consumption (g/s)Total H 2 Consumption (g)
DST0.00150.1895
Handling empty trailer0.00160.1612
Handling loaded trailer0.00110.0391
Work-cycle atomizer0.00370.5242
Work-cycle shredder0.00231.098
Work-cycle rotary harrow0.00422.1723
Disclaimer/Publisher’s Note: The statements, opinions and data contained in all publications are solely those of the individual author(s) and contributor(s) and not of MDPI and/or the editor(s). MDPI and/or the editor(s) disclaim responsibility for any injury to people or property resulting from any ideas, methods, instructions or products referred to in the content.

