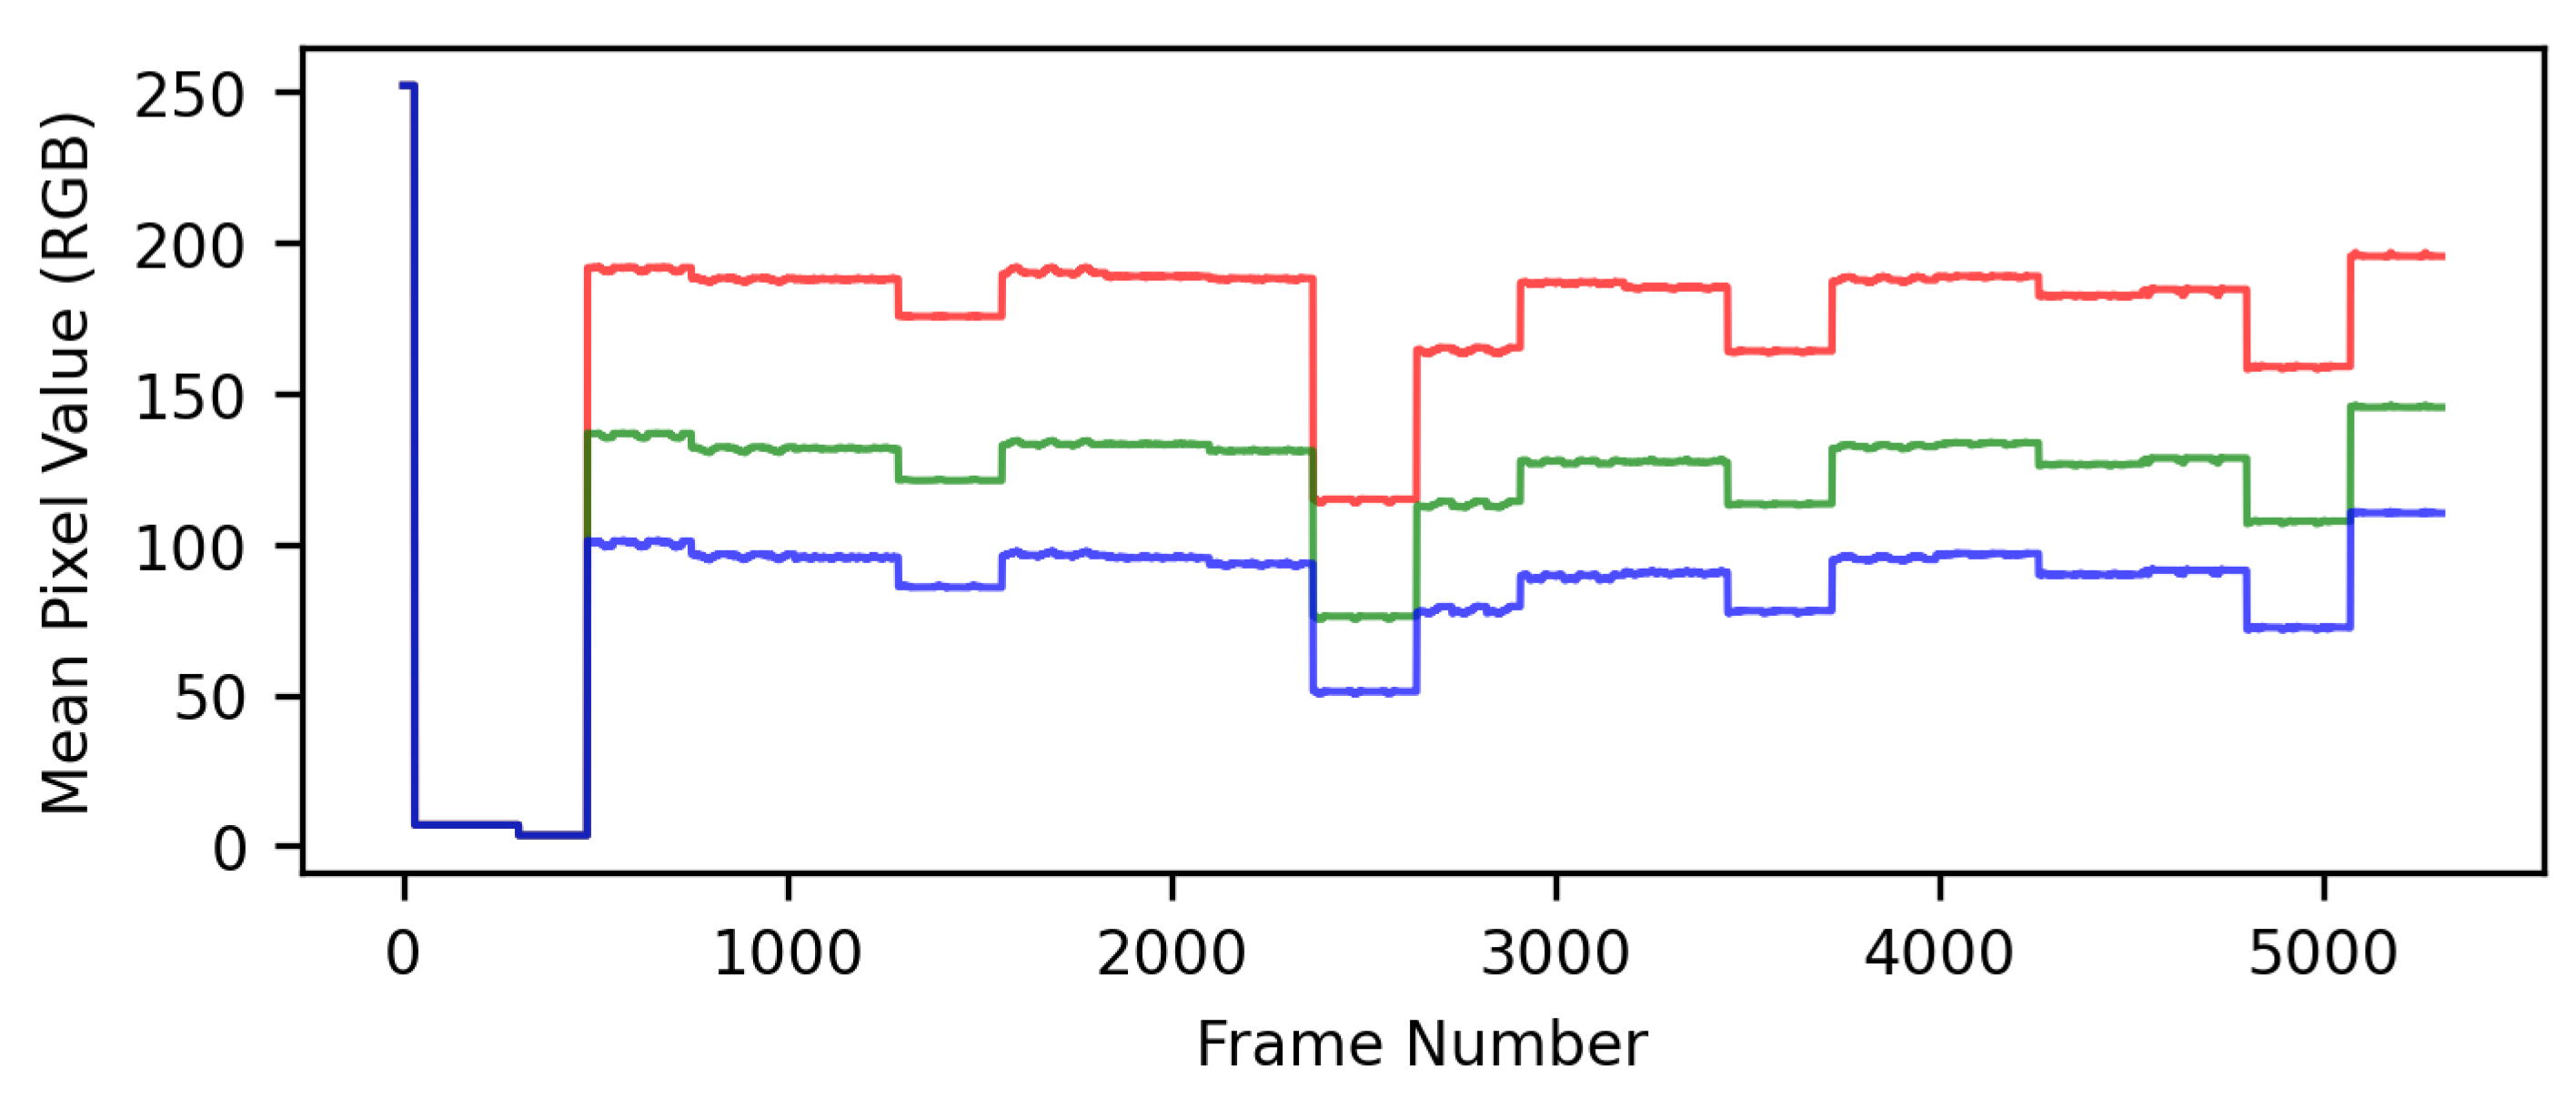
Figure 1.
Plot of mean pixel values for the red, green, and blue channels in the instructional film. Note the bright screen at the start of the instructional film, followed by the short dark section, and then the series of facial action stimuli that the participants are tasked with reproducing.
Figure 1.
Plot of mean pixel values for the red, green, and blue channels in the instructional film. Note the bright screen at the start of the instructional film, followed by the short dark section, and then the series of facial action stimuli that the participants are tasked with reproducing.
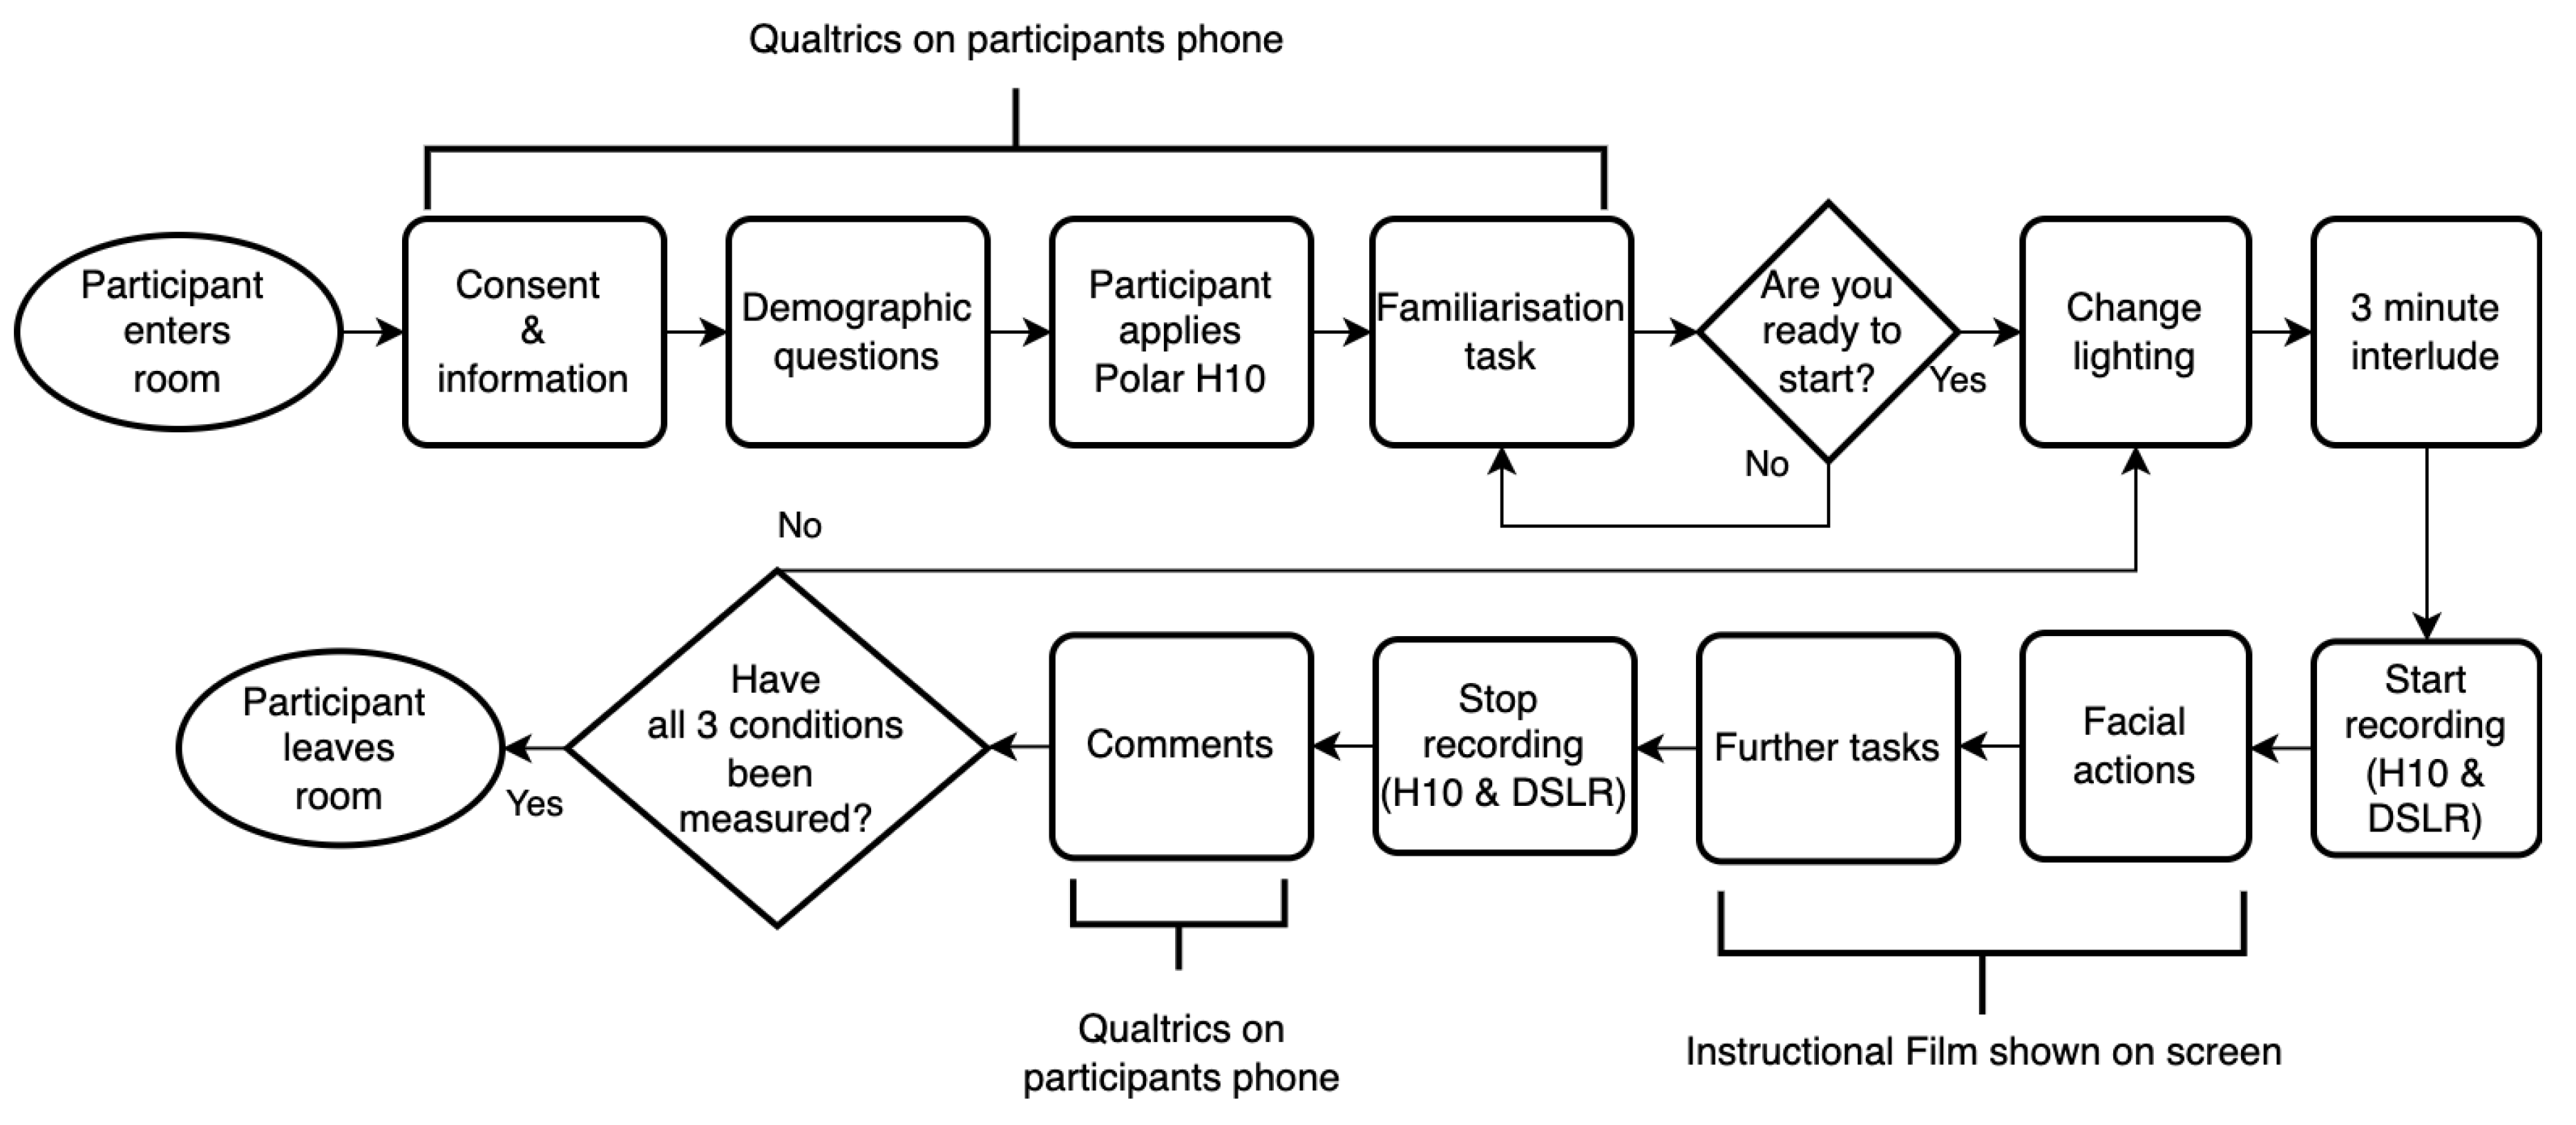
Figure 2.
Experimental protocol flow chart, showing each step in the study for each participant.
Figure 2.
Experimental protocol flow chart, showing each step in the study for each participant.
Figure 3.
Photograph taken in the room where the experiment took place, showing the participant’s chair, lighting, and position of the camera on a tripod under the television (highlighted by the white circle).
Figure 3.
Photograph taken in the room where the experiment took place, showing the participant’s chair, lighting, and position of the camera on a tripod under the television (highlighted by the white circle).
Figure 4.
Data preprocessing flow chart showing how all the data were collected for the study and processed ready for further analysis (see
Section 4).
Figure 4.
Data preprocessing flow chart showing how all the data were collected for the study and processed ready for further analysis (see
Section 4).
Figure 5.
Box plot showing the distribution of difficulty scores for each facial action as assessed by the participants in the study. The features of the box plot represent the minimum, maximum, and quartiles of the response distributions.
Figure 5.
Box plot showing the distribution of difficulty scores for each facial action as assessed by the participants in the study. The features of the box plot represent the minimum, maximum, and quartiles of the response distributions.
Figure 6.
Figure showing the mean of the camera-measured target facial action for each illumination condition for each frame, alongside the expected response associated with perfectly replicating the instructional film. Note that AU18 was accidentally included in the film despite not being recognised by OpenFace 2, hence data captured during this time was ignored.
Figure 7.
Box plot showing the distribution of MAE values quantifying the difference between the expected target facial action signal and the signal camera-measured signal for each illumination condition. Each cross, in the overlaid swarm plot, shows an individual value within the distribution. The means and standard deviation of the distributions are as follows: Bright (mean: 0.82, std: 0.10), Medium (mean: 0.84, std: 0.10), Dark (mean: 0.88, std: 0.08).
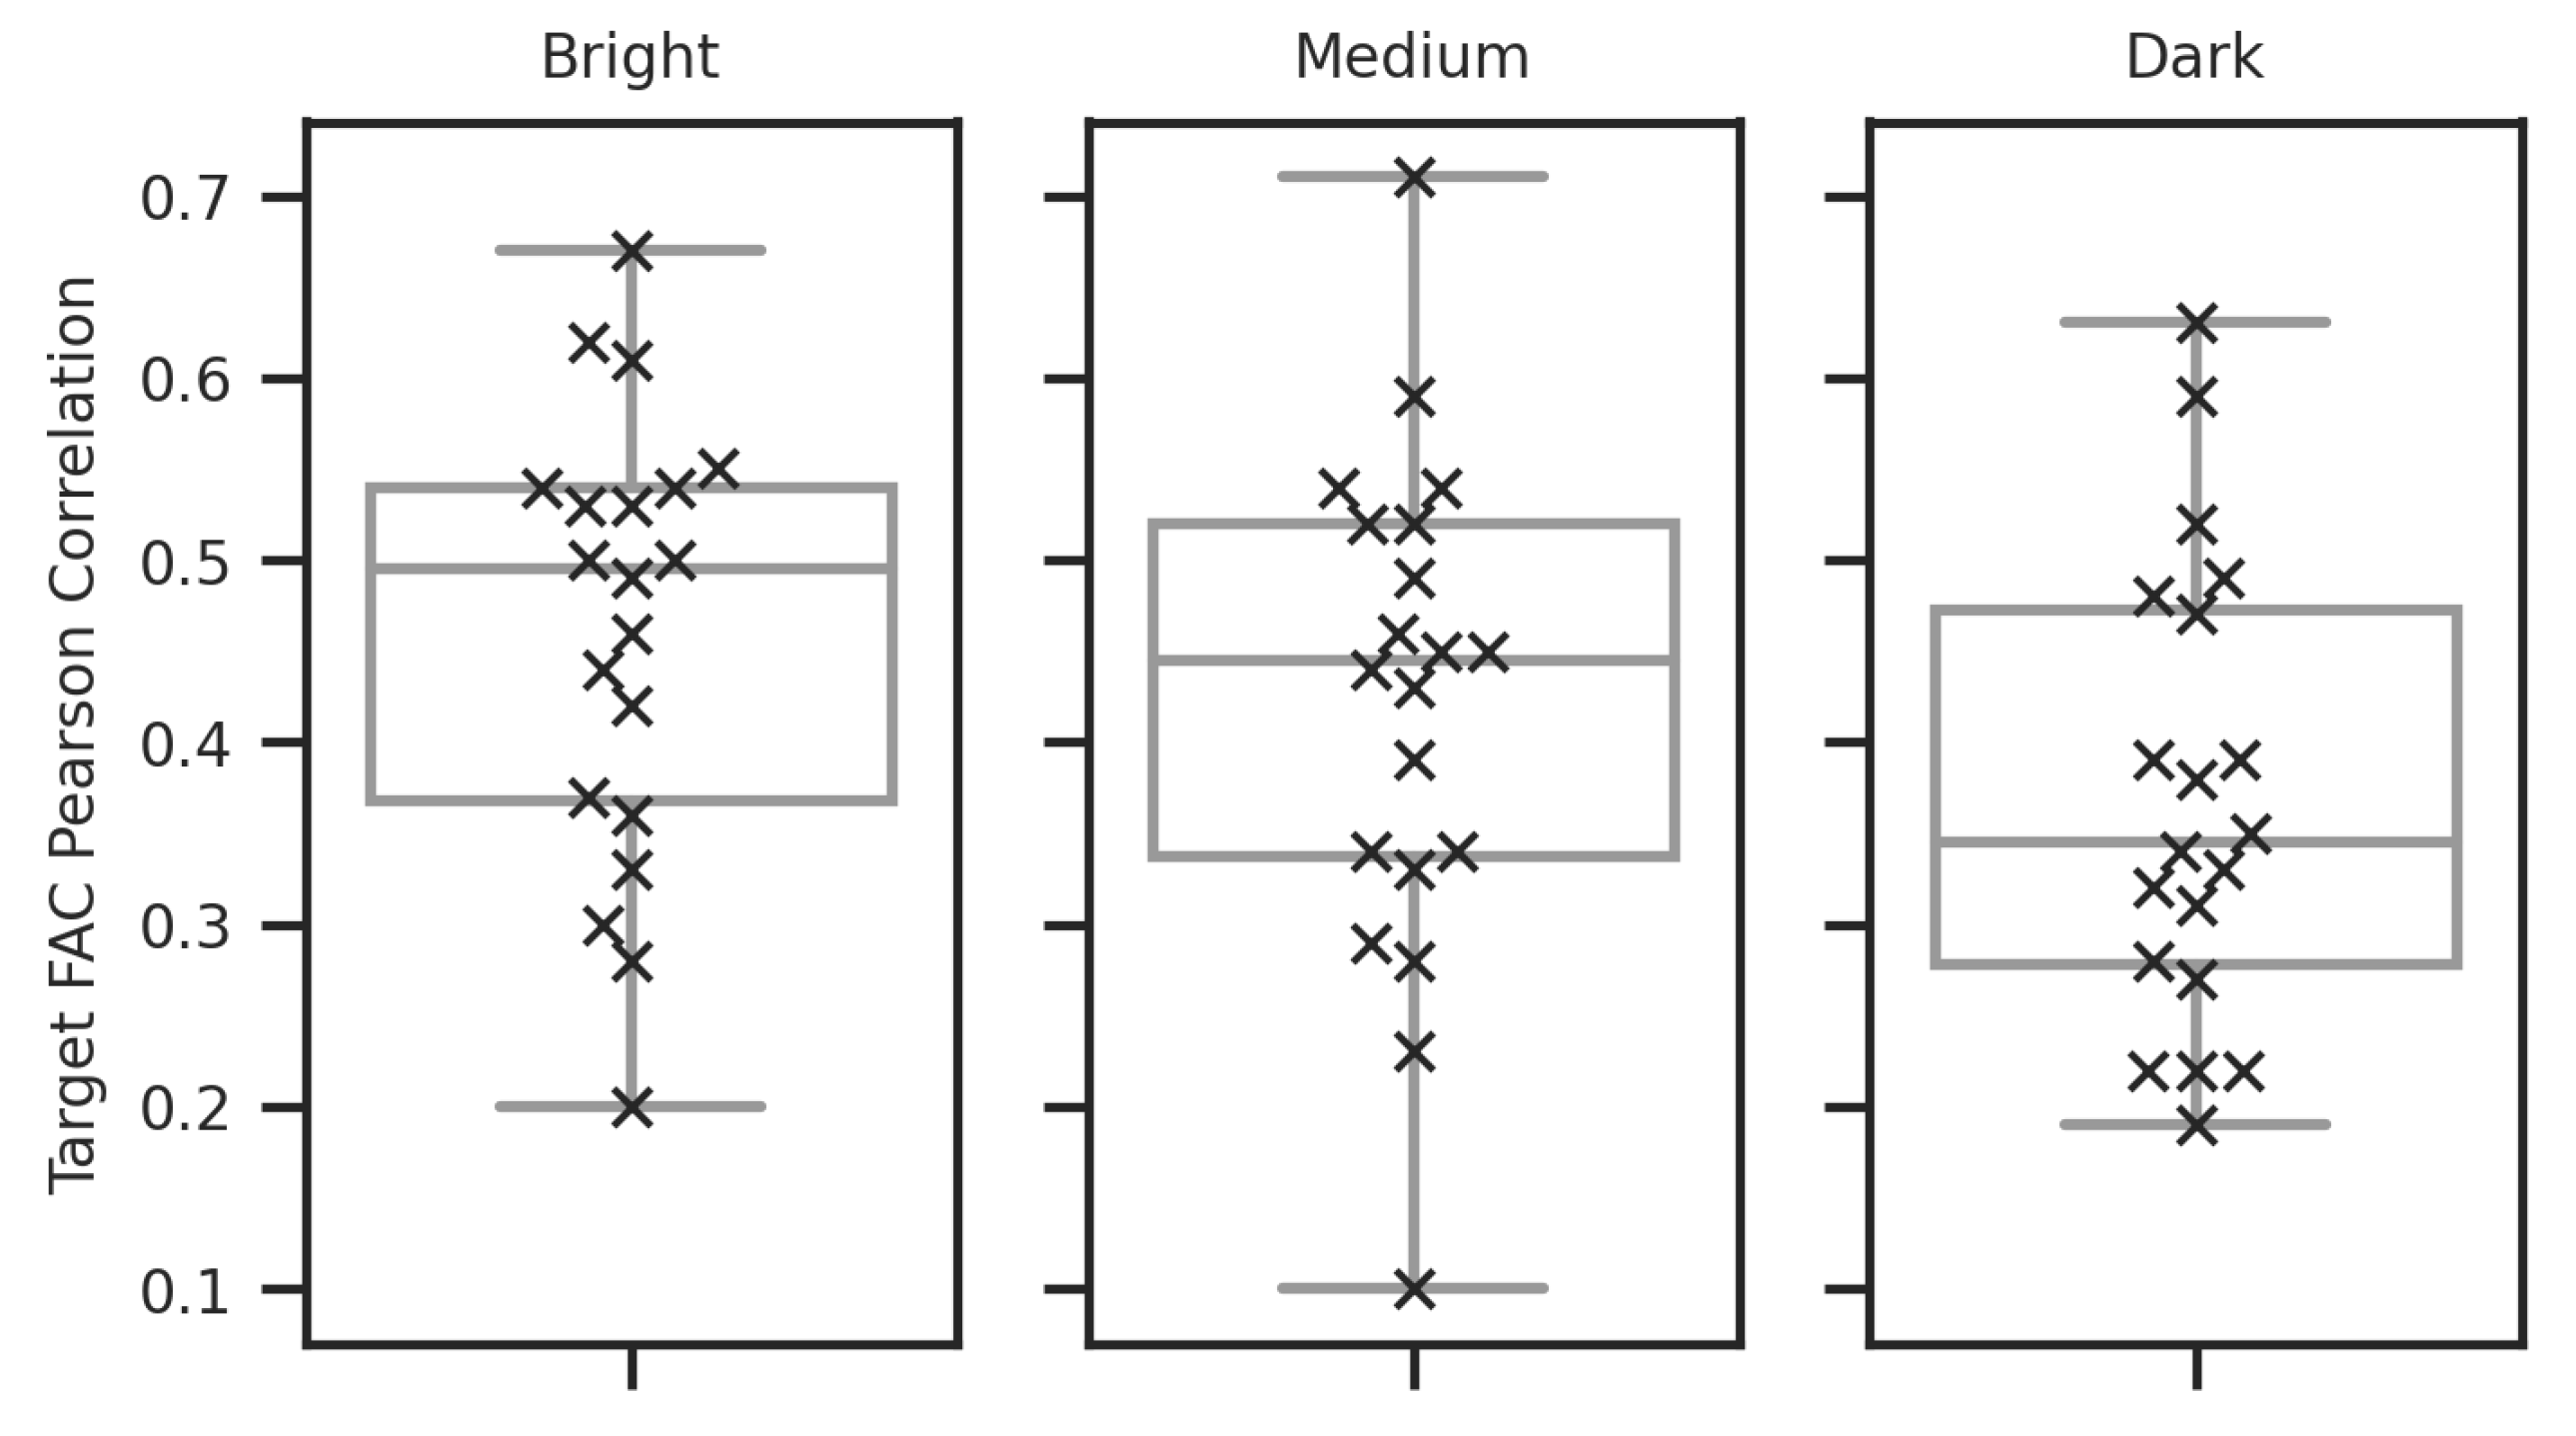
Figure 8.
Box plot showing the distribution of PCC values quantifying the relationship between the expected target facial action signal and the camera-measured signal for each illumination condition. Each cross, in the overlaid swarm plot, shows an individual value within the distribution. The means and standard deviation of the distributions are as follows: Bright (mean: 0.46, std: 0.12), Medium (mean: 0.42, std: 0.14), Dark (mean: 0.37, std: 0.12).
Figure 9.
Box plot showing the distribution of MAE values quantifying the difference between the expected target facial action signal and the camera-measured signal for each attempt at the facial actions task instructed by the film. Each cross, in the overlaid swarm plot, shows an individual value within the distribution. The means and standard deviation of the distributions are as follows: First (mean: 0.39, std: 0.13), Second (mean: 0.43, std: 0.14), Third (mean: 0.43, std: 0.12).
Figure 10.
Box plot showing the distribution of PCC values quantifying the relationship between the expected target facial action signal and camera-measured signal for each attempt at the facial actions task instructed by the film. Each cross, in the overlaid swarm plot, shows an individual value within the distribution. The means and standard deviation of the distributions are as follows: First (mean: 0.87, std: 0.10), Second (mean: 0.84, std: 0.10), Third (mean: 0.84, std: 0.09).
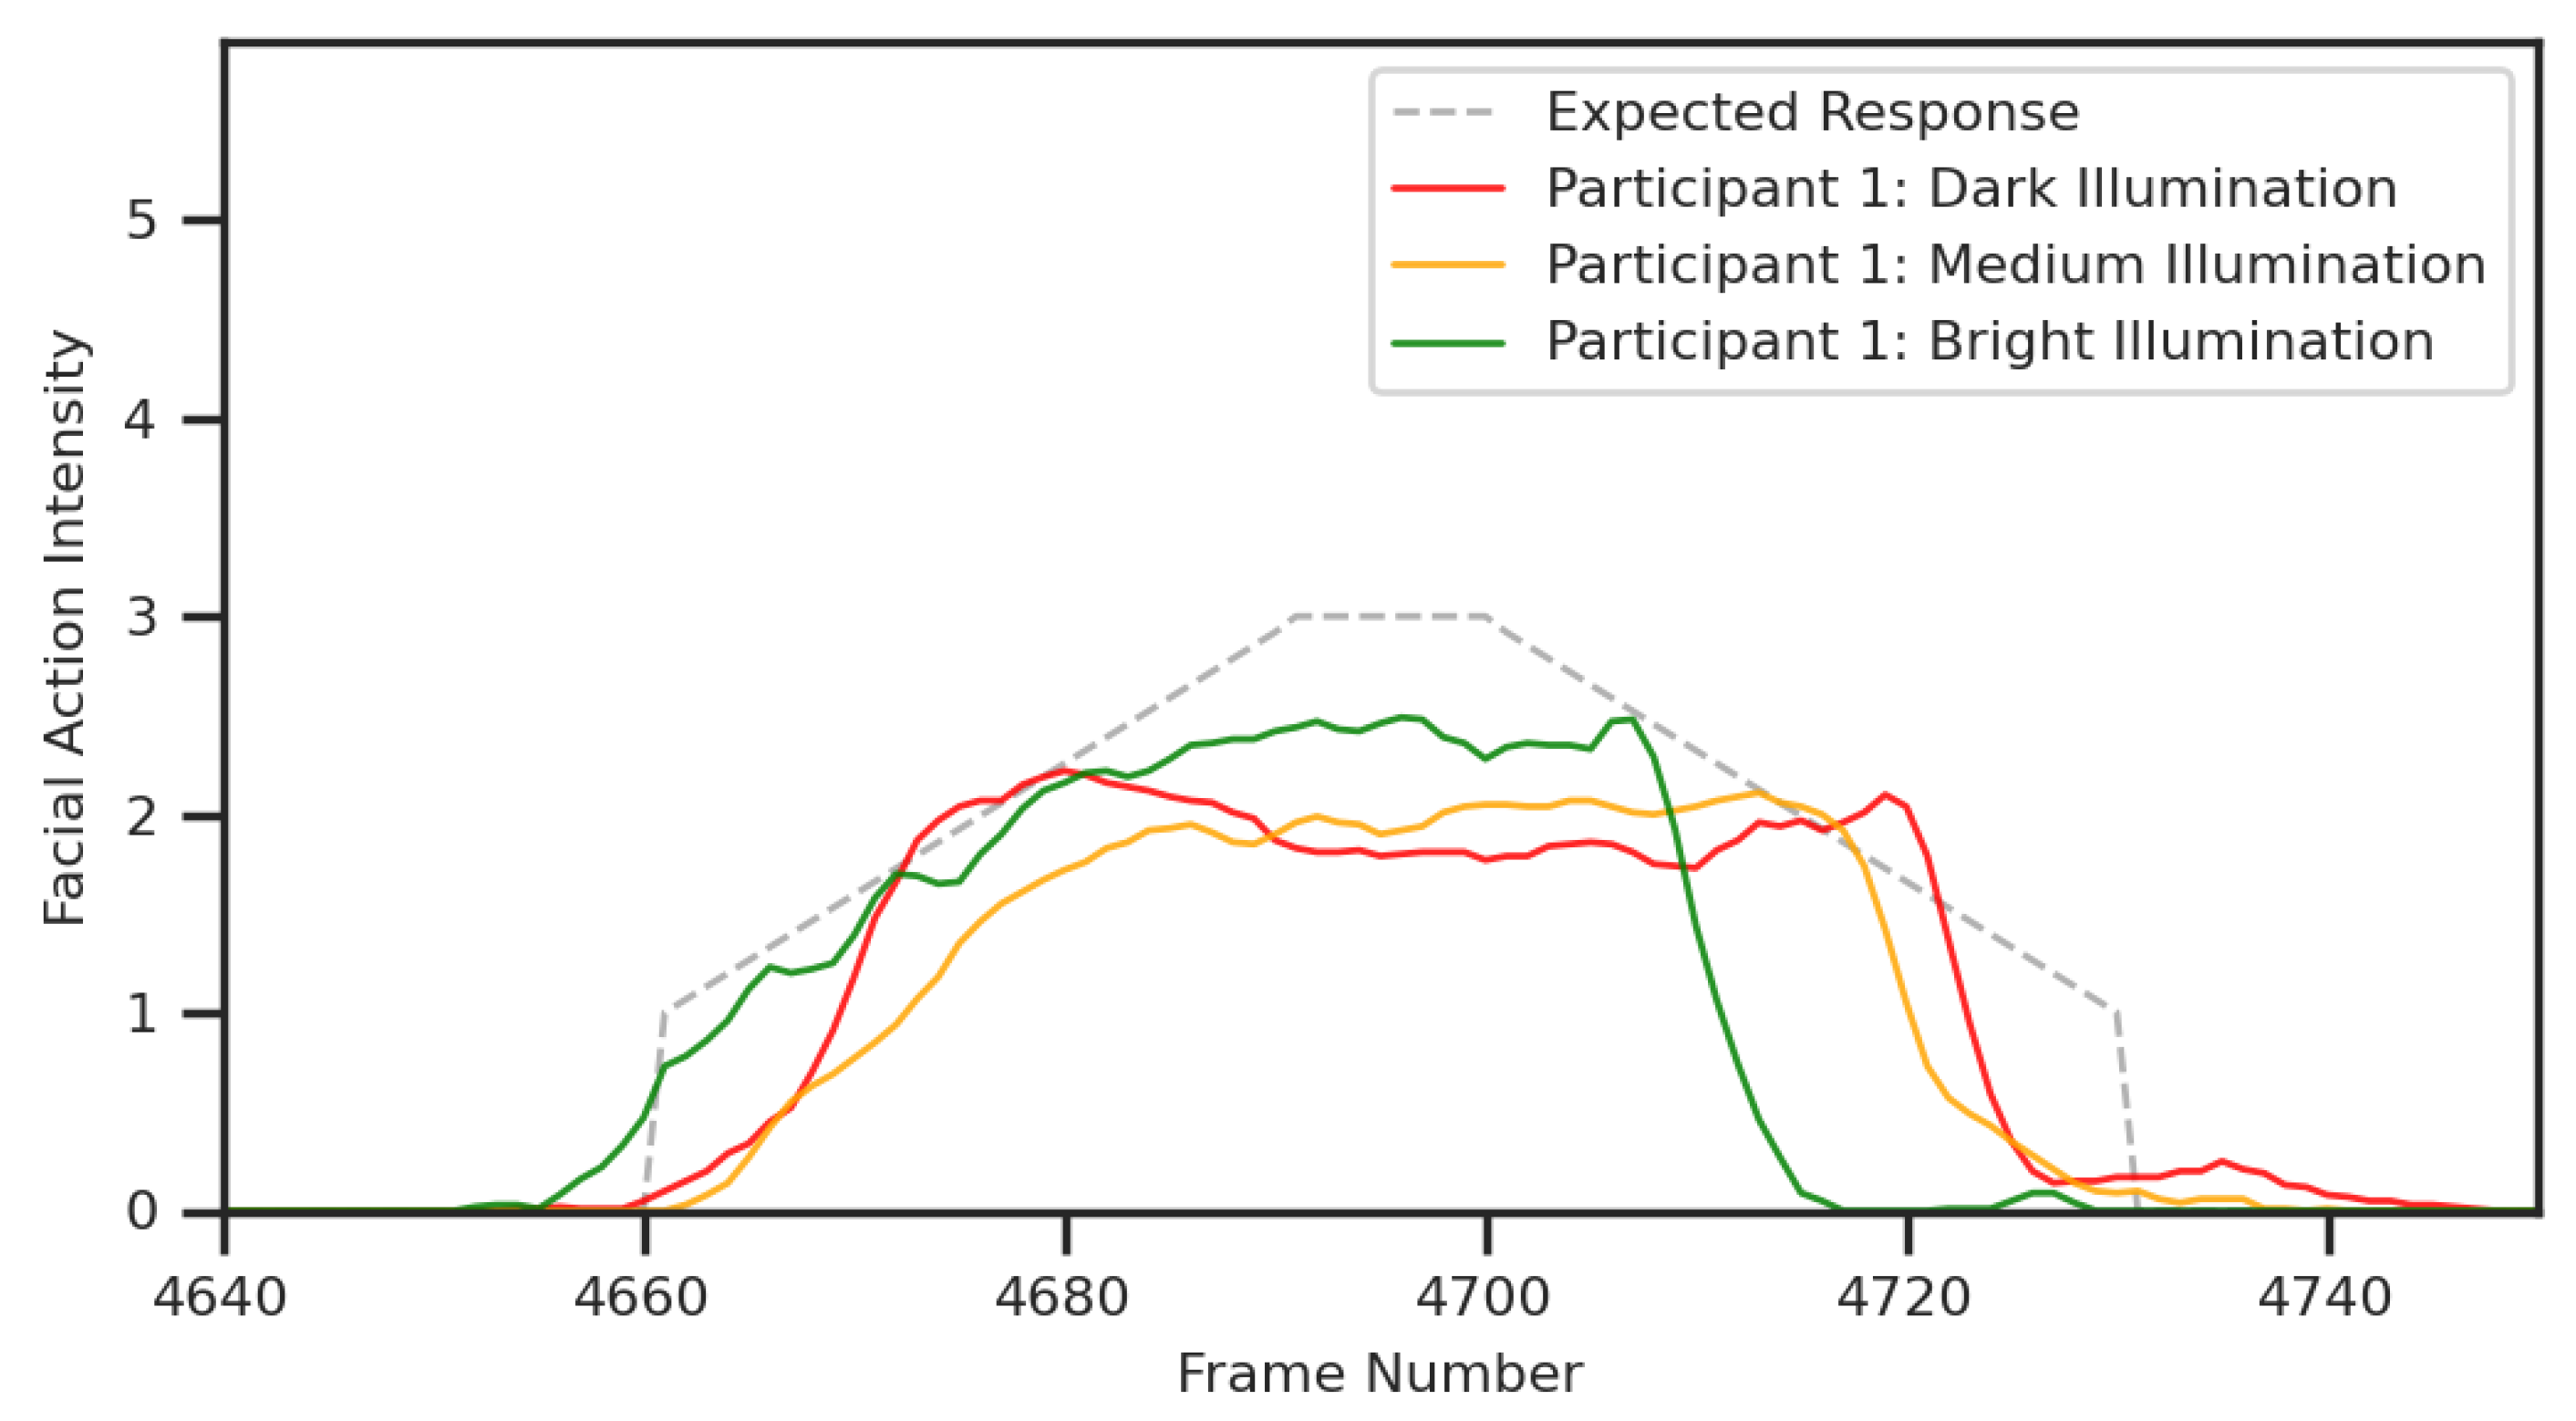
Figure 11.
Figure showing the camera-measured response for participant one to the AU12 facial action for each illumination condition, alongside the expected response associated with perfectly replicating the instructional film. Note that the camera-measured data from all three conditions are lower in magnitude than the expected response, contain values between zero and one, and contain small erratic changes in magnitude.
Figure 12.
Power spectral density of recorded facial action code data from
OpenFace 2, for the target expression. Research into the speed of microexpressions suggests that there should be no frequency components to the right of the grey line (15.38 Hz) [
71].
Figure 12.
Power spectral density of recorded facial action code data from
OpenFace 2, for the target expression. Research into the speed of microexpressions suggests that there should be no frequency components to the right of the grey line (15.38 Hz) [
71].
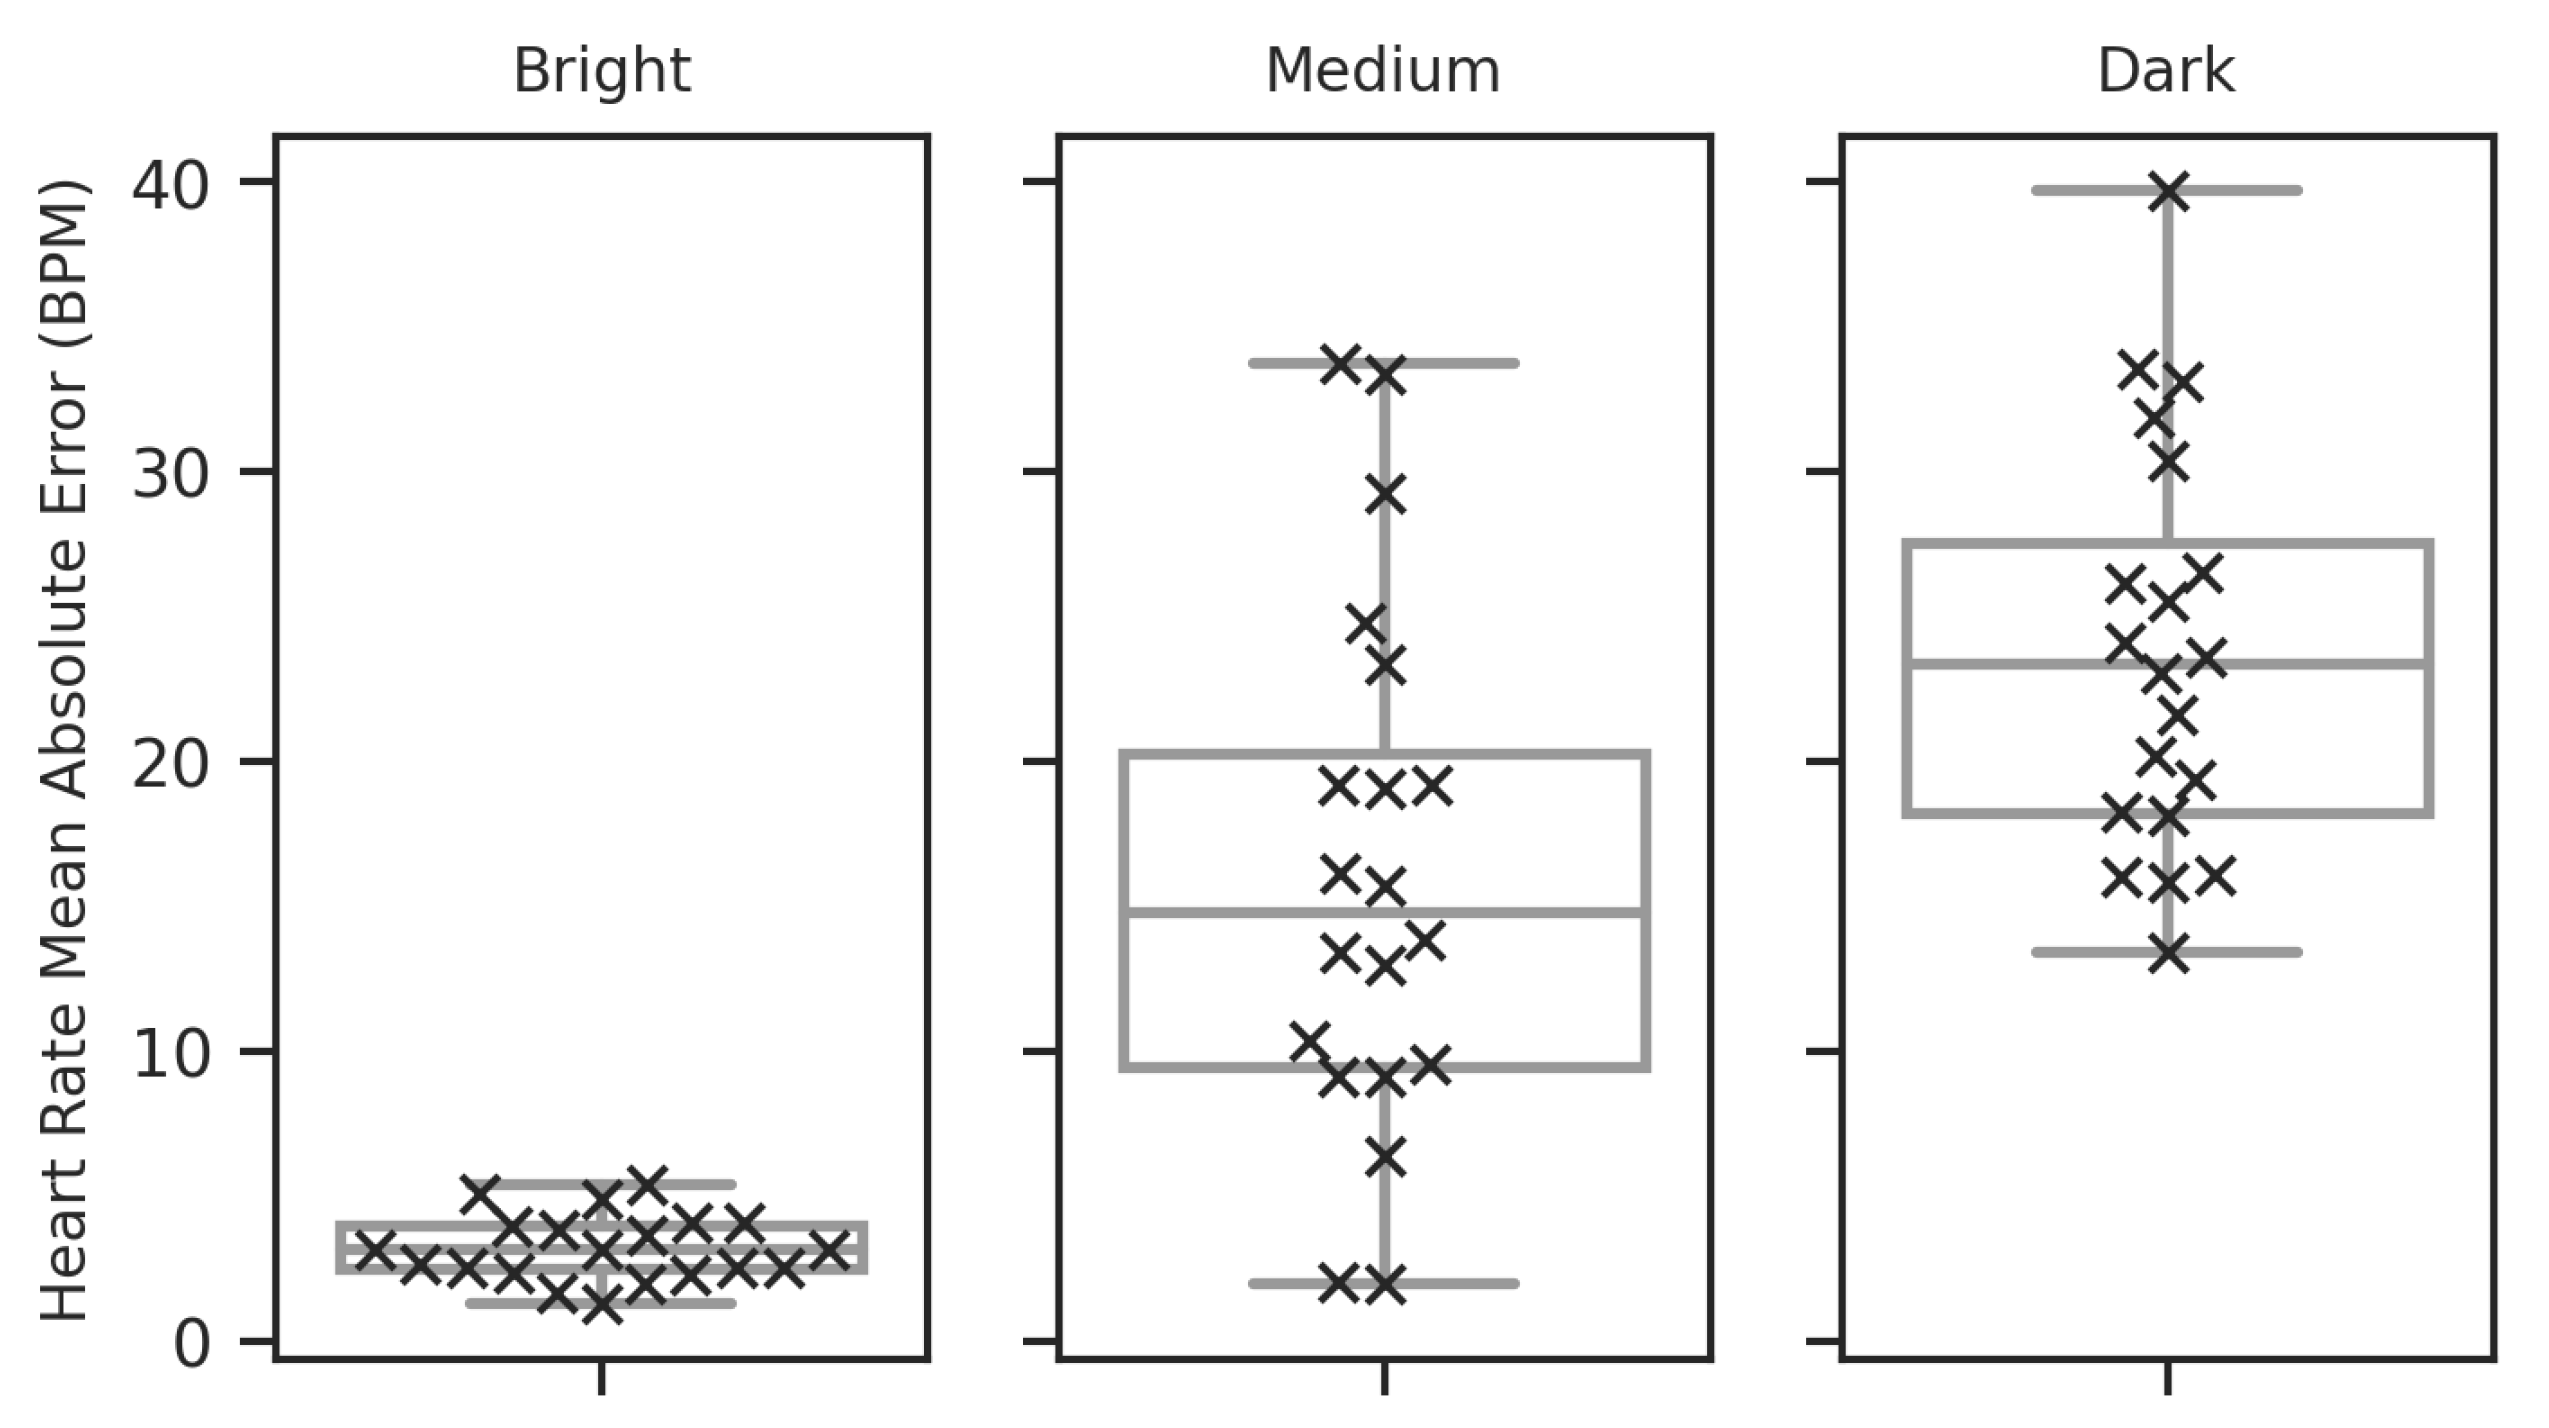
Figure 13.
Box plot showing the distribution of MAE values quantifying the difference between the expected target heart rate signal from the contact sensor and the camera-measured signal for each illumination condition. Each cross, in the overlaid swarm plot, shows an individual value within the distribution. The means and standard deviation of the distributions are as follows: Bright (mean: 3.20, std: 1.11), Medium (mean: 16.12, std: 9.01), Dark (mean: 23.81, std: 6.89).
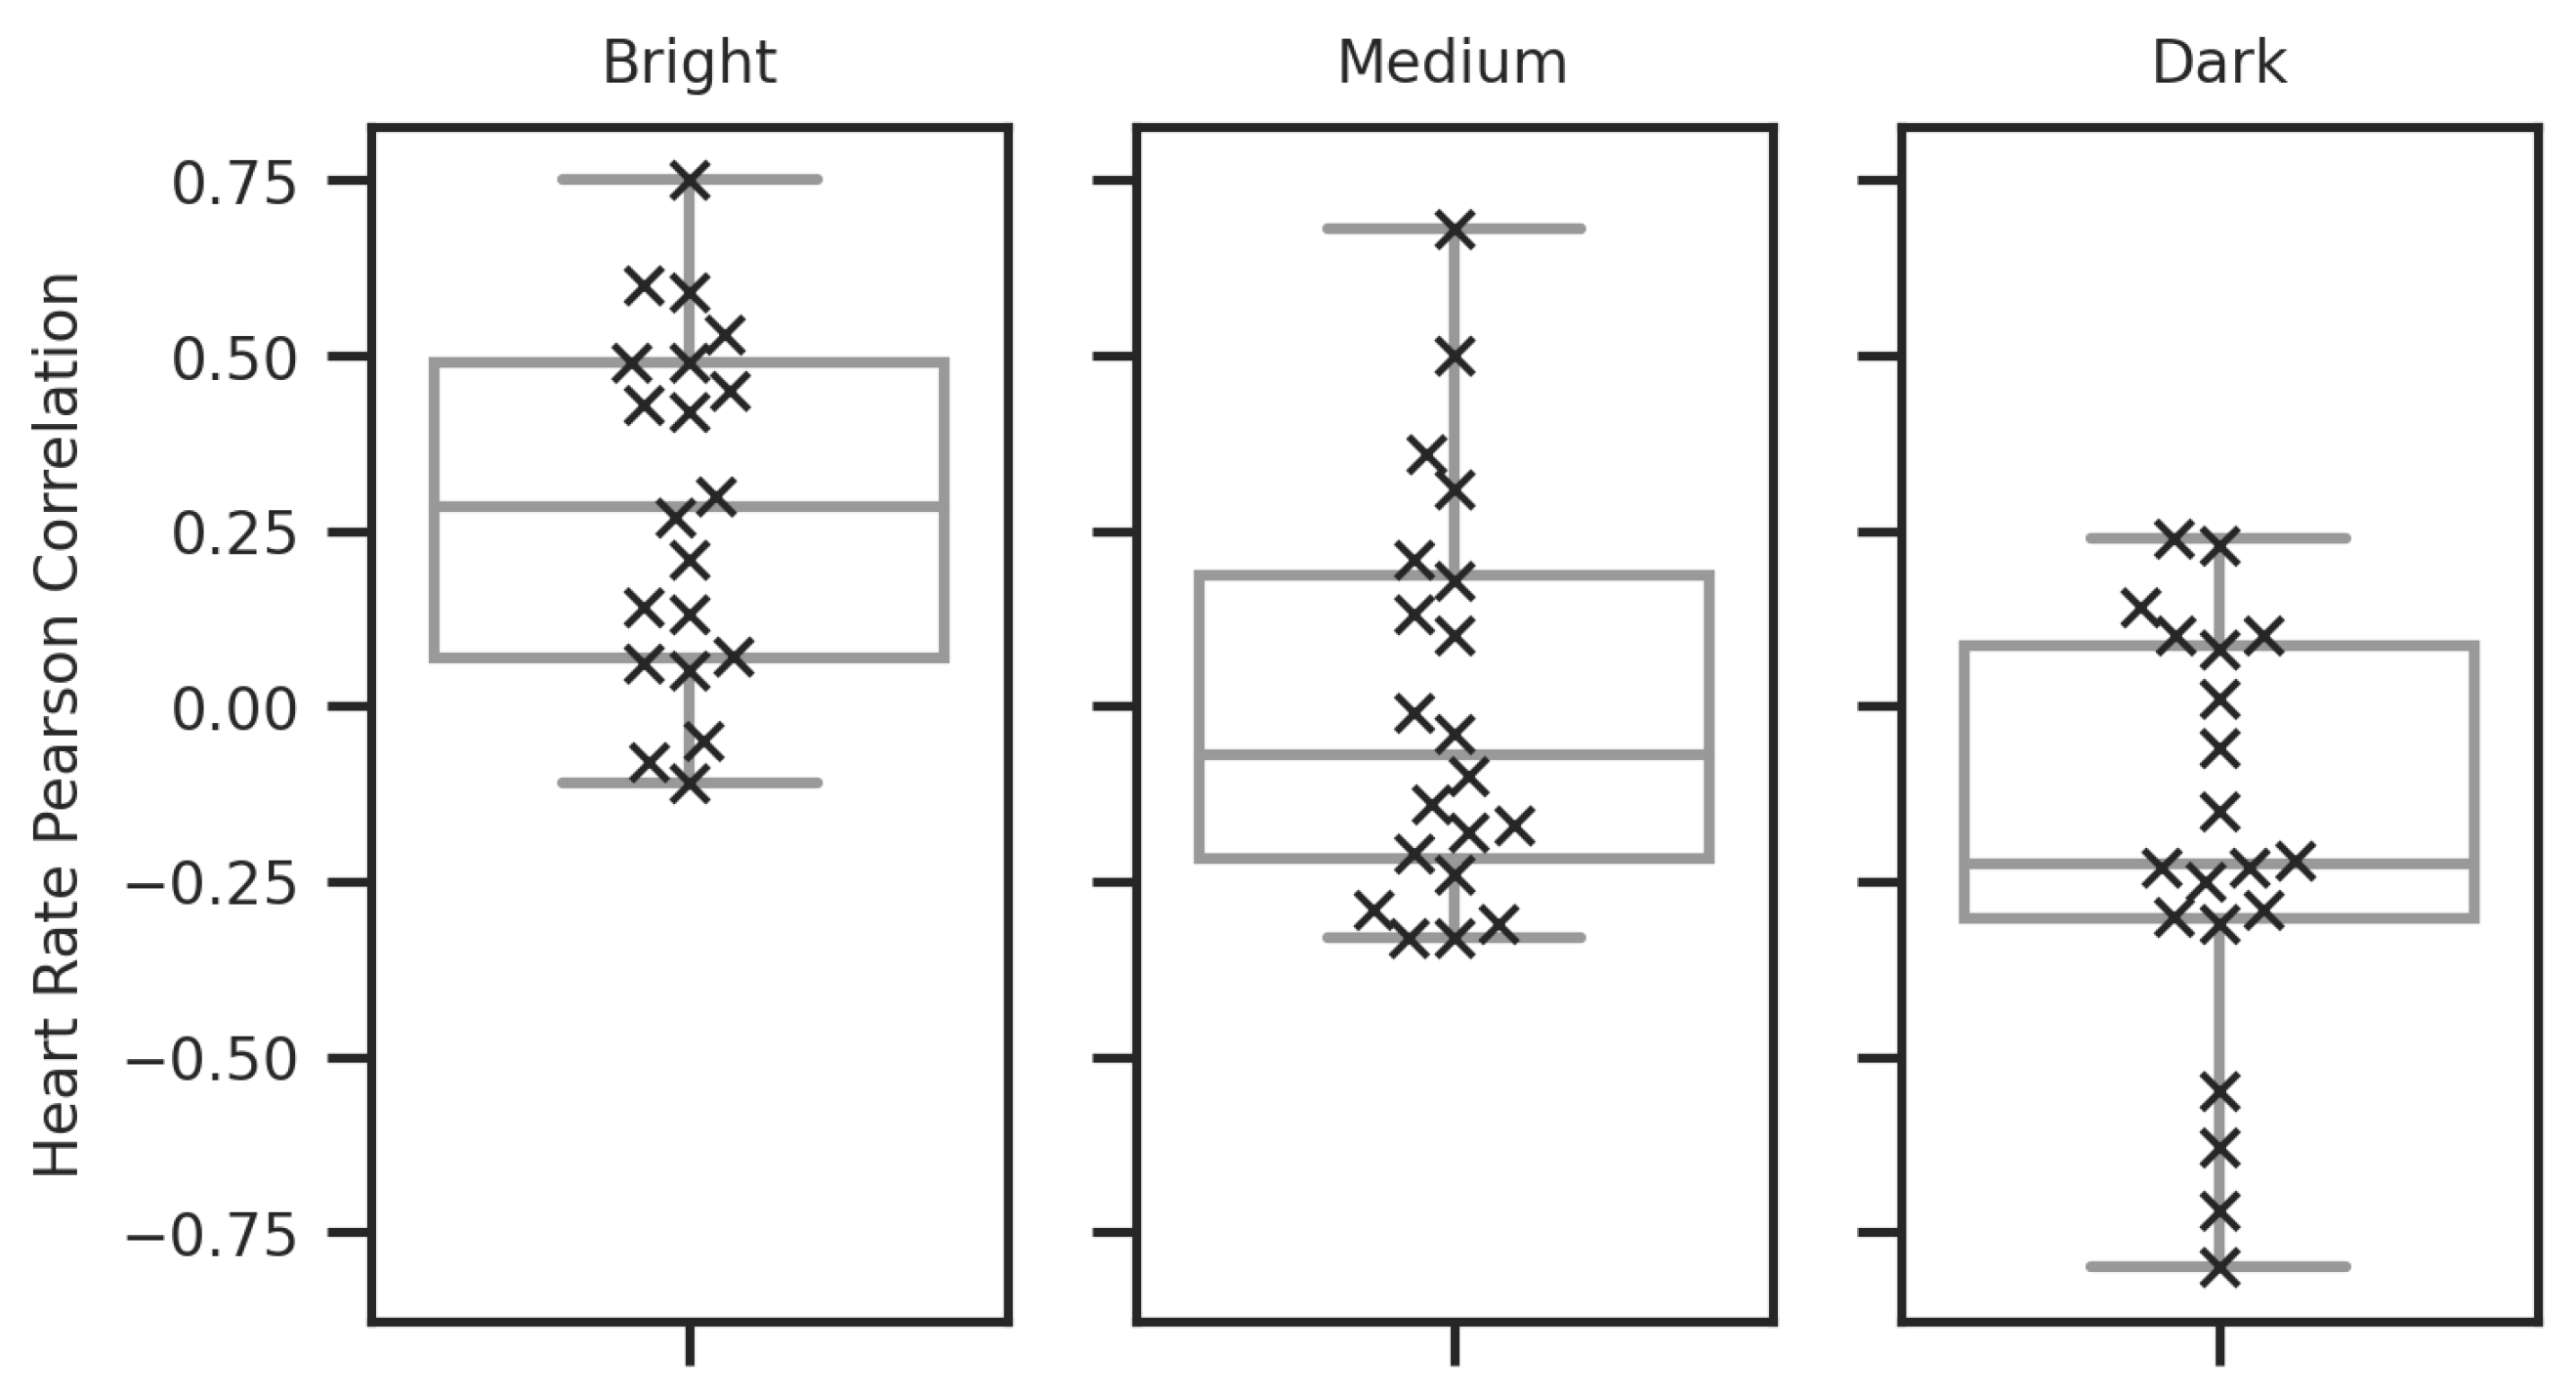
Figure 14.
Box plot showing the distribution of PCC values quantifying the relationship between the expected target heart rate signal from the contact sensor and the camera-measured signal for each illumination condition. Each cross, in the overlaid swarm plot, shows an individual value within the distribution. The means and standard deviation of the distributions are as follows: Bright (mean: 0.28, std: 0.24), Medium (mean: 0.01, std: 0.29), Dark (mean: 0.19, std: 0.30).
Figure 15.
Mean difference between the camera-measured HR and the HR measured by the contact sensor for each sample in each illumination condition.
Figure 15.
Mean difference between the camera-measured HR and the HR measured by the contact sensor for each sample in each illumination condition.
Figure 16.
Example comparing the camera-measured signal and the physical heart rate sensor for a video captured in the bright illumination condition. Note the spiking behaviour in the camera-measured data.
Figure 16.
Example comparing the camera-measured signal and the physical heart rate sensor for a video captured in the bright illumination condition. Note the spiking behaviour in the camera-measured data.
Figure 17.
Two-dimensional histogram showing the relationship between the camera-measured heart rate values and the expected values as measured by the contact sensor, for each sample under each illumination condition. The dotted line describes where the two measures are equal. A bin size of ten helps characterise the relationship between the two variables clearly.
Table 1.
Description of each sub-process used to estimate heart rate from a video signal within the PyVHR pipeline. Note that the demo workbook implementation was used to obtain heart rate data in the study described later in this manuscript, with the 6-patch approach rather than the 100-patch approach for skin extraction.
| Name of Subprocess | Description in PyVHR Documentation [3] | Implementation in PyVHR Demo Workbook [2] |
|---|
| Skin extraction | “The goal of this first step is to perform a face skin segmentation in order to extract PPG-related areas; the latter are subsequently collected in either a single patch (holistic approach) or a bunch of “sparse” patches covering the whole face (patch-wise approach).” | A set of 100 equidistant patches are selected across the face. Alternatively, code is provided for the selection of 6 patches: 3 on the forehead, 1 on the nose, and 1 on each cheek. |
| RGB signal processing | “The patches, either one or more, are coherently tracked and are used to compute the average colour intensities along overlapping windows, thus providing multiple time-varying RGB signals for each temporal window” | The RGB signals are obtained by taking the mean value of each patch across cascading 8-s windows, with a stride of 1-s. |
| Pre-filtering | “Optionally, the raw RGB traces are pre-processed via canonical filtering, normalization or de-trending; the outcome signals provide the inputs to any subsequent rPPG method.” | Pixel values below 0 or above 230 are removed from patches. Then a sixth-order Butterworth bandpass filter with a passband between 0.75 Hz and 4 Hz is applied. |
| BVP extraction | “The rPPG method(s) at hand is applied to the time-windowed signals, thus producing a collection of heart rate pulse signals (BVP estimates), one for each patch.” | The CHROM method is applied [31]. |
| Post-filtering | “The pulse signals are optionally passed through a narrow-band filter in order to remove unwanted out-of-band frequency components.” | A sixth-order Butterworth bandpass filter with a passband between 0.75 Hz and 4 Hz is applied. |
| BPM estimation | “A BPM estimate is eventually obtained through simple statistics relying on the apical points of the BVP power spectral densities.” | The power spectral density (PSD) of each window of each patch of the filtered BVP estimate is calculated. Then, the median of the PSD peak frequency for all patches for that window is converted into a BPM value. |
Table 2.
Description of the sample ascertained from responses to the questions presented to each participant at the start of the study.
Table 2.
Description of the sample ascertained from responses to the questions presented to each participant at the start of the study.
| Participant Question | Option | Frequency | % |
|---|
| Gender | Female | 3 | 15 |
| | Male | 17 | 85 |
| Factor in last 3 h | Nicotine | 2 | 10 |
| | Alcohol | 1 | 5 |
| | Caffeine | 13 | 65 |
| | Exercise | 1 | 5 |
| | None | 5 | 25 |
| Glasses | Yes | 11 | 55 |
| | No | 9 | 45 |
| Facial hair | Yes | 7 | 35 |
| | No | 13 | 65 |
Table 3.
Description of the illumination conditions, made up of the illumination incident on the participant due to the screen and the room lighting. The minimum illumination measurement was made with the television displaying a black screen and the maximum with a white screen.
Table 3.
Description of the illumination conditions, made up of the illumination incident on the participant due to the screen and the room lighting. The minimum illumination measurement was made with the television displaying a black screen and the maximum with a white screen.
| Illumination | Direction | Maximum (lux) | Minimum (lux) |
|---|
| Bright | Upward | 370 | 349 |
| | Forward | 270 | 192 |
| Medium | Upward | 60 | 46 |
| | Forward | 93 | 23 |
| Dark | Upward | 5 | 0 |
| | Forward | 20 | 0 |
Table 4.
Table showing the order in which the illumination conditions were presented. Note the imperfect outcomes of the counterbalancing process automatically managed by Qualtrics. Ideal counterbalancing would lead to all values in the frequency column being the same.
Table 4.
Table showing the order in which the illumination conditions were presented. Note the imperfect outcomes of the counterbalancing process automatically managed by Qualtrics. Ideal counterbalancing would lead to all values in the frequency column being the same.
| Illumination | Trial Order | Frequency | % |
|---|
| Bright | First | 9 | 45 |
| | Second | 5 | 25 |
| | Third | 6 | 30 |
| Medium | First | 4 | 20 |
| | Second | 6 | 30 |
| | Third | 10 | 50 |
| Dark | First | 7 | 35 |
| | Second | 9 | 45 |
| | Third | 4 | 20 |
Table 5.
Results of dependent t-tests assessing differences in mean for the performance metric distributions between illumination conditions, for automatic FAC. Statistically significant differences in mean are shown in bold.
Table 5.
Results of dependent t-tests assessing differences in mean for the performance metric distributions between illumination conditions, for automatic FAC. Statistically significant differences in mean are shown in bold.
| FAC Distributions for Comparison | t-Test (A vs. B) |
|---|
| Metric | Condition A | Condition B | t | p |
| PCC | Dark | Medium | −2.299 | 0.033 |
| | Dark | Bright | −4.109 | <0.001 |
| | Medium | Bright | −2.156 | 0.044 |
| MAE | Dark | Medium | 2.428 | 0.025 |
| | Dark | Bright | 3.977 | 0.001 |
| | Medium | Bright | 1.566 | 0.134 |
Table 6.
Results of dependent t-tests assessing differences in mean for the performance metric distributions between illumination conditions for heart rate estimation. Statistically significant differences in mean are shown in bold.
Table 6.
Results of dependent t-tests assessing differences in mean for the performance metric distributions between illumination conditions for heart rate estimation. Statistically significant differences in mean are shown in bold.
| HR Distributions for Comparison | t-Test (A vs. B) |
|---|
| Metric | Condition A | Condition B | t | p |
| PCC | Dark | Medium | −1.901 | 0.036 |
| | Dark | Bright | −5.788 | <0.001 |
| | Medium | Bright | −3.327 | 0.002 |
| MAE | Dark | Medium | 2.724 | 0.007 |
| | Dark | Bright | 12.044 | <0.001 |
| | Medium | Bright | 6.403 | 0.001 |


