Article

The Synergistic Effect between Precipitation and Temperature for the NDVI in Northern China from 2000 to 2018

1
College of Water Conservancy and Civil Engineering, Inner Mongolia Agricultural University, Hohhot 010018, China
2
Bayannur City Hydrology and Water Resources Survey Center, Bayannur 015000, China
*
Author to whom correspondence should be addressed.
Appl. Sci. 2023, 13(14), 8425; https://doi.org/10.3390/app13148425
Submission received: 9 June 2023 / Revised: 9 July 2023 / Accepted: 17 July 2023 / Published: 21 July 2023
(This article belongs to the Section Ecology Science and Engineering)

Abstract

:
Based on monthly precipitation (P), temperature (T) data, and remote sensing images collected from March 2000 to February 2019, this article was constructed to reveal the synergistic effect between P and T for the NDVI in northern China qualitatively and quantitatively by using a one-variable linear regression, the coefficient of variation, multivariate correlation coefficients, and a geodetector. The results show that the NDVI in the study area decreased from 2000 to 2012, increased from 2013 to 2018, decreased in the west, and increased in the east of Northern China. Overall, the NDVI, P, and the average maximum temperature (Tmax) had the strongest multivariate correlations (approximately 43.4% of the total study area passed the 95% confidence level significance test), followed by the average temperature (Tave) and average minimum temperature (Tmin). The explanatory power of the synergistic effect between P and Tmax for the NDVI was the strongest, with the value of explanatory power varying from 0.41 to 0.81, followed by Tave and Tmin. Spatially, the explanatory power of the synergistic effect between P and T for the NDVI was strengthened overall in the study area from northwest to southeast. The annual change rate of the explanatory power showed that the overall explanatory power between P and T for the NDVI in the study area was weakened in the central area and strengthened in the east and the west. Specifically, the synergistic effect between P and T on the NDVI was weakened in both Shaanxi and Ningxia Huizu Zizhiqu, while the opposite occurred in Xinjiang Uygul Zizhiqu, Qinghai, and another five provinces in the eastern part of the study area.

1. Introduction

Vegetation is a comprehensive indicator of the ecological environment [1,2], and having suitable hydrothermal conditions is the key element for vegetation growth. Yet, the synergistic effect of multiple climatic factors on vegetation remains unclear.
Spotvgt NDVI [3], Avhrr NDVI [4], Modis NDVI [5], and other datasets have been used by many scholars to carry out research on the characteristics of vegetation change and the vegetation response to natural factors such as P [6], T [7,8], surface temperature, evaporation [9], soil moisture [10], land water storage [11], and other factors on different time scales, such as yearly [12,13], seasonal [14,15], and monthly [16]. Research methods include the standard regression coefficient [17], wavelet analysis [18], Mann–Kendall trend test [19], geographically weighted regression [20], BRT model [21], and ANOVA [22]. The study areas covered the whole world [23,24,25], Eurasia [7,26,27,28], eastern Africa [29,30], Australia [31,32,33], China [34,35], and other areas. The results show that vegetation has been expanding in most parts of the world since the 1980s [11], and the net primary productivity has increased by about 13%. However, differences between the northern and southern hemispheres are significant. The vegetation in the northern hemisphere has been growing significantly due to increases in T, while that in the southern hemisphere has been declining due to a P limitation [23]. The vegetation in Eurasia has expanded as a whole, and there is a pronounced positive correlation with P in arid and semi-arid regions [26,27]. Vegetation change in eastern Europe and western Siberia is closely related to the sea surface temperature, soil moisture, and other factors [9,28]. In central Asia, vegetation and T complement each other, while in southern Asia, vegetation is mainly controlled by P during drought periods and T during rainy periods [36]. Vegetation in eastern Africa has shrunk, and water, altitude, and El Niño—Southern Oscillation are all important influencing factors [29,30]. Except for in April and October, vegetation in Australia has decreased overall and is positively/negatively correlated with P/T, and this correlation has a lag period ranged from 0 to 3 months [32,33]. The overall vegetation in China has increased [35]. For example, in northern China, the growing season NDVI increased at a rate of 0.0005 yr−1 from 1982 to 2011 [37], and the average yearly NDVI increased by 0.001 yr−1 between 1998 and 2015 in the north of Xinjiang Uygul Zizhiqu [38]. Generally, vegetation has positive correlations with P, Tave, surface temperature, average water vapor pressure, and relative humidity [10]. Some scholars have also proposed that the relationship between P and T has different impacts on different types of vegetation; for example, the warm–dry relationship forced the distribution boundary of Pinus tabuliformis to shrink northward in the semi-arid region of northeast China and also caused the degeneration of meadows in Qinghai province [39,40].
There have been many studies on the correlations between the NDVI and individual climate factors, such as P or T [6,7,8], but only a few studies have been conducted on the multivariate correlation between the NDVI and multiple climate factors, and the similarities and differences in the multivariate correlation between the NDVI and multiple climate factors are still unclear. It is also difficult to measure and quantify the synergistic effects of multiple climate factors for the NDVI on the basis of a correlation analysis, let alone revealing trends in such synergies. In summary, in order to ensure the research results were representative and comprehensive, northern China was chosen as the study area. Compared with areas where hydrothermal conditions are better, northern China is more sensitive to environmental change, and its ecosystem is more vulnerable, and more research on vegetation, P, and T is needed to provide a reference for ecological restoration and rational water resource allocation. The study not only enriches the research results in this field but also provides a reference for ecological environment improvement.

2. Materials and Methods

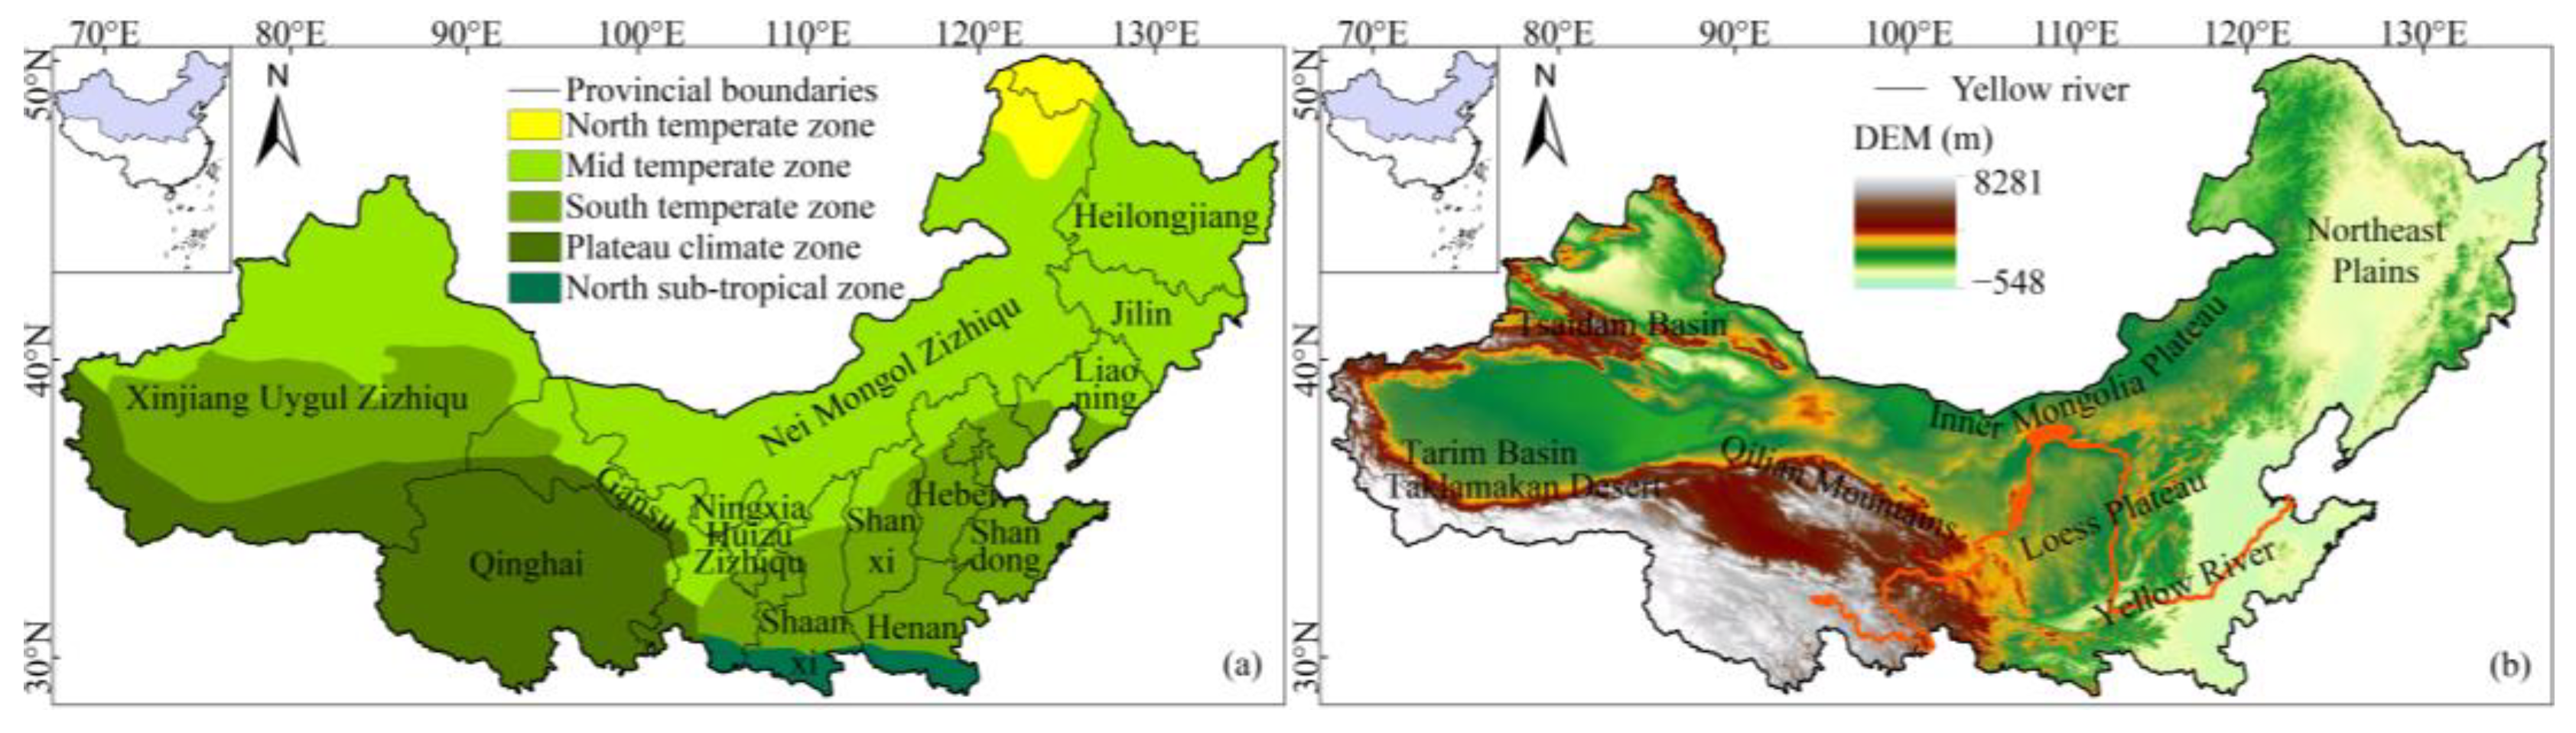
2.1. Overview of the Study Area

Generally, the Qinling Mountains and Huaihe River are regarded as the border between northern and southern China. Due to data collection and other factors, the study only took 15 provincial administrative regions (such as Beijing, Tianjin, Hebei Province, and Nei Mongol Zizhiqu) in the north (hereinafter referred as “northern China”) as the study area, which was 5.78 × 10⁶ km2 in total [41]. The climate from east to west is very different, with a range of climate zones (Figure 1a) as well as complex and multiple landforms, such as mountains, deserts, basins, and plains (Figure 1b) [42].

2.2. Data

Monthly data, such as P, Tmin, Tave, and Tmax, were collected from 359 meteorological stations distributed in and around northern China (Figure 2) from March 2000 to February 2019. The data were downloaded from the National Meteorological Information Center of the China Meteorological Administration. After careful inspection, these data included no obvious abrupt change points or random variations; therefore, they could be used to represent the climate conditions of the study area. Based on monthly data, this article defines March to the following February as a year (for example, the period from March 2000 to February 2001 was defined as 2000).
The remote sensing data used had two sources. The first part was MOD13Q1, which was downloaded from http://www.gscloud.cn/ (accessed on 4 June 2021). The period was from March 2000 to February 2003, the single image area was 1200 km × 1200 km, and the data format was HDF-EOS. The second part was vegetation monitoring data from USGS. The period was from March 2003 to February 2019, the single image area was located between 4°59′55″ N–56°00′00″ N and 20°00′00″ E–135°59′51″ E, the data format was tiff, and the spatial resolution of both data sources was 250 m.

2.3. Data Processing Method

  • Model builder in ArcGIS software was used to perform coordinate conversion, mosaic, extraction, and other types of processing on the remote sensing image to obtain the monthly NDVI in the study area, which was [−0.2~1], and the format of the data was unified as tiff.
  • The one-variable linear regression analysis was adopted to simulate the annual change rate for the NDVI on the basis of each pixel. The specific calculation formula is [43,44]:
θ = n i = 1 n i c i i = 1 n i i = 1 n c i n i = 1 n i 2 ( i = 1 n i ) 2
In the formula, θ is the slope of the NDVI; c i is the value of the NDVI in year i; and n is the number of years in calculation period.
3.
The coefficient of variation was adopted to characterize the fluctuation of the NDVI over the years. The specific calculation formula is:
C V = 1 n 1 ( x i x ¯ ) 2 / x ¯
In the formula, C V is the coefficient of variation; i is the time series; x i is the value of the NDVI in year i; and x ¯ is the mean value of all pixels during the study period.
In addition, according to previous related research [45], the fluctuation degree of the NDVI was graded. It was divided into five grades in descending order as follows: C V   > 0.2 (high fluctuation), 0.15 <   C V   ≤ 0.2 (relatively high fluctuation), 0.1 <   C V ≤ 0.15 (moderate fluctuation), 0.05 <   C V   ≤ 0.1 (relatively low fluctuation), and C V   < 0.05 (low fluctuation). See Figure 2 for details.
4.
For the correlations between the NDVI and various climatic factors (P, Tmin, Tave, and Tmax), firstly, the simple correlation coefficient between the NDVI and climatic factors was calculated. Then, the partial correlation coefficient and multivariate correlation coefficient (multivariate correlation coefficients among the NDVI, P, and three types of T are represented by Mnpmin, Mnpave, and Mnpmax, respectively) were calculated [46]. The calculation formulas for the simple correlation coefficient, partial correlation coefficient, and multivariate correlation coefficient are as follows:
R x y = i = 1 n ( x i x ¯ ) ( y i y ¯ ) i = 1 n ( x i x ¯ ) 2 i = 1 n ( y i y ¯ ) 2
ρ 12 3 = R 12 R 13 R 23 ( 1 R 13 2 ) ( 1 R 23 2 )
M 1 23 = 1 ( 1 R 12 2 ) ( 1 ρ 13 2 2 )  
In the formula, x i and y i are the values of the NDVI and P/Tmin/Tave/Tmax in year i; x ¯ and y ¯ are the multiyear mean values of the NDVI and P/Tmin/Tave/Tmax; n is the number of years for the calculated period; R 12 is the simple correlation coefficient between the NDVI and P; R 13 is a simple correlation coefficient between the NDVI and Tmin/Tave/Tmax; R 23 is the correlation coefficient between P and Tmin/Tave/Tmax; ρ 12 3 is the partial correlation coefficient between the NDVI and P on the basis of a fixed Tmin/Tave/Tmax; ρ 13 2 is the partial correlation coefficient between the NDVI and Tmin/Tave/Tmax on the basis of a fixed P; and M 1 23 are multiple correlation coefficients between NDVI, P, and Tmin/Tave/Tmax.
5.
Geodetectors are a set of statistical tools that detect the spatial differentiation of geographical phenomena and reveal contributors [47]. In the study, the synergistic effect between P and T on the NDVI was explored through the interaction detector in geodetectors. This effect was also called the explanatory power of the synergistic effect between P and T for the NDVI (indicated by Q). The Q value varies between 0 and 1, the closer the Q value to zero, the weaker the explanatory power of P and T for the NDVI, and vice versa. Here, the explanatory power values of the synergistic effect of P, as well as those of Tmin, Tave, and Tmax, for the NDVI are abbreviated as Qnpmin, Qnpave and Qnpmax, respectively.

3. Results

3.1. Variation Characteristics of the NDVI

Figure 3 shows the temporal evolution of the regional mean value of the NDVI (a), the spatial distribution of the multiyear mean value of the NDVI (b), the annual change rate of the NDVI in 2000–2012 (T1) (c) and 2012–2018 (T2) (e), and the CV in T1 (d) and T2 (f). The multiyear mean value of the NDVI in northern China was 0.22. In 2002, 2008, and 2012–2018, the NDVI was greater than the multiyear mean value; yet, the rest of the years showed the opposite. The maximum value for the NDVI occurred in 2016 (the regional mean value of the study area was 0.239), and the minimum value appeared in 2003 (the regional mean value of study area was only 0.202). In terms of space, the maximum value was distributed in the southeastern part of the study area, while the minimum value was concentrated in central Xinjiang Uygul Zizhiqu and other regions. The overall distribution pattern of the NDVI increased from northwest to southeast, which is consistent with the warm–humid climate pattern of the southeast and the cold–dry pattern in the northwest. During the T1 period, as a whole, the NDVI showed a downward trend in the study area. The area with significant degradation of NDVI was mostly concentrated in the northeastern part of the study area and in southern Qinghai Plateau, whose area accounted for 42.4% of the total. Except for the Mohe meteorological station, the vegetation coverage was relatively stable in the northeastern part of the study area, which belonged to the low-fluctuation area as a whole. The southern Qinghai Plateau mostly included areas with relatively high or moderate fluctuation, which probably indicates that the vegetation in this region is susceptible to changes in the climate, human activities, or other factors. The areas with significantly improved NDVI were mainly distributed at the junction of the Shaanxi and Shanxi provinces, which accounted for about 19.7% of the total, and most of them were relatively low-fluctuation areas. This indicates that the vegetation in this area has a strong self-repair ability after being affected by external factors. The NDVI in the rest of regions was basically unchanged. The annual change rate was mostly no more than 0.02/10a. After entering the T2 period, the NDVI in most areas improved significantly, which accounted for about 49.1% of the total. Except for the northern part of Xinjiang Uygul Zizhiqu, the rest of the regions were all low-fluctuation or relatively low-fluctuation areas, and the NDVI stability was significantly improved compared to that in the T1 period. The region where NDVI degraded significantly only covered 9.3% of the study area, and was mostly in the east of Qinghai province. Compared to the T1 period, the fluctuation degree of the NDVI in this area was reduced, and the remaining 41.6% was basically unchanged.

3.2. Multivariate Correlation between the NDVI, P, and T

To further reveal the relationships among NDVI, P, and T, this study calculated the multivariate correlation coefficients among NDVI, P, and T from 2000 to 2018 on a station basis. It can be seen from Figure 4 that Mnpmin was the highest in the middle of Nei Mongol Zizhiqu, and on this basis, it gradually decreased in other directions. Mnpmin was the lowest in northern Xinjiang Uygul Zizhiqu and in the northeastern part of the study area. Mnpave was relatively low in Xinjiang Uygul Zizhiqu and in the eastern part of northeast China, and it gradually increased towards the middle of the study area. Mnpmax decreased from east to west, except in the east of Shaanxi province, where the correlation decreased with the latitude.
Most of the multivariate correlation coefficients among NDVI, P, and T were higher than 0.4 and passed the significance test (90%). This likely indicates that the combined effect of P and T has had a great influence on the vegetation growth. Overall, Mnpmax was the highest, followed by Mnpave, and Mnpmin was the lowest. The areas with Mnpmax values ranging from 0.39 to 0.45, 0.45 to 0.51, and above 0.51 accounted for 33.5%, 14.1%, and 29.3% of the study area, respectively, and passed the significance test at 90%, 95%, and 99% confidence intervals. Mnpmin was mainly between 0.39 and 0.42, accounting for 35.3% of the total study area.

3.3. The Synergistic Effect between P and T for the NDVI

The synergistic effect between P and Tmax had the strongest explanatory power for the NDVI, with Qnpmax varying from 0.41 to 0.81 (the mean value of Qnpmax was 0.68), followed by Qnpave and Qnpmin (varying from 0.38 to 0.77; the mean value of Qnpmin was 0.64). Spatially, Figure 5 shows that the explanatory power of the synergistic effect between P and T for the NDVI was enhanced from northwest to southeast as a whole. Among them, the synergistic effect between P and Tmin had the strongest explanatory power for the growth and distribution of the NDVI in Gansu, Heilongjiang, and Ningxia Huizu Zizhiqu (a). The NDVI in Shaanxi and Shandong provinces was mainly affected by the synergistic effect between P and Tave (b), while that in other areas, like in Liaoning, Jilin, Nei Mongol Zizhiqu, and other provinces was mainly influenced by the joint effect of P and Tmax (c). In addition, the explanatory power of P and T for the NDVI in Xinjiang Uygul Zizhiqu was generally weak, and the synergistic effect between P and Tmax had a greater explanatory power for the NDVI in this area than Tmin and Tave. The explanatory power of P and T for the NDVI in Shanxi province descended, with Qnpmax ranking at the top, followed by Qnpave and Qnpmin in sequence. However, the overall Q value was significantly lower than that of surrounding areas, which may be attributed to coal mining and other factors.
The annual change rate of the explanatory power for the synergistic effect between P and T for the NDVI (d–f) shows that the overall explanatory power between P and T for the NDVI in the study area was weakened in the central area and strengthened in the east and the west. Specifically, the synergistic effect between P and T on the NDVI was weakened in both Shaanxi and Ningxia Huizu Zizhiqu, while the opposite occurred in Xinjiang Uygul Zizhiqu, Qinghai, and another five provinces in the eastern part of the study area (Heilongjiang, Jilin, Liaoning, Shandong, and Hebei). In addition, there were differences in the annual change rate of the synergistic effect between P and T. For example, Qnpmin declined in Gansu and Henan provinces, while Qnpave and Qnpmax rose in these areas; Qnpave and Qnpmin dropped in Shanxi, while Qnpmax rose.

4. Discussion

The multiyear change rate of the NDVI in northern China generally decreased from 2000 to 2012 and then increased from 2013 to 2018. It increased in the east and decreased in the west of northern China. This is basically consistent with the NDVI variation for the world [11] and in central Asia [36]. It also conforms to the conclusion that the NDVI in northern Xinjiang Uygul Zizhiqu [38] has increased on the whole. However, He Hang et al. [41] and Liu Xianfeng et al. [48] proposed that the areas where NDVI has increased significantly are primarily located in the Tianshan Mountains, northern Xinjiang Uygul Zizhiqu, and the Tarim Basin. The areas with a significantly decreased NDVI were shown to be mostly concentrated in the Greater and Lesser Khingan Mountains and in the Changbai Mountains in northeast China, which is somewhat different from the research results in this paper and may be caused by the different research periods.
Multivariate correlations between the NDVI, P, and T were generally strong (Mnpmax > Mnpave > Mnpmin). The areas that passed the 95% confidence level in the test of significance accounted for approximately 43.4%, 31.1%, and 28.5% of the total, respectively, which indicates that the joint effect of P and T has an important influence on the growth and distribution of vegetation in the study area. Moreover, the conclusion that the NDVI is closely correlated with P and T, which are dominant contributors to the NDVI [49,50], basically conforms to the results of this study. Some scholars [51] also pointed out that the multiple correlations among NDVI, P, and T are insignificant. This perspective is different from the conclusions of this study to some extent, possibly due to the different study areas.
The explanatory power of the synergistic effect between P and Tmin, Tave, and Tmax for the NDVI in the study area was descending (i.e., Qnpmax > Qnpave > Qnpmin on the whole). The Q value was between 0.36 and 0.81. Spatially, the explanatory power of the synergistic effect between P and T for the NDVI was strengthened overall in the study area from northwest to southeast. The conclusion that the explanatory power of P and T for China’s NDVI was between 0.76–0.83 and 0.48–0.56, respectively [52], and the conclusion that the main contributors to the spatial distribution of vegetation coverage were P, T, sunshine, and relative humidity in the order of explanatory power [53], all conform to the conclusions of this study to some degree. However, the conclusion [54] that elevation is the major contributor to the NDVI and its explanatory power of roughly 52.9% differ from the results presented in this article, which may be caused by the different time scales or data. The annual change rate for Q decreased in the middle and increased in the east and west of the study area. The two areas accounted for 10.47% and 89.53% of the total (taking Qnpave as an example), which indicates that the synergistic effect between P and T on the NDVI of the study area was generally enhanced. Shi et al. proposed [55] that, from 2000 to 2020, the impact of natural factors on the NDVI was weakened on the whole, while those of human factors were strengthened. This conclusion is somewhat different from that presented in this article, which may be derived from the inconsistency of the study period.
Many scholars have pointed out that anthropogenic factors are also primary factors that affect the growth and distribution of vegetation, and their impact is dual [56]. For example, the construction of the Qinghai–Tibet Railway had a significant impact on the growth of vegetation. That is, the growth of vegetation was improving before the railway was built, a degradation trend appeared during construction, and the growth gradually recovered after the project [57]. Due to the completion of the railway, the number of tourists increased, which had a great negative impact on the growth of vegetation [58]. The mining of the Zaoquan coal mine was an important factor that led to the degradation of local surface vegetation. Since the year of coal mining, the degradation degree of vegetation deepened year-by-year [59]. Overgrazing and irrational use of grassland resources are important reasons for the downward trend for the NDVI in the Qinghai–Tibet Plateau [60]. On the contrary, the implementation of ecological protection policies was conducive to the increase in vegetation [61]. For example, thanks to the construction of farmland water conservancy infrastructure, the construction of field irrigation projects, and the use of advanced field management techniques, the vegetation in the Sichuan Basin has been in a good state [62]. Since the implementation of desert control and the construction of coastal city clusters, vegetation in the Alxa Plateau of Nei Mongol Zizhiqu has improved significantly, as well as in most parts of South China [63]. As for the degree and mechanism of the impact of human activities on vegetation, further research is needed.

5. Conclusions

A detailed analysis on the spatial variability characteristics of the NDVI and the synergistic effect between P and T for the NDVI in northern China was carried out, which enriches the research results in this field and provides a reference for ecological environment improvement. The main conclusions are as follows:
  • The overall distribution pattern of the NDVI increased from northwest to southeast. On a temporal scale, the NDVI mainly showed a downward trend before 2012, which then changed to upward. In space, NDVI decreased in the west and increased in the east.
  • On the whole, NDVI, P, and Tmax had the strongest multivariate correlations, with approximately 43.4% of the total study area passing the 95% confidence level significance test. Mnpmax was mostly between 0.39~0.51, followed by Tave and Tmin.
  • The explanatory power of the synergistic effect between P and T for the NDVI was enhanced from northwest to southeast. Among them, the explanatory power of the synergistic effect between P and Tmax for the NDVI was the strongest, followed by Tave and Tmin. As for the annual change rate, the overall explanatory power between P and T for the NDVI was weakened in the central area and strengthened in the east and west.

Author Contributions

Conceptualization, Y.C. and L.M.; methodology, Y.C.; software, Y.C.; validation, L.M. and T.L.; formal analysis, X.H., writing—original draft preparation, Y.C.; writing—review and editing, Y.C. and L.M.; visualization, G.S.; supervision, G.S.; project administration, Inner Mongolia Agriculture University; funding acquisition, L.M. All authors have read and agreed to the published version of the manuscript.

Funding

This research was funded by the Technology-Planning Project of Inner Mongolia (2020GG0074) and the Inner Mongolia Science Foundation (2020MS05054).

Institutional Review Board Statement

Not applicable.

Informed Consent Statement

Not applicable.

Data Availability Statement

Precipitation and temperature data were obtained from the National Meteorological Information Center of the China Meteorological Administration. The remote sensing data used had two sources. The first part was MOD13Q1, which was downloaded from http://www.gscloud.cn/ (accessed on 4 June 2021). The period was from March 2000 to February 2003. The second part was vegetation monitoring data from USGS (https://earthexplorer.usgs.gov/ (accessed on 4 June 2021)). The period was from March 2003 to February 2019. All the data above are open-access and freely available.

Conflicts of Interest

The authors declare no conflict of interest.

References

  1. Lemordant, L.; Gentine, P.; Swann, A.S.; Cook, B.I.; Schef, J. Critical impact of vegetation physiology on the continental hydrologic cycle in response to increasing CO2. Proc. Natl. Acad. Sci. USA 2018, 115, 4093–4098. [Google Scholar] [CrossRef] [PubMed] [Green Version]
  2. Jin, C.M.; Yang, X.W.; Jing, H.T. A RS-based study on changes in fractional vegetation cover in North Shaanxi and their driving factors. Remote Sens. Nat. Resour. 2021, 33, 258–264. [Google Scholar]
  3. Zhang, Y.L.; Qi, W.; Zhou, C.P.; Ding, M.J.; Liu, L.S.; Gao, J.G.; Bai, W.Q.; Wang, Z.F.; Zheng, D. Spatial and temporal variability in the net primary production of alpine grassland on the Tibetan Plateau since 1982. J. Geogr. Sci. 2014, 24, 269–287. [Google Scholar] [CrossRef]
  4. De Keersmaecker, W.; Lhermitte, S.; Hill, M.J.; Tits, L.; Coppin, P.; Somers, B. Assessment of Regional Vegetation Response to Climate Anomalies: A Case Study for Australia Using GIMMS NDVI Time Series between 1982 and 2006. Remote Sens. 2017, 9, 34. [Google Scholar] [CrossRef] [Green Version]
  5. Gao, J.X.; Cai, M.Y.; Zhang, X.S.; Shen, W.M.; Shi, X.W.; Xiao, R.L. Research on the method and application of large-scale ecological disturbance risk assessment. China Environ. Sci. 2021, 41, 5274–5281. [Google Scholar]
  6. Measho, S.; Chen, B.Z.; Trisurat, Y.; Pellikka, P.; Guo, L.F.; Arunyawat, S.; Tuankrua, V.; Ogbazghi, W.; Yemane, T. Spatio-Temporal Analysis of Vegetation Dynamics as a Response to Climate Variability and Drought Patterns in the Semiarid Region, Eritrea. Remote Sens. 2019, 11, 724. [Google Scholar] [CrossRef] [Green Version]
  7. Bogaert, J.; Zhou, L.; Tucker, C.J.; Myneni, R.B.; Ceulemans, R. Evidence for a persistent and extensive greening trend in Eurasia inferred from satellite vegetation index data. J. Geophys. Res. 2022, 107, 4. [Google Scholar] [CrossRef]
  8. Tucker, C.J.; Slayback, D.A.; Pinzon, J.E.; Los, S.O.; Myneni, R.B.; Taylor, M.G. Higher northern latitude normalized difference vegetation index and growing season trends from 1982 to 1999. Int. J. Biometeorol. 2001, 45, 184–190. [Google Scholar] [CrossRef]
  9. Kayiranga, A.; Ndayisaba, F.; Nahayo, L.; Karamage, F.; Nsengiyumva, J.B.; Mupenzi, C.; Nyesheja, E.M. Analysis of Climate and Topography Impacts on the Spatial Distribution of Vegetation in the Virunga Volcanoes Massif of East-Central Africa. Geosciences 2017, 7, 17. [Google Scholar] [CrossRef] [Green Version]
  10. Zhang, H.X.; Chang, J.X.; Zhang, L.P.; Wang, Y.M.; Li, Y.Y.; Wang, X.Y. NDVI dynamic changes and their relationship with meteorological factors and soil moisture. Environ. Earth Sci. 2018, 77, 582. [Google Scholar] [CrossRef]
  11. Ndehedehe, C.E.; Ferreira, V.G.; Agutu, N.O. Hydrological controls on surface vegetation dynamics over West and Central Africa. Ecol. Indic. 2019, 103, 494–508. [Google Scholar] [CrossRef]
  12. Liu, Y.; Tian, J.Y.; Liu, R.H.; Ding, L.Q. Influences of Climate Change and Human Activities on NDVI Changes in China. Remote Sens. 2021, 13, 4326. [Google Scholar] [CrossRef]
  13. He, C.X.; Ma, B.X.; Jing, J.L.; Xu, Y.; Dou, S.Q. Spatial-Temporal Variation and Future Changing Trend of NDVI in the Pearl River Basin from 1982 to 2015. Lect. Notes Comput. Sci. 2021, 12634, 209–219. [Google Scholar]
  14. Wang, M.Y.; Fu, J.E.; Wu, Z.T.; Pang, Z.G. Spatiotemporal Variation of NDVI in the Vegetation Growing Season in the Source Region of the Yellow River, China. ISPRS Int. J. Geo-Inf. 2020, 9, 282. [Google Scholar] [CrossRef] [Green Version]
  15. Guo, J.T.; Hu, Y.M.; Xiong, Z.P.; Yan, X.L.; Ren, B.H.; Bu, R.C. Spatiotemporal Variations of Growing-Season NDVI Associated with Climate Change in Northeastern China’s Permafrost Zone. Pol. J. Environ. Stud. 2017, 25, 1521–1530. [Google Scholar] [CrossRef]
  16. Pei, Z.F.; Fang, S.B.; Yang, W.N. The Relationship between NDVI and Climate Factors at Different Monthly Time Scales: A Case Study of Grasslands in Inner Mongolia, China (1982~2015). Sustainability 2019, 11, 7243. [Google Scholar] [CrossRef] [Green Version]
  17. Jin, H.Y.; Chen, X.H.; Wang, Y.M.; Zhong, R.D.; Zhao, T.T.G.; Liu, Z.Y.; Tu, X.J. Spatio-temporal distribution of NDVI and its influencing factors in China. J. Hydrol. 2021, 603, 127129. [Google Scholar] [CrossRef]
  18. Fu, J.X.; Cao, G.C.; Guo, W.J. Changes of growing season NDVI at different elevations, slopes, slope aspects and its relationship with meteorological factors in the southern slope of the Qilian Mountains, China from 1998 to 2017. Chin. J. Appl. Ecol. 2020, 31, 1203–1212. [Google Scholar]
  19. Wang, H.J.; Li, Z.; Cao, L.; Feng, R.; Pan, Y.P. Response of NDVI of Natural Vegetation to Climate Changes and Drought in China. Land 2021, 10, 966. [Google Scholar] [CrossRef]
  20. Wang, Y.W.; Gao, W. Responses of NDVI to climate factors in Inner Mongolia using geographically weighted regression. IOP Conf. Ser. Earth Environ. Sci. 2020, 568, 012012. [Google Scholar] [CrossRef]
  21. Yang, Y.J.; Wang, S.J.; Bai, X.Y.; Tan, Q.; Li, Q.; Wu, L.H.; Tian, S.Q.; Hu, Z.Y.; Li, C.J.; Deng, Y.H. Factors Affecting Long-Term Trends in Global NDVI. Forests 2019, 10, 372. [Google Scholar] [CrossRef] [Green Version]
  22. Fandjinou, K.; Zhang, K.B.; Folega, F.; Mukete, B.; Yang, X.H.; Wala, K.; Akpagana, K. Analysis of Climate Variability and Its Relations to Vegetation Dynamics in TOGO, Western Africa from 1984 to 2017. Appl. Ecol. Environ. Res. 2019, 17, 6761–6781. [Google Scholar] [CrossRef]
  23. Kawabata, A.; Ichii, K.; Yamaguchi, Y. Global monitoring of interannual changes in vegetation activities using NDVI and its relationships to temperature and precipitation. Int. J. Remote Sens. 2001, 22, 1377–1382. [Google Scholar] [CrossRef]
  24. Zhang, X.L.; Wu, S.; Yan, X.D.; Chen, Z.J. A global classification of vegetation based on NDVI, rainfall and temperature. Int. J. Climatol. 2017, 37, 2318–2324. [Google Scholar] [CrossRef]
  25. Zhao, L.; Dai, A.G.; Dong, B. Changes in global vegetation activity and its driving factors during 1982~2013. Agric. For. Meteorol. 2018, 249, 198–209. [Google Scholar] [CrossRef]
  26. Zhou, L.M.; Compton, J.; TuckerRobert, K.; KaufmannDaniel, S.V.; ShabanovRanga, B.M. Variations in northern vegetation activity inferred from satellite data of vegetation index during 1981 to 1999. J. Geophys. Res. 2001, 106, 20069–20084. [Google Scholar] [CrossRef]
  27. Li, H.B.; Wang, C.Z.; Zhang, L.J.; Li, X.X.; Zang, S.Y. Satellite monitoring of boreal forest phenology and its climatic responses in Eurasia. Int. J. Remote Sens. 2017, 38, 5446–5448. [Google Scholar] [CrossRef]
  28. Ji, L.; Fan, K. Effect of Atlantic Sea Surface Temperature in May on Intraseasonal Variability of Eurasian NDVI in Summer. J. Geophys. Res. Atmos. 2020, 125, e2019JD031991. [Google Scholar] [CrossRef]
  29. Wilson, K.; Tertsea, I.; Malak, H.; Shahzad, A.; Zhang, S.; Bai, Y.; Zhang, J.H. Assessment of climate impact on vegetation dynamics over East Africa from 1982 to 2015. Sci. Rep. 2019, 9, 16865. [Google Scholar]
  30. Wei, F.L.; Wang, S.; Fu, B.J.; Pan, N.Q.; Feng, X.M.; Zhao, W.W.; Wang, C. Vegetation dynamic trends and the main drivers detected using the ensemble empirical mode decomposition method in East Africa. Land Degrad. Dev. 2018, 29, 2542–2553. [Google Scholar] [CrossRef]
  31. Tian, F.; Wu, J.J.; Liu, L.Z.; Leng, S.; Yang, J.H.; Zhao, W.H.; Shen, Q. Exceptional Drought across Southeastern Australia Caused by Extreme Lack of Precipitation and Its Impacts on NDVI and SIF in 2018. Remote Sens. 2020, 12, 54. [Google Scholar] [CrossRef] [Green Version]
  32. Saleem, A.; Awange, J.L.; Kuhn, M.; John, B.; Hu, K. Impacts of extreme climate on Australia’s green cover (2003–2018): A MODIS and mascon probe. Sci. Total Environ. 2020, 766, 142567. [Google Scholar] [CrossRef]
  33. Sanjiwana, A.; Bachtiar, W.M.; Andung, B.S.; Muh, A.M. Sensitivity of remote sensing-based vegetation proxies to climate and sea surface temperature variabilities in Australia and parts of Southeast Asia. Int. J. Remote Sens. 2020, 41, 8631–8653. [Google Scholar]
  34. Jin, K.; Wang, F.; Han, J.Q.; Shi, S.Y.; Ding, W.B. Contribution of climatic change and human activities to vegetation NDVI change over China during 1982–2015. Acta Geogr. Sin. 2020, 75, 961–974. [Google Scholar]
  35. Zhao, Q.Q.; Zhang, J.P.; Zhao, T.B.; Li, J.H. Vegetation Changes and Its Response to Climate Change in China Since 2000. Plateau Meteorol. 2021, 40, 292–301. [Google Scholar]
  36. Yuan, X.L.; Wang, W.F.; Cui, J.J.; Meng, F.H.; Kurban, A.; De Maeyer, P. Vegetation changes and land surface feedbacks drive shifts in local temperatures over Central Asia. Sci. Rep. 2017, 7, 3287. [Google Scholar] [CrossRef] [Green Version]
  37. Yuan, X.L.; Li, L.H.; Chen, X.; Shi, H. Effects of Precipitation Intensity and Temperature on NDVI-Based Grass Change over Northern China during the Period from 1982 to 2011. Remote Sens. 2015, 7, 10164–10183. [Google Scholar] [CrossRef] [Green Version]
  38. Luo, N.; Mao, D.; Wen, B. Climate change affected vegetation dynamics in the northern Xinjiang of China: Evaluation by SPEI and NDVI. Land 2020, 9, 90. [Google Scholar] [CrossRef] [Green Version]
  39. Zhao, Y.; Cai, L.X.; Jin, Y.T.; Li, J.X.; Cui, D.; Chen, Z.J. Warming-drying climate intensifies the restriction of moisture on radial growth of Pinus tabuli-formis plantation in semi-arid area of Northeast China. Chin. J. Appl. Ecol. 2021, 32, 3459–3467. [Google Scholar]
  40. Wang, M.; Li, Y.; Huang, R.Q.; Li, Y.L. The effects of climate warming on the alpine vegetation of the Qinghai-Tibetan Plateau hinterland. Acta Ecol. Sin. 2005, 25, 1275–1281. [Google Scholar]
  41. He, H.; Zhang, B.; Hou, Q.; Li, S.; Ma, B.; Ma, S.Q. Variation Characteristic of NDVI and Its Response to Climate Change in Northern China From 1982 to 2015. J. Ecol. Rural Environ. 2020, 36, 70–80. [Google Scholar]
  42. Liang, L.T.; Ma, L.; Liu, T.X.; Sun, B.L.; Zhou, Y. Spatiotemporal variation of the temperature mutation and warming hiatus over northern China during 1951~2014. China Environ. Sci. 2018, 38, 1601–1615. [Google Scholar]
  43. Wang, F.; Ge, Q.S. A new estimation of urbanization’s contribution to the warming trend in China. J. Clim. 2015, 28, 8923–8938. [Google Scholar] [CrossRef]
  44. Zhang, C.S.; Hu, Y.; Shi, X.L. Analysis of Spatial-Temporal Evolution of Vegetation Cover in Loss Plateau in Recent 33 Years Based on AVHRRNDVI and MODIS NDVI. J. Appl. Sci. 2016, 34, 702–712. [Google Scholar]
  45. Liu, Z.J.; Zeng, Y.L.; Yan, L.; Tan, W. Spatial-temporal Variation Characteristics of the Vegetation NVDI in Yunnan-Guizhou Plateau from 2001 to 2014. J. Mt. Agric. Biol. 2018, 37, 32–38. [Google Scholar]
  46. Wang, X.F.; Guo, M.; Matsuoka, N.; Tan, H.; Matsumura, S.; Liu, Y. Spatial and Temporal Relationships among NDVI, Climate Factors, and Land Cover Changes in Northeast Asia from 1982 to 2009. GISci. Remote Sens. 2011, 48, 371–393. [Google Scholar]
  47. Wang, J.F.; Xu, C.D. Geodetector: Principle and prospective. Acta Geogr. Sin. 2017, 72, 116–134. [Google Scholar]
  48. Liu, X.F.; Zhu, X.F.; Pan, Y.Z.; Li, Y.Z.; Zhao, A.Z. Spatiotemporal changes in vegetation coverage in China during 1982–2012. Acta Ecol. Sin. 2015, 35, 5331–5342. [Google Scholar]
  49. Fu, J.X. Temporal and Spatial Changes of NDVI of Different Land Covers and Their Response to Temperature and Precipitation in the Yellow River Basin of Shanxi. Res. Soil Water Conserv. 2023, 30, 364–372. [Google Scholar]
  50. Wang, T.H.; Yang, D.W. Variation characteristics of vegetation phenology during 2001–2020 on the frozen ground zone of the Three-River Source Region. J. Glaciol. Geocryol. 2023, 45, 1–13. [Google Scholar]
  51. Jing, L.J.; Deng, Q.F.; He, C.X.; Wang, Y.F.; Ma, B.X. Spatiotemporal Evolution of NDVI and Its Climatic Driving Factors in the Southwest Karat Area from 1999 to 2019. Res. Soil Water Conserv. 2023, 30, 232–239. [Google Scholar]
  52. Sun, R.; Zhang, F.M.; Weng, S.H.; Liu, Q. Spatio-temporal changes of NDVI and its response to climate in China from 2001 to 2021. China Environ. Sci. 2023. [CrossRef]
  53. Liu, H.L.; Chen, H.; Dong, T.X.; Ma, L.; Zhu, X.; Huang, T.Z. Variation characteristic of NDVI and its response to climate change in the Sichuan Chongqing region. Acta Ecol. Sin. 2023, 43, 1–15. [Google Scholar]
  54. Wang, L.L.; Yang, X.; Hao, L.N. Spatio-temporal Pattern and Influencing factors of Vegetation NDVI in Western Sichuan Plateau from 2001 to 2021. Remote Sens. Nat. Resour. 2023. Available online: https://kns.cnki.net/kcms/detail//10.1759.p.20230207.1452.010.html (accessed on 8 February 2023).
  55. Shi, S.; Li, W.; Qu, C.; Yang, Z.Y. Spatiotemporal Evolution and Quantitative Attribution Analysis of Vegetation NDVI in Greater Khingan Mountains Forest-Steppe Ecotone. Environ. Sci. 2023. [Google Scholar] [CrossRef]
  56. Tian, Z.H.; Ren, Z.G.; Wei, H.T. Driving Mechanism of the Spatiotemporal Evolution of Vegetation in the Yellow River Basin from 2000 to 2020. Environ. Sci. 2022, 43, 743–751. [Google Scholar]
  57. Ma, C.; Cui, P.P.; Zhong, G.R.; Meng, M.; Yang, C.; Ma, W.S. Impact of climate change and engineering activities on spatiotemporal changes of vegetation index along Qinghai-Tibet Railway. Geophys. Res. 2021, 40, 35–51. [Google Scholar]
  58. Luo, L.H.; Ma, W.; Zhuang, Y.L.; Zhang, Y.N.; Yi, S.H.; Xu, J.W.; Long, Y.P.; Ma, D.; Zhang, Z.Q. The impacts of climate change and human activities on alpine vegetation and permafrost in the Qinghai-Tibet Engineering Corridor. Ecol. Indic. 2018, 93, 24–35. [Google Scholar] [CrossRef]
  59. Huang, Y.L.; Guo, Y.C.; Qi, W.Y.; Li, J.M.; Wang, J.Q.; Ouyang, S.Y.; Wu, L.W. Evolution and Degradation Mechanism of Surface Vegetation Coverage in Typical Ecologically Fragile Mining Areas in Western China. J. China Coal Soc. 2022, 47, 4217–4227. [Google Scholar]
  60. Zhang, J.; Yuan, M.S.; Zhang, J.; Li, H.W.; Wang, J.Y.; Zhang, X.; Ju, P.J.; Jiang, H.B.; Chen, H.; Zhu, Q.A. Responses of the NDVI of alpine grasslands on the Qinghai-Tibetan Plateau to climate change and human activities over the last 30 years. Acta Ecol. Sin. 2020, 40, 6269–6281. [Google Scholar]
  61. Yang, J.; Dai, J.H.; Yao, H.R.; Tao, Z.X.; Zhu, M.Y. Vegetation distribution and vegetation activity changes in the Hengduan Mountains from 1992 to 2020. Acta Geogr. Sin. 2022, 77, 2787–2802. [Google Scholar]
  62. Xu, Y.; Huang, W.T.; Dou, S.Q.; Guo, Z.D.; Li, X.Y.; Zheng, Z.W.; Jing, J.L. Responding Mechanism of Vegetation Cover to Climate Change and Human Activities in Southwest China from 2000 to 2020. Environ. Sci. 2022, 43, 3230–3240. [Google Scholar]
  63. Tu, Y.; Jiang, L.L.; Liu, R.; Xiao, Z.L.; Min, J. Spatiotemporal changes of vegetation NDVI and its driving forces in China during 1982–2015. Environ. Sci. 2021, 37, 75–84. [Google Scholar]
Figure 1. (a) Location and temperture zones of the study area. (b) Topography and landforms of the study area.
Applsci 13 08425 g001
Figure 2. Locations of meteorological stations.
Applsci 13 08425 g002
Figure 3. Spatiotemporal variation in NDVI characteristics.
Applsci 13 08425 g003
Figure 4. Spatial distribution of multiple correlation coefficients among NDVI, P, and T.
Applsci 13 08425 g004
Figure 5. Spatial distribution of the synergistic effect between P and T for the NDVI.
Applsci 13 08425 g005
Disclaimer/Publisher’s Note: The statements, opinions and data contained in all publications are solely those of the individual author(s) and contributor(s) and not of MDPI and/or the editor(s). MDPI and/or the editor(s) disclaim responsibility for any injury to people or property resulting from any ideas, methods, instructions or products referred to in the content.

