
Wear Prediction of Curved Switch Rail in High-Speed Turnout and Influence of Wheel and Rail Wear on Vehicle Dynamic Performance

Abstract
:1. Introduction
2. System Dynamics Model of Vehicle–Curved Switch Rail
2.1. Establishment of Curved Switch Rail Model in High-Speed Turnout
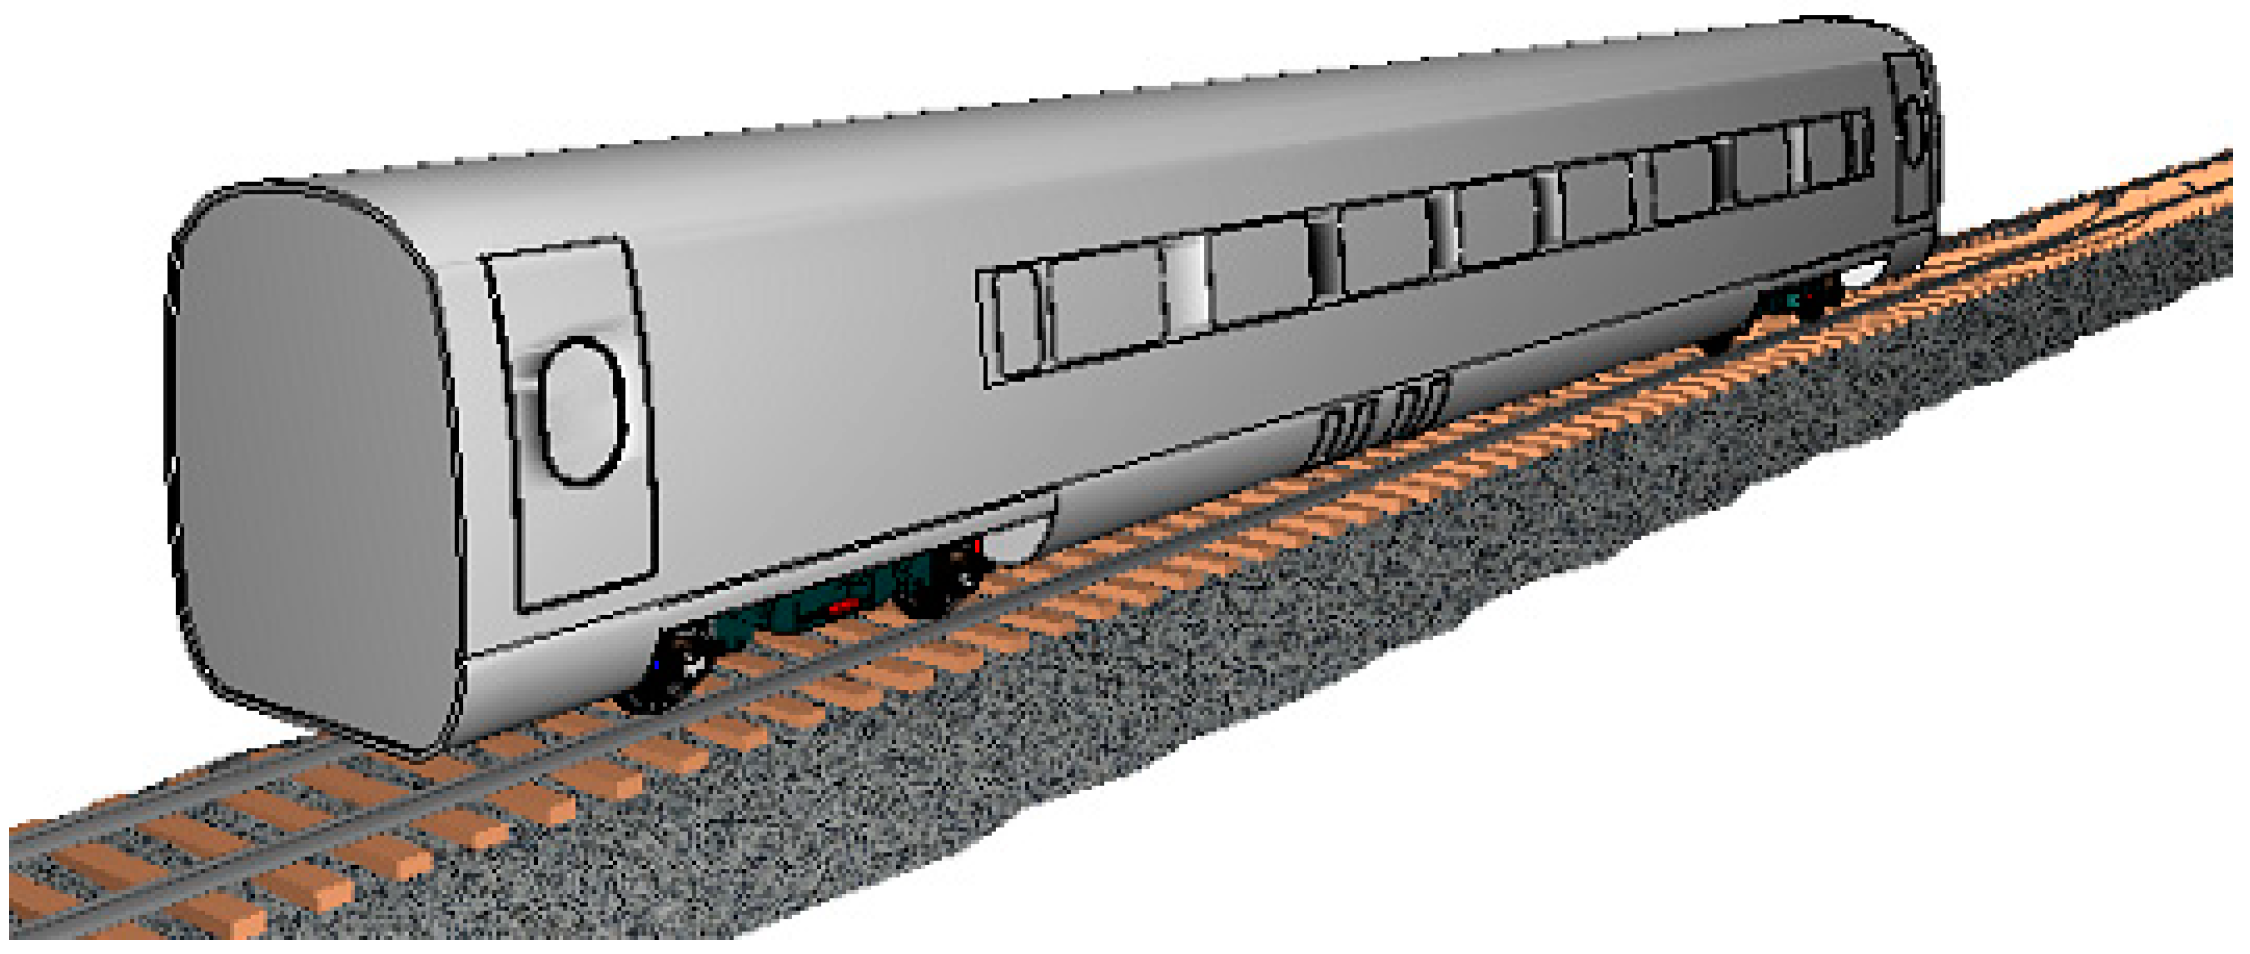
2.2. Vehicle Dynamic Model
2.3. Vehicle and Curved Switch Rail System Dynamics Model
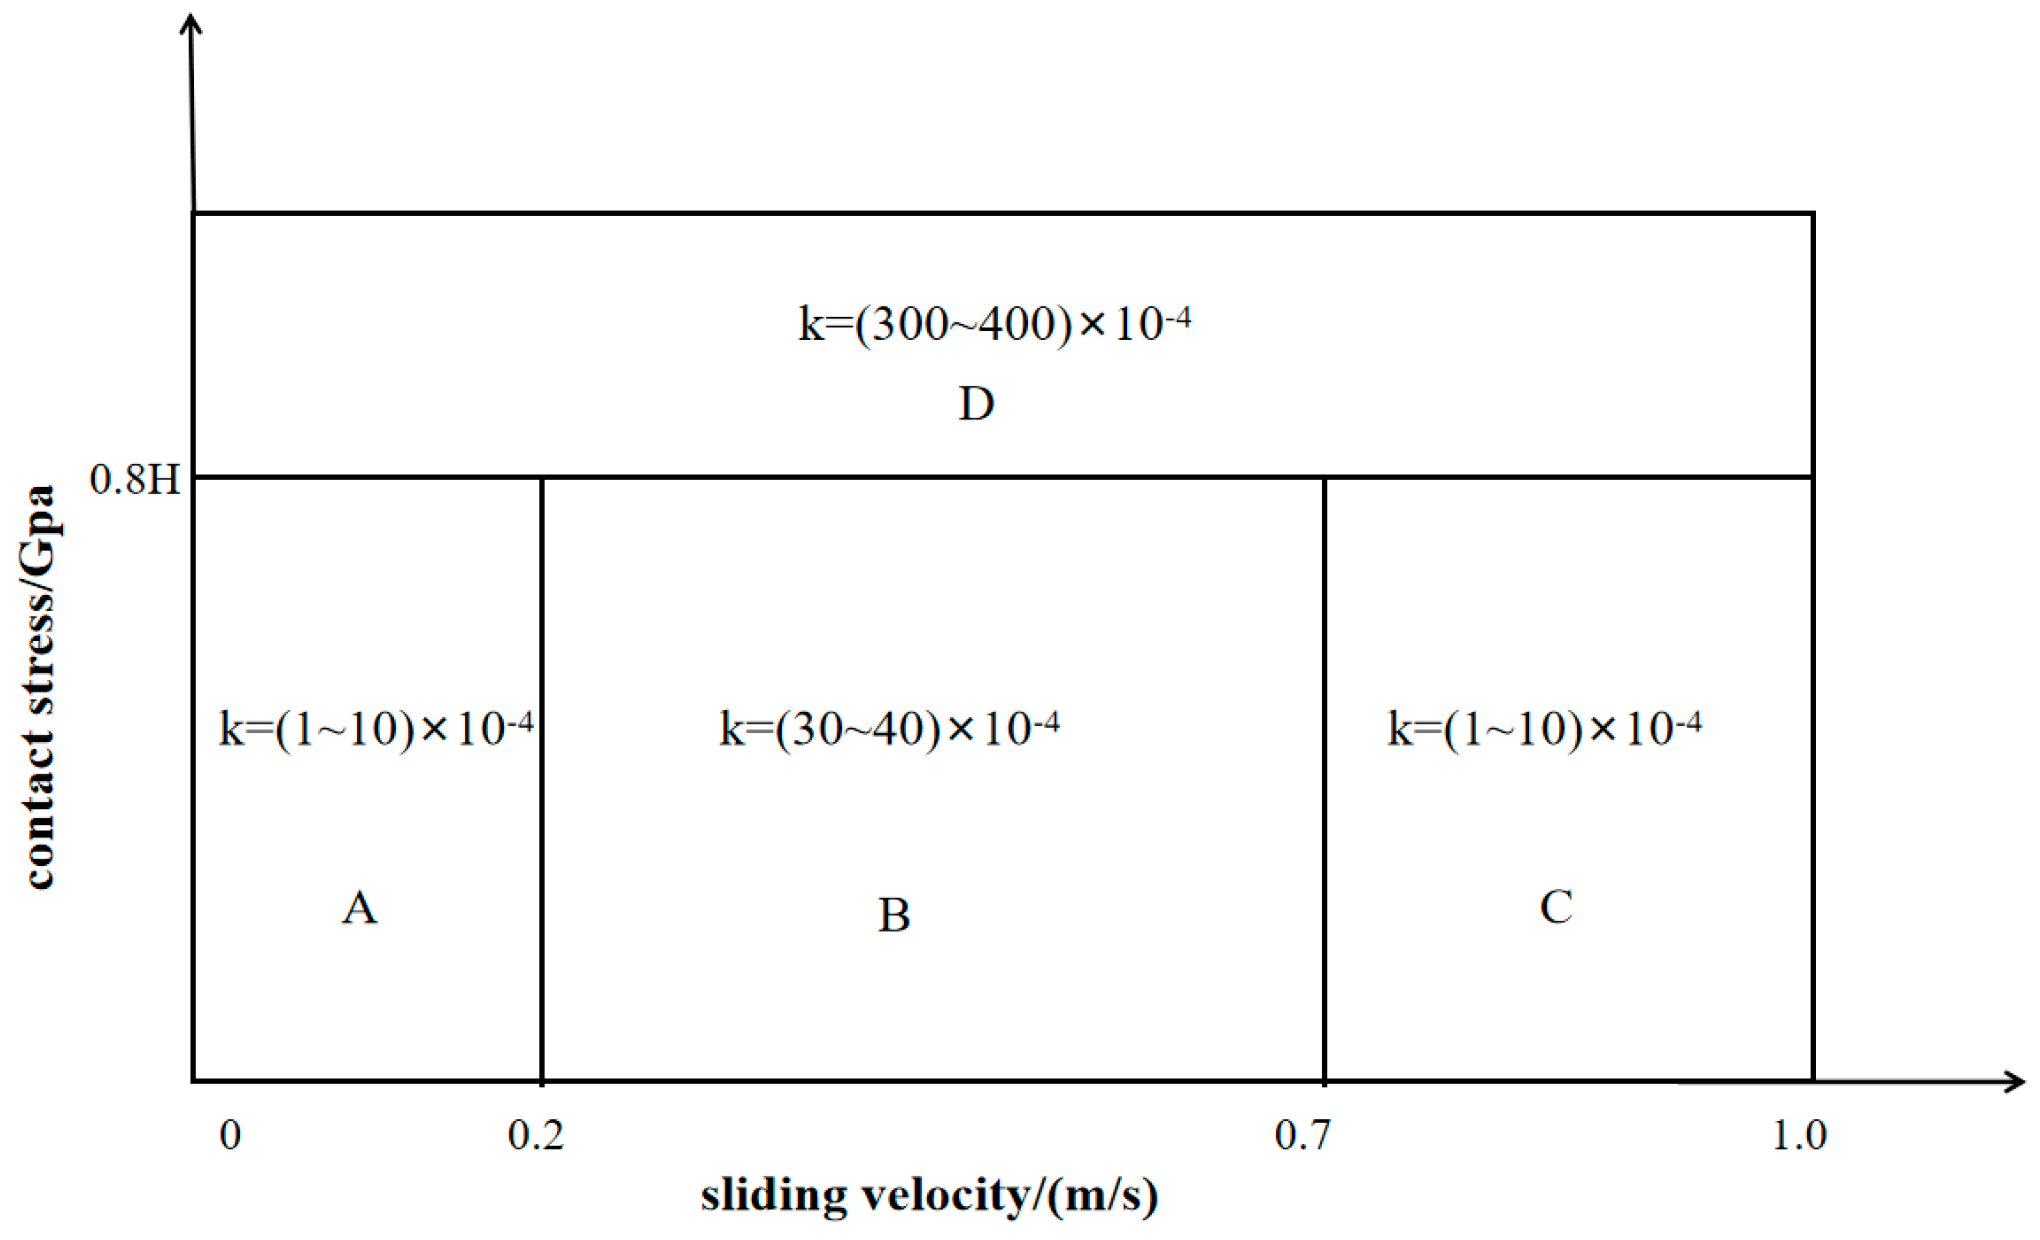
2.4. Kik–Piotrowski Contact Theory and Archard Wear Model
3. Wear Prediction of Curved Switch Rail
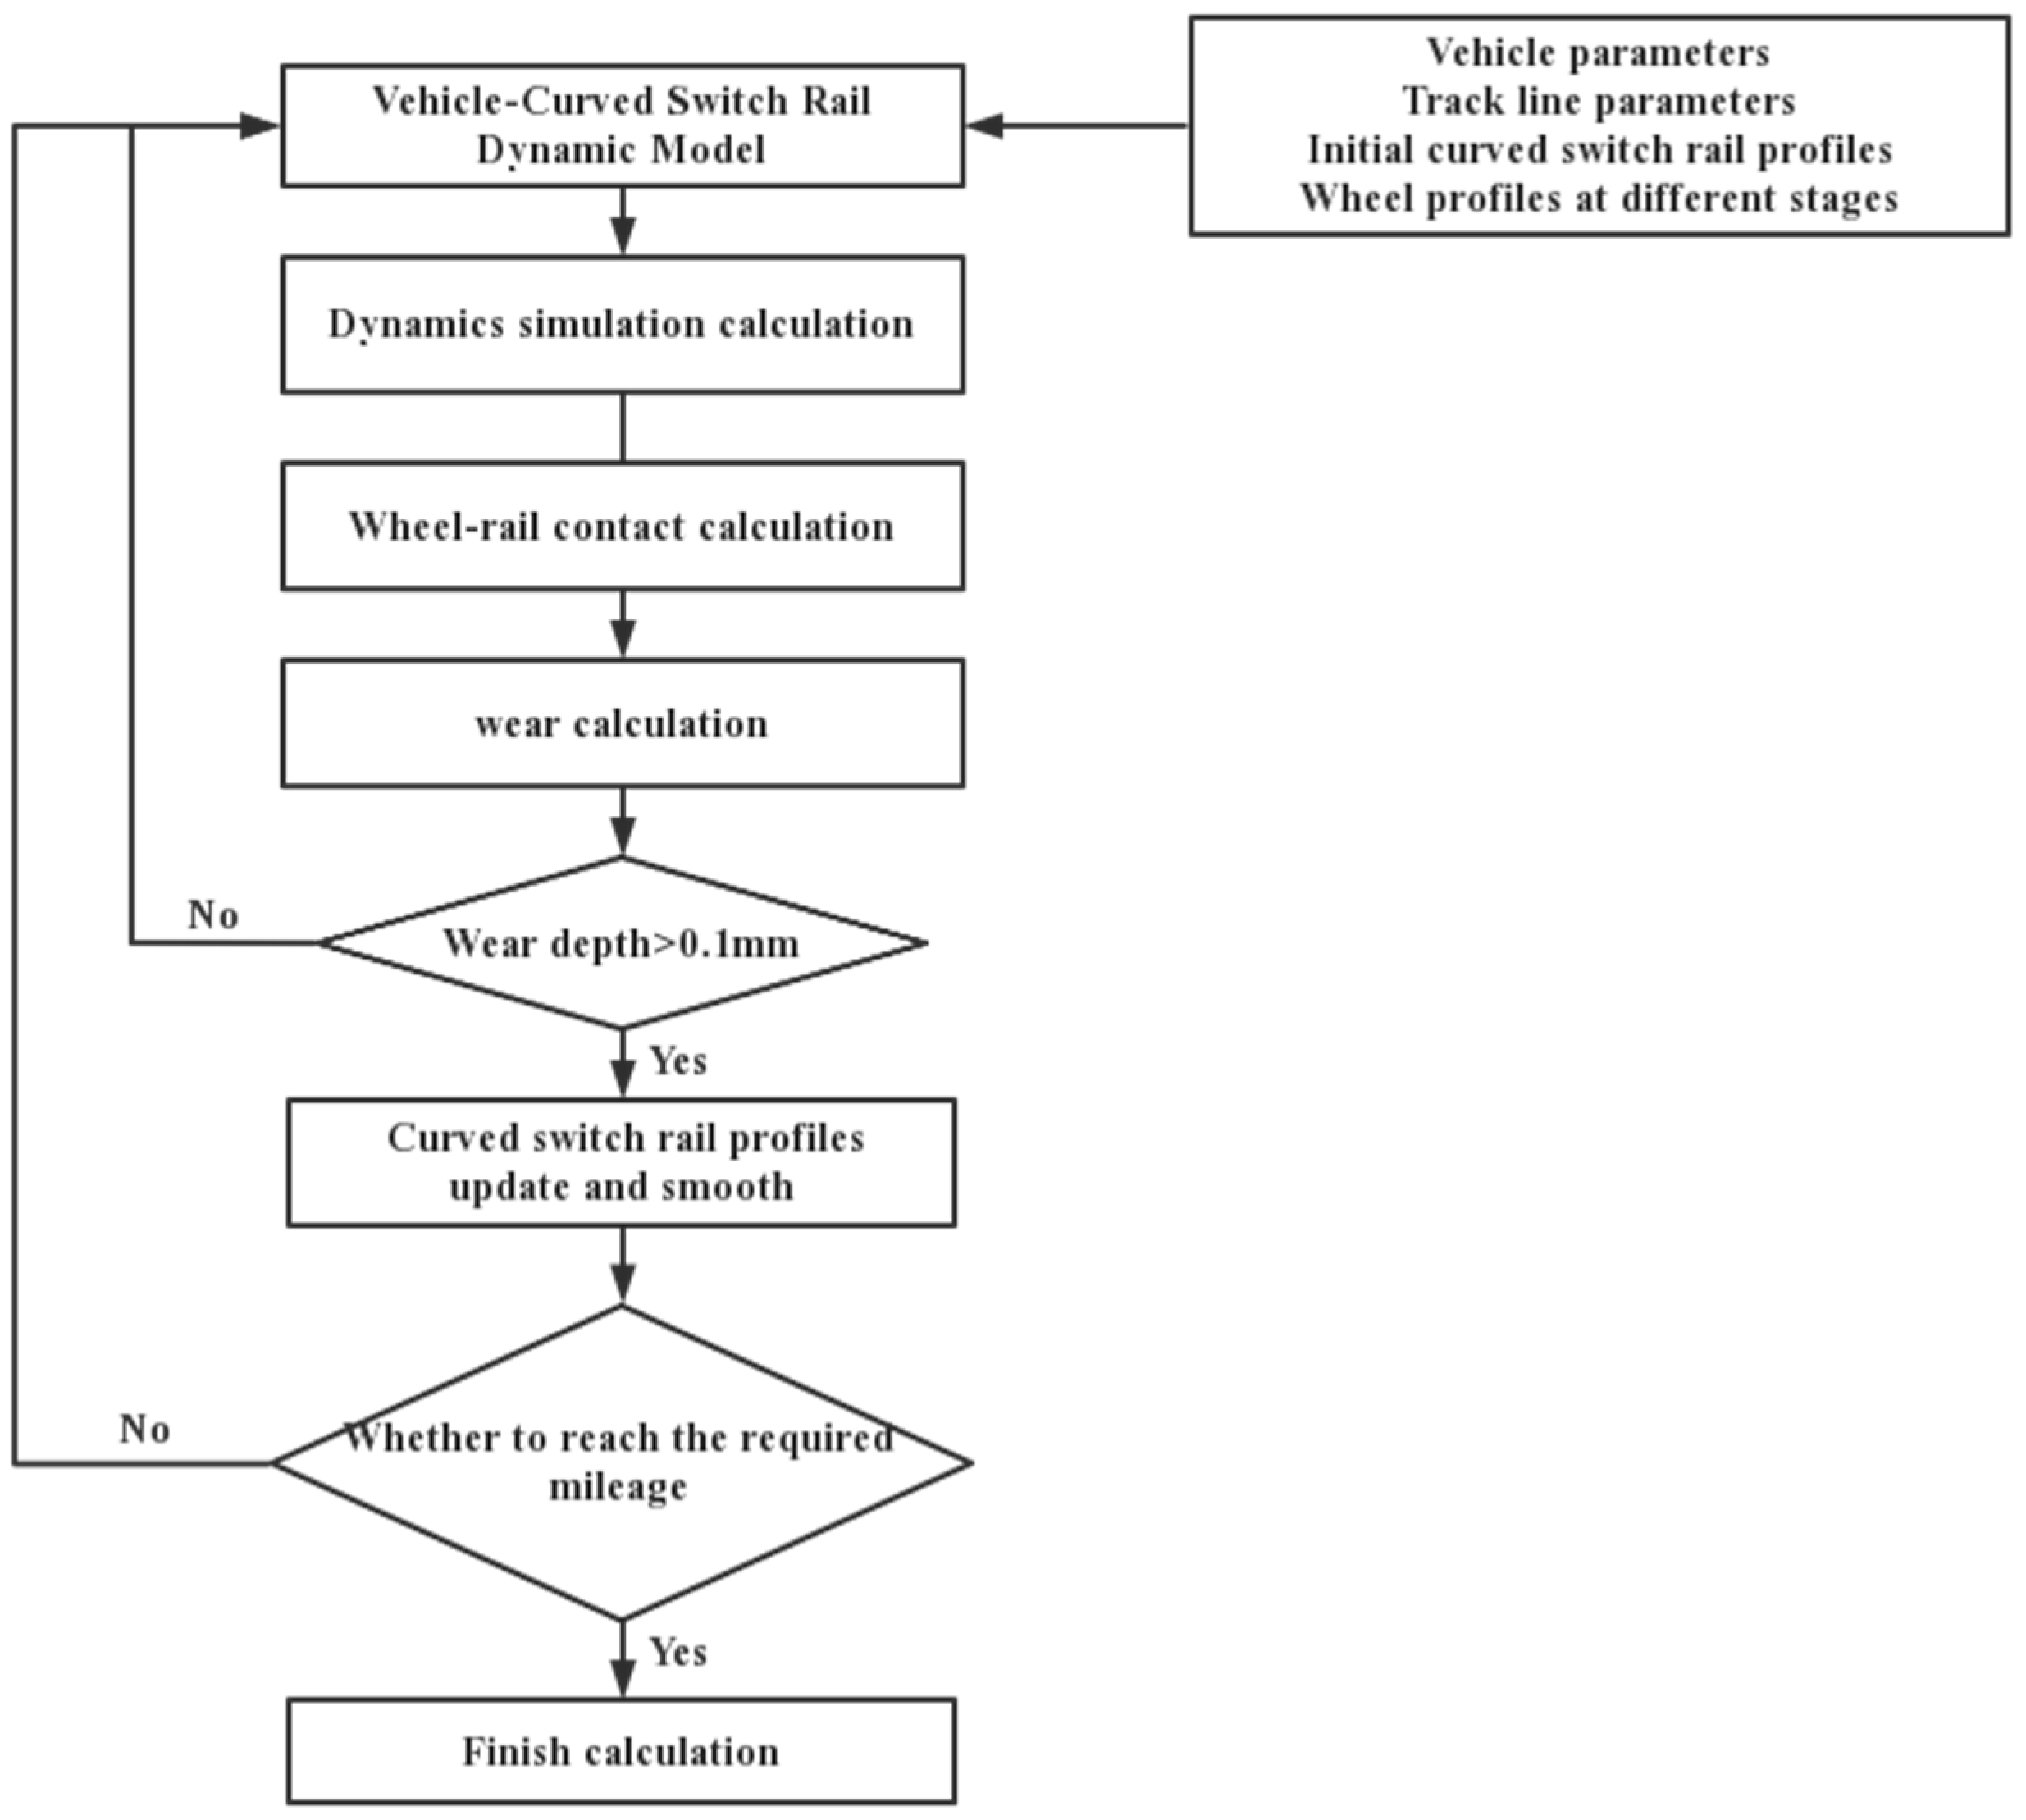
3.1. Wear Prediction Model of Curved Switch Rail
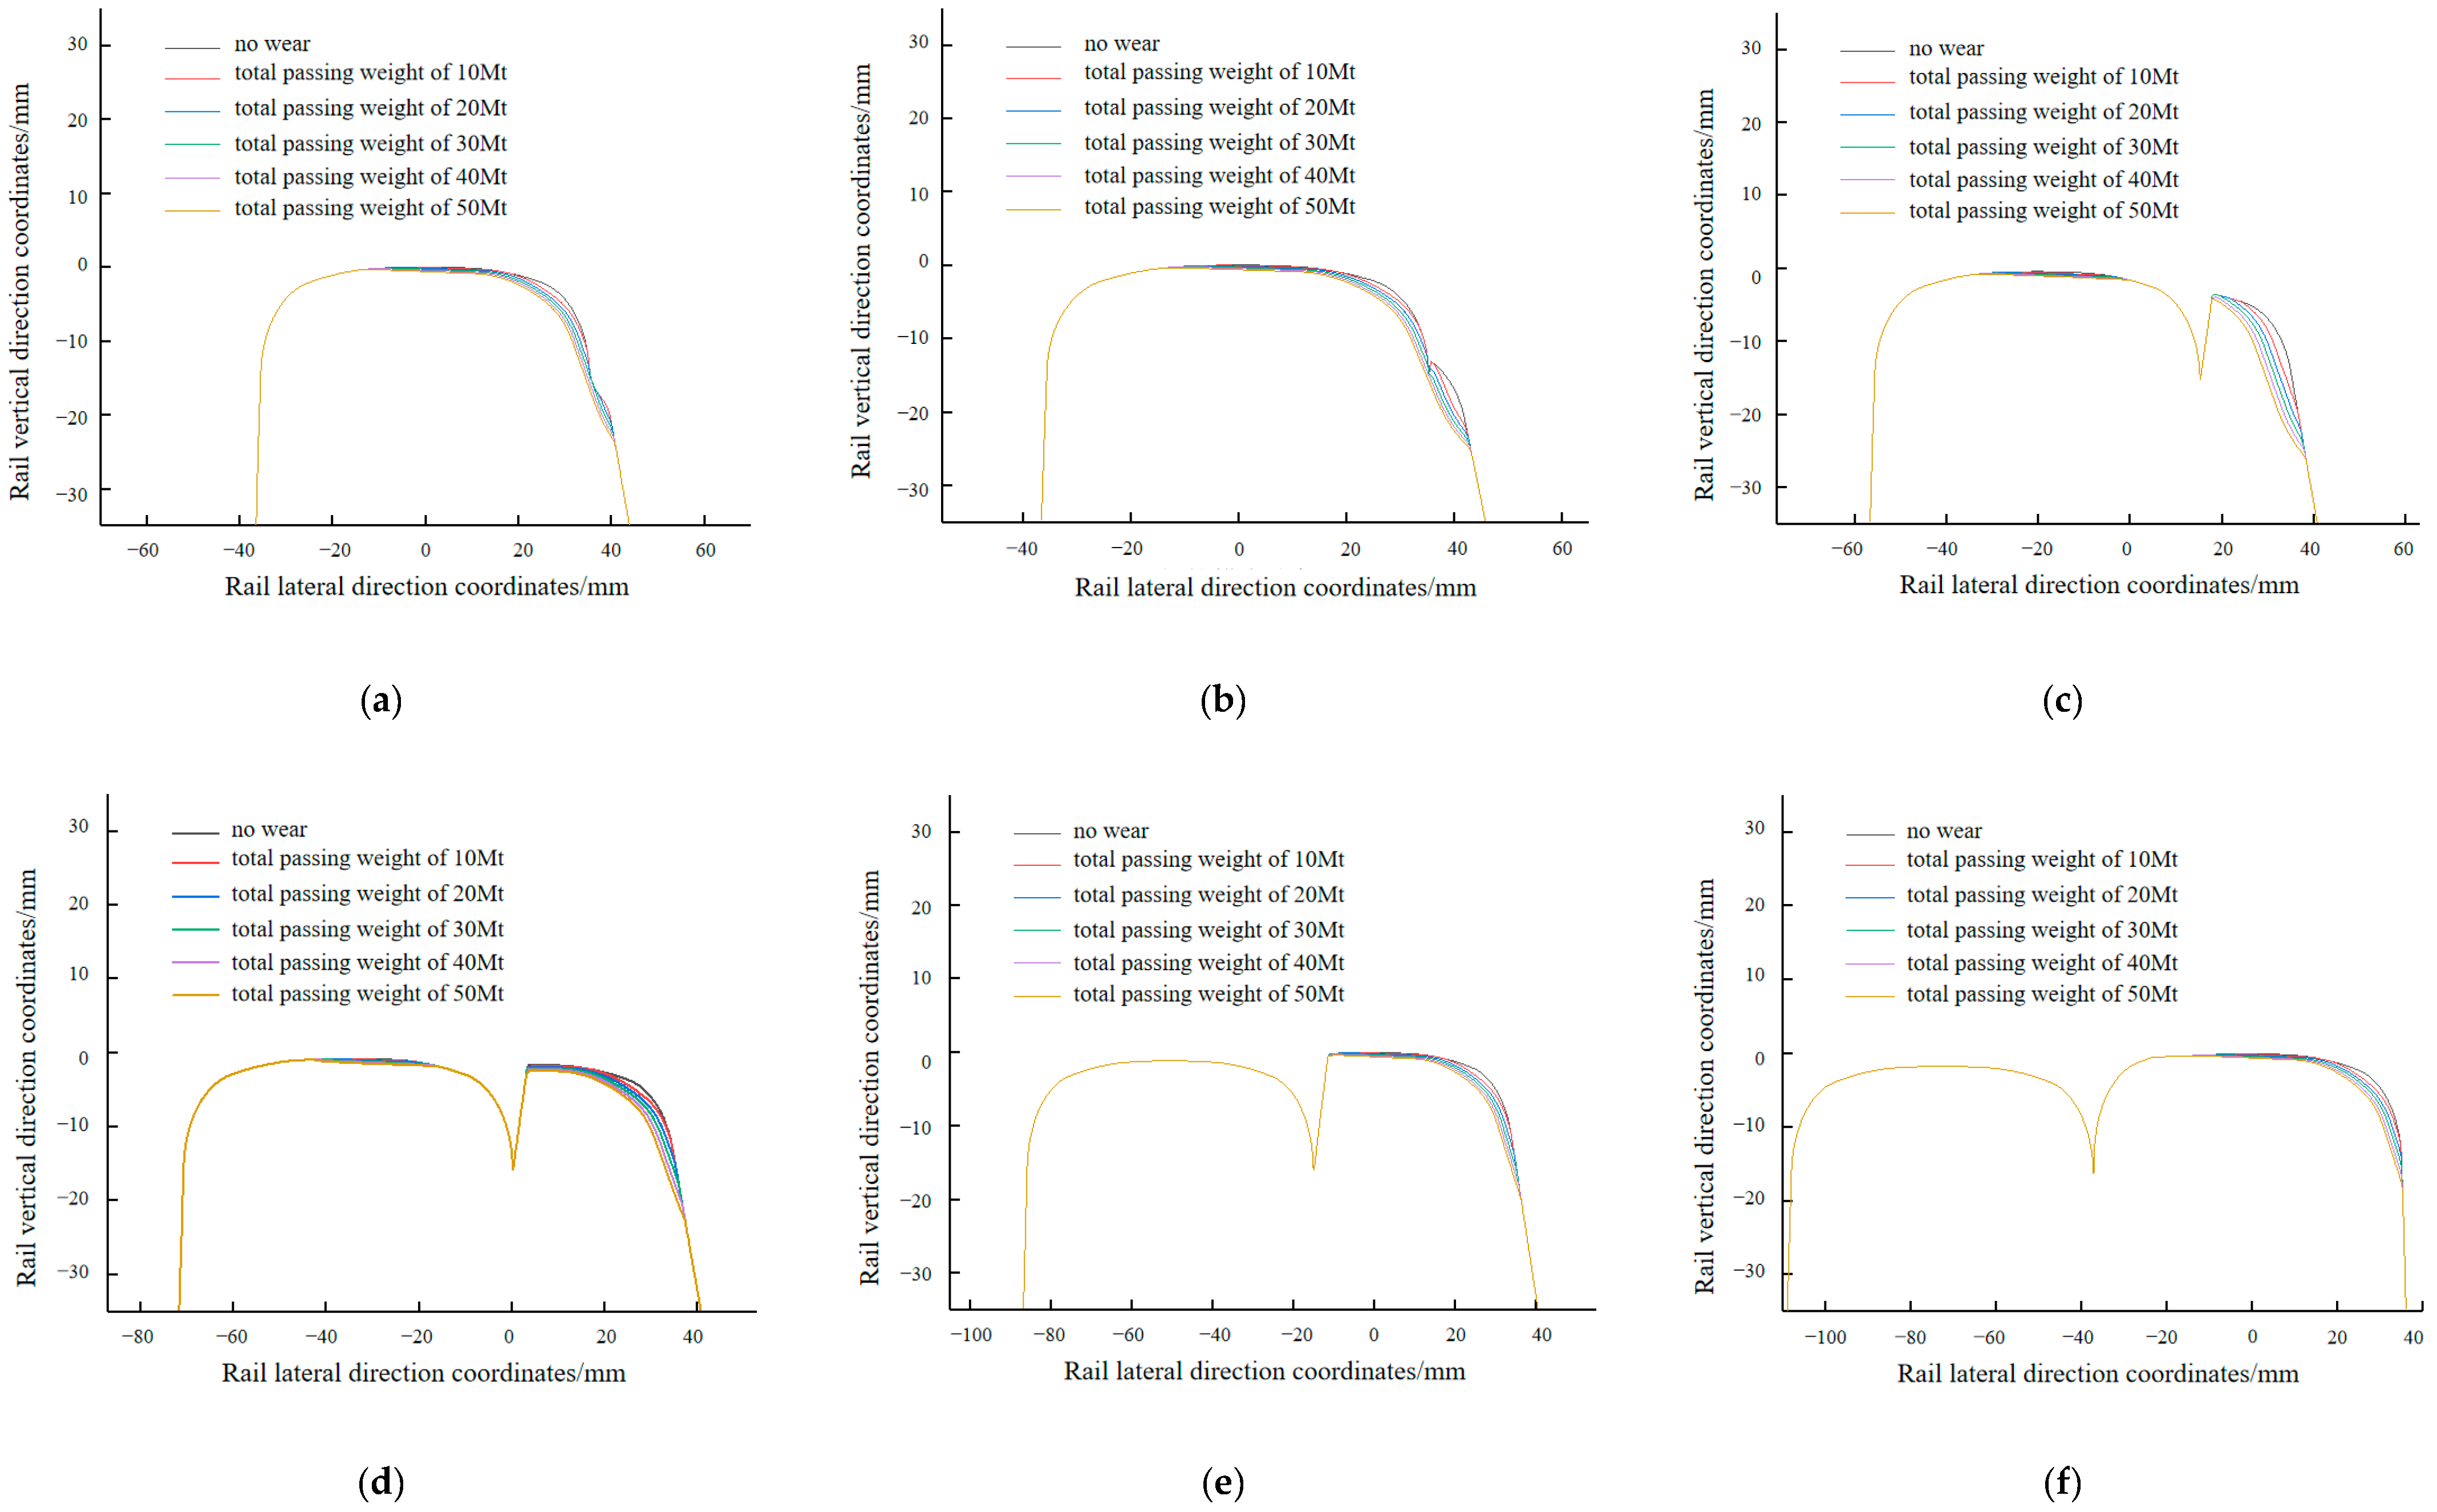
3.2. Profile Prediction of Curved Switch Rail
4. The Effect of Curved Switch Rail Wear on Vehicle Dynamic Performance
4.1. Vertical Force
4.2. Lateral Force
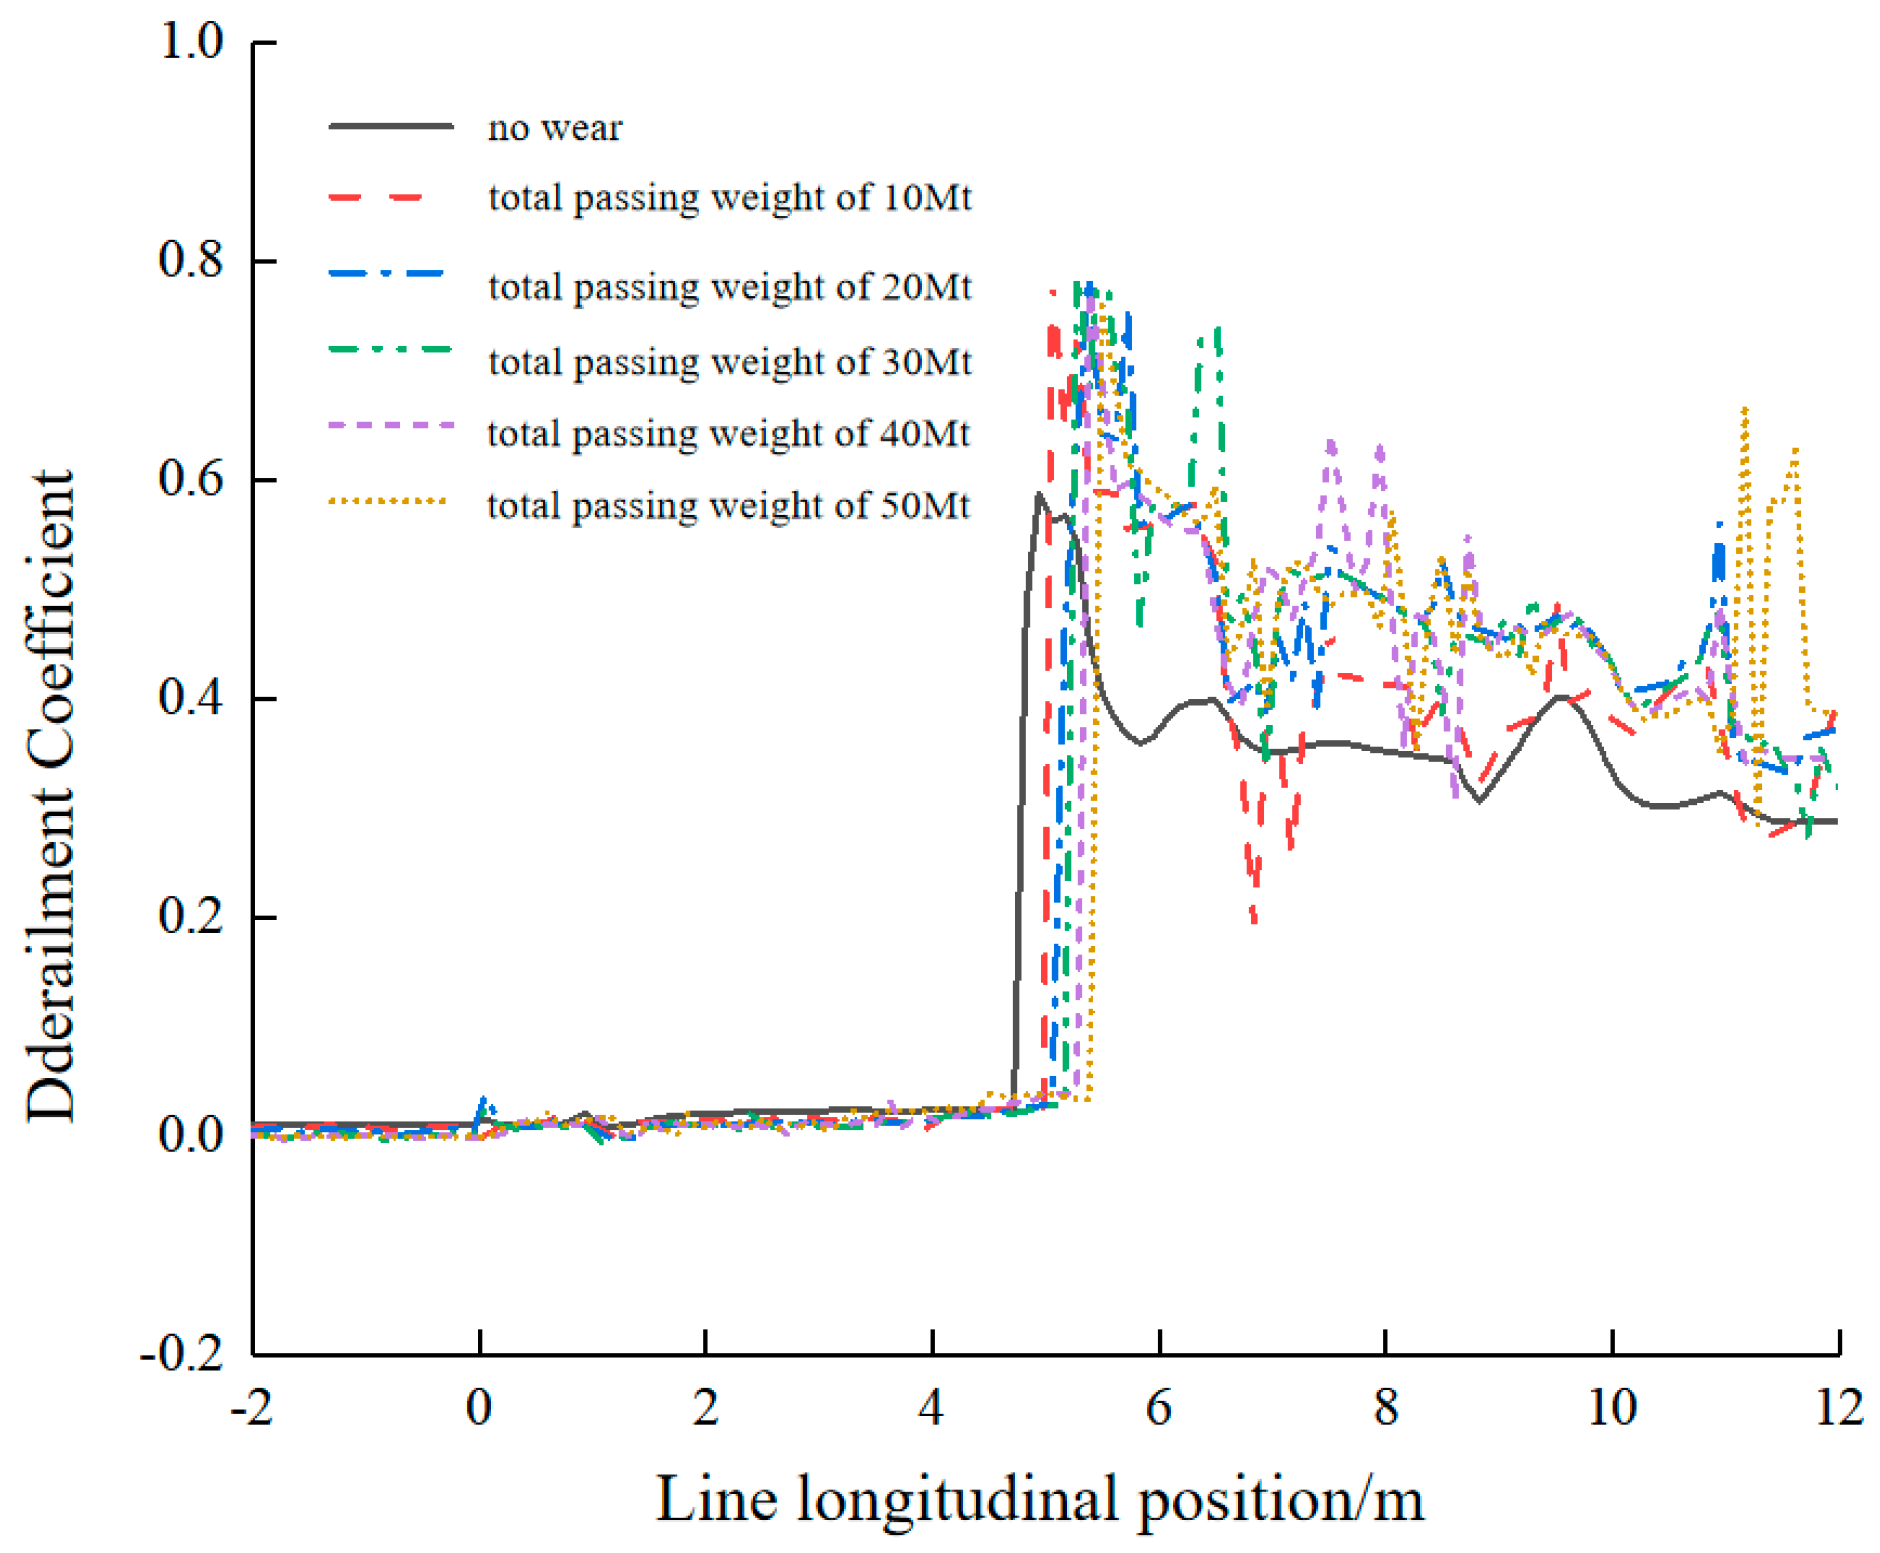
4.3. Derailment Coefficient
4.4. Vehicle Running Stability
5. The Effect of Wheel Wear on Vehicle Dynamic Performance
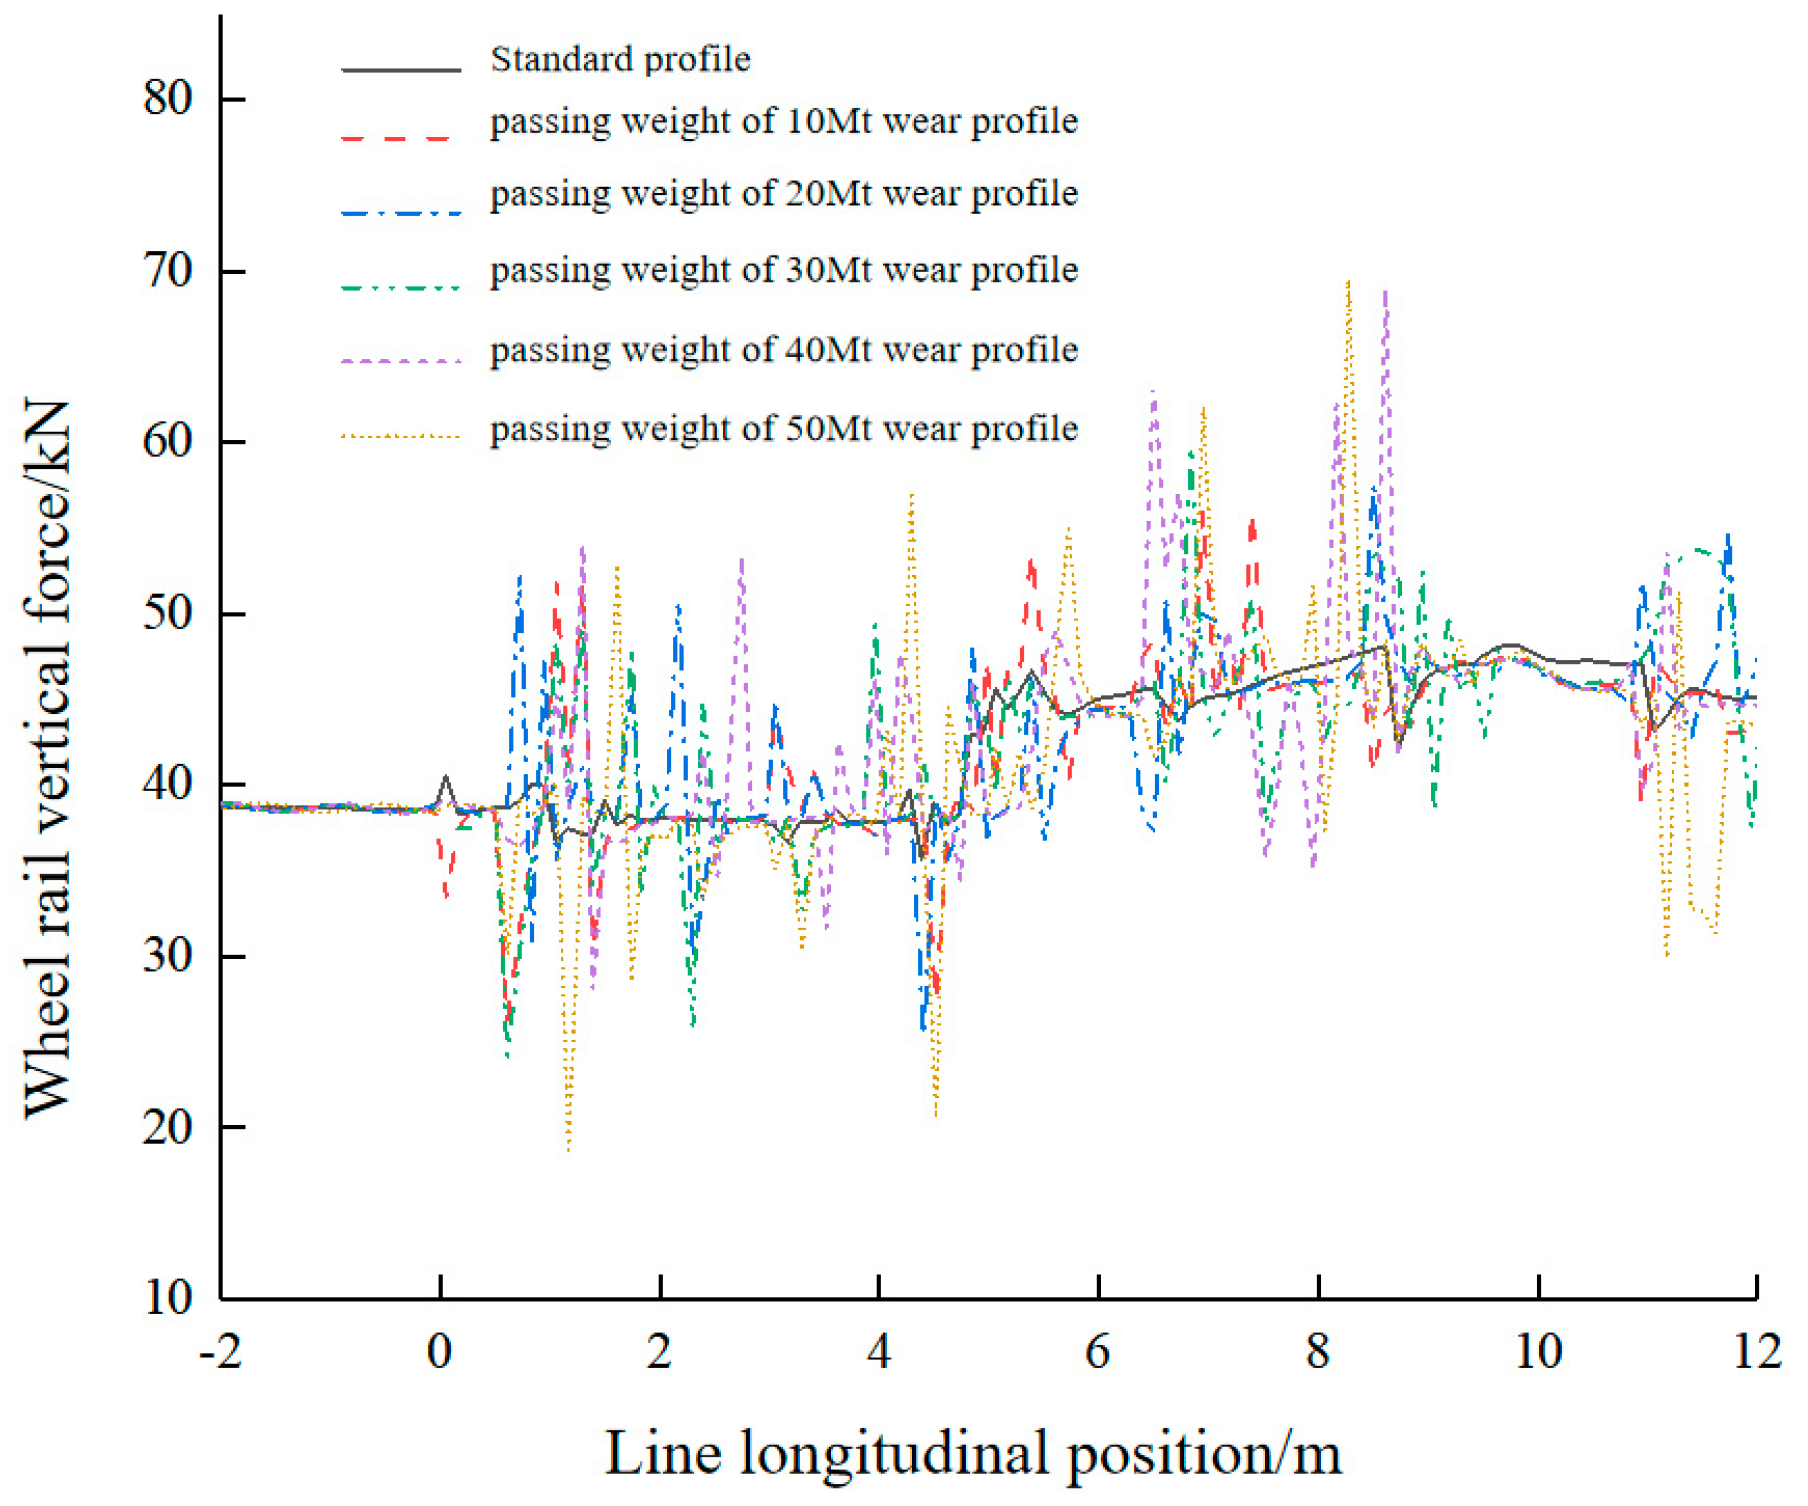
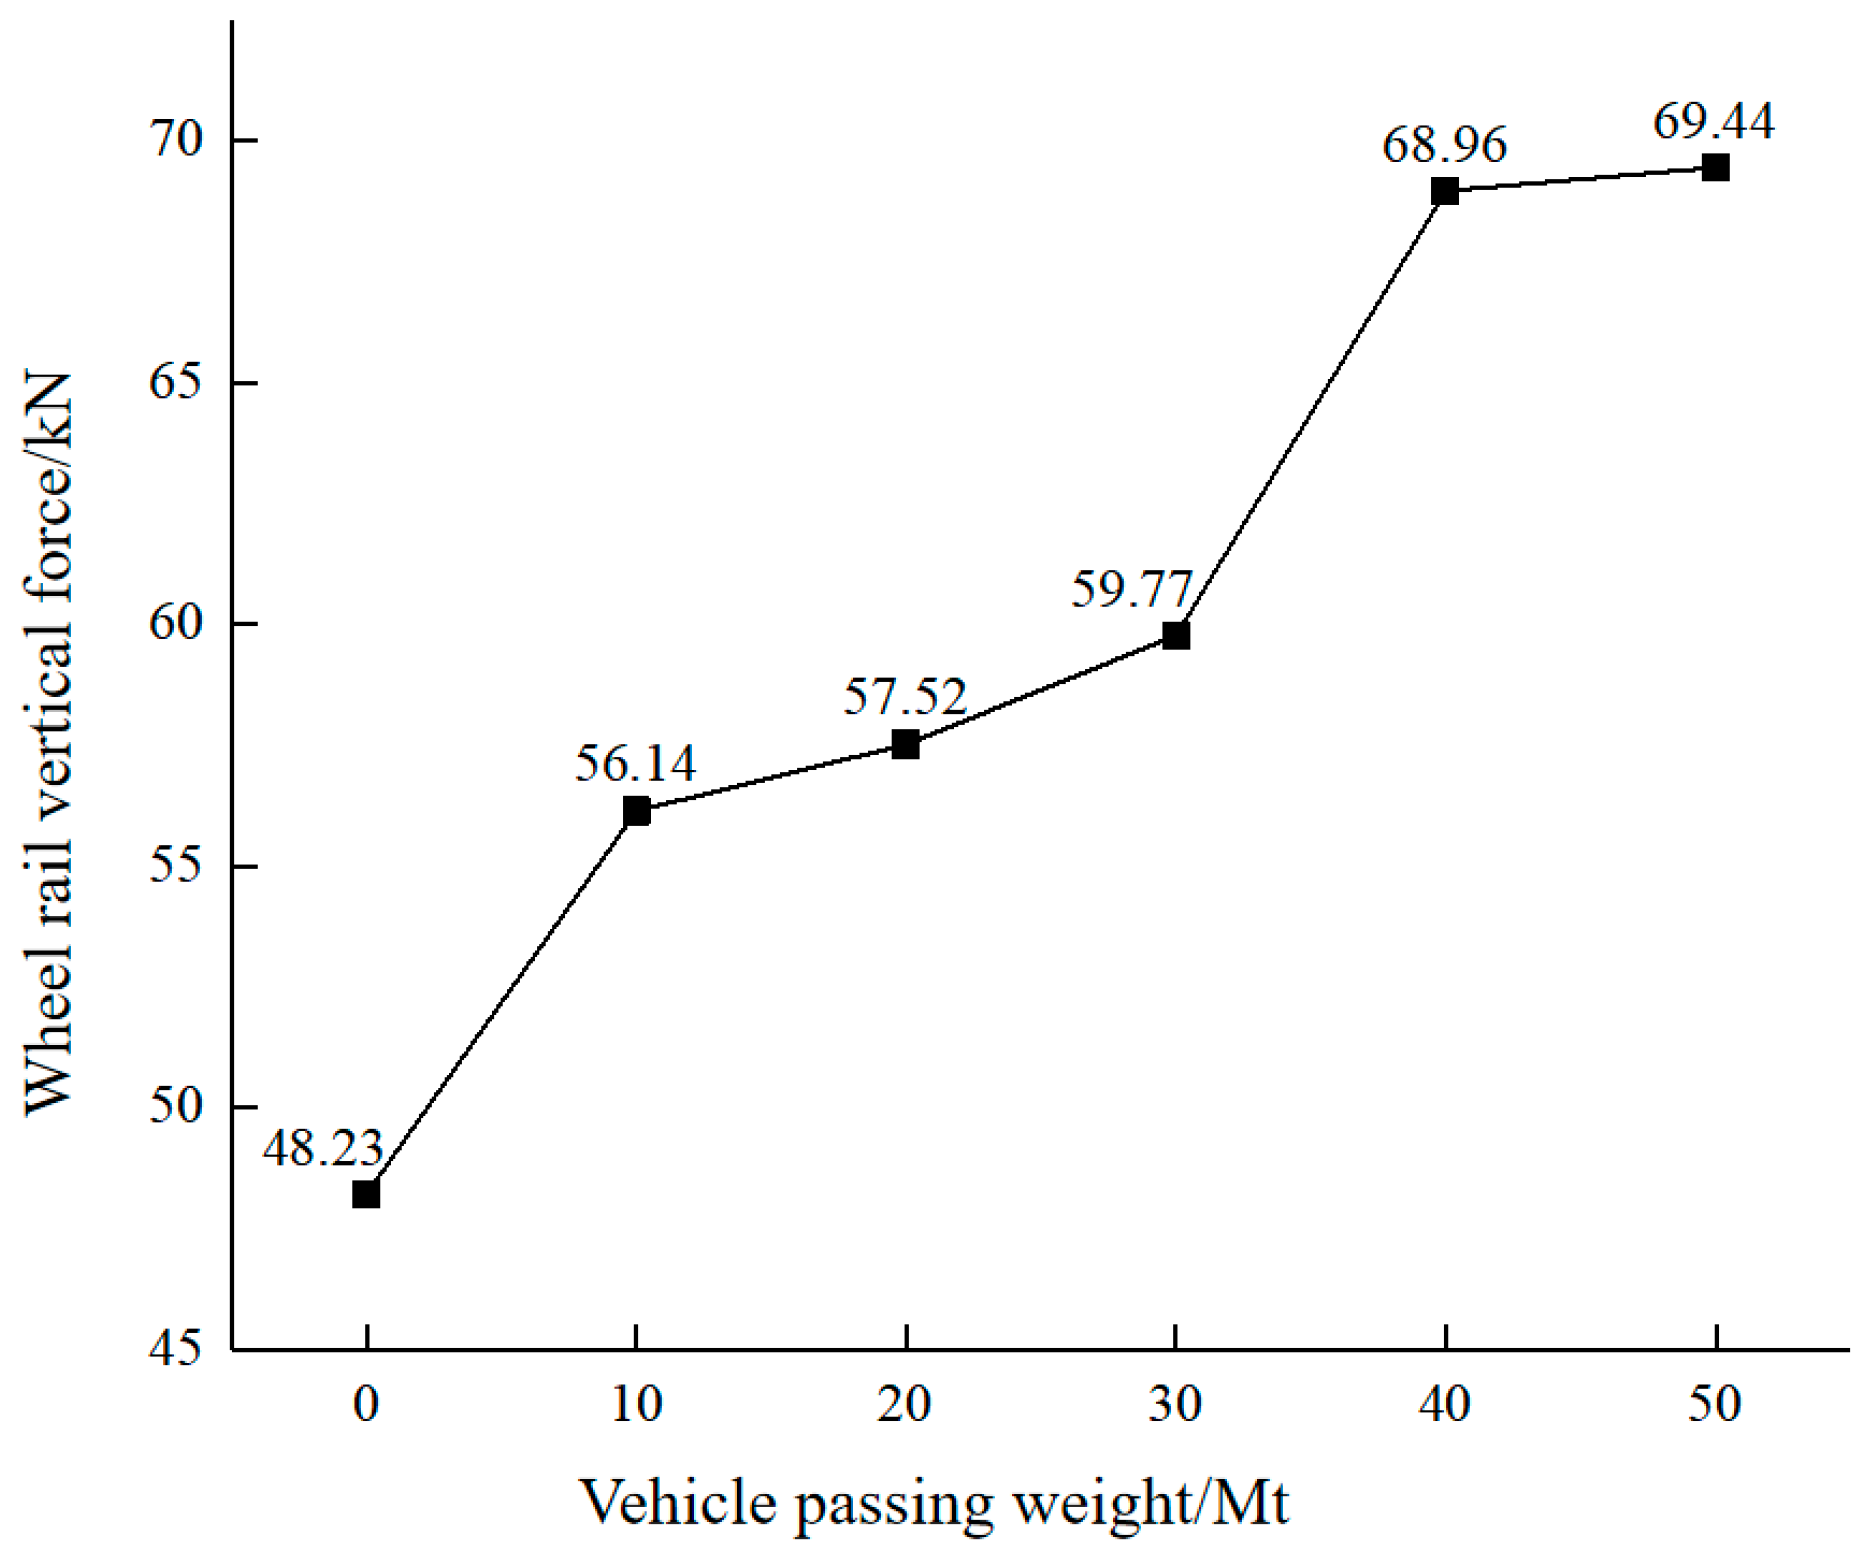
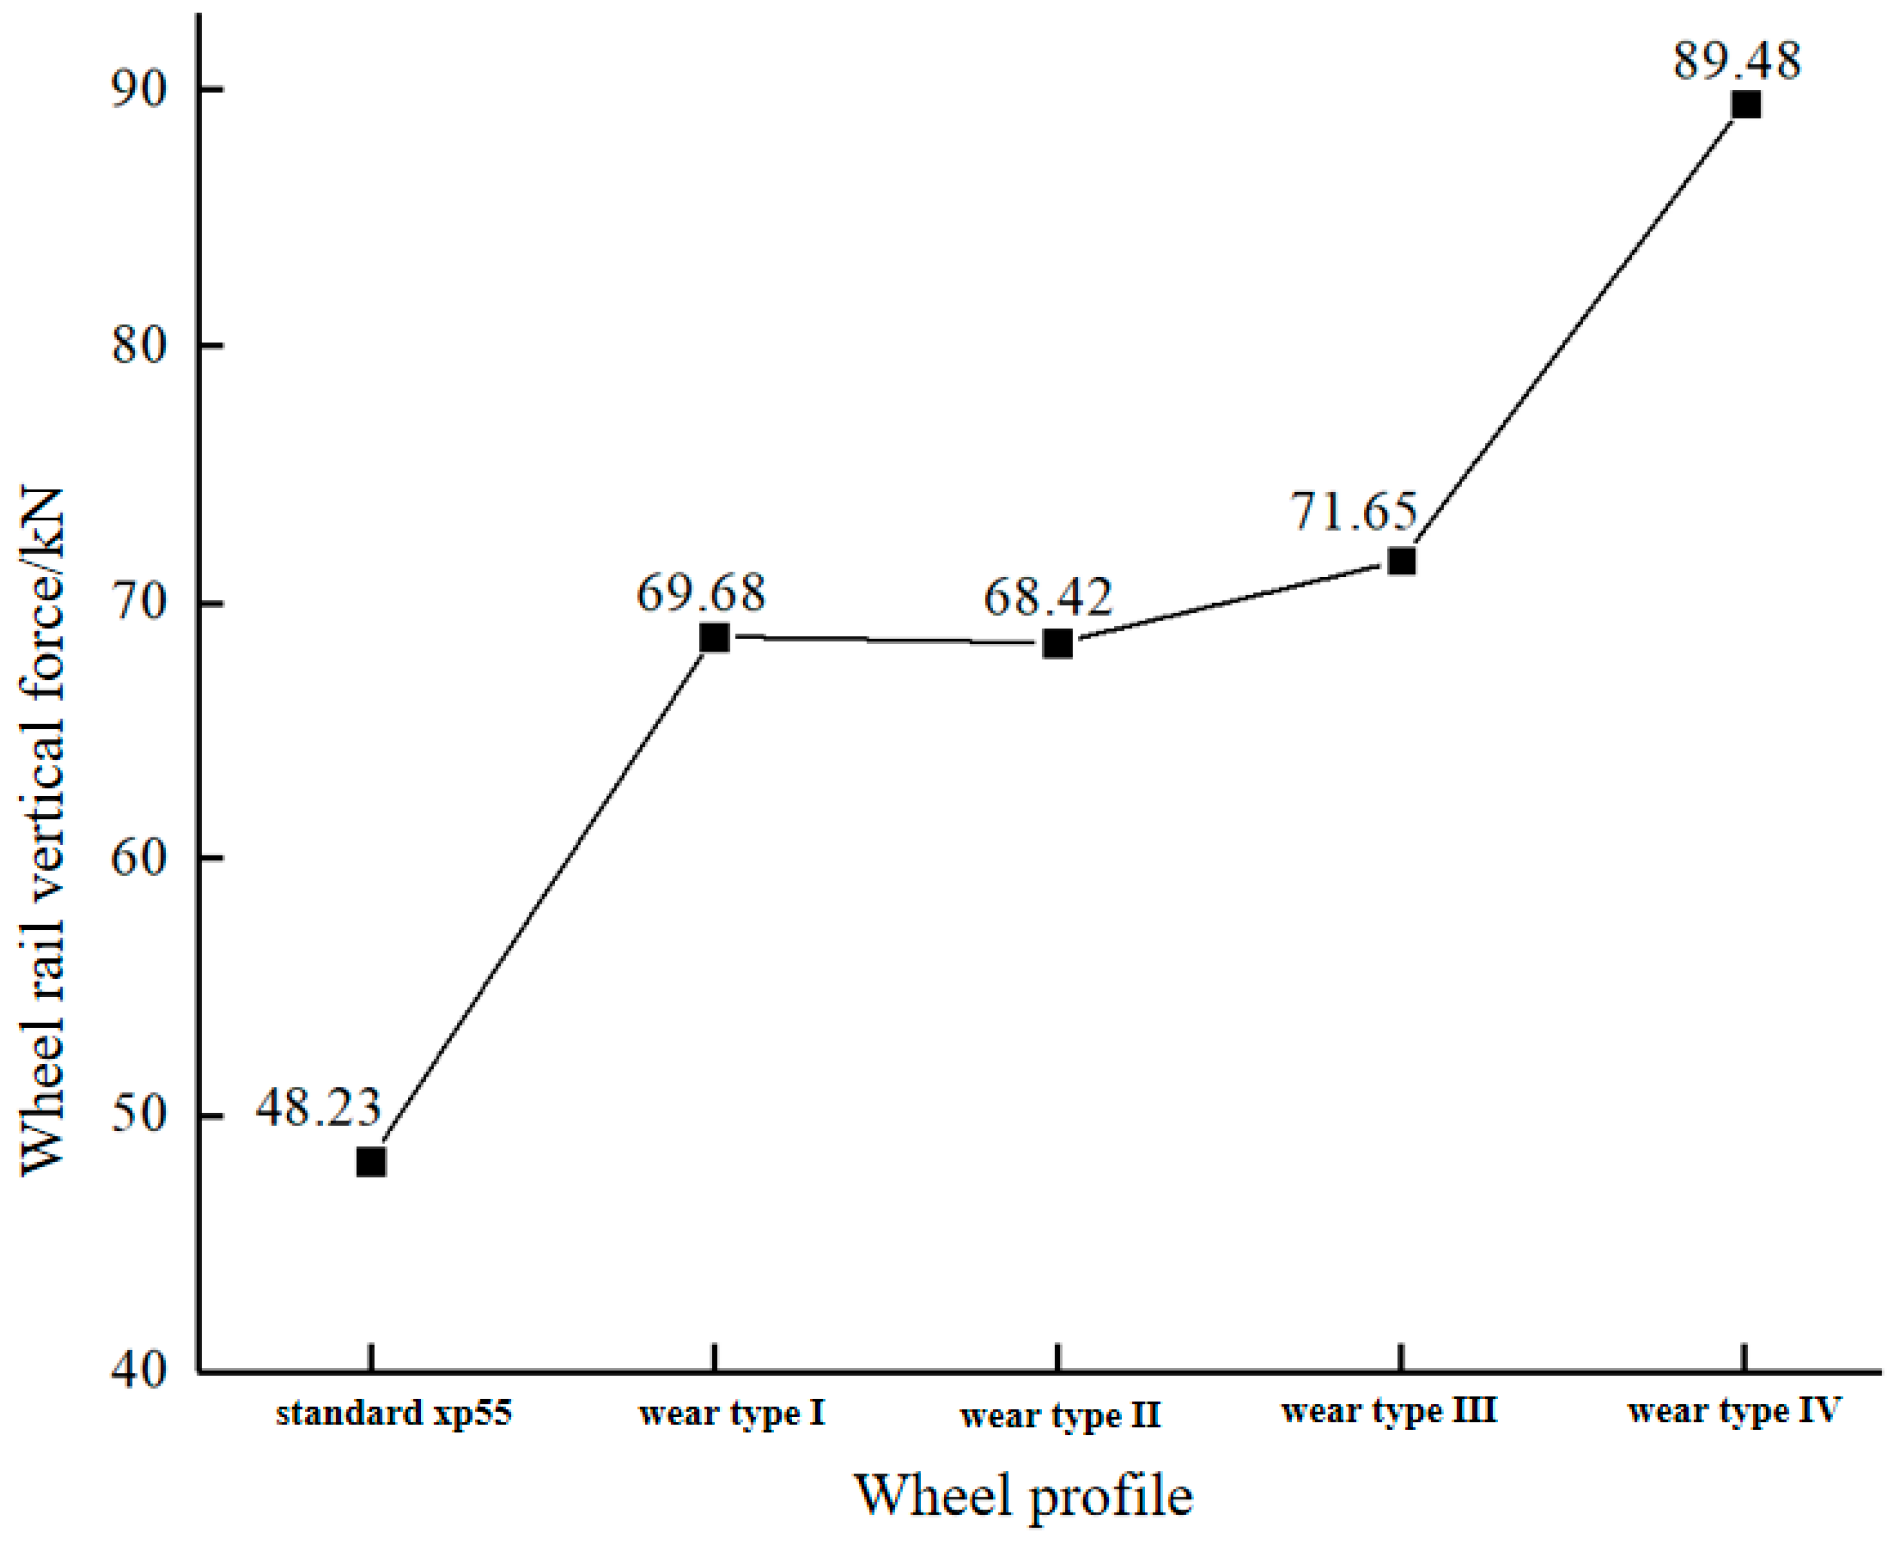
5.1. Vertical Force
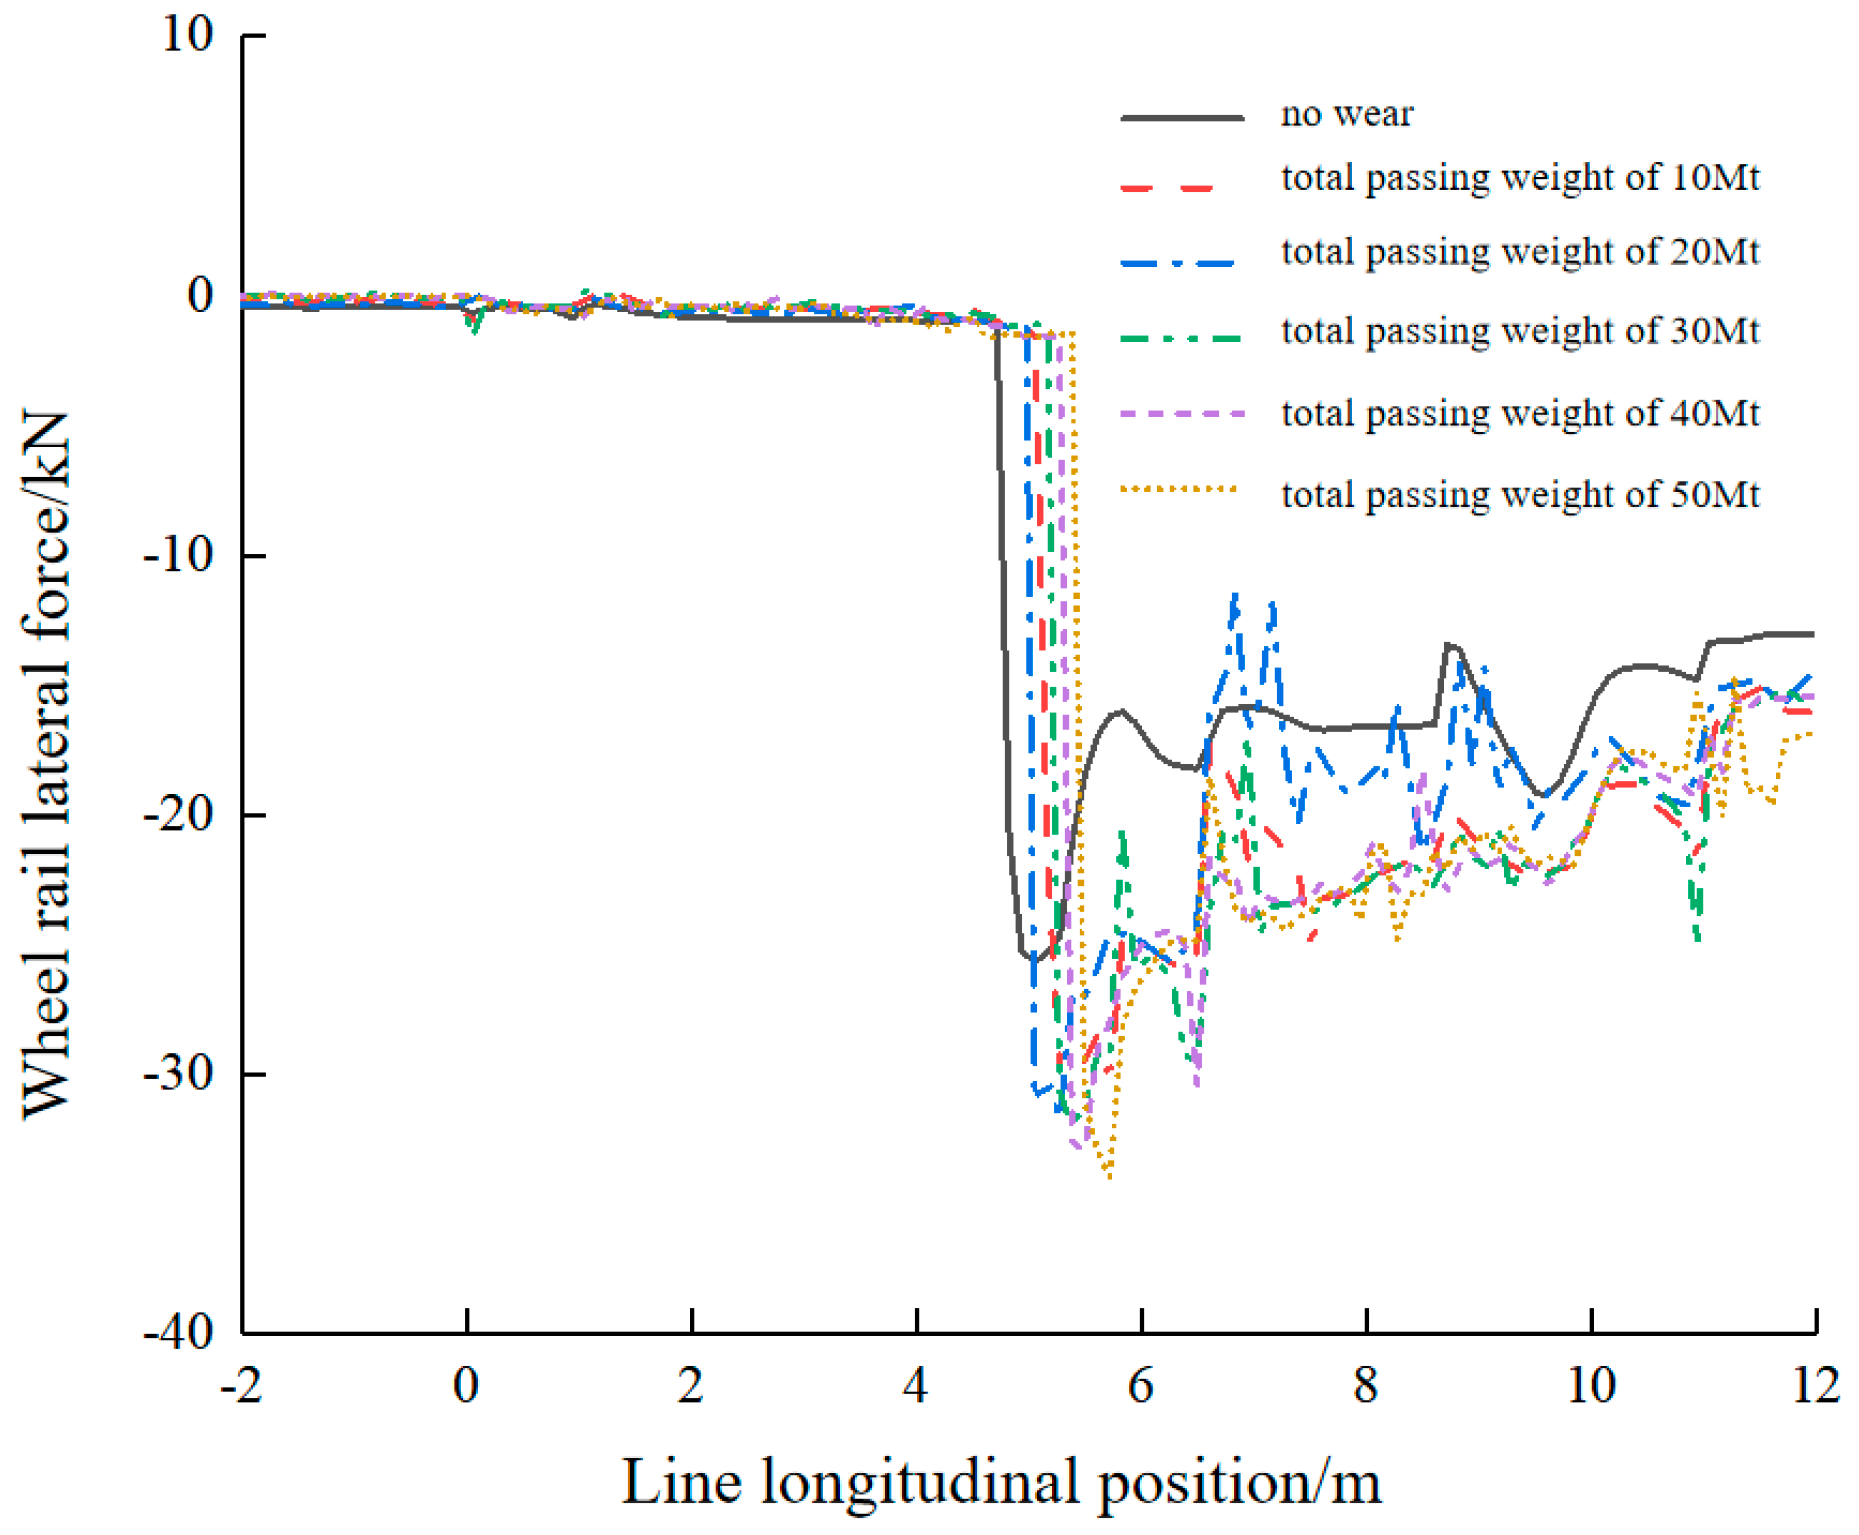
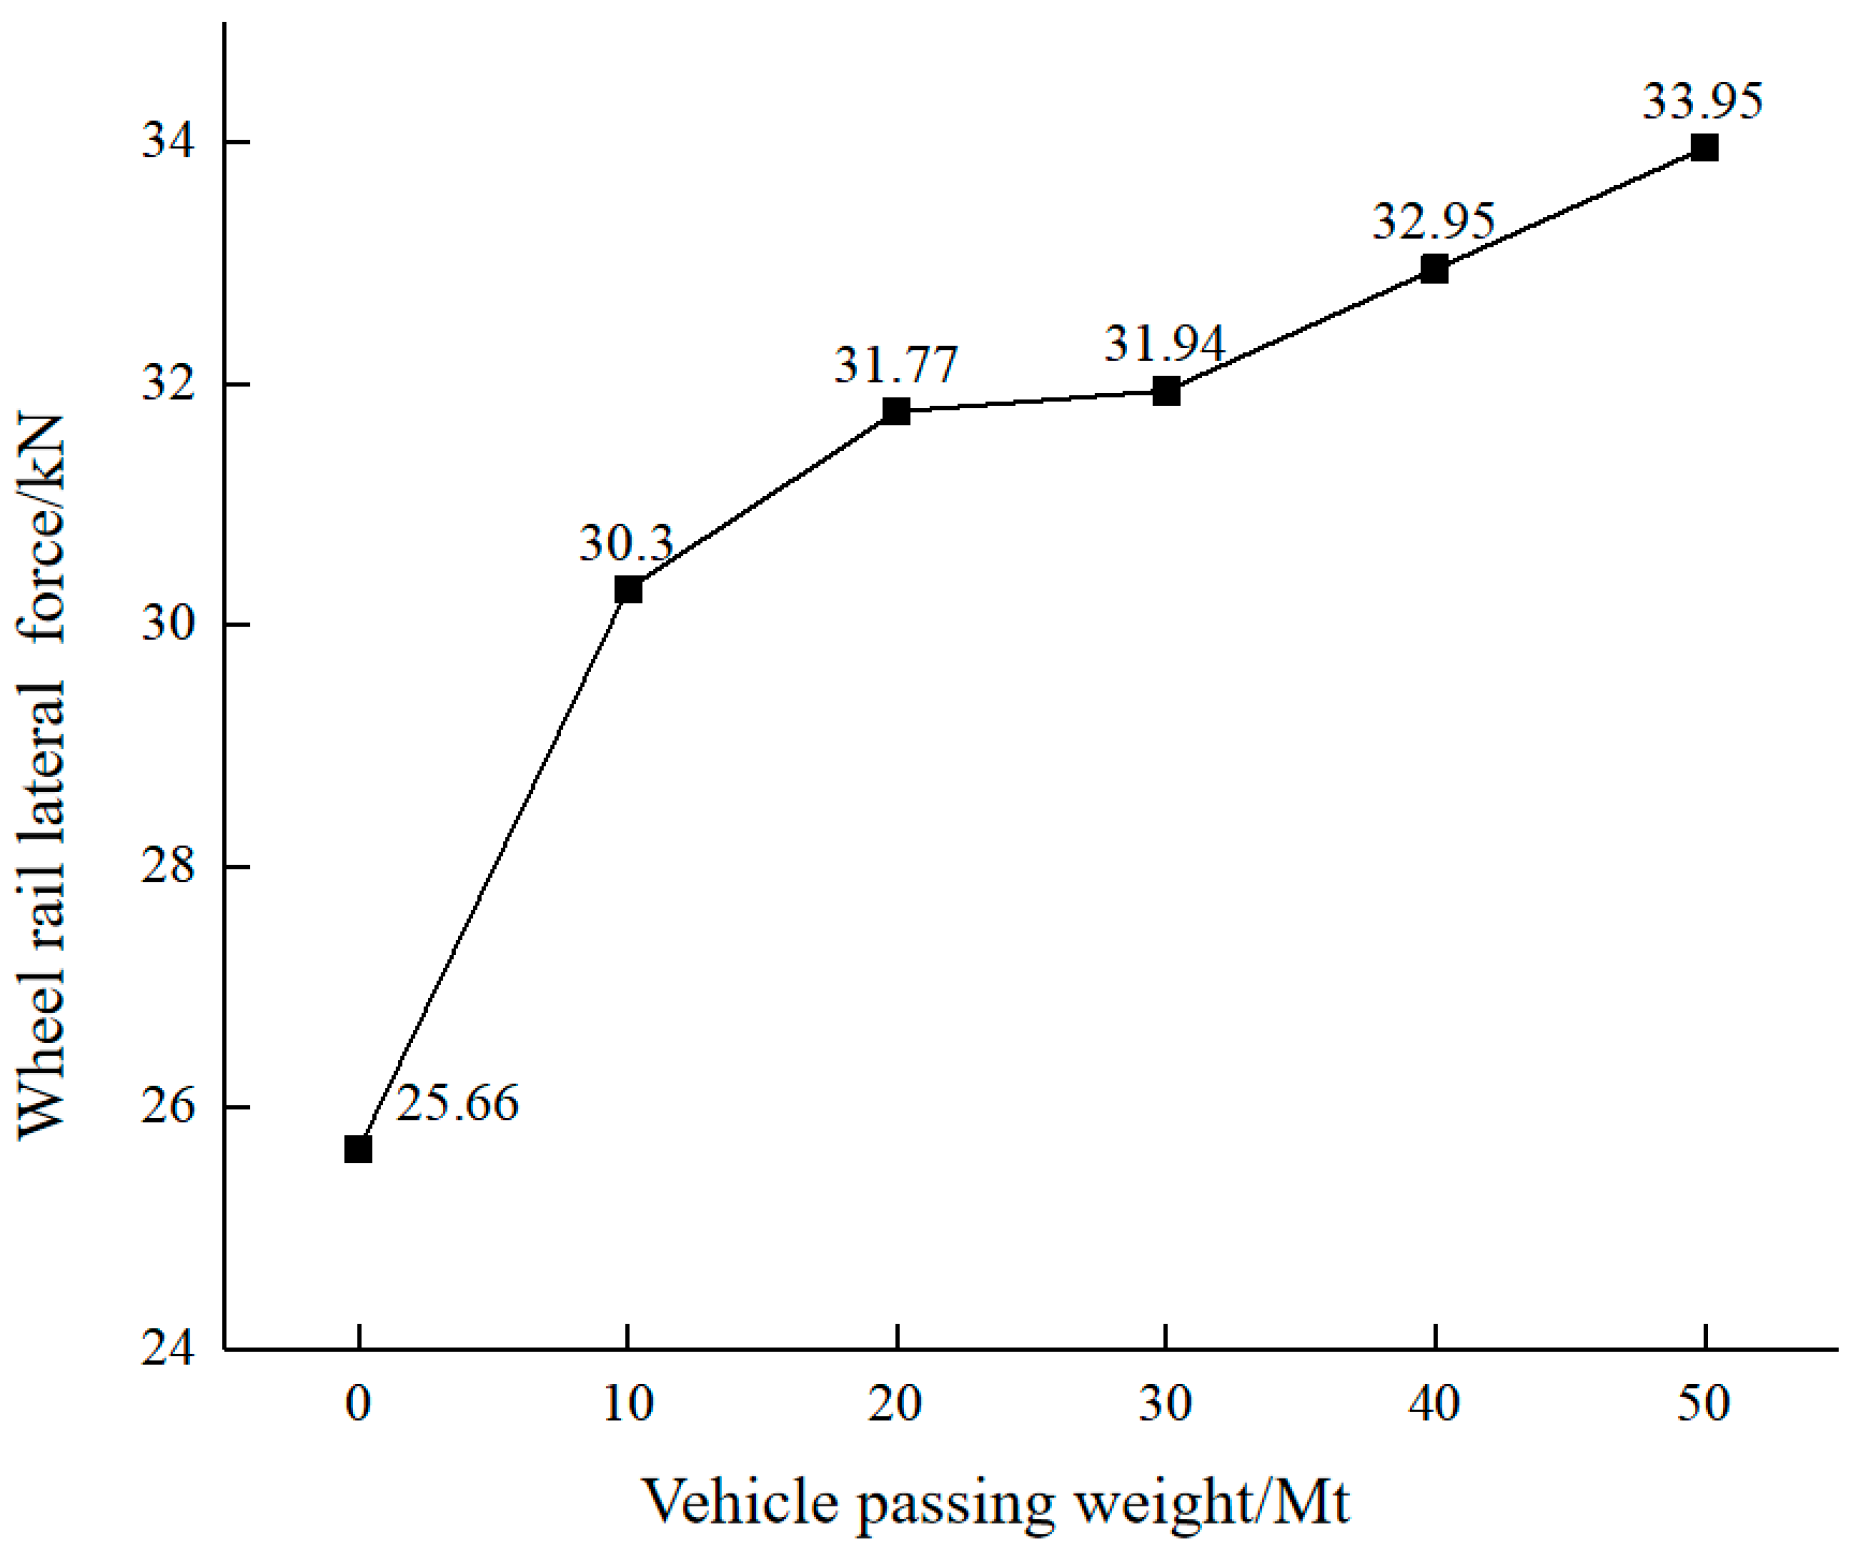
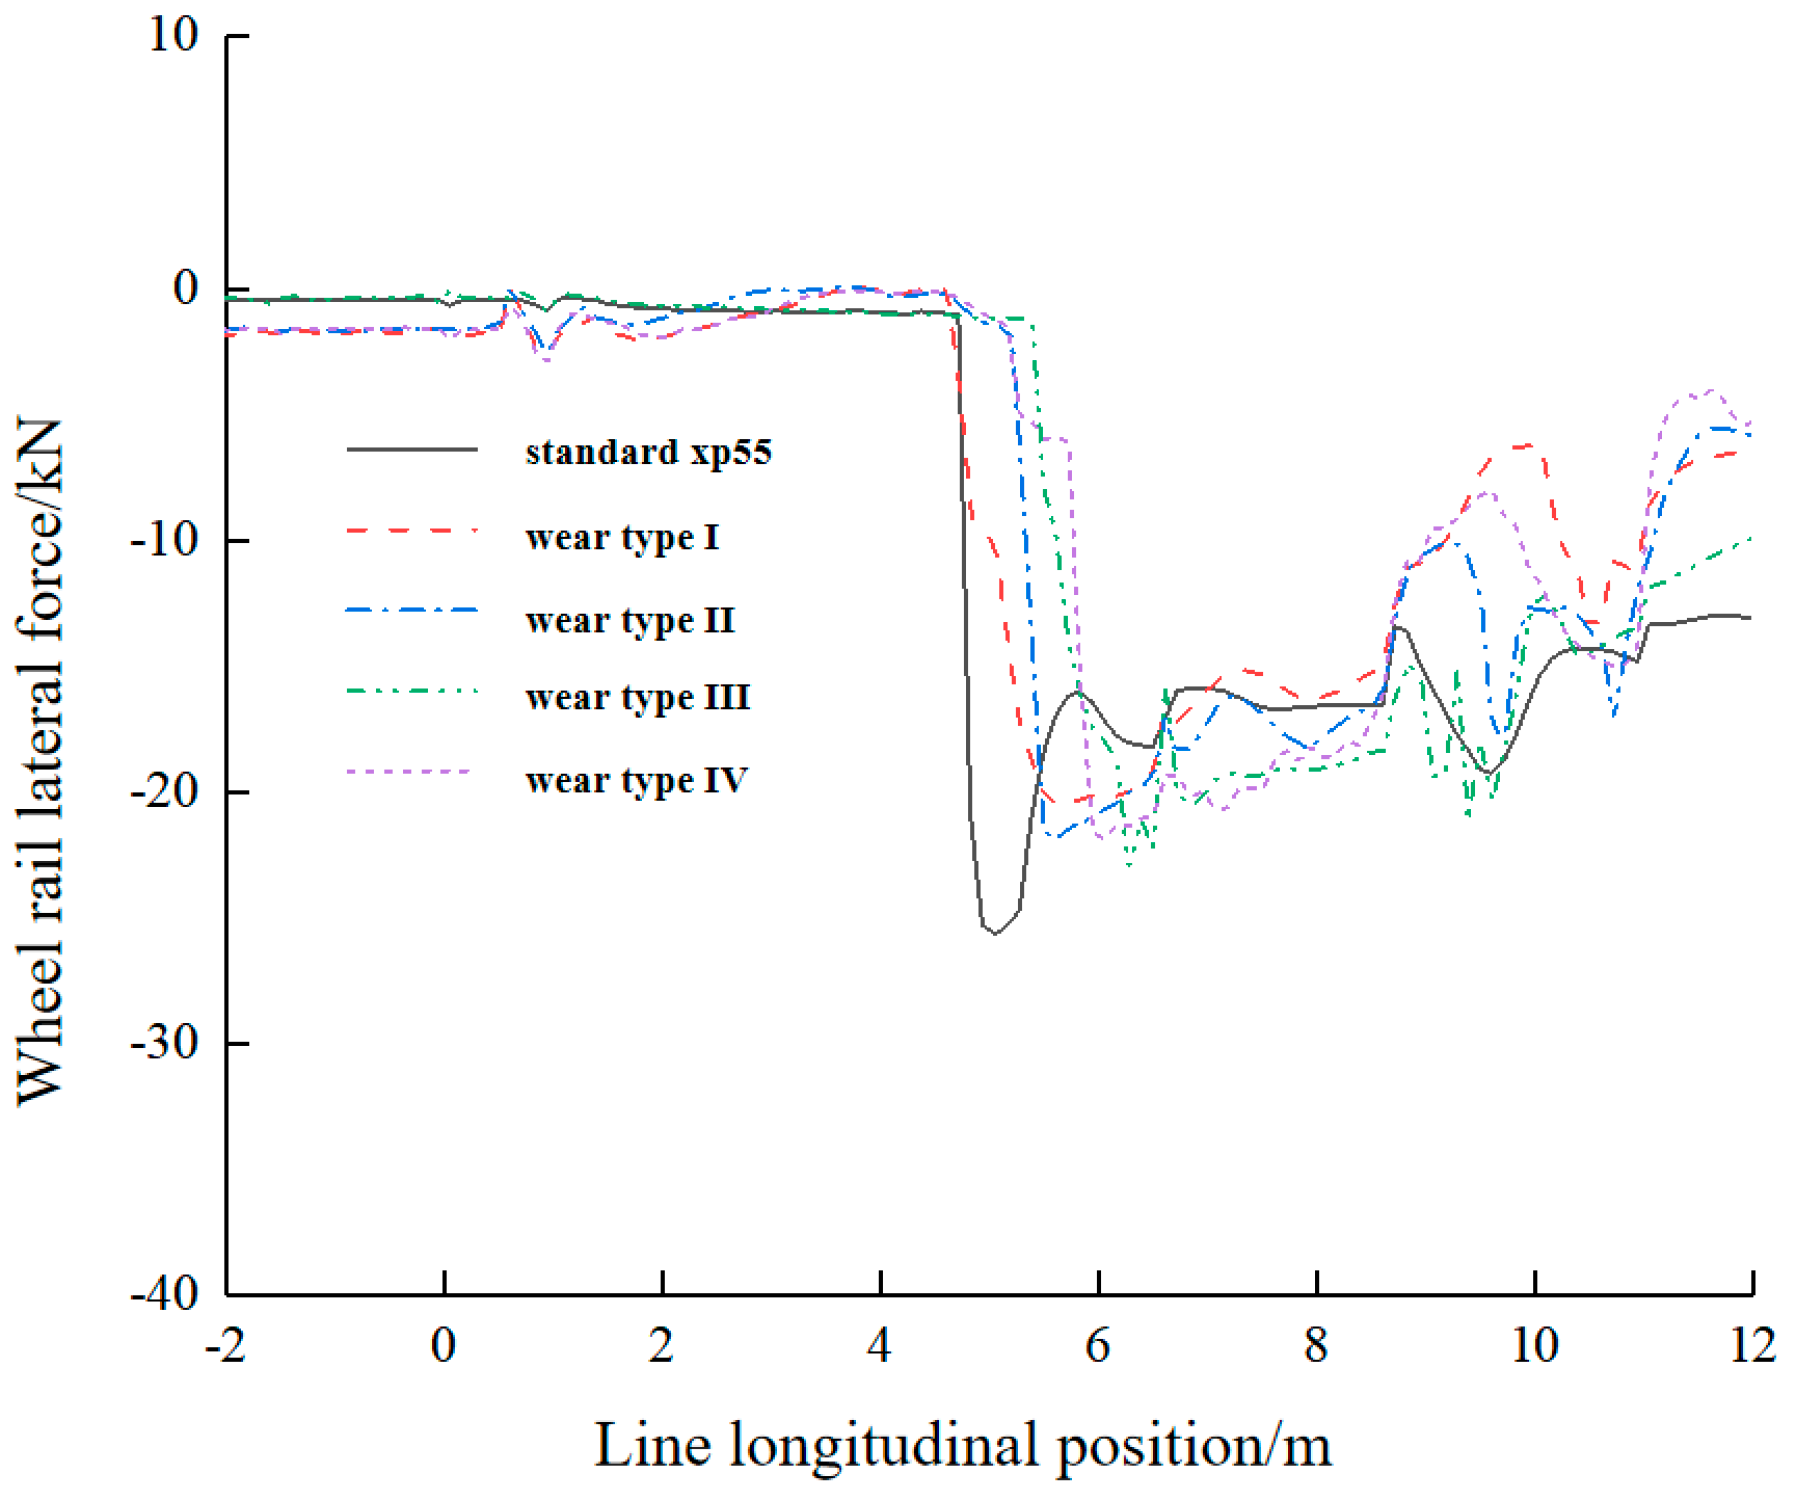
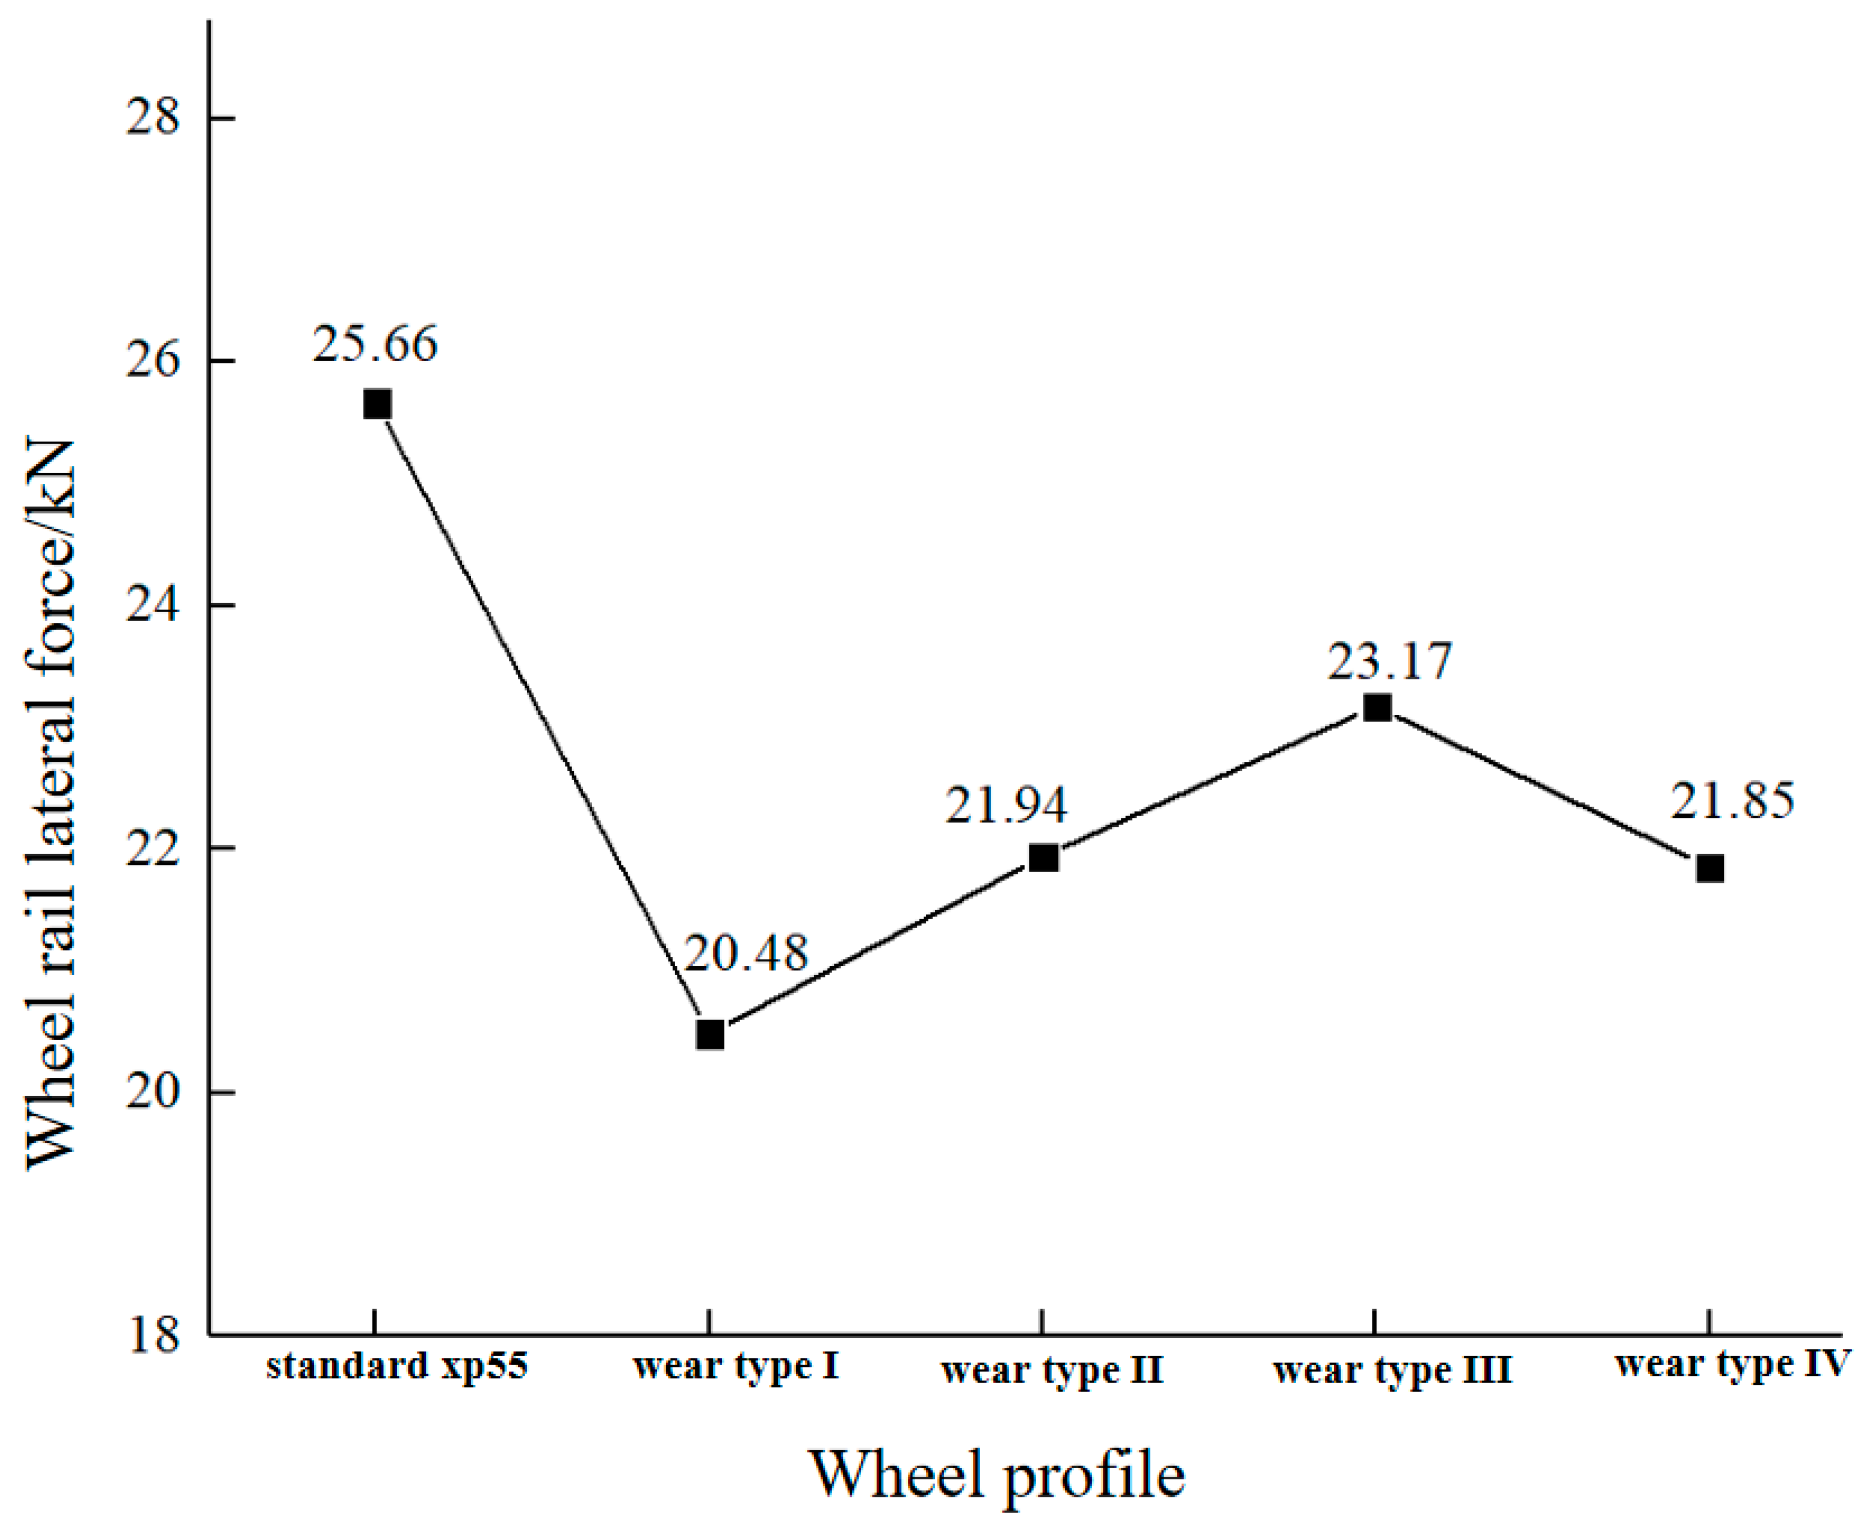
5.2. Lateral Force
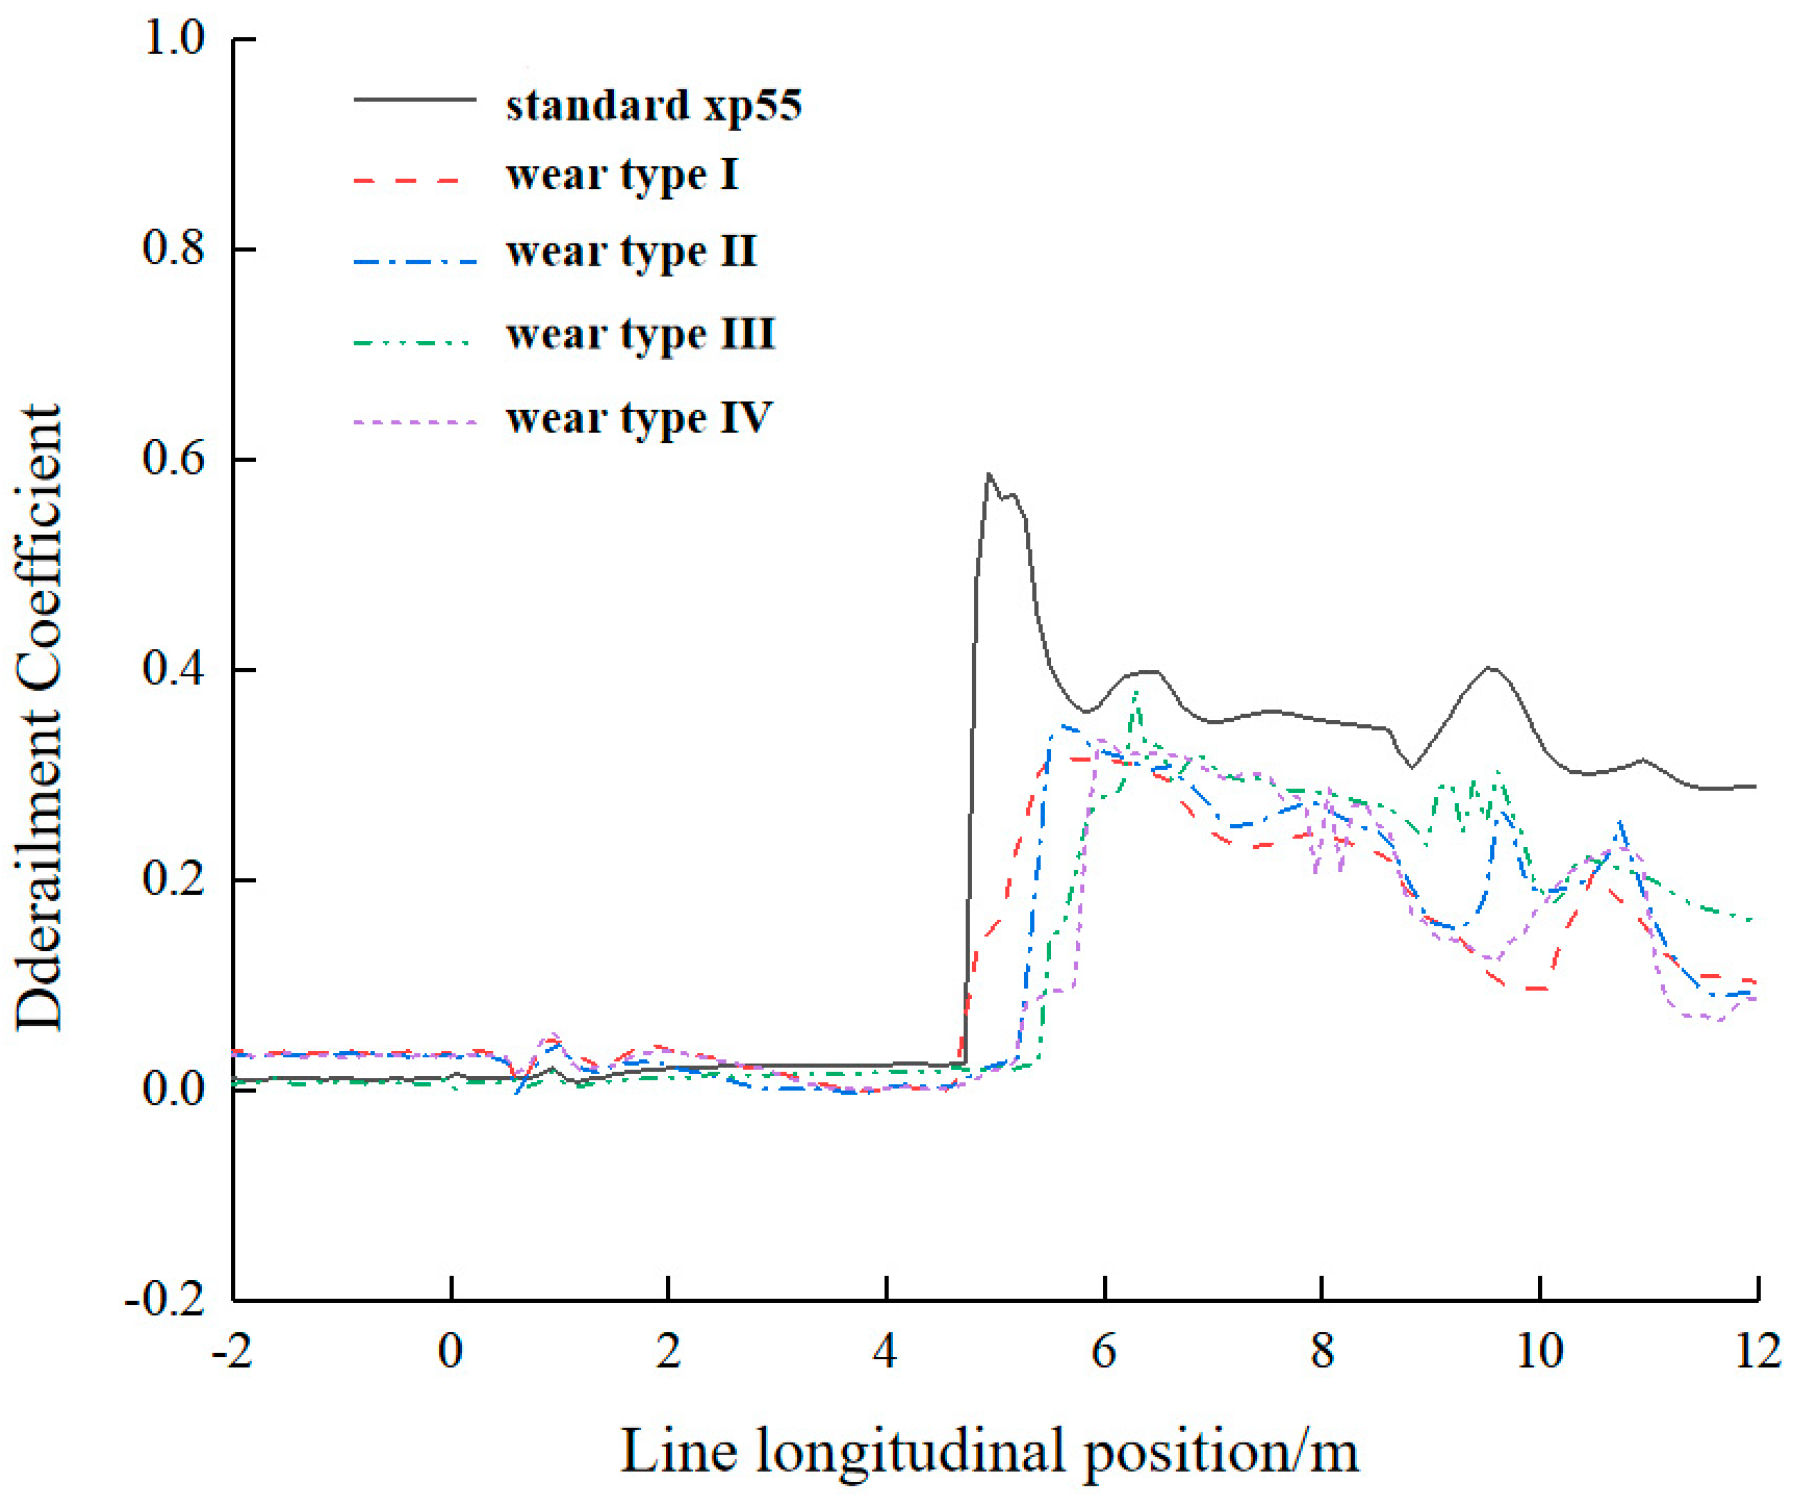
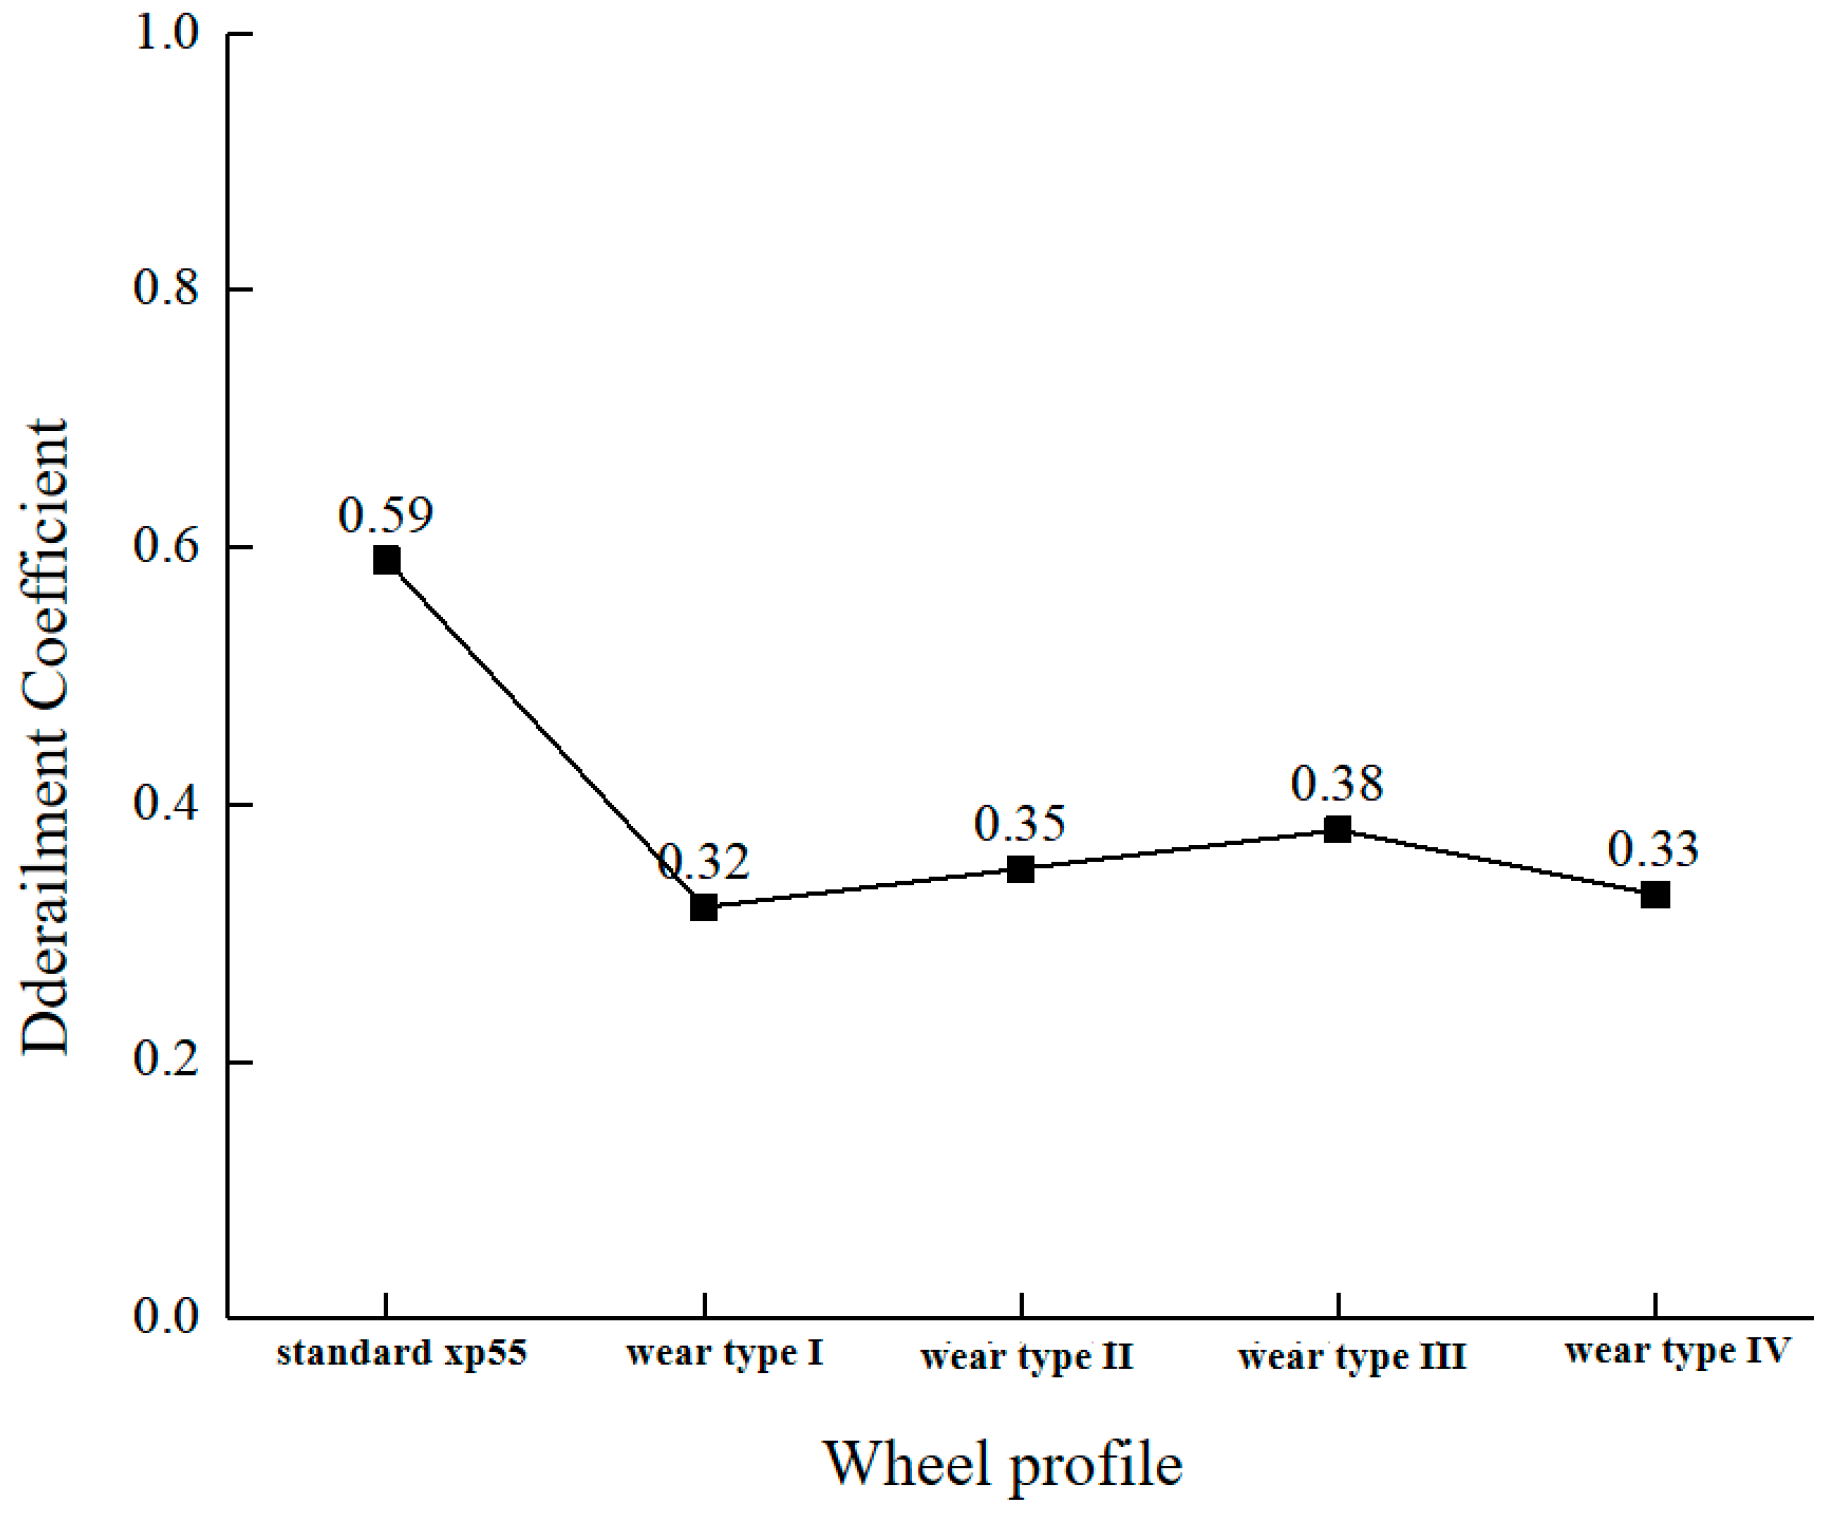
5.3. Derailment Coefficient
5.4. Vehicle Running Stability
6. Conclusions
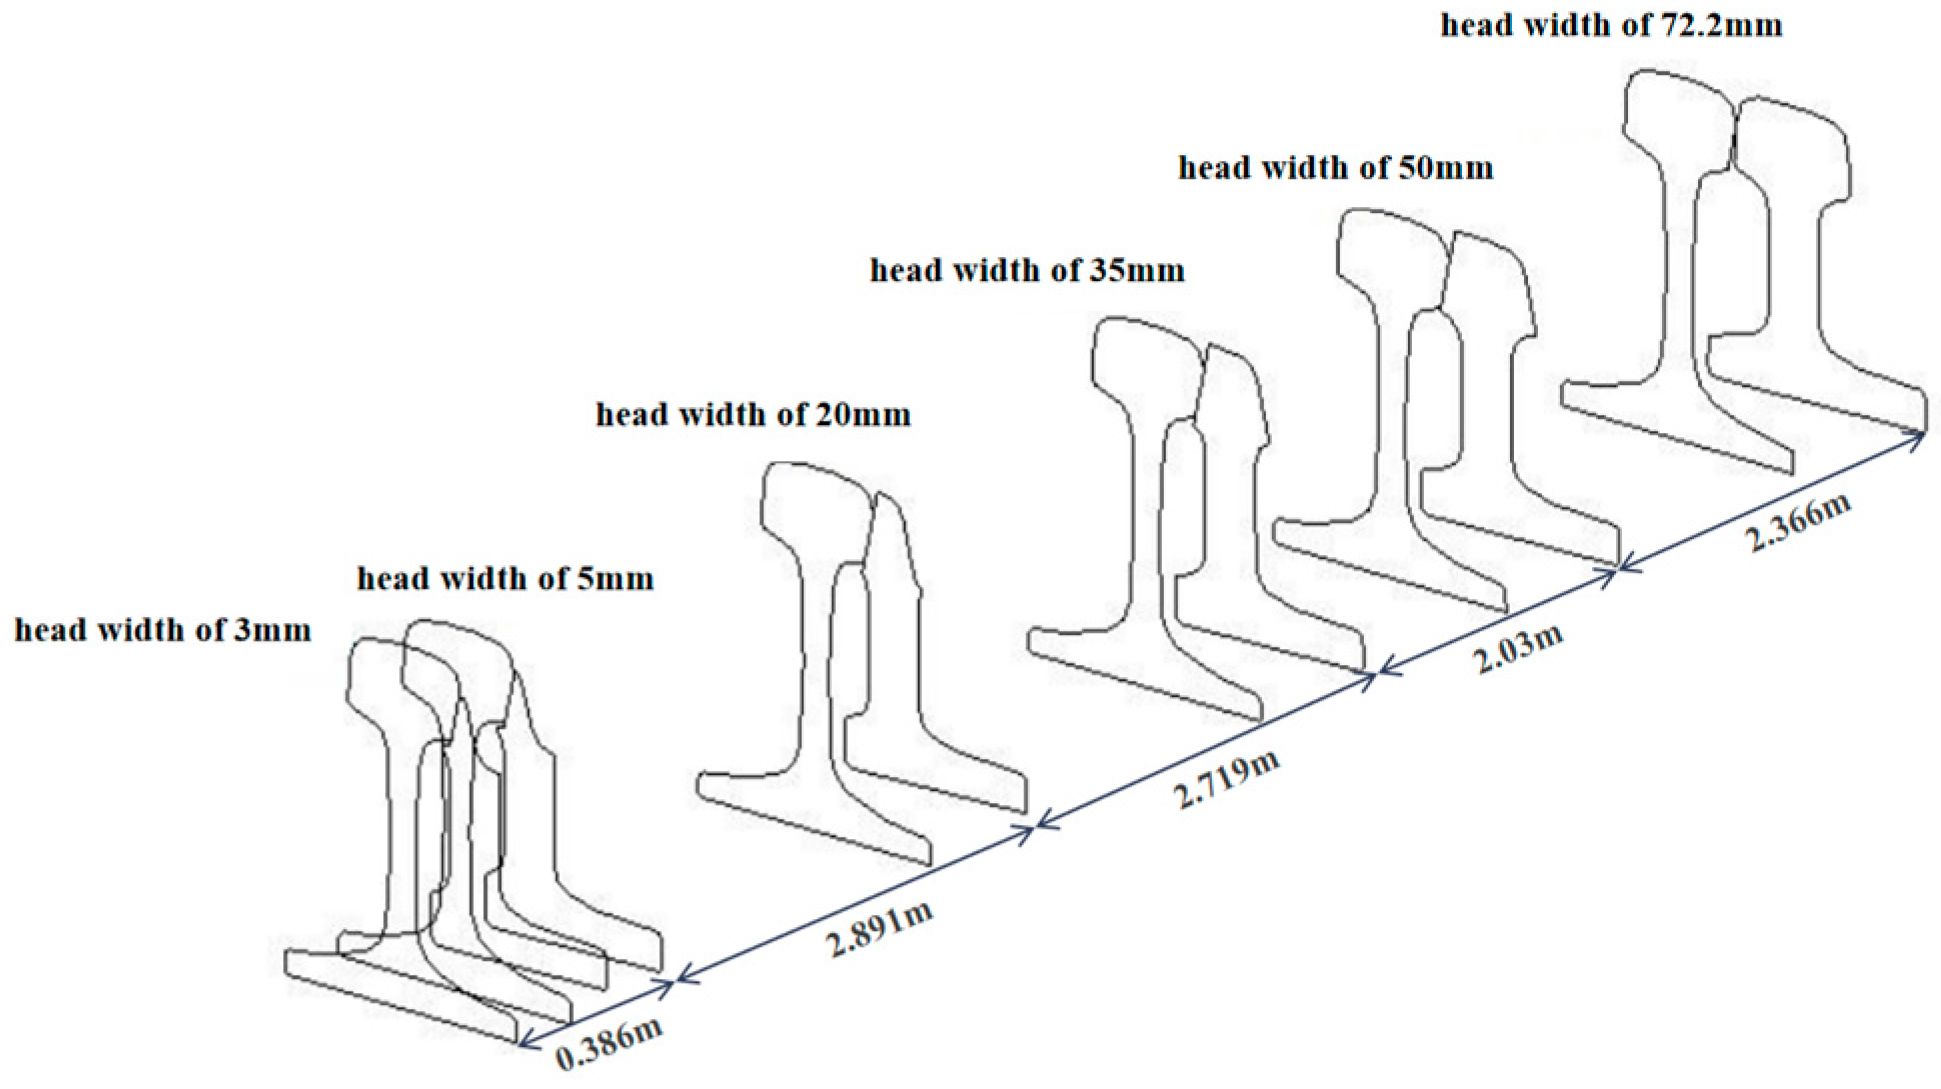
- When the wheel passes through the area of the curved switch rail with a head width of 3–35 mm, the wheels make simultaneous contact with the stock rail and curved switch rail. As the head width increases, the height of the curved switch rail will exceed the height of the stock rail, and the wheels will travel from the stock rail to the curved switch rail. In the area with the head width of 35–50 mm, the wheel completely transitions to the curved switch rail.
- As the head width of the curved switch rail increases, the position of the maximum wear depth is transferred from the stock rail to the shoulder of the curved switch rail. For the same total passing weight, the side wear of the curved switch rail with a head width of 20 mm suffers the most severe wear. The cross-sectional area of the curved switch rail at the head width of 20 mm is small; the wheels transition from the stock rail to the curved switch rail, and the wheel flange is close to the curved switch rail. This causes significant wear in this position.
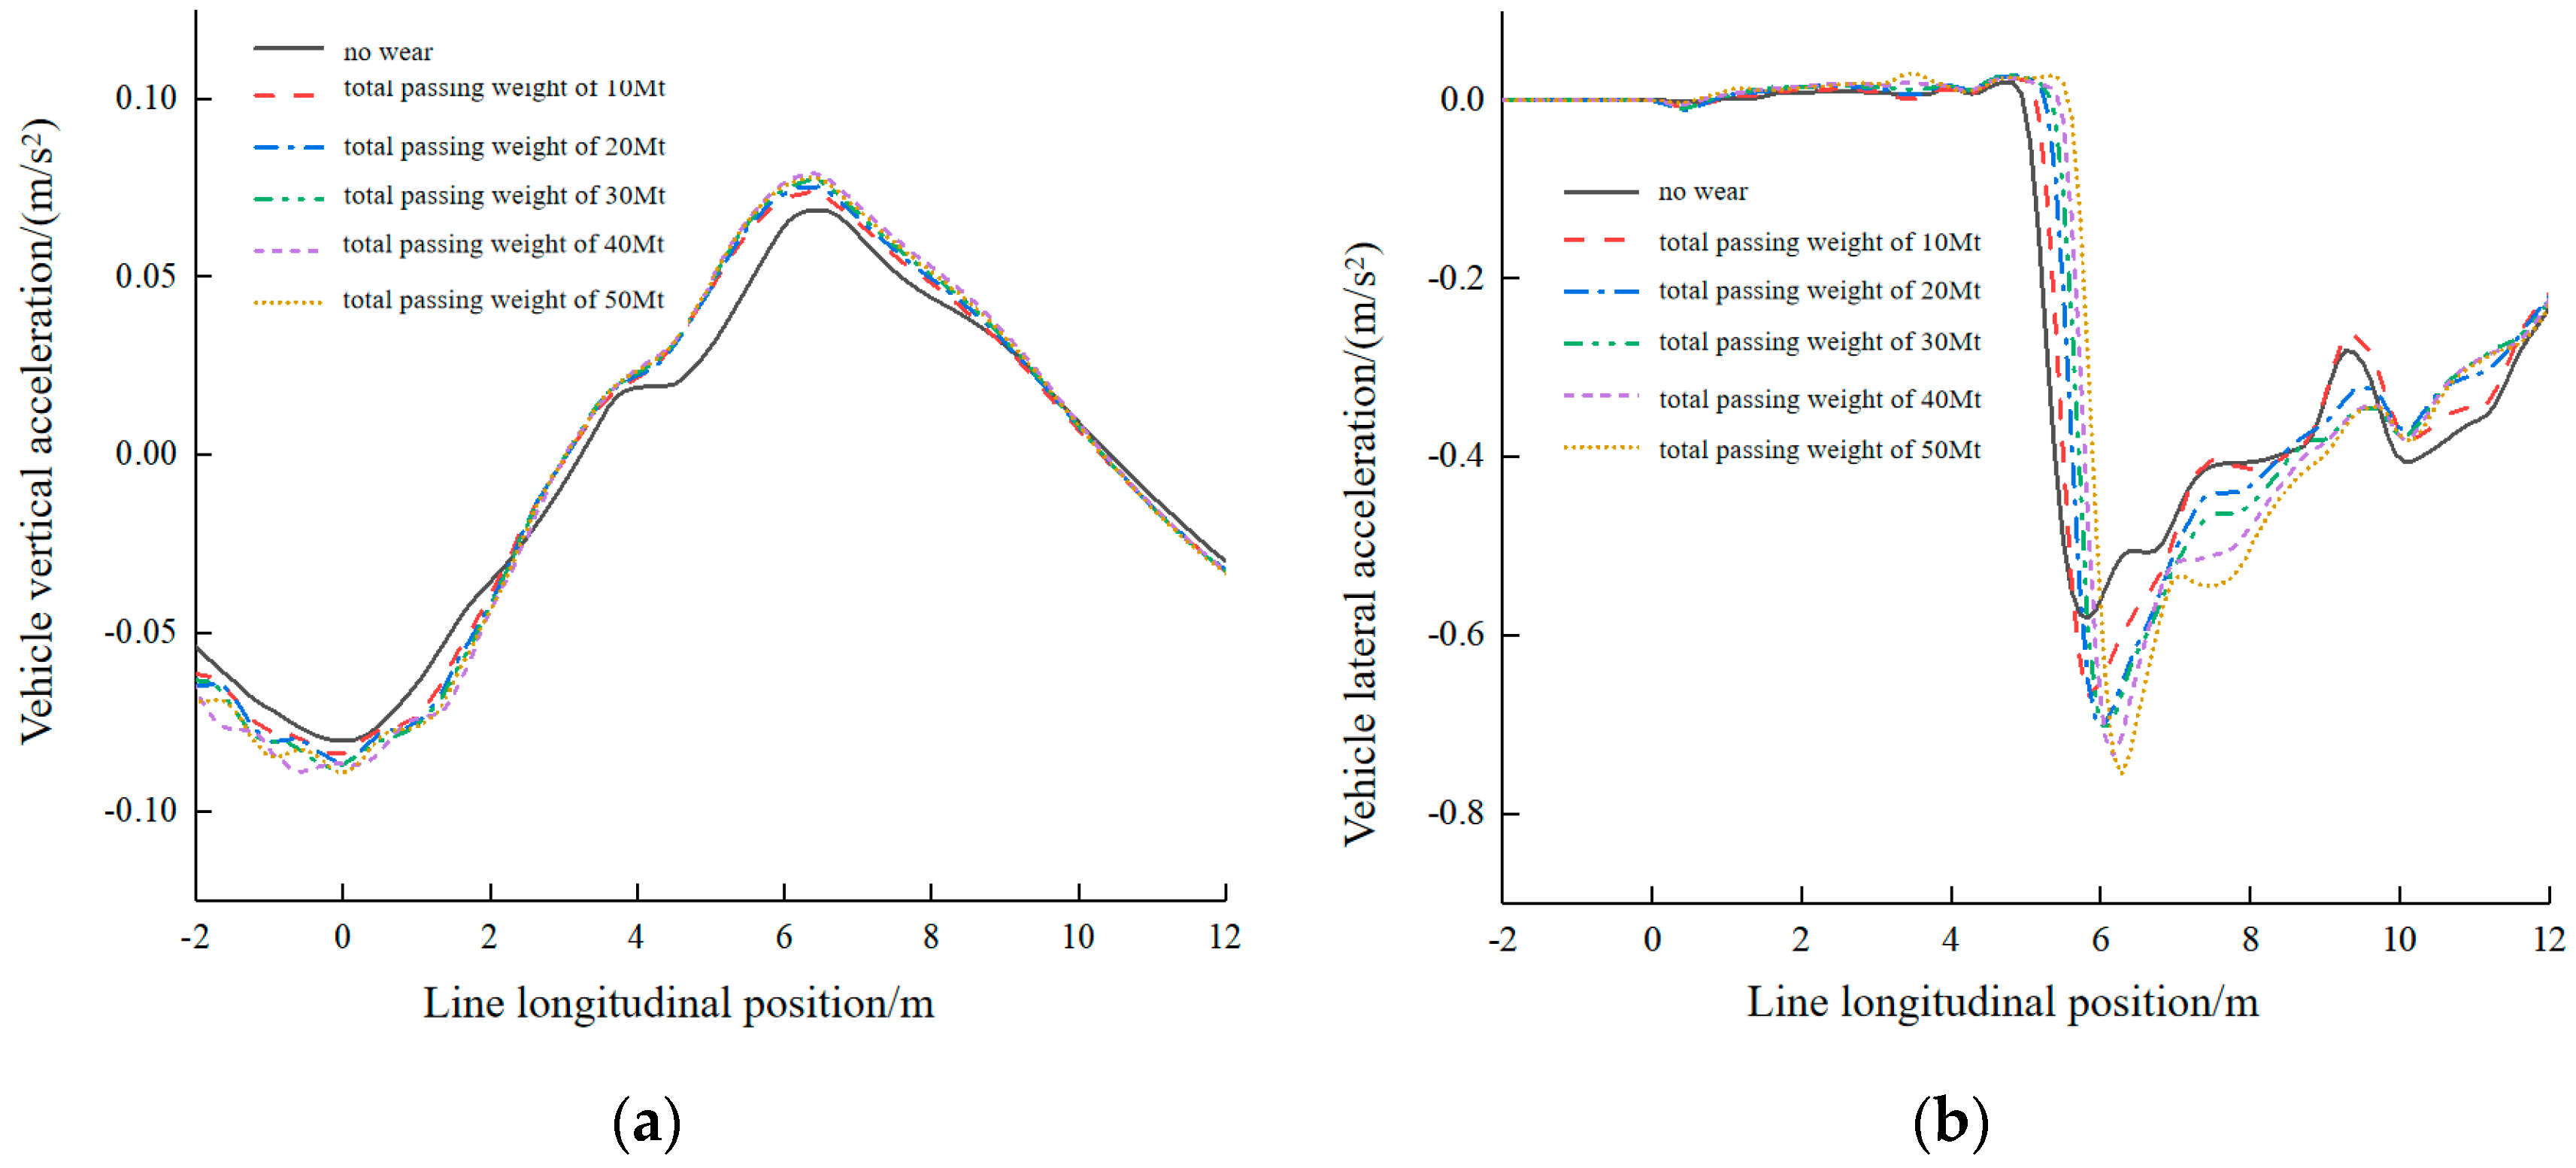
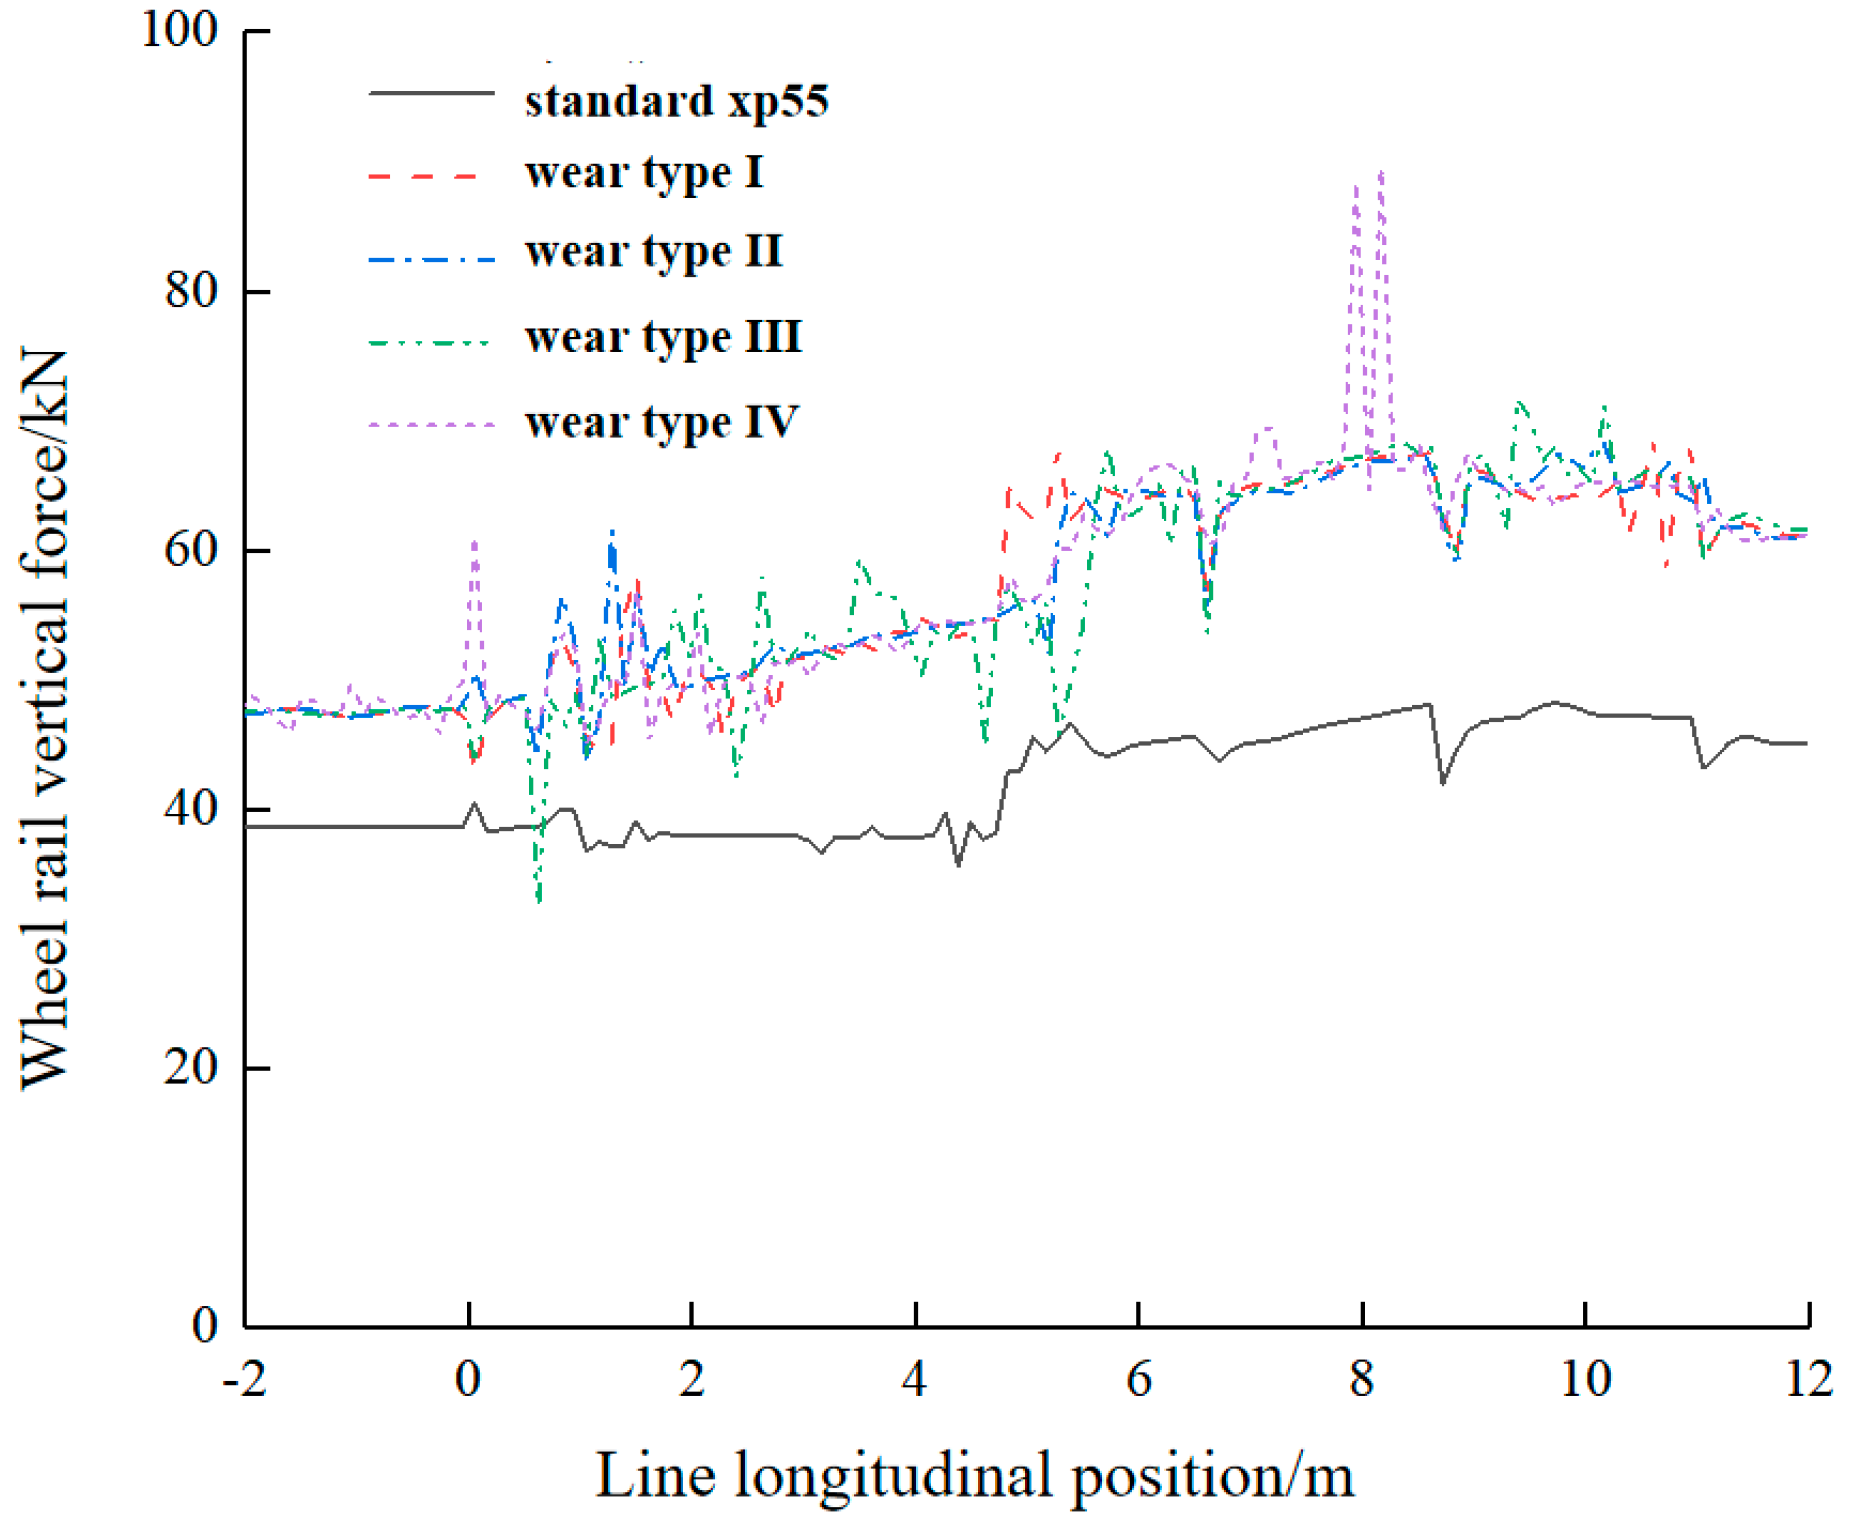
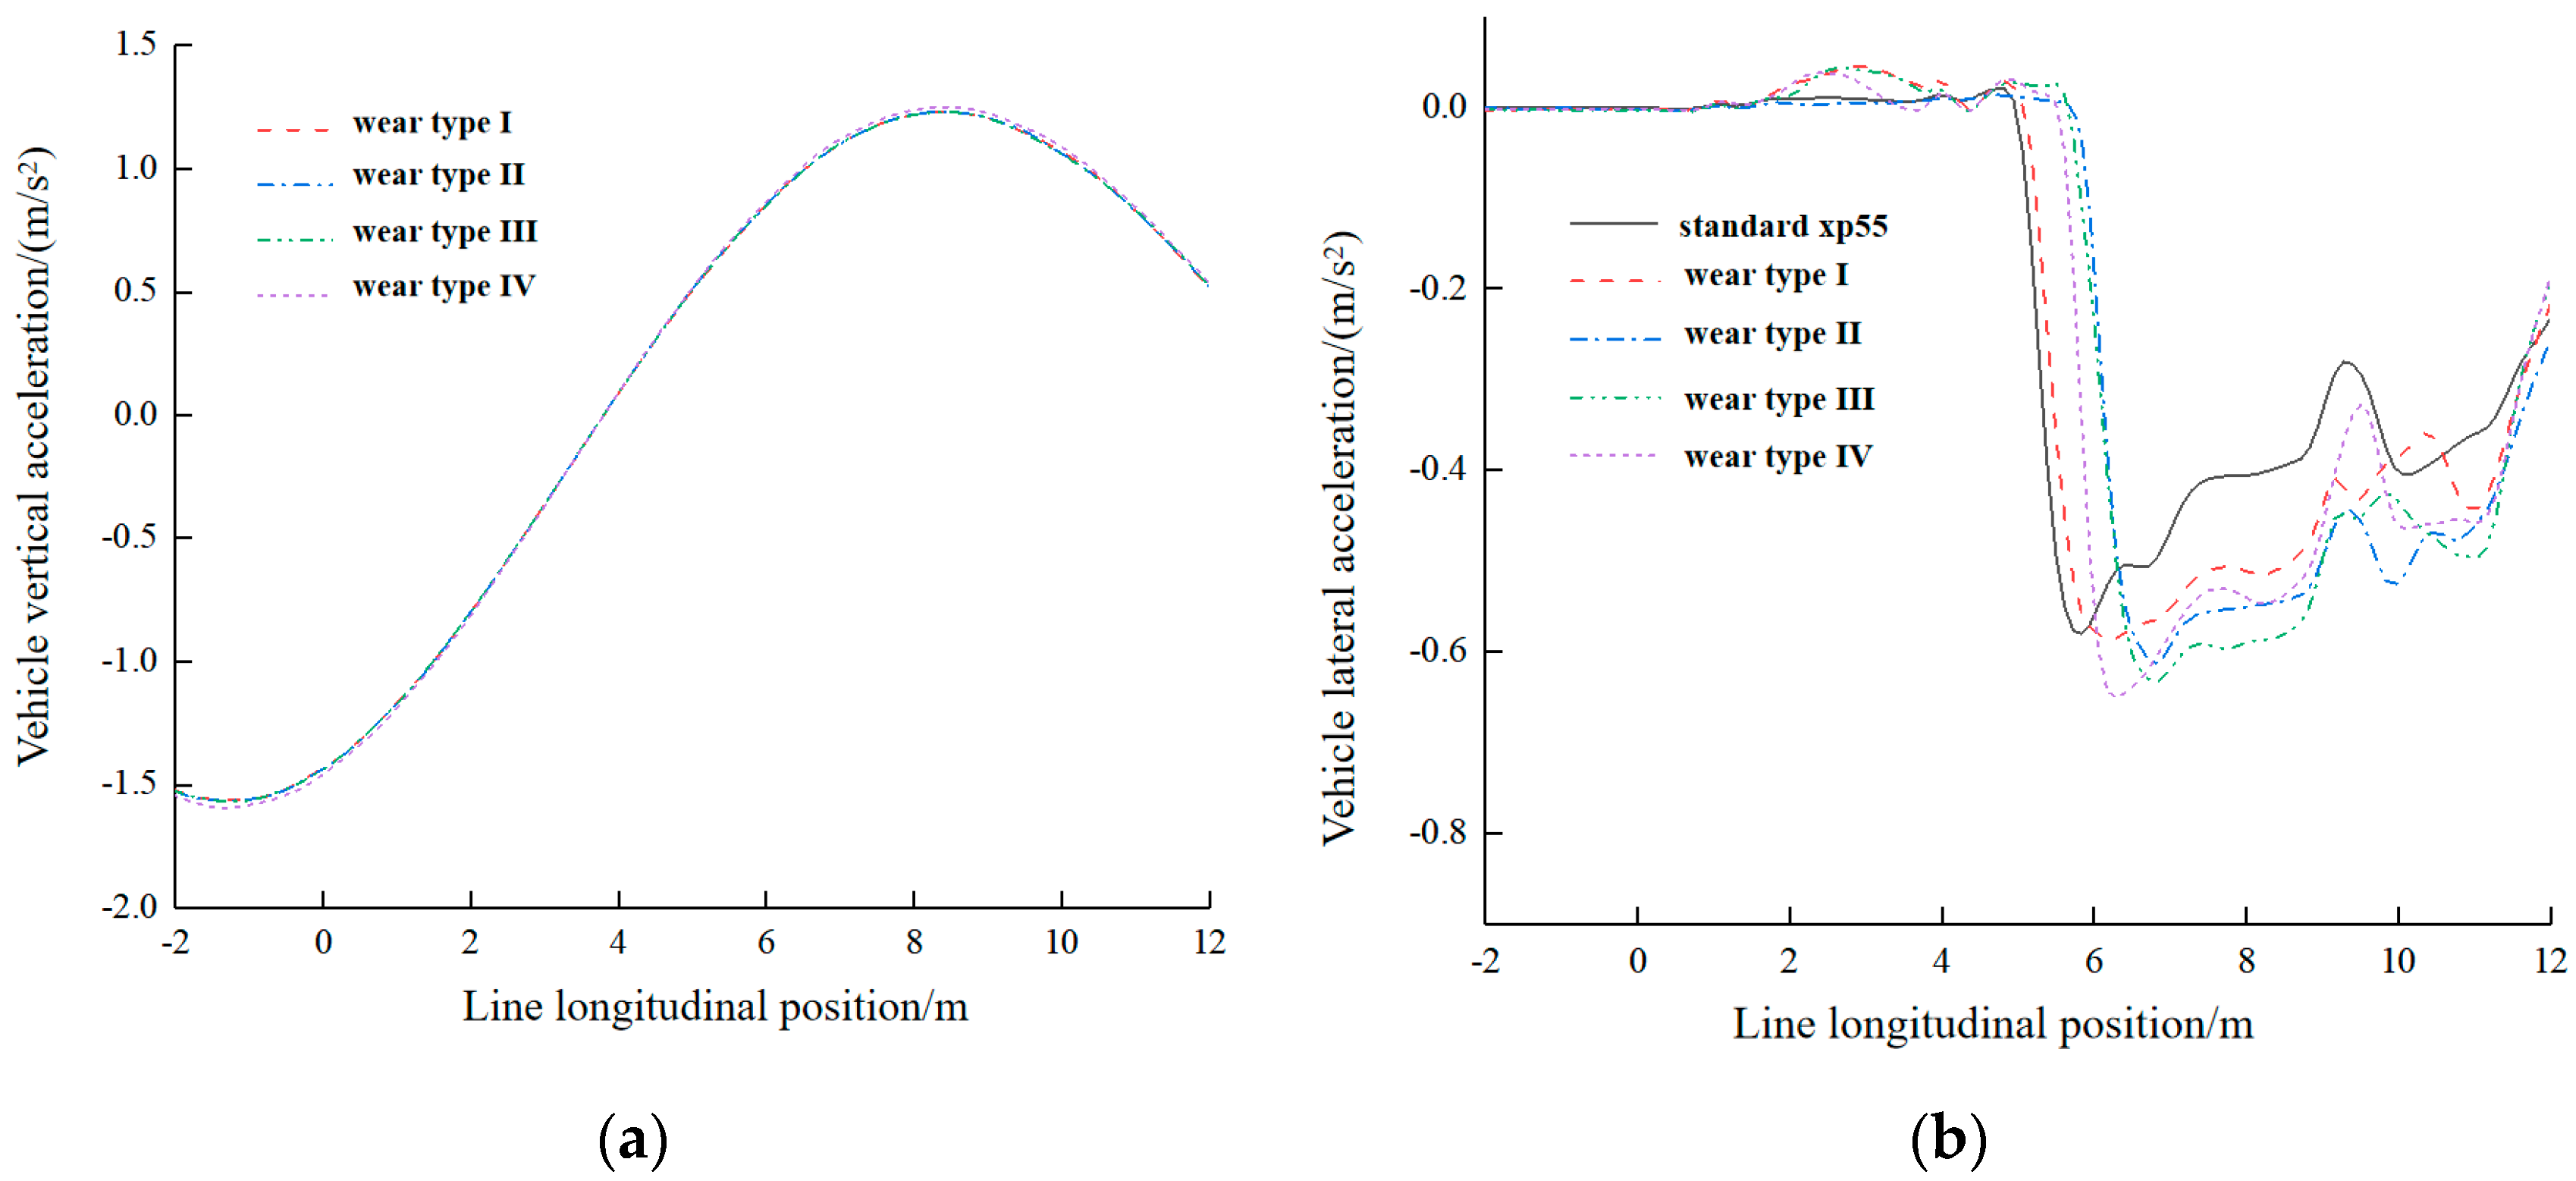
- The wheel–rail vertical force, lateral force, and derailment coefficient all increase significantly when the vehicle wheels transfer from the stock rail to the curved switch rail. The wear of the wheels and rails has a higher impact on vehicle driving safety and a lower impact on vehicle driving stability.
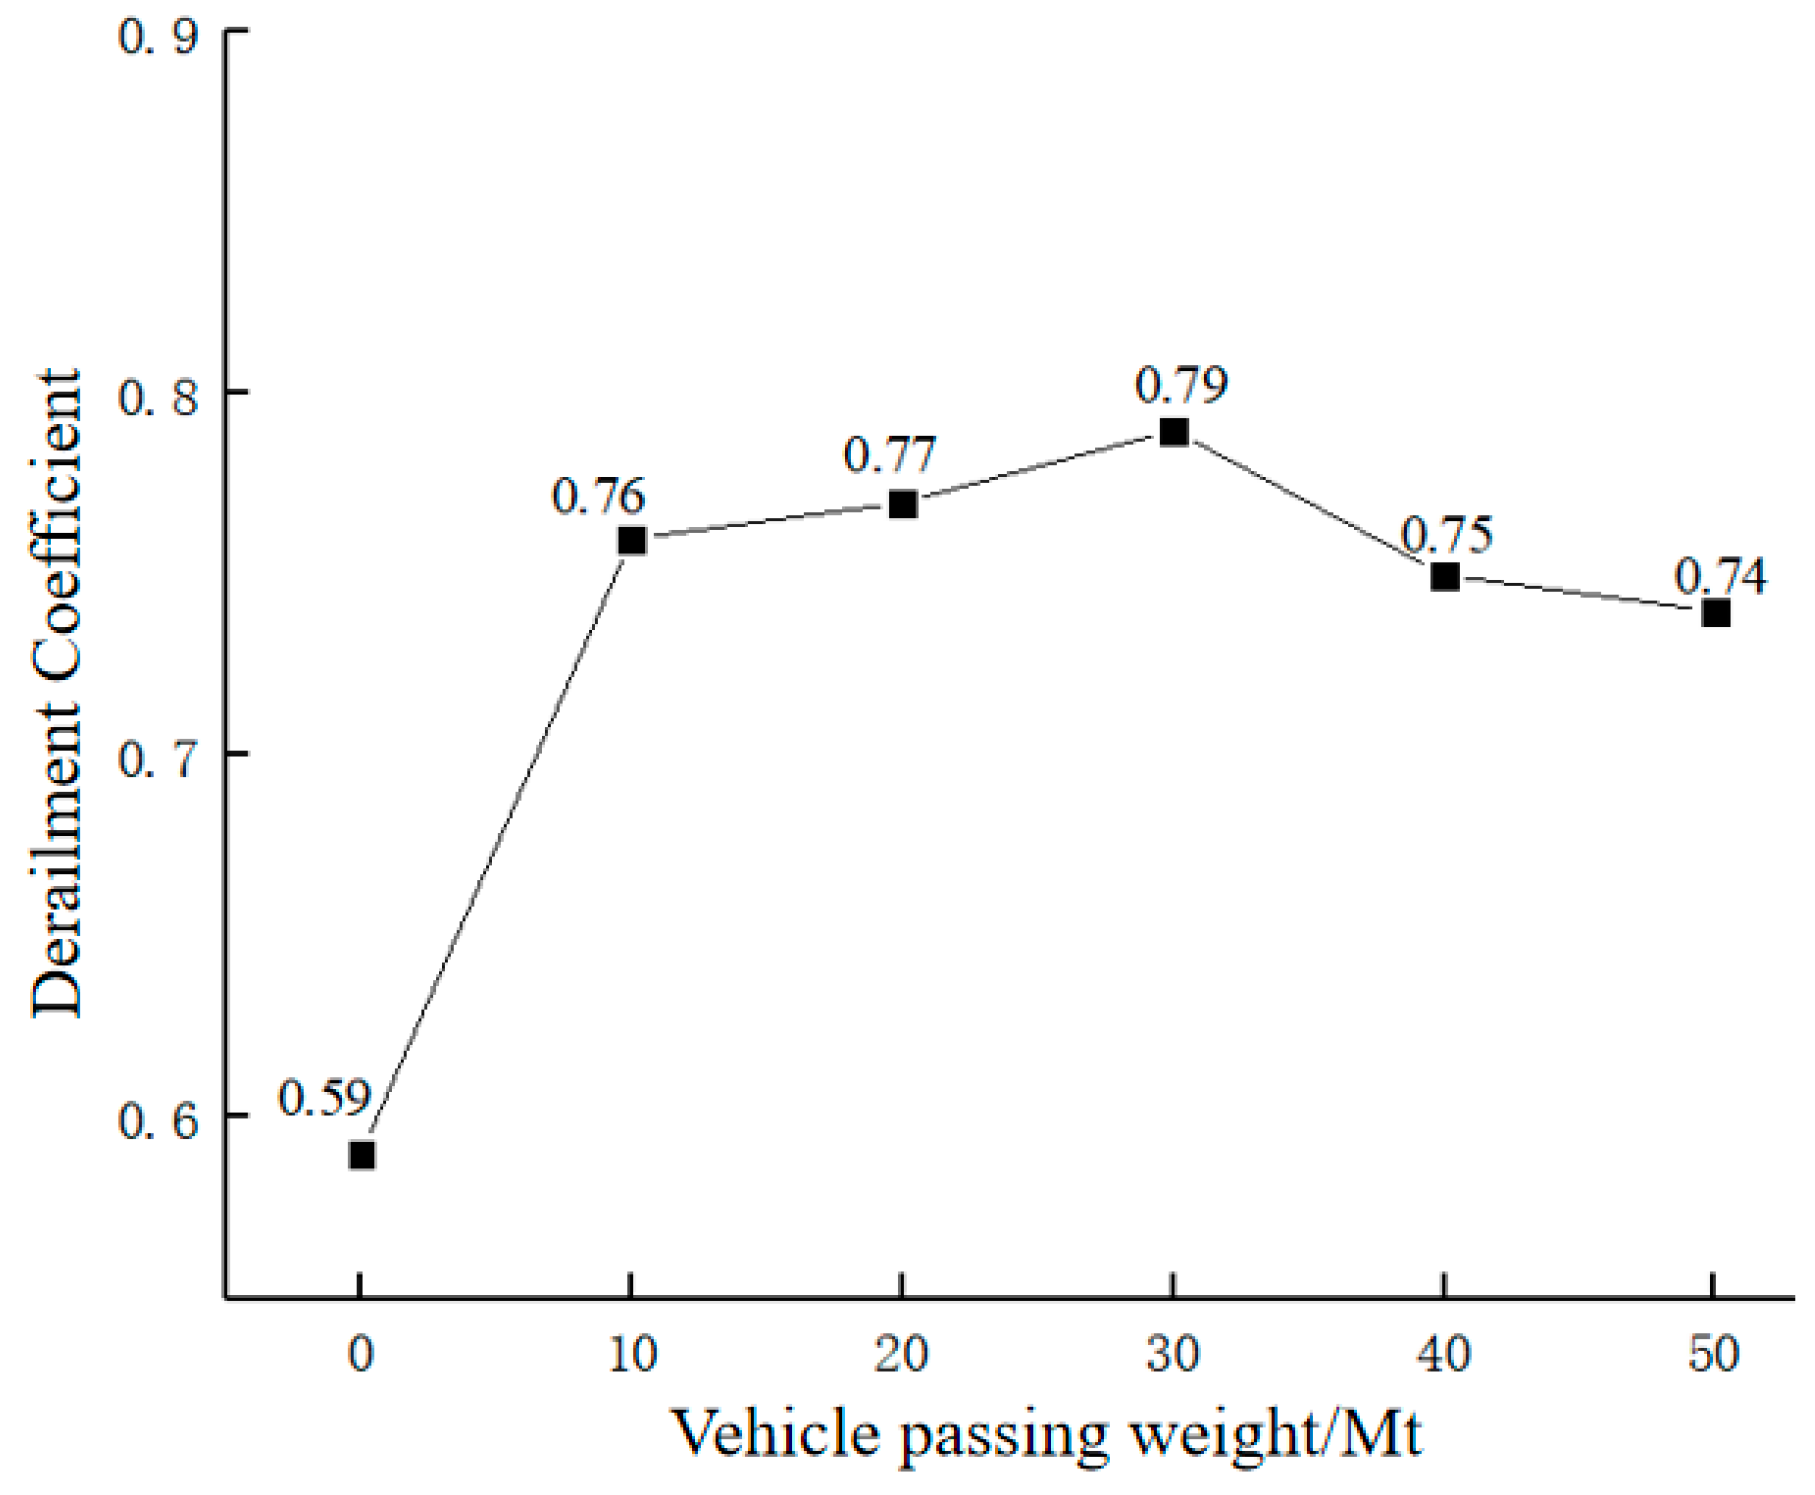
- In all working conditions, when the standard wheel is matched with a curved switch rail with a total passing weight of 30 Mt, the maximum derailment coefficient reaches 0.79, which is close to the safety limit. It is recommended that for a curved switch rail with a total weight of 30 Mt, the frequency of detection and maintenance of the curved switch rail should be increased. The dynamic performance of the vehicle under other working conditions meets the prescribed limits of each dynamic index.
Author Contributions
Funding
Institutional Review Board Statement
Informed Consent Statement
Data Availability Statement
Conflicts of Interest
References
- Kassa, E.; Andersson, C.; Nielsen, O.C.J. Simulation of dynamic interaction between train and railway turnout. Veh. Syst. Dyn. 2006, 44, 247–258. [Google Scholar] [CrossRef]
- Kassa, E.; Nielsen, O.C.J. Stochastic analysis of dynamic interaction between train and railway turnout. Veh. Syst. Dyn. 2008, 46, 429–449. [Google Scholar] [CrossRef]
- Ma, X.C.; Wang, P.; Xu, J.M.; Chen, R. Comparison of non-Hertzian modeling approaches for wheel–rail rolling contact mechanics in the switch panel of a railway turnout. Proc. Inst. Mech. Eng. Part F J. Rail Rapid Transit 2019, 233, 466–476. [Google Scholar] [CrossRef]
- Lu, W.J.; Tao, G.Q.; Wang, P.; Fu, Q.Y.; Guan, Q.H.; Wen, Z.F. Influence of Wheel Wear on Wheel-Rail Contact Behavior and Dynamic Performance of Metro Vehicle. Eng. Mech. 2017, 34, 222–231. [Google Scholar]
- Yi, J.; Lei, P.C.; Cui, H.L.; Zhao, R.; Cui, D.B. Influence of hollow-worn wheels tread on running performance of EMU. J. Railw. Sci. Eng. 2020, 17, 297–305. [Google Scholar]
- Sawley, K.; Urban, C.; Walker, R. The effect of hollow-worn wheels on vehicle stability in straight track. Wear Int. J. Sci. Technol. Frict. Lubr. Wear 2005, 258, 1100–1108. [Google Scholar] [CrossRef]
- Sawley, K.; Wu, H. The formation of hollow-worn wheels and their effect on wheel/rail interaction. Wear 2004, 258, 1179–1186. [Google Scholar] [CrossRef]
- Jin, X.S.; Zhao, G.T.; Liang, S.G.; Tao, G.Q.; Cui, D.B.; Wen, Z.F. Characteristics, Mechanisms, Influences and Counter Measures of High Speed Wheel/Rail Wear: Transverse Wear of Wheel Tread. J. Mech. Eng. 2018, 54, 3–13. [Google Scholar] [CrossRef]
- Song, Y.; Du, Y.L.; Zhang, X.M.; Sun, B.C. Evaluating the Effect of Wheel Polygons on Dynamic Track Performance in High-Speed Railway Systems Using Co-Simulation Analysis. Appl. Sci. 2019, 9, 4165. [Google Scholar] [CrossRef] [Green Version]
- Yang, Y.F.; Xu, M.K.; Ling, L.; Zhai, W.M. Polygonal wear evolution of locomotive wheels subjected to anti-slip control. Wear 2022, 500–501, 204348. [Google Scholar] [CrossRef]
- Iwnicki, S.; Nielsen, J.C.O.; Gong, Q.T. Out-of-round railway wheels and polygonisation. Veh. Syst. Dyn. 2023, 61, 1785–1828. [Google Scholar] [CrossRef]
- Wang, J.X.; Chen, X.; Li, X.G.; Wu, Y.J. Influence of heavy haul railway curve parameters on rail wear. Eng. Fail. Anal. 2015, 57, 511–520. [Google Scholar] [CrossRef]
- Oliveira, L.A.M.D.; Kaewunruen, S.; Papaelias, M.; Li, T. A Novel Hybrid Method for Predicting Vertical Levelling Loss of Railway Track Geometry Under Dynamic Cyclic Loadings. Int. J. Struct. Stab. Dyn. 2022, 22, 2250162. [Google Scholar]
- Li, T.; Su, Q.; Kaewunruen, S. Saturated Ground Vibration Analysis Based on a Three-Dimensional Coupled Train-Track-Soil Interaction Model. Appl. Sci. 2019, 9, 4991. [Google Scholar] [CrossRef] [Green Version]
- Ridho, B.M.A.; Kaewunruen, S. Failure investigations into interspersed railway tracks exposed to flood and washaway conditions under moving train loads. Eng. Fail. Anal. 2021, 129, 105726. [Google Scholar] [CrossRef]
- Hao, F.; Yushi, Y.; Sakdirat, K. Multi-Hazard Effects of Crosswinds on Cascading Failures of Conventional and Interspersed Railway Tracks Exposed to Ballast Washaway and Moving Train Loads. Sensors 2023, 23, 1786. [Google Scholar]
- Kaewunruen, S.; Tang, T. Idealisations of Dynamic Modelling for Railway Ballast in Flood Conditions. Appl. Sci. 2019, 9, 1785. [Google Scholar] [CrossRef] [Green Version]
- Pradhan, S.; Samantaray, A.K.; Bhattacharyya, R. Prediction of railway wheel wear and its influence on the vehicle dynamics in a specific operating sector of Indian railways network. Wear 2018, 406, 92–104. [Google Scholar] [CrossRef]
- Wang, X.P.; Zhang, J.; Ma, H. Prediction Method of Wheel Wear of High Speed Train. Tribology 2018, 38, 462–467. [Google Scholar]
- Wu, X.; Ding, J.J.; Qi, Z.; Wang, J.P.; Liu, L.Y. Study on the prediction of curve rail wear evolution and its influence on vehicle dynamics. J. Railw. Sci. Eng. 2020, 17, 460–468. [Google Scholar]
- Ma, S.; Liu, X.B.; Re, S.B.; Chen, Z.; Liu, Y.T. Research on Side Wear Prediction of Curve Rail in Shuohuang Heavy Haul Railway. J. Mech. Eng. 2021, 57, 118–125. [Google Scholar]
- Sun, Y.; Guo, Y.; Lv, K.K.; Chen, M.; Zhai, W.M. Effect of hollow-worn wheels on the evolution of rail wear. Wear 2019, 436–437, 203032. [Google Scholar] [CrossRef]
- Sun, Y.; Guo, Y.; Zhai, W.M. Prediction of rail non-uniform wear—Influence of track random irregularity. Wear 2018, 420–421, 235–244. [Google Scholar] [CrossRef]
- Li, S.Y.; Li, L.; Qi, Y.Y.; Li, J.; Mao, W.H. Rail Wear Prediction of Urban Rail Transit Line Curve Section. Urban Mass Transit 2023, 26, 57–61. [Google Scholar]
- Gao, L.; Jiang, H.W.; Hou, B.W. Analysis on the Impact of No. 18 Fixed Frog with 60 and 60N Profiles on Turnout Crossing Dynamics and Wear. China Railw. 2021, 60, 15–21. [Google Scholar]
- Wang, P.; Guo, Q. Study on the Effect of Wheel-rail Friction Control on Curved Switch Rail damage in Metro Turnout of China. Transp. Rev. 2020, 42, 72–77+82. [Google Scholar]
- Wang, P.; Guo, Q.; Chen, J.Y. Research on the Effect of Wheel-rail Lubrication on Curved Switch Rail Wear in High-speed Turnout. J. Railw. Eng. Soc. 2019, 36, 17–22. [Google Scholar]
- Zhang, W.R. Influence of Switch Rail Wear in Turnout on Train Running Safety. Railw. Eng. 2016, 513, 117–119+136. [Google Scholar]
- Hamarat, M.; Papaelias, M.; Silvast, M.; Kaewunruen, S. The Effect of Unsupported Sleepers/Bearers on Dynamic Phenomena of a Railway Turnout System under Impact Loads. Appl. Sci. 2020, 10, 2320. [Google Scholar] [CrossRef] [Green Version]
- Hamarat, M.; Kaewunruen, S.; Papaelias, M.; Silvast, M. New Insights from Multibody Dynamic Analyses of a Turnout System under Impact Loads. Appl. Sci. 2019, 9, 4080. [Google Scholar] [CrossRef] [Green Version]
- Michele, M.; Astrid, P.; Nielsen, J.C.O.; Tore, V. Wheel–rail impact loads and axle bending stress simulated for generic distributions and shapes of discrete wheel tread damage. J. Sound Vib. 2021, 502, 116085. [Google Scholar]
- Dindar, S.; Kaewunruen, S.; An, M. Bayesian network-based human error reliability assessment of derailments. Reliab. Eng. Syst. Saf. 2020, 197, 106825. [Google Scholar] [CrossRef]
- Dindar, S.; Kaewunruen, S.; An, M. A hierarchical Bayesian-based model for hazard analysis of climate effect on failures of railway turnout components. Reliab. Eng. Syst. Saf. 2022, 218, 108130. [Google Scholar] [CrossRef]
- Yang, Y.F.; Guo, X.R.; Ling, L.; Wang, K.Y.; Zhai, W.M. Effect of gauge corner lubrication on wheel/rail non-Hertzian contact and rail surface damage on the curves. Acta Mech. Sin. 2022, 38, 521522. [Google Scholar] [CrossRef]
- Yang, Y.F.; Guo, X.R.; Sun, Y.; Ling, L.; Zhang, T.; Wang, K.Y.; Zhai, W.M. Non-Hertzian contact analysis of heavy-haul locomotive wheel/rail dynamic interactions under changeable friction conditions. Veh. Syst. Dyn. 2022, 60, 2167–2189. [Google Scholar] [CrossRef]
- Carlberger, A.; Torstensson, T.P.; Nielsen, C.J.; Anders, F. An iterative methodology for the prediction of dynamic vehicle–track interaction and long-term periodic rail wear. Proc. Inst. Mech. Eng. Part F J. Rail Rapid Transit 2018, 232, 1718–1730. [Google Scholar] [CrossRef]
- Piotrowski, J.; Chollet, H. Wheel–rail contact models for vehicle system dynamics including multi-point contact. Veh. Syst. Dyn. 2005, 43, 455–483. [Google Scholar] [CrossRef]
- Piotrowski, J.; Kik, W. A simplified model of wheel/rail contact mechanics for non-Hertzian problems and its application in rail vehicle dynamic simulations. Veh. Syst. Dyn. 2008, 46, 27–48. [Google Scholar] [CrossRef]
- Sh. Sichani, M.; Enblom, R.; Berg, M. A novel method to model wheel-rail normal contact in vehicle dynamics simulation. Veh. Syst. Dyn 2014, 52, 1752–1764. [Google Scholar] [CrossRef]
- Wang, P.; Zhou, J.Y.; Wang, P.J.; Chen, S.; An, B.Y. Comparative Study of Three Non-hertzian Rolling Contact Models. J. China Railw. Soc. 2022, 44, 39–47. [Google Scholar]
- Ma, X.C.; Wang, P.; Xu, J.M.; Feng, Q.S. Analysis and Comparison of Different Wheel-rail Non-hertzian Rolling Contact Approaches in Railway Turnout. J. Mech. Eng. 2019, 55, 95–103. [Google Scholar]
- Lin, F.T.; Weng, T.T.; Yang, Y.; Zhang, Z.H.; Jia, Z.; Chen, W.; Fang, Q.; Yang, J. Dynamic analysis of wear wheel in turnout frog area and influence of friction coefficient. J. Railw. Sci. Eng. 2023, 20, 1316–1325. [Google Scholar]
- Fan, M.J.; Guan, Q.H.; Li, W.; Ma, W.G.; Wen, Z.F. Dynamic Response Analysis of Linear Motor Train Passing through the Branch Line of The Small Turnout. Railw. Locomot. Car 2021, 41, 70–76. [Google Scholar]
- Wang, P. Experimental Study on Laws of Rail Wear Development of High Speed Turnout. Railw. Eng. 2019, 59, 109–112. [Google Scholar]
- Wang, P. Prediction Analysis of Rail Wear in Switch Panel for No.42 High-Speed Turnout. J. Southwest Jiaotong Univ. 2021, 56, 289–299. [Google Scholar]
- Schmid, R.; Endlicher, K.-O.; Lugner, P. Computer Simulation of the Dynamic Behavior of a Railway-Bogie Passing a Switch. Veh. Syst. Dyn. 1994, 23, 481–499. [Google Scholar] [CrossRef]
- Archard, J.F. Contact and rubbing of flat surfaces. J. Appl. Phys. 1953, 24, 981–988. [Google Scholar] [CrossRef]
- Jendel, T.; Berg, M. Prediction of Wheel Profile Wear. Veh. Syst. Dyn. 2002, 37 (Suppl. S1), 502–513. [Google Scholar] [CrossRef]


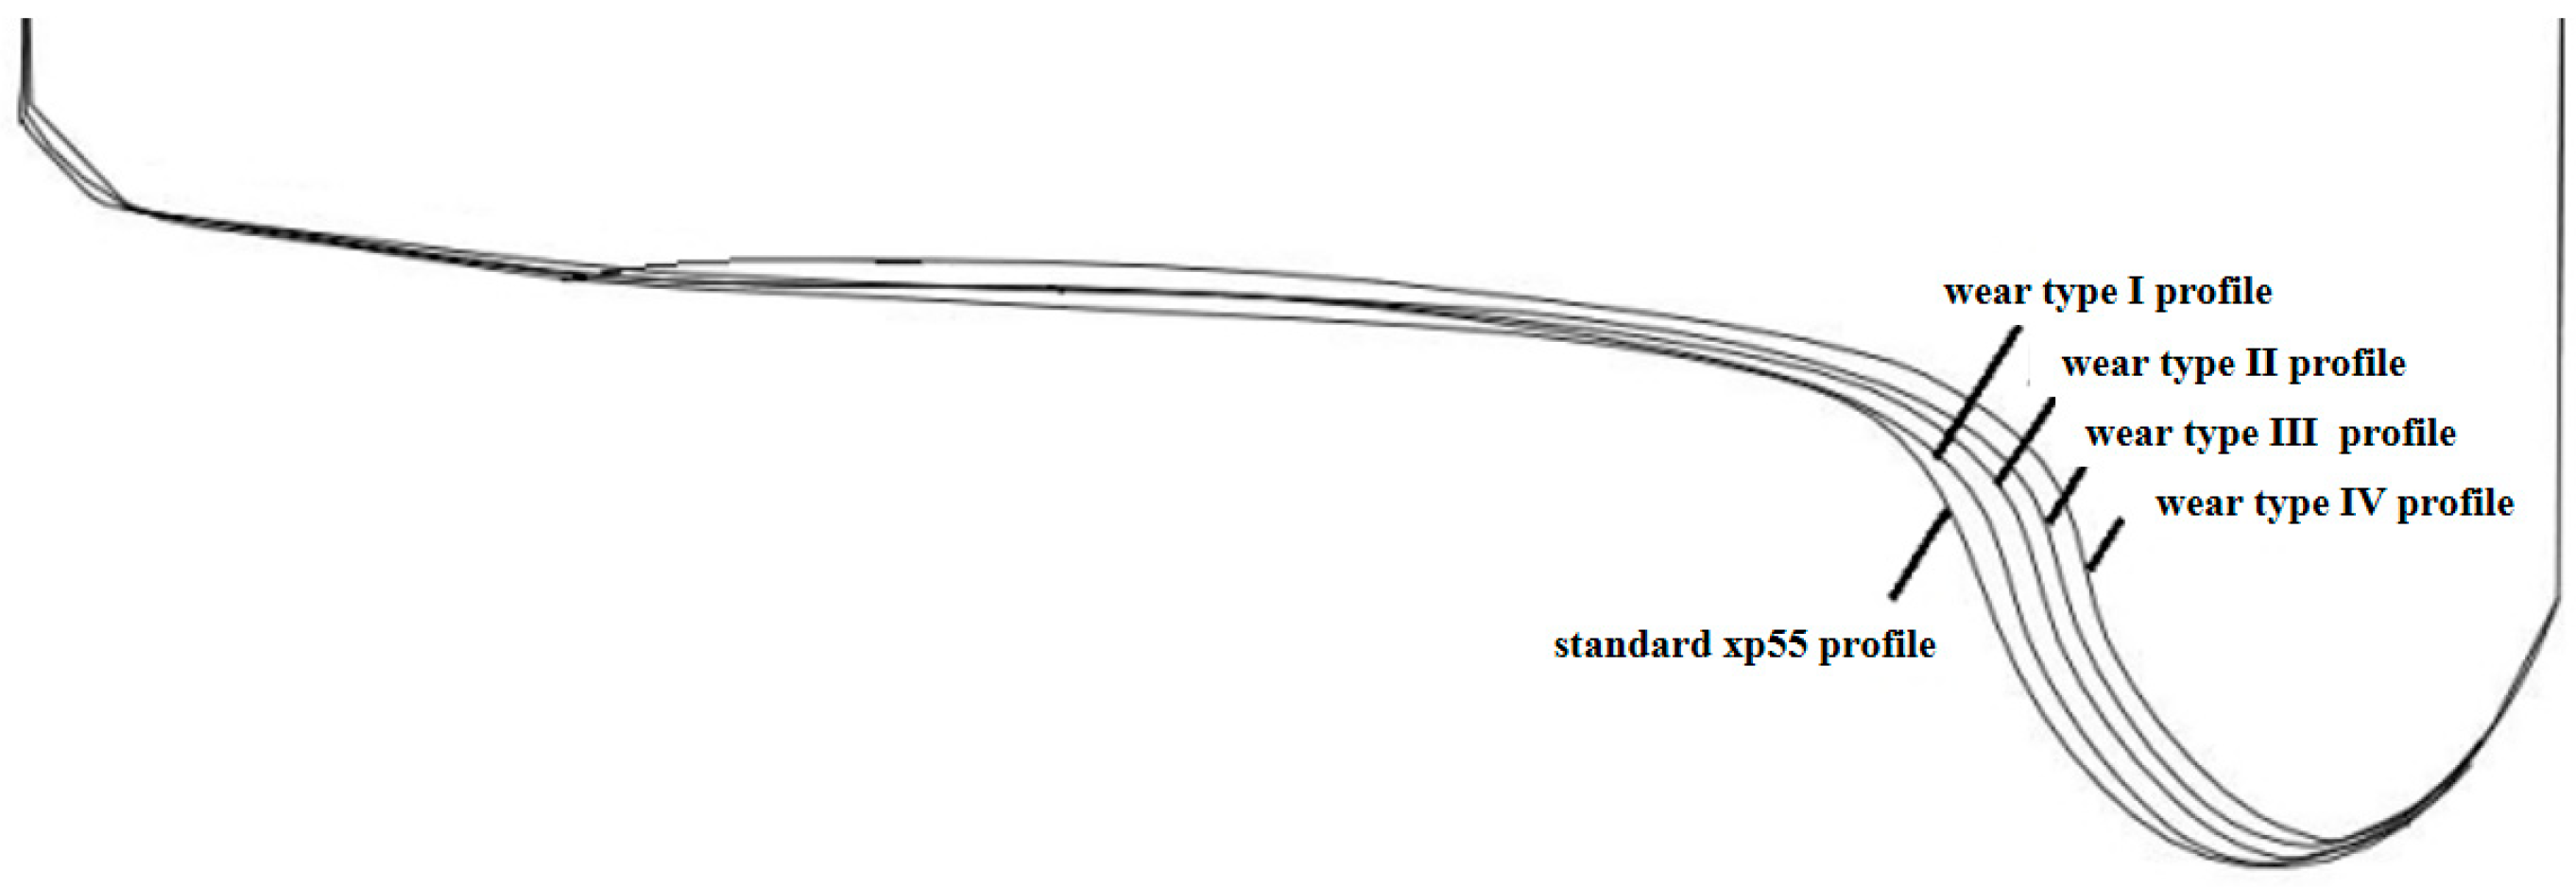
| Wear Stages | Side Wear Values/mm |
|---|---|
| standard xp55 profile | 0 |
| wear type I profile | 1.743 |
| wear type II profile | 3.432 |
| wear type III profile | 4.719 |
| wear type IV profile | 6.208 |
| Parameters | Value |
|---|---|
| Car body mass (kg) | 41,190 |
| Car body rolling moment of inertia (kg·m2) | 79,600 |
| Car body pitching moment of inertia (kg·m2) | 2,105,000 |
| Car body yawing moment of inertia (kg·m2) | 2,093,000 |
| Bogie frame mass (kg) | 2920 |
| Bogie frame rolling moment of inertia (kg·m2) | 2247 |
| Bogie frame pitching moment of inertia (kg·m2) | 2860 |
| Bogie frame yawing moment of inertia (kg·m2) | 5040 |
| Wheelset mass (kg) | 1523 |
| Wheelset rolling moment of inertia (kg·m2) | 708 |
| Wheelset pitching moment of inertia (kg·m2) | 100 |
| Wheelset yawing moment of inertia (kg·m2) | 708 |
| Vertical stiffness of primary spring (N/m) | 1,500,000 |
| Longitudinal stiffness of primary spring (N/m) | 980,000 |
| Lateral stiffness of primary spring (N/m) | 980,000 |
| Vertical damping of primary vertical shock absorber (N·s/m) | 10,000 |
| Vertical stiffness of secondary suspension (N/m) | 450,000 |
| Longitudinal stiffness of secondary spring (N/m) | 20,0000 |
| Lateral stiffness of secondary spring (N/m) | 200,000 |
| Vertical damping of secondary vertical shock absorber (N·s/m) | 20,000 |
| Longitudinal damping of secondary longitudinal shock absorber (N·s/m) | 360,000 |
| Lateral damping of secondary lateral shock absorber (N·s/m) | 22,000 |
| Dynamic Index | Specified Limit Value |
|---|---|
| Wheel–rail vertical force | 170 kN |
| Wheel–rail lateral force | 48.4 kN |
| Derailment coefficient | 0.8 |
| Vertical acceleration | 2.5 m/s2 |
| Lateral acceleration | 2.5 m/s2 |
| Head Width | Passing Weight | ||||
|---|---|---|---|---|---|
| 10 Mt | 20 Mt | 30 Mt | 40 Mt | 50 Mt | |
| 3 mm | 0 | 0 | 0.10 | 0.64 | 1.18 |
| 5 mm | 1.35 | 2.14 | 2.84 | 3.39 | 3.88 |
| 20 mm | 0.99 | 2.23 | 3.30 | 4.28 | 5.30 |
| 35 mm | 0 | 0 | 0.50 | 1.35 | 2.19 |
| 50 mm | 0 | 0 | 0.07 | 0.64 | 1.24 |
| 72.2 mm | 0 | 0 | 0.02 | 0.37 | 0.97 |
Disclaimer/Publisher’s Note: The statements, opinions and data contained in all publications are solely those of the individual author(s) and contributor(s) and not of MDPI and/or the editor(s). MDPI and/or the editor(s) disclaim responsibility for any injury to people or property resulting from any ideas, methods, instructions or products referred to in the content. |
© 2023 by the authors. Licensee MDPI, Basel, Switzerland. This article is an open access article distributed under the terms and conditions of the Creative Commons Attribution (CC BY) license (https://creativecommons.org/licenses/by/4.0/).
Share and Cite
Yan, S.; Jin, T.; Ma, H.; Zhang, J.; Zhou, Y. Wear Prediction of Curved Switch Rail in High-Speed Turnout and Influence of Wheel and Rail Wear on Vehicle Dynamic Performance. Appl. Sci. 2023, 13, 8398. https://doi.org/10.3390/app13148398
Yan S, Jin T, Ma H, Zhang J, Zhou Y. Wear Prediction of Curved Switch Rail in High-Speed Turnout and Influence of Wheel and Rail Wear on Vehicle Dynamic Performance. Applied Sciences. 2023; 13(14):8398. https://doi.org/10.3390/app13148398
Chicago/Turabian StyleYan, Shuo, Taotao Jin, He Ma, Jun Zhang, and Yi Zhou. 2023. "Wear Prediction of Curved Switch Rail in High-Speed Turnout and Influence of Wheel and Rail Wear on Vehicle Dynamic Performance" Applied Sciences 13, no. 14: 8398. https://doi.org/10.3390/app13148398