Article

Changes in the Power and Coupling of Infra-Slow Oscillations in the Signals of EEG Leads during Stress-Inducing Cognitive Tasks

by
Mikhail D. Prokhorov
1,2,*,
Ekaterina I. Borovkova
1,3,4,
Aleksey N. Hramkov
1,5,
Elizaveta S. Dubinkina
1,5,
Vladimir I. Ponomarenko
1,2,5,
Yurii M. Ishbulatov
1,4,5,
Alexander V. Kurbako
1,2,5 and
Anatoly S. Karavaev
1,4,5
1
Center for Neurotechnology and Artificial Intelligence, Immanuel Kant Baltic Federal University, 236041 Kaliningrad, Russia
2
Saratov Branch of Kotelnikov Institute of Radio Engineering and Electronics of Russian Academy of Sciences, 410019 Saratov, Russia
3
National Medical Research Center for Therapy and Preventive Medicine, 101990 Moscow, Russia
4
Institute of Cardiology, Saratov State Medical University, 410012 Saratov, Russia
5
Institute of Physics, Saratov State University, 410028 Saratov, Russia
*
Author to whom correspondence should be addressed.
Appl. Sci. 2023, 13(14), 8390; https://doi.org/10.3390/app13148390
Submission received: 30 June 2023 / Revised: 16 July 2023 / Accepted: 18 July 2023 / Published: 20 July 2023
(This article belongs to the Special Issue Artificial Intelligence (AI) in Neuroscience)

Abstract

:
A change in the human psychophysiological state, caused by stress in particular, affects the processes of autonomic control, the activity of which is reflected in infra-slow oscillations of brain potentials with a frequency of less than 0.5 Hz. We studied the infra-slow oscillations in scalp electroencephalogram (EEG) signals in the frequency ranges of 0.05–0.15 Hz and 0.15–0.50 Hz that are associated with the processes of sympathetic and parasympathetic control, respectively, in healthy subjects at rest and during stress-inducing cognitive tasks. The power spectra of EEG signals, the phase coherence coefficients, and indices of directional coupling between the infra-slow oscillations in the signals of different EEG leads were analyzed. We revealed that, compared with the state of rest, the stress state is characterized by a significant decrease in the power of infra-slow oscillations and changes in the structure of couplings between infra-slow oscillations in EEG leads. In particular, under stressful conditions, a decrease in both intrahemispheric and interhemispheric coupling between EEG leads occurred in the range of 0.05–0.15 Hz, while a decrease in intrahemispheric and an increase in interhemispheric couplings was observed in the range of 0.15–0.50 Hz.

1. Introduction

The functioning of the body involves various complex interacting oscillatory processes that ensure the adjustment of the body’s systems to changing external conditions. These interacting processes can be observed when analyzing the physiological signals of the cardiovascular system [1], respiration [2], and electrical activity of the brain [3].
Analysis of the strength and structure of couplings between such processes is a useful tool for constructing quantitative indices that characterize changing physical and psychophysiological states [4,5,6,7]. Methods for detecting the interaction of various body systems have been successfully applied to the estimation of the biological age [8,9], classification of sleep stages [10,11,12], diagnosis of the severity of diseases of the cardiovascular system [13,14,15], and stress diagnosis [5,7,16]. The latter is important for the implementation of continuous monitoring of the stress level in everyday life and the identification of people at risk of developing stress-related disorders. It is known that physiological responses to stress in humans vary considerably [5,7]. The task of stress diagnosis is complicated by the complexity and nonstationarity of the electroencephalogram (EEG) signals usually used to detect a stress state. Therefore, the quantitative assessment of human stress using biosignals remains a difficult task that requires more detailed study [5,7].
Couplings between different parts of the cerebral cortex and the other parts of the brain, such as pons, are important for understanding the functioning of the brain under various conditions, including stress [5,17,18]. For instance, in [17], the authors showed that the permanently established chemical axotomy of the locus coeruleus (LC) and dorsal raphe (DR) axon terminals in freely moving rats changed naturally occurring cortico-pontine theta (4–8 Hz) synchronization phase shift. Similarly, DR or LC chemical axotomy induces a new mode of coupling between sigma (10–15 Hz in rats) and theta EEG oscillations tight to non-rapid-eye-movement (NREM) sleep, suggesting that loss of monoaminergic signaling interferes with NREM sleep consolidation [18].
Methods have been proposed for detecting a stress state based on coherence analysis [19,20,21,22,23], Pearson’s correlation coefficient [24], cross-covariance [25], auto-covariance [24], mutual information [26,27,28], partial directed coherence [29,30], generalized partial directed coherence [31], and directed transfer function [32]. However, among a great number of known results are mutually contradictory conclusions, depending on the method of analysis, the type of stress, and the analyzed frequency range [5].
Generally, the study of brain activity during changes in the psycho-emotional state is carried out in the following frequency ranges: delta (0.5–4 Hz), theta (4–8 Hz), alpha (8–13 Hz), beta (14–30 Hz), and gamma (30–50 Hz). At the same time, the analysis of infra-slow oscillations of brain potentials with a frequency of less than 0.5 Hz can provide important additional information for diagnosing the development of stress. It has been shown that the infra-slow oscillations of brain potentials are associated with the activity of autonomic control centers [3,33,34,35]. Moreover, it is known that the autonomic nervous system plays an important role in the body’s response to stress, changing the activity of its elements under stressful conditions [7,16,36]. The infra-slow oscillations in EEG signals were analyzed in the studies [16,37,38,39], which dealt with cognitive task-solving. The infra-slow oscillations of brain potentials correlate with human behavior [40] and change during sleep [10,11,12,41,42,43].
Thus, the infra-slow oscillations of brain potentials may reflect a change in the psychophysiological state of a subject and the development of stress. The aim of this study was to identify biomarkers of the psychophysiological state during stress-inducing cognitive tasks. We analyzed the power spectra of infra-slow oscillations in EEG signals. Additionally, we studied the phase coherence coefficients and indices of directional coupling between infra-slow oscillations in the signals of different EEG leads. We revealed that the analysis of individual and collective dynamics of infra-slow oscillations of brain potentials is promising for the detection of stress.

2. Materials and Methods

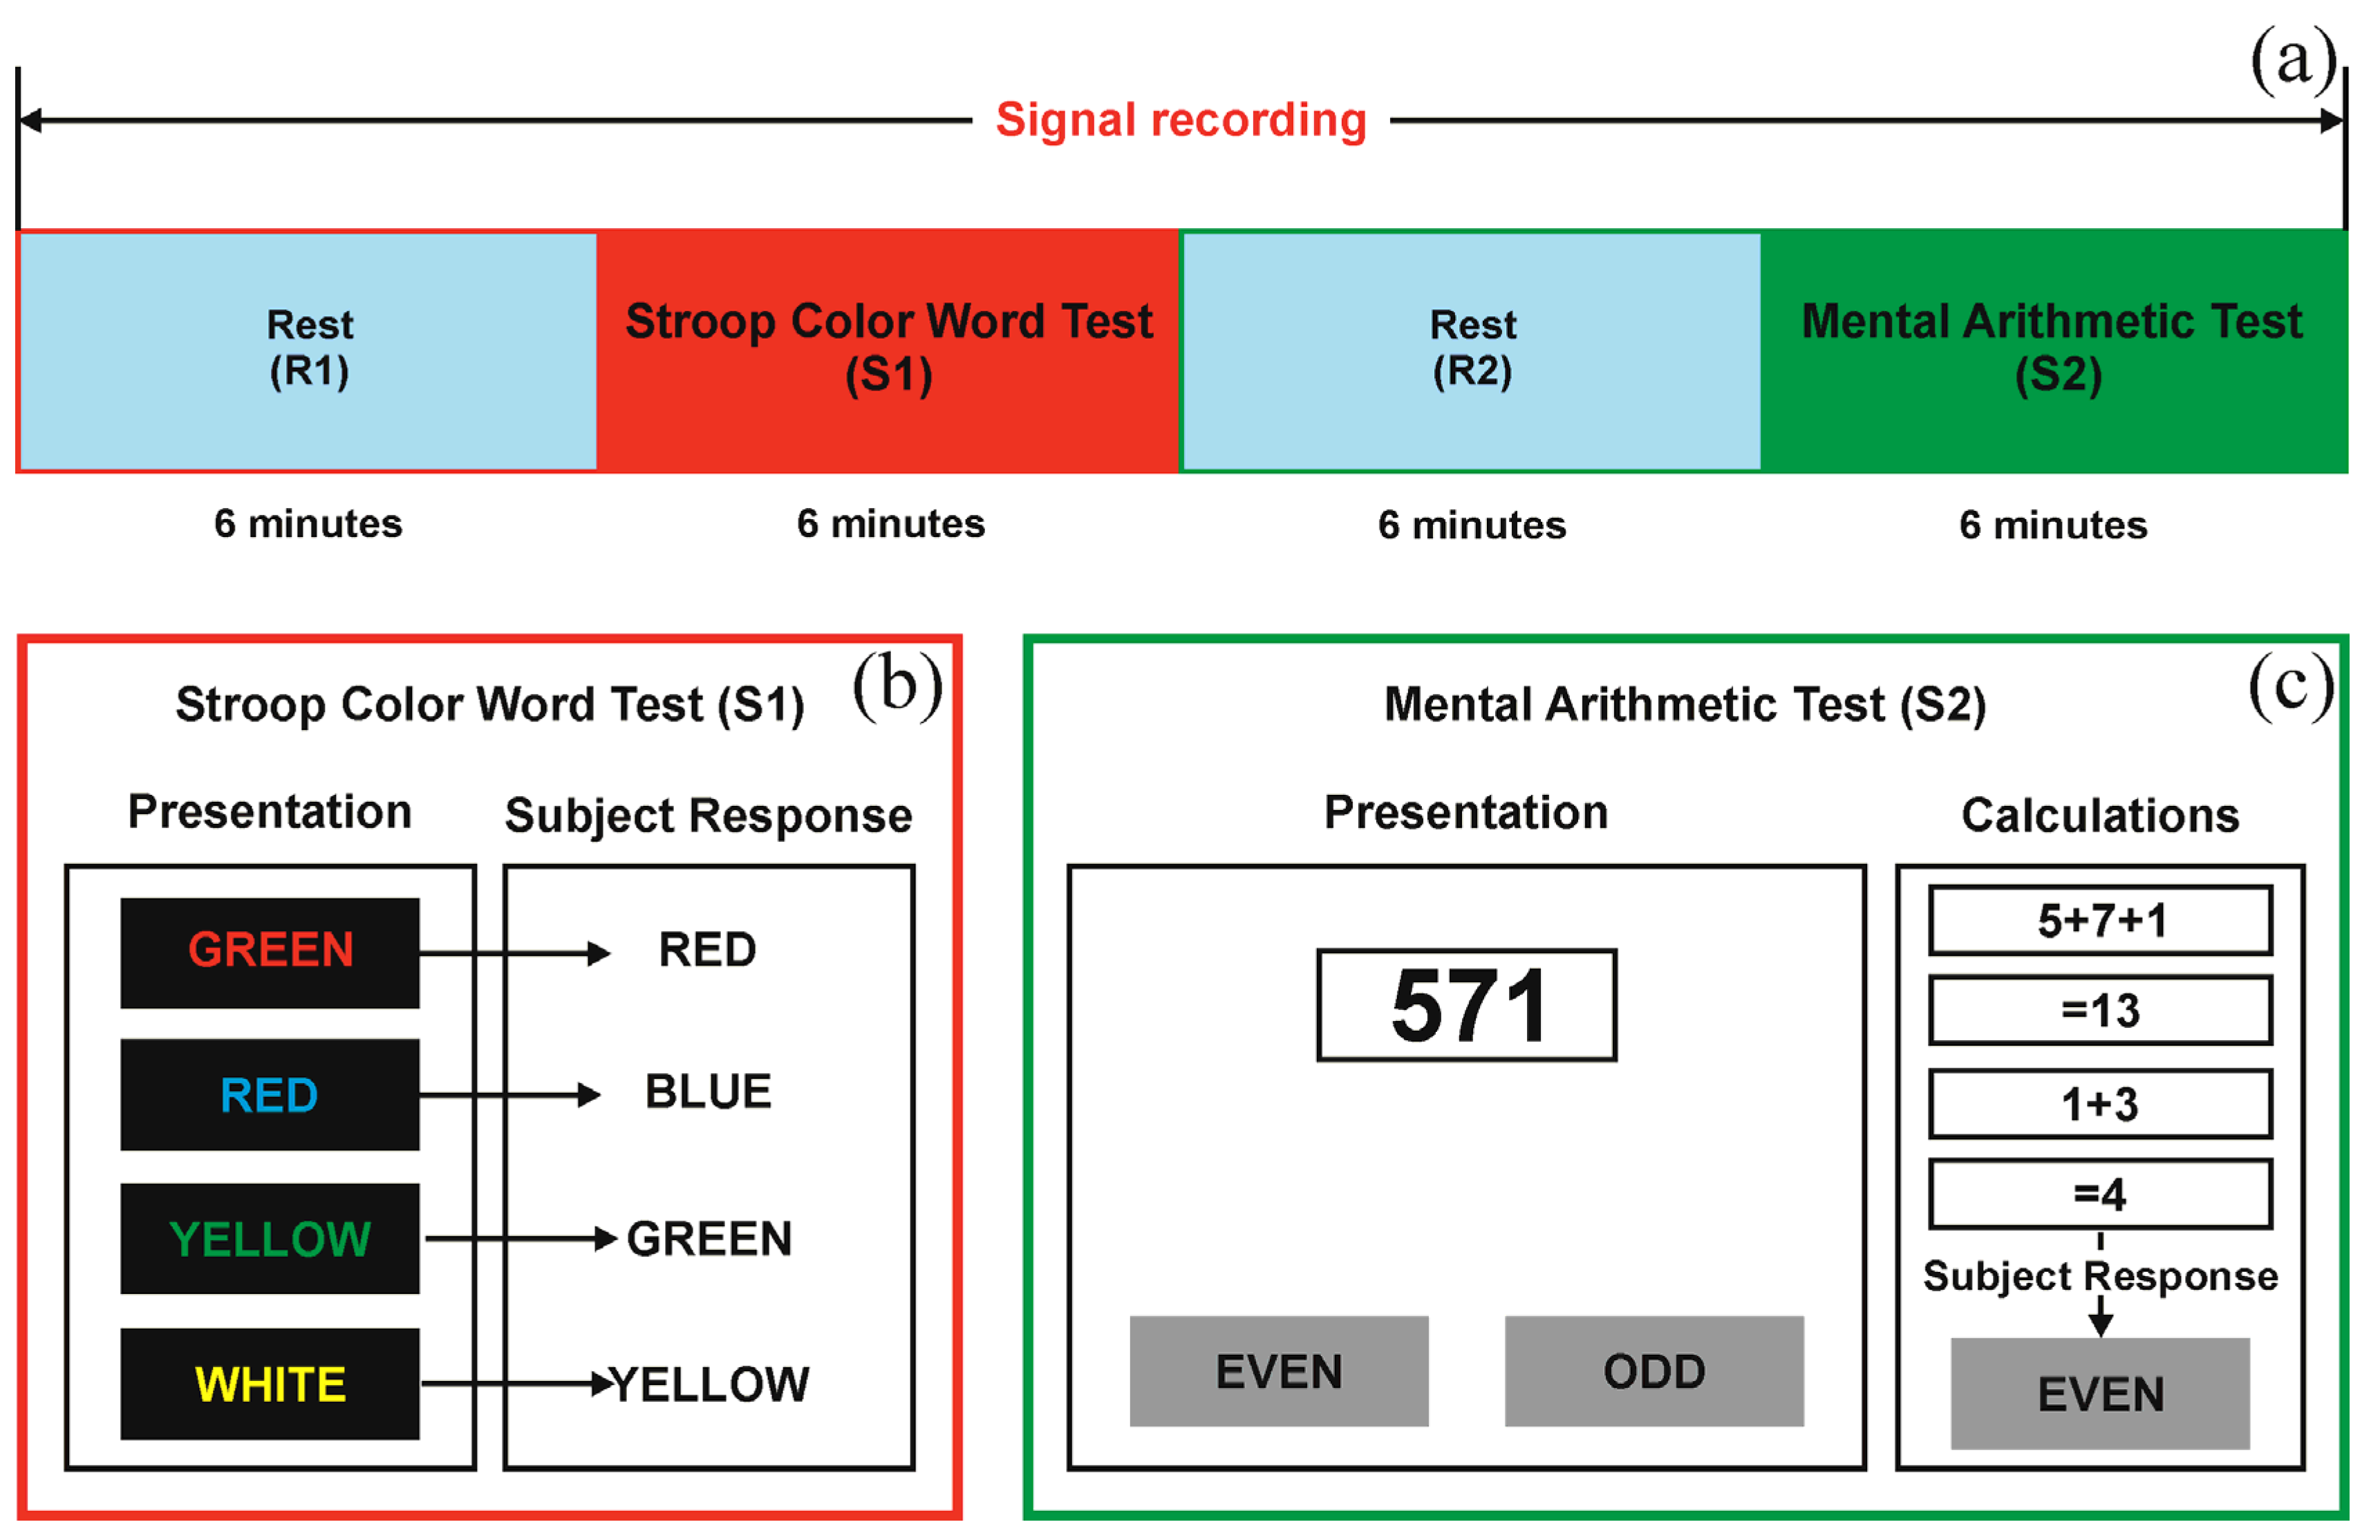
2.1. Design of the Study and the Experimental Data

We analyzed the records of 63 healthy men aged 21 ± 3 years (mean ± standard deviation) with an average level of physical activity. The exclusion criteria from the experimental group were the presence of neurological and mental disorders in volunteers and diseases of the cardiorespiratory system. As a cognitive task, we used the Stroop Color Word Test (SCWT) [44] and the mental arithmetic test (MAT) [45], which are standard tests for inducing moderate levels of stress. The subjects performed the stress-inducing cognitive tasks for the first time and had no experience in participating in such experiments.
The study protocol included four successive stages: 6-min rest (R1), 6-min SCWT (S1), 6-min rest (R2), and 6-min MAT (S2) (Figure 1a). At the R1 and R2 stages, volunteers were asked to relax. During the SCWT, the subject was presented with a sequence of colored words—names of colors for which the color of the letters did not match the color denoted by the word. There were 360 combinations in total, presented in random order at an interval of 1 s. The volunteer had to mentally pronounce the color of the letters (Figure 1b). During the MAT, the volunteer was presented with three-digit numbers and had to sum the digits. If the number obtained as a result of summation contained two digits, they had to sum these up again, continuing this cycle until the final resulting number was a single digit. After obtaining a single-digit number, the subject was asked to decide whether this number was even or odd and press the corresponding button (Figure 1c). In total, each volunteer was presented with a set of 72 numbers. The numbers changed every 5 s.
During the testing, EEG signals were recorded using the 8–3 system for electrode placement. The signals were recorded using a standard certified digital electrocardiograph Encefalan_EEGP-19/26 [46] with a sampling frequency of 250 Hz and a bandpass filter of 0.016–70 Hz.

2.2. Data Analysis

EEG analysis was carried out separately for each stage of the experiment, namely R1, S1, R2, and S2. The successive stages of rest and stress test were compared: R1 and S1, and R2 and S2. EEG signals were analyzed in the frequency range from 0.05 to 18 Hz. Particular attention was paid to the δ1-range (0.05–0.15 Hz), which is associated mainly with the processes of sympathetic control, and the δ2-range (0.15–0.50 Hz), which is associated mainly with the processes of parasympathetic control and respiratory influences [1]. We also analyzed δ (0.5–3.0 Hz), θ (4.0–7.0 Hz), α (11.0–12.0 Hz), and β (15.0–18.0 Hz) rhythms. The frequency components in the corresponding ranges were extracted using a bandpass filter.
For each EEG signal, the periodogram was evaluated in 6-min windows using the fast Fourier transform [47]. Then, the average powers of EEG oscillations were calculated in the corresponding frequency ranges. The obtained indices are denoted in the paper by the word “activity”: δ1-activity, δ2-activity, and α-activity. The ratio of average powers in β- and α-ranges was also calculated and denoted as β/α-activity. For each EEG lead, the individual values of the spectral indices were averaged over the ensemble of all subjects and presented as topographic maps of values linearly interpolated around the EEG leads. The median values of the spectral indices for each EEG lead were marked in color on the maps.
To compare the stages of the experiment, the difference between the spectral indices at stages S1 and R1, and stages S2 and R2 was calculated for each subject and normalized to the value of the spectral index at R1 or R2, respectively. The obtained relative values of index differences were denoted by the symbol Δ: Δδ1-activity, Δδ2-activity, Δα-activity, and Δβ/α-activity.
For each pair of EEG leads, the phase coherence coefficient γ [48] was calculated:
γ = cos Δ φ ( t ) 2 + sin Δ φ ( t ) 2 ,
where Δϕ(t) is the difference in instantaneous phases of oscillations in the signals of analyzed EEG leads and angular brackets denote averaging over time. The instantaneous phases of oscillations in the analyzed frequency ranges were calculated using the Hilbert transform [49]. The obtained indices are denoted in the paper by the word “coherence”: δ1-coherence, δ2-coherence, δ-coherence, and θ-coherence. If the phases of the analyzed signals are coherent, the phase difference Δϕ(t) will remain constant and its distribution density will be delta peak, resulting in γ = 1 . Otherwise, γ is close to 0. When analyzing experimental signals, noise, non-stationarity, and the finite length of realizations affect the value of γ, thus it takes intermediate values between 0 and 1.
For each EEG lead, the values of its coherence coefficients with the other leads were averaged over the leads and presented as topographic maps of values interpolated around the EEG leads. For each lead, the median values of the coherence coefficients calculated over the ensemble of all subjects were shown on the maps in color.
To compare the stages of the experiment, the difference between the coherence coefficients at stages S1 and R1, and stages S2 and R2 was calculated for each subject and normalized to the value of the coherence coefficient at R1 or R2, respectively. The obtained relative values of coefficient differences were denoted by the symbol Δ: Δδ1-coherence, Δδ2-coherence, Δδ-coherence, and Δθ-coherence. These differences in coherence coefficients were averaged over the ensemble of all subjects and presented as topographic maps. On these maps, the median values of the obtained differences were marked in color.
The value of the phase coherence coefficient can quantitatively characterize the non-directional interaction of the systems that generated the analyzed signals. To analyze the structure of directional couplings, we used the phase dynamics modeling method [50]. This approach involves approximation of the increments in the instantaneous phases ϕ1(t) and ϕ2(t) of two analyzed processes:
φ 1 , 2 ( t + τ ) φ 1 , 2 ( t ) = F 1 , 2 ( φ 1 , 2 ( t ) , φ 2 , 1 ( t d ) , a 1 , 2 ) + ε 1 , 2 ( t ) ,
where τ is the phase increment interval, F1,2(t) are trigonometric polynomials of the third order, a1,2 are vectors of their coefficients, d is a trial delay taking into account the time delay in couplings, and ε1,2(t) are model residuals.
The parameter τ in (2) was equated to one characteristic period of oscillations in the corresponding frequency range, which was calculated as the reciprocal of the frequency corresponding to the center of the analyzed frequency range: 10.0, 4.0, 0.6, and 0.2 s for δ1-, δ2-, δ-, and θ-ranges, respectively. The coefficients a1,2 were estimated from time series ϕ1(t) and ϕ2(t) using the least squares method. The trial delay d was varied within one characteristic oscillation period.
Based on [50], the indices of directional coupling were calculated as follows:
c 1 , 2 2 ( d ) = 1 2 π 2 0 2 π 0 2 π F 1 , 2 ( φ 1 , 2 ( t ) , φ 2 , 1 ( t d ) , a 1 , 2 ) / φ 2 , 1 2 d φ 1 d φ 2 .
These indices characterize the influence of the phase of the first signal on the phase of the second signal. For each pair of EEG lead signals, the indices (3) were calculated in δ1-, δ2-, δ-, and θ-ranges. For further analysis, we used the maximum values of these indices under variation of d.
The absolute values of the directional coupling indices depend on the individual characteristics of the signals, and their quantitative interpretation is not trivial [50]. Therefore, we used the indices (3) to analyze the qualitative changes in couplings between EEG leads at different stages of the experiment.
For each pair of EEG leads, we compared the distributions of directional coupling indices at stages S1 and R1, and stages S2 and R2 using the records of all subjects. If these distributions were significantly different at the stages of stress and rest based on the Mann–Whitney U-test (p < 0.05) [51], then the distribution of individual differences between the directional coupling indices was calculated. Further, a conclusion was made about the sign of the median of this distribution, indicating an increase or decrease in the coupling during stress-inducing cognitive tasks. The results of this analysis were presented in the form of an EEG lead map.

3. Results

At first, we analyzed the EEG power spectra at all four stages of the experiment. For stages R1, S1, R2, and S2, Figure 2a–d show the median values of the EEG δ1-activity, δ2-activity, α-activity [7,52,53,54,55,56,57,58], and β/α-activity [59], respectively, averaged over the entire ensemble of subjects. To compare stages S1 and R1, and stages S2 and R2, we plot Figure 2e–h, which shows the normalized differences in spectral indices presented in Figure 2a–d.
As can be seen in Figure 2a–c, δ1-activity and δ2-activity have higher values than α-activity at all stages of the experiment. The spectral indices of δ1- activity and δ2-activity show qualitatively similar maps (Figure 2a,b). In particular, at the stages of rest, δ1-activity and δ2-activity are maximal in the frontal EEG leads. In all leads, δ1-activity is statistically significantly less by 55 (34; 71)% (median value with the first and third quartiles) at stress stage S1 than at rest stage R1, and by 54 (42; 71)% at stress stage S2 than at rest stage R2 (Figure 2e). δ2-activity is statistically significantly less by 73 (51; 80)% at stress stage S1 than at rest stage R1, and by 58 (43; 76)% at stress stage S2 than at rest stage R2 (Figure 2f).
Figure 2d demonstrates the predominance of α-activity compared to β-activity at all stages of the experiment. At stress stages S1 and S2, a decrease in α-activity (Figure 2c) and an increase in β/α-activity (Figure 2d) is observed. At the stages of rest, α-activity is maximal in parietal EEG leads (Figure 2c). α-activity statistically significantly decreased in all leads by 22 (10; 39)% at stage S1 and by 28 (12; 45)% at stage S2 compared with stages R1 and R2, respectively (Figure 2g). β/α-activity statistically significantly increased by 26 (−6; 83)% in occipital leads at stage S1 and by 32 (6; 73)% in occipital and parietal leads at stage S2 compared with stages R1 and R2, respectively (Figure 2h).
It should be noted that in the δ1- and δ2-ranges, the differences in spectral indices between the stages of stress and rest are significant and more pronounced in all EEG leads, while in the α- and β-ranges, these differences are less pronounced and statistically significant only in several leads. Thus, the spectral analysis of infra-slow oscillations of brain potentials demonstrates the sensitivity of their dynamics to changes in the psychophysiological state caused by stress-inducing cognitive tasks.
Second, we analyzed the couplings between the signals of EEG leads in low-frequency ranges. Figure 3 presents the results of calculating the phase coherence coefficient (1) between EEG oscillations in the δ1-, δ2-, δ-, and θ-ranges.
Figure 3a–d shows the medians of distributions in the ensemble of mean values of the coherence (1) of a given EEG lead and other leads. At all stages of the experiment, in all frequency ranges in Figure 3, higher coherence values were found in the frontal, central, and parietal EEG leads compared with the occipital leads.
Figure 3e–h shows the differences between the coherence coefficients at stages S1 and R1, and stages S2 and R2. In all leads, the coherence between δ1-oscillations in EEG is statistically significantly less by 14 (−1; 29)% at the stress stage S1 than at the rest stage R1 and is significantly less by 17 (0; 27)% at the stress stage S2 than at the rest stage R2 in all leads except O1 (Figure 3e). The coherence between δ2-oscillations in EEG is statistically significantly less by 10 (−2; 24)% at the stress stage S1 than at the rest stage R1 in frontal, central, and occipital EEG leads (Figure 2f). At the same time, there was no significant change in coherence between δ2-oscillations in EEG at stage S2 in comparison with stage R2 (Figure 2f). The coherence coefficients of δ-oscillations in EEG showed a significant increase of 7 (−2; 17)% at stage S1 and of 10 (2; 19)% at stage S2 only for central and parietal leads (Figure 2g). The coefficients of coherence between θ-oscillations in EEG were not so sensitive to stress. Significant changes in these coefficients were found only for a few leads during stage S2 (Figure 3h).
Figure 4a–d shows statistically significant changes in coherence between pairs of EEG leads. In δ1-range, the stress stages S1 and S2 are characterized by a decrease in intrahemispheric coherence compared with the R1 and R2 stages of rest, respectively (Figure 4a). At stage S2, a decrease in interhemispheric coherence between the frontal, central, and parietal leads is observed in the δ1-range. Additionally, an increase in coherence between the occipital leads takes place (Figure 4a). In the δ2-range, a decrease in intrahemispheric coherence is also observed during stress-inducing stages S1 and S2 (Figure 4b). However, stage S1 is characterized by a decrease in interhemispheric coherence between the frontal leads and an increase in the occipital, parietal, and central leads. In stage S2, an increase in all interhemispheric coherence coefficients is observed (Figure 4b).
In the δ-range of EEG, a decrease in intrahemispheric coherence during stress is less pronounced than in the δ1-range and the δ2-range (Figure 4c). Interhemispheric coherence increases in the δ-range during both stress stages S1 and S2 (Figure 4c). In the θ-range, an increase in interhemispheric coherence is seen in response to the stress at stage S2 (Figure 4d).
Table 1 presents the medians and the first and third quartiles of individual differences in interhemispheric and intrahemispheric coherence coefficients at stages S1 and R1, and stages S2 and R2. A negative median value indicates a decrease in coherence at the stress stage and a positive median value indicates an increase in coherence during stress.
The results of the analysis of the structure of directional couplings between EEG leads are presented in Figure 4e–h. It can be seen that in general, the changes in directional coupling indices during the stages of stress agree well with the changes observed in the phase coherence coefficients in Figure 4a–d. The general trend is a decrease in intrahemispheric couplings and an increase in interhemispheric couplings between EEG leads during stress. Most of the identified significant changes in couplings between pairs of EEG leads are observed in both directions (Figure 4e–h).

4. Discussion

In this paper, we studied in detail the influence of stress-inducing cognitive tasks on the infra-slow oscillations of brain potentials. We previously obtained indirect evidence of the influence of stress on the power spectral density of EEG signals in the low-frequency range [16]. However, the present study revealed, for the first time, statistically significant changes in the power of infra-slow oscillations in EEG signals in response to the development of moderate stress. The results of oscillations in the α-range and β-range of EEG signals obtained in this study agree with the results of other studies [52,53,54,55,56,57,59,60]. For example, it was shown that β-activity in the frontal and temporal areas was significantly higher in the non-stress group than in the stress group under emotionally unpleasant stimuli [60]. However, the spectral indices of δ1- activity and δ2-activity showed a much higher sensitivity to stress (Figure 2). Thus, analysis of the power of infra-slow oscillations of brain potentials for the diagnostics of stress is promising.
Power distribution by EEG leads qualitatively differs in different frequency ranges, which indicates that different mechanisms cause the identified changes. Oscillations in the δ1- and δ2-ranges have maximal power in the frontal EEG leads (Figure 2a,b), which is probably due to their location above the prefrontal cortex, which is associated with the activity of the sympathetic and parasympathetic nervous systems [60,61]. α-oscillations have maximal power in parietal EEG leads (Figure 2c) that can be explained by a change in the activity of the corresponding cortical structures when focusing attention [62]. The β/α ratio is maximal in the occipital EEG leads (Figure 2d) that is often interpreted as activation of the cortical structures responsible for processing cognitive information [63].
The results of the analysis of couplings between EEG leads in the frequency range <0.5 Hz are also of interest. It was reported that the development of stress is accompanied by a decrease in intrahemispheric couplings and an increase in interhemispheric couplings in the δ- and θ-ranges [20,22,64]. Our results are consistent with these findings (Figure 4c,d,g,h). Moreover, analysis of the connectivity of infra-slow oscillations of brain potentials, performed for the first time in this study, also demonstrated a significant decrease in intrahemispheric couplings under stress (Figure 4a,b,e,f). The interhemispheric couplings between EEG leads also increased during stress in the δ2-range as well as in the δ- and θ-ranges. However, in the δ1-range, the interhemispheric couplings decreased under stress (Figure 4a,e). This can probably be explained by the nature of oscillations in the δ1-range associated with the processes of sympathetic control that respond to the development of stress [1,7,33,34,35].
Comparison of changes in couplings of EEG leads indicates that the decrease in intrahemispheric couplings in response to stress is most pronounced in the δ1- and δ2-ranges (Figure 4a,b,e,f) and least pronounced in the θ-range (Figure 4d,h). During the SCWT (stage S1), the changes in interhemispheric couplings are most pronounced in the δ-range (Figure 4c,g) and least pronounced in the δ1-range (Figure 4a,e). During the MAT (stage S2), the changes in interhemispheric couplings are more pronounced in the δ2-, δ-, and θ-ranges than in the δ1-range. In general, it can be seen that changes in interhemispheric couplings are more pronounced across all frequency ranges during the MAT than during the SCWT; these can be explained by the greater cognitive load on volunteers during SCWT.
An increase or decrease in the coherence between a pair of EEG leads at different stages of the experiment was, in most cases, accompanied by a similar dynamic in the indices of directional coupling (Figure 4). For example, a decrease in intrahemispheric coherence between EEG leads in the δ1-range (Figure 4a) and the δ2-range (Figure 4b) during the SCWT correlates with a decrease in directional coupling from the frontal, central, and parietal leads to occipital leads within the same hemisphere (Figure 4e,f). A decrease in interhemispheric coherence in the δ1-range during the MAT (Figure 4a) correlates with a decrease in directional coupling between the frontal, central, and parietal EEG leads of the left and right hemispheres (Figure 4e). An increase in intrahemispheric coherence between EEG leads in the δ2-range during the MAT correlates with an increase in unidirectional coupling from the leads of the right hemisphere to the leads of the left hemisphere. Good agreement between the results of the coupling analysis obtained using the methods based on estimation of phase coherence coefficients and directional coupling indices increases the reliability of our results due to the qualitative difference between these methods.
It should be noted that for most pairs of EEG leads, the revealed directional couplings were bidirectional (lines in Figure 4e–h). In cases where couplings between the leads were identified as unidirectional (arrows in Figure 4e–h), it is difficult to systematize the structure of such directional couplings. We assume that the couplings between the pairs of EEG leads are mainly bidirectional, but the insufficient sensitivity of the method did not allow us in some cases to identify a statistically significant coupling in the opposite direction.
The obtained results allow us to conclude that the considered methods are efficient for the detection of stress. Moreover, these methods are able to distinguish the states of stress caused by pattern recognition (SCWT) and intensive solving of formal tasks (MAT). Note that during SCWT (stage S1) the phase coherence coefficients decrease in the δ2-range, while during MAT (stage S2) these coefficients increase in this range (Figure 3b,f). At the same time, under stress caused by SCWT, an increase in interhemispheric couplings in the δ-range is observed, while interhemispheric couplings in the δ1-range do not change (Figure 4). Under stress caused by MAT, a pronounced increase in interhemispheric couplings in the δ2-, δ- and θ-ranges is observed, while interhemispheric couplings decrease in the δ1-range.
Thus, the changes in the power and coupling of infra-slow oscillations in the signals of EEG leads during stress-inducing cognitive tasks can be used as sensitive biomarkers of the type and strength of cognitive load, since they reflect the influence of the processes of higher nervous activity on the processes of autonomic control, resulting in a change in the psychophysiological state of the subject.
For many applied problems, the use of a small number of EEG leads is sufficient and may even have advantages over multielectrode systems. In our study, the main goal was to identify the changes in the intensity and couplings of oscillations in the signals of EEG leads in response to a cognitive task, and using a small number of electrodes to solve this problem turned out to be sufficient.
A limitation of our study is the use of a homogeneous group of healthy subjects, all of whom were males of nearly the same age. Moreover, all subjects performed stress-inducing cognitive tasks for the first time. In the future, we plan to study stress in different groups of subjects who differ in gender, age, and experience in participating in stress-inducing experiments. In particular, we plan to assess the mental state of the subjects using questionnaires [65,66].
It is important to compare the obtained results with the results given by the application of other methods of signal analysis. Therefore, we plan to assess the cross-frequency coupling between the phase of slower oscillatory activity and the amplitude of faster oscillatory activity in the brain, as well as to calculate some nonlinear dynamic measures of complexity [67]. Simultaneous use of various methods of analyzing the interactions between EEG oscillations in different frequency ranges can improve the efficiency of stress detection. It is also valuable to compare the results of electrophysiological studies with the results of animal studies [17,18].

5. Conclusions

For the first time, we studied in detail the infra-slow oscillations of brain potentials in the frequency ranges of 0.05–0.15 Hz and 0.15–0.50 Hz, which are associated with the processes of autonomous control, during the Stroop Color Word Test and mental arithmetic test that induce moderate stress.
It was shown that, compared with the state of rest, stress is characterized by a significant decrease in the power of infra-slow oscillations in the signals of EEG leads. The changes in the spectral indices of infra-slow oscillations under stress are more pronounced than the changes in the spectral indices of oscillations in the higher frequency ranges of EEG signals. Phase coherence coefficients between infra-slow oscillations in different EEG leads are also more sensitive to stress than coherence between oscillations at higher frequencies. Analysis of phase coherence and directional coupling between pairs of EEG leads under stress revealed a decrease in both intrahemispheric and interhemispheric couplings between EEG leads in the range of 0.05–0.15 Hz, and a decrease in intrahemispheric and an increase in interhemispheric couplings in the range of 0.15–0.50 Hz.
Thus, analysis of changes in the power and coupling of infra-slow oscillations in the signals of EEG leads during stress-inducing cognitive tasks is promising for detecting stress.

Author Contributions

Conceptualization, M.D.P. and A.S.K.; methodology, E.I.B. and V.I.P.; software, A.N.H.; validation, E.I.B.; formal analysis, Y.M.I.; investigation, E.I.B. and A.N.H.; resources, A.S.K.; data curation, E.S.D. and A.V.K.; writing—original draft preparation, E.I.B. and M.D.P.; writing—review and editing, M.D.P.; visualization, A.N.H.; supervision, M.D.P. and A.S.K.; project administration, M.D.P.; funding acquisition, M.D.P. All authors have read and agreed to the published version of the manuscript.

Funding

This research was supported by the Russian Federal Academic Leadership Program Priority 2030 at the Immanuel Kant Baltic Federal University (No. 410-L-23).

Institutional Review Board Statement

The study was conducted in accordance with the Declaration of Helsinki and approved by the Ethics Committee of Saratov State Medical University (protocol No. 8 from 2 March 2021).

Informed Consent Statement

Informed consent was obtained from all subjects involved in the study.

Data Availability Statement

The datasets analyzed during the study are available from the corresponding author on reasonable request.

Conflicts of Interest

The authors declare no conflict of interest.

References

  1. Camm, A.J.; Malik, M.; Bigger, J.T.; Breithardt, G.; Cerutti, S.; Cohen, R.J.; Coumel, P.; Fallen, E.L.; Kennedy, H.L.; Kleiger, R.E.; et al. Heart Rate Variability: Standards of Measurement, Physiological Interpretation and Clinical Use. Task Force of the European Society of Cardiology and the North American Society of Pacing and Electrophysiology. Circulation 1996, 93, 1043–1065. [Google Scholar]
  2. Wessel, N.; Riedl, M.; Kurths, J. Is the Normal Heart Rate “Chaotic” Due to Respiration? Chaos 2009, 19, 28508. [Google Scholar] [CrossRef] [PubMed]
  3. Aladjalova, N.A. Infra-Slow Rhythmic Oscillations of The Steady Potential of the Cerebral Cortex. Nature 1957, 179, 957–959. [Google Scholar] [CrossRef] [PubMed]
  4. Friston, K.J. Functional and Effective Connectivity: A Review. Brain Connect. 2011, 1, 13–36. [Google Scholar] [CrossRef]
  5. Katmah, R.; Al-Shargie, F.; Tariq, U.; Babiloni, F.; Al-Mughairbi, F.; Al-Nashash, H. A Review on Mental Stress Assessment Methods Using EEG Signals. Sensors 2021, 21, 5043. [Google Scholar] [CrossRef]
  6. Schulz, S.; Adochiei, F.-C.; Edu, I.-R.; Schroeder, R.; Costin, H.; Bär, K.-J.; Voss, A. Cardiovascular and Cardiorespiratory Coupling Analyses: A Review. Phil. Trans. R. Soc. A. 2013, 371, 20120191. [Google Scholar] [CrossRef] [Green Version]
  7. Giannakakis, G.; Grigoriadis, D.; Giannakaki, K.; Simantiraki, O.; Roniotis, A.; Tsiknakis, M. Review on Psychological Stress Detection Using Biosignals. IEEE Trans. Affect. Comput. 2022, 13, 440–460. [Google Scholar] [CrossRef]
  8. Iatsenko, D.; Bernjak, A.; Stankovski, T.; Shiogai, Y.; Owen-Lynch, P.J.; Clarkson, P.B.M.; McClintock, P.V.E.; Stefanovska, A. Evolution of Cardiorespiratory Interactions with Age. Phil. Trans. R. Soc. A. 2013, 371, 20110622. [Google Scholar] [CrossRef] [Green Version]
  9. Ponomarenko, V.I.; Karavaev, A.S.; Borovkova, E.I.; Hramkov, A.N.; Kiselev, A.R.; Prokhorov, M.D.; Penzel, T. Decrease of Coherence between the Respiration and Parasympathetic Control of the Heart Rate with Aging. Chaos 2021, 31, 73105. [Google Scholar] [CrossRef]
  10. Borovkova, E.I.; Hramkov, A.N.; Karavaev, A.S.; Ponomarenko, V.I.; Prokhorov, M.D.; Ishbulatov, Y.M.; Penzel, T. Directional Couplings Between Electroencephalogram and Interbeat Intervals Signals in Awake State and Different Stages of Sleep. In 2021 43rd Annual International Conference of the IEEE Engineering in Medicine & Biology Society (EMBC), Guadalajara, Mexico, 1–5 November 2021; IEEE: Mexico, 2021; pp. 5398–5402. [Google Scholar] [CrossRef]
  11. Karavaev, A.S.; Skazkina, V.V.; Borovkova, E.I.; Prokhorov, M.D.; Hramkov, A.N.; Ponomarenko, V.I.; Runnova, A.E.; Gridnev, V.I.; Kiselev, A.R.; Kuznetsov, N.V.; et al. Synchronization of the Processes of Autonomic Control of Blood Circulation in Humans Is Different in the Awake State and in Sleep Stages. Front. Neurosci. 2022, 15, 791510. [Google Scholar] [CrossRef]
  12. Borovkova, E.I.; Prokhorov, M.D.; Kiselev, A.R.; Hramkov, A.N.; Mironov, S.A.; Agaltsov, M.V.; Ponomarenko, V.I.; Karavaev, A.S.; Drapkina, O.M.; Penzel, T. Directional Couplings between the Respiration and Parasympathetic Control of the Heart Rate during Sleep and Wakefulness in Healthy Subjects at Different Ages. Front. Netw. Physiol. 2022, 2, 942700. [Google Scholar] [CrossRef]
  13. Karavaev, A.S.; Prokhorov, M.D.; Ponomarenko, V.I.; Kiselev, A.R.; Gridnev, V.I.; Ruban, E.I.; Bezruchko, B.P. Synchronization of Low-Frequency Oscillations in the Human Cardiovascular System. Chaos 2009, 19, 33112. [Google Scholar] [CrossRef] [Green Version]
  14. Bockeria, O.L.; Shvartz, V.A.; Akhobekov, A.A.; Glushko, L.A.; Le, T.G.; Kiselev, A.R.; Prokhorov, M.D.; Bockeria, L.A. Statin Therapy in the Prevention of Atrial Fibrillation in the Early Postoperative Period after Coronary Artery Bypass Grafting: A Meta-Analysis. Cor Vasa 2017, 59, e266–e271. [Google Scholar] [CrossRef] [Green Version]
  15. Kiselev, A.R.; Gridnev, V.I.; Prokhorov, M.D.; Karavaev, A.S.; Posnenkova, O.M.; Ponomarenko, V.I.; Bezruchko, B.P.; Shvartz, V.A. Evaluation of 5-Year Risk of Cardiovascular Events in Patients after Acute Myocardial Infarction Using Synchronization of 0.1-Hz Rhythms in Cardiovascular System: 0.1-Hz Rhythms and 5-Year Risk. Ann. Noninvasive Electrocardiol. 2012, 17, 204–213. [Google Scholar] [CrossRef]
  16. Borovkova, E.I.; Hramkov, A.N.; Dubinkina, E.S.; Ponomarenko, V.I.; Bezruchko, B.P.; Ishbulatov, Y.M.; Kurbako, A.V.; Karavaev, A.S.; Prokhorov, M.D. Biomarkers of the Psychophysiological State during the Cognitive Tasks Estimated from the Signals of the Brain, Cardiovascular and Respiratory Systems. Eur. Phys. J. Spec. Top. 2023, 232, 625–633. [Google Scholar] [CrossRef]
  17. Kalauzi, A.; Kesic, S.; Saponjic, J. Cortico-pontine theta synchronization phase shift following monoaminergic lesion in rat. J. Physiol. Pharmacol. 2009, 60, 79–84. [Google Scholar]
  18. Kesic, S.; Kalauzi, A.; Radulovacki, M.; Carley, D.W.; Saponjic, J. Coupling changes in cortical and pontine sigma and theta frequency oscillations following monoaminergic lesions in rat. Sleep Breath. 2010, 15, 35–47. [Google Scholar] [CrossRef]
  19. Xia, L.; Malik, A.S.; Subhani, A.R. A Physiological Signal-Based Method for Early Mental-Stress Detection. In Cyber-Enabled Intelligence; Ning, H., Chen, L., Ullah, A., Luo, X., Eds.; Taylor & Francis: Abingdon, UK, 2019; pp. 259–289. [Google Scholar] [CrossRef]
  20. Subhani, A.R.; Malik, A.S.; Kamil, N.; Saad, M.N.M. Difference in Brain Dynamics during Arithmetic Task Performed in Stress and Control Conditions. In Proceedings of the 2016 IEEE EMBS Conference on Biomedical Engineering and Sciences (IECBES), Kuala Lumpur, Malaysia, 4–8 December 2016; pp. 695–698. [Google Scholar] [CrossRef]
  21. Subhani, A.R.; Mumtaz, W.; Saad, M.N.M.; Kamel, N.; Malik, A.S. Machine Learning Framework for the Detection of Mental Stress at Multiple Levels. IEEE Access 2017, 5, 13545–13556. [Google Scholar] [CrossRef]
  22. Al-Shargie, F. Early Detection of Mental Stress Using Advanced Neuroimaging and Artificial Intelligence. arXiv 2019, arXiv:1903.08511. [Google Scholar]
  23. Alonso, J.F.; Romero, S.; Ballester, M.R.; Antonijoan, R.M.; Mañanas, M.A. Stress Assessment Based on EEG Univariate Features and Functional Connectivity Measures. Physiol. Meas. 2015, 36, 1351–1365. [Google Scholar] [CrossRef]
  24. Umar Saeed, S.M.; Anwar, S.M.; Majid, M.; Awais, M.; Alnowami, M. Selection of Neural Oscillatory Features for Human Stress Classification with Single Channel EEG Headset. BioMed Res. Int. 2018, 2018, 1049257. [Google Scholar] [CrossRef] [PubMed] [Green Version]
  25. Al-Shargie, F.; Tang, T.B.; Kiguchi, M. Assessment of Mental Stress Effects on Prefrontal Cortical Activities Using Canonical Correlation Analysis: An FNIRS-EEG Study. Biomed. Opt. Express 2017, 8, 2583. [Google Scholar] [CrossRef] [PubMed] [Green Version]
  26. Darzi, A.; Azami, H.; Khosrowabadi, R. Brain functional connectivity changes in long-term mental stress. J. Neurodev. Cogn. 2019, 1, 16–41. [Google Scholar] [CrossRef]
  27. Zanetti, M.; Faes, L.; De Cecco, M.; Fornaser, A.; Valente, M.; Guandalini, G.; Nollo, G. Assessment of Mental Stress Through the Analysis of Physiological Signals Acquired From Wearable Devices. In Ambient Assisted Living; Leone, A., Caroppo, A., Rescio, G., Diraco, G., Siciliano, P., Eds.; Lecture Notes in Electrical Engineering; Springer International Publishing: Cham, Switzerland, 2019; Volume 544, pp. 243–256. [Google Scholar] [CrossRef]
  28. Subhani, A.R.; Mumtaz, W.; Kamil, N.; Saad, N.M.; Nandagopal, N.; Malik, A.S. MRMR Based Feature Selection for the Classification of Stress Using EEG. In Proceedings of the 2017 Eleventh International Conference on Sensing Technology (ICST), Sydney, NSW, Australia, 4–6 December 2017; IEEE: Sydney, NSW, Australia, 2017; pp. 1–4. [Google Scholar] [CrossRef]
  29. Al-Shargie, F.M.; Hassanin, O.; Tariq, U.; Al-Nashash, H. EEG-Based Semantic Vigilance Level Classification Using Directed Connectivity Patterns and Graph Theory Analysis. IEEE Access 2020, 8, 115941–115956. [Google Scholar] [CrossRef]
  30. Al-Shargie, F.; Tariq, U.; Hassanin, O.; Mir, H.; Babiloni, F.; Al-Nashash, H. Brain Connectivity Analysis Under Semantic Vigilance and Enhanced Mental States. Brain Sci. 2019, 9, 363. [Google Scholar] [CrossRef] [PubMed] [Green Version]
  31. Khosrowabadi, R. Stress and Perception of Emotional Stimuli: Long-Term Stress Rewiring the Brain. BCN 2018, 9, 107–120. [Google Scholar] [CrossRef] [Green Version]
  32. Yu, X.; Zhang, J. Estimating the Cortex and Autonomic Nervous Activity during a Mental Arithmetic Task. Biomed. Signal Process. Control. 2012, 7, 303–308. [Google Scholar] [CrossRef]
  33. Knyazev, G.G. EEG Delta Oscillations as a Correlate of Basic Homeostatic and Motivational Processes. Neurosci. Biobehav. Rev. 2012, 36, 677–695. [Google Scholar] [CrossRef]
  34. Lőrincz, M.L.; Geall, F.; Bao, Y.; Crunelli, V.; Hughes, S.W. ATP-Dependent Infra-Slow (<0.1 Hz) Oscillations in Thalamic Networks. PLoS ONE 2009, 4, e4447. [Google Scholar] [CrossRef] [Green Version]
  35. Karavaev, A.S.; Kiselev, A.R.; Runnova, A.E.; Zhuravlev, M.O.; Borovkova, E.I.; Prokhorov, M.D.; Ponomarenko, V.I.; Pchelintseva, S.V.; Efremova, T.Y.; Koronovskii, A.A.; et al. Synchronization of Infra-Slow Oscillations of Brain Potentials with Respiration. Chaos 2018, 28, 81102. [Google Scholar] [CrossRef]
  36. Ahn, J.W.; Ku, Y.; Kim, H.C. A Novel Wearable EEG and ECG Recording System for Stress Assessment. Sensors 2019, 19, 1991. [Google Scholar] [CrossRef] [Green Version]
  37. Colosio, M.; Shestakova, A.; Nikulin, V.V.; Blagovechtchenski, E.; Klucharev, V. Neural Mechanisms of Cognitive Dissonance (Revised): An EEG Study. J. Neurosci. 2017, 37, 5074–5083. [Google Scholar] [CrossRef] [Green Version]
  38. Nakao, T.; Miyagi, M.; Hiramoto, R.; Wolff, A.; Gomez-Pilar, J.; Miyatani, M.; Northoff, G. From Neuronal to Psychological Noise—Long-Range Temporal Correlations in EEG Intrinsic Activity Reduce Noise in Internally-Guided Decision Making. NeuroImage 2019, 201, 116015. [Google Scholar] [CrossRef]
  39. Sugimura, K.; Iwasa, Y.; Kobayashi, R.; Honda, T.; Hashimoto, J.; Kashihara, S.; Zhu, J.; Yamamoto, K.; Kawahara, T.; Anno, M.; et al. Association between Long-Range Temporal Correlations in Intrinsic EEG Activity and Subjective Sense of Identity. Sci. Rep. 2021, 11, 422. [Google Scholar] [CrossRef]
  40. Monto, S.; Palva, S.; Voipio, J.; Palva, J.M. Very Slow EEG Fluctuations Predict the Dynamics of Stimulus Detection and Oscillation Amplitudes in Humans. J. Neurosci. 2008, 28, 8268–8272. [Google Scholar] [CrossRef] [Green Version]
  41. Marshall, L.; Mölle, M.; Fehm, H.L.; Born, J. Changes in Direct Current (DC) Potentials and Infra-Slow EEG Oscillations at the Onset of the Luteinizing Hormone (LH) Pulse: DC Shifts, Infra-Slow Oscillations and LH. Eur. J. Neurosci. 2000, 12, 3935–3943. [Google Scholar] [CrossRef]
  42. Lázár, Z.I.; Dijk, D.-J.; Lázár, A.S. Infraslow Oscillations in Human Sleep Spindle Activity. J. Neurosci. Methods 2019, 316, 22–34. [Google Scholar] [CrossRef]
  43. Vanhatalo, S.; Palva, J.M.; Holmes, M.D.; Miller, J.W.; Voipio, J.; Kaila, K. Infraslow Oscillations Modulate Excitability and Interictal Epileptic Activity in the Human Cortex during Sleep. Proc. Natl. Acad. Sci. USA 2004, 101, 5053–5057. [Google Scholar] [CrossRef]
  44. Stroop, J.R. Studies of Interference in Serial Verbal Reactions. J. Exp. Psychol. 1935, 18, 643–662. [Google Scholar] [CrossRef]
  45. Schneider, G.M.; Jacobs, D.W.; Gevirtz, R.N.; O’Connor, D.T. Cardiovascular Haemodynamic Response to Repeated Mental Stress in Normotensive Subjects at Genetic Risk of Hypertension: Evidence of Enhanced Reactivity, Blunted Adaptation, and Delayed Recovery. J Hum Hypertens 2003, 17, 829–840. [Google Scholar] [CrossRef] [Green Version]
  46. Medicom MTD: Electroencephalographic studies “Encephalan-EEG”. Available online: Medicom-mtd.com (accessed on 23 June 2023).
  47. Ifeachor, E.C.; Jervis, B.W. Digital Signal Processing: A Practical Approach; Pearson Education: London, UK, 2002. [Google Scholar]
  48. Mormann, F.; Lehnertz, K.; David, P.E.; Elger, C. Mean Phase Coherence as a Measure for Phase Synchronization and Its Application to the EEG of Epilepsy Patients. Phys. D Nonlinear Phenom. 2000, 144, 358–369. [Google Scholar] [CrossRef]
  49. Gabor, D. Theory of Communication. Part 1: The Analysis of Information. J. Inst. Electr. Eng. Part III 1946, 93, 429–441. [Google Scholar] [CrossRef] [Green Version]
  50. Smirnov, D.A.; Bezruchko, B.P. Estimation of Interaction Strength and Direction from Short and Noisy Time Series. Phys. Rev. E 2003, 68, 46209. [Google Scholar] [CrossRef] [PubMed] [Green Version]
  51. Mann, H.B.; Whitney, D.R. On a Test of Whether One of Two Random Variables Is Stochastically Larger than the Other. Ann. Math. Stat. 1947, 18, 50–60. [Google Scholar] [CrossRef]
  52. Knott, V.; Mahoney, C.; Kennedy, S.; Evans, K. EEG Power, Frequency, Asymmetry and Coherence in Male Depression. Psychiatry Res. Neuroimag. 2001, 106, 123–140. [Google Scholar] [CrossRef]
  53. Tran, Y.; Thuraisingham, R.A.; Wijesuriya, N.; Nguyen, H.T.; Craig, A. Detecting Neural Changes during Stress and Fatigue Effectively: A Comparison of Spectral Analysis and Sample Entropy. In Proceedings of the 2007 3rd International IEEE/EMBS Conference on Neural Engineering, Kohala Coast, HI, USA, 2–5 May 2007; IEEE: Kohala Coast, HI, USA, 2007; pp. 350–353. [Google Scholar] [CrossRef]
  54. Al-Shargie, F.; Kiguchi, M.; Badruddin, N.; Dass, S.C.; Hani, A.F.M.; Tang, T.B. Mental Stress Assessment Using Simultaneous Measurement of EEG and FNIRS. Biomed. Opt. Express 2016, 7, 3882. [Google Scholar] [CrossRef] [Green Version]
  55. Al-shargie, F.M.; Tang, T.B.; Badruddin, N.; Kiguchi, M. Mental Stress Quantification Using EEG Signals. In International Conference for Innovation in Biomedical Engineering and Life Sciences; Ibrahim, F., Usman, J., Mohktar, M.S., Ahmad, M.Y., Eds.; IFMBE Proceedings; Springer: Singapore, 2016; Volume 56, pp. 15–19. [Google Scholar] [CrossRef]
  56. Demerdzieva, A. Eeg Characteristics of Generalized Anxiety Disorder in Childhood. Acta Inform. Medica 2011, 19, 9–15. [Google Scholar]
  57. Giannakakis, G.; Grigoriadis, D.; Tsiknakis, M. Detection of Stress/Anxiety State from EEG Features during Video Watching. In Proceedings of the 2015 37th Annual International Conference of the IEEE Engineering in Medicine and Biology Society (EMBC), Milan, Italy, 25-29 August 2015; pp. 6034–6037. [Google Scholar] [CrossRef]
  58. Minguillon, J.; Lopez-Gordo, M.A.; Pelayo, F. Stress Assessment by Prefrontal Relative Gamma. Front. Comput. Neurosci. 2016, 10. [Google Scholar] [CrossRef] [Green Version]
  59. Seo, S.; Gil, Y.; Lee, J. The Relation between Affective Style of Stressor on EEG Asymmetry and Stress Scale during Multimodal Task. In Proceedings of the 2008 Third International Conference on Convergence and Hybrid Information Technology, Busan, Republic of Korea, 11–13 November 2008; Volume 1, pp. 461–466. [Google Scholar] [CrossRef]
  60. Hayashi, T.; Okamoto, E.; Nishimura, H.; Mizuno-Matsumoto, Y.; Ishii, R.; Ukai, S. Beta activities in EEG associated with emotional stress. Int. J. Intell. Comput. Med. Sci. Image Process. 2009, 3, 57–68. [Google Scholar] [CrossRef]
  61. Lewis, R.S.; Weekes, N.Y.; Wang, T.H. The Effect of a Naturalistic Stressor on Frontal EEG Asymmetry, Stress, and Health. Biol. Psychol. 2007, 75, 239–247. [Google Scholar] [CrossRef]
  62. Benedek, M.; Schickel, R.J.; Jauk, E.; Fink, A.; Neubauer, A.C. Alpha Power Increases in Right Parietal Cortex Reflects Focused Internal Attention. Neuropsychologia 2014, 56, 393–400. [Google Scholar] [CrossRef] [Green Version]
  63. Sauseng, P.; Klimesch, W.; Stadler, W.; Schabus, M.; Doppelmayr, M.; Hanslmayr, S.; Gruber, W.R.; Birbaumer, N. A Shift of Visual Spatial Attention Is Selectively Associated with Human EEG Alpha Activity. Eur. J. Neurosci. 2005, 22, 2917–2926. [Google Scholar] [CrossRef]
  64. Thatcher, R.W.; Krause, P.J.; Hrybyk, M. Cortico-Cortical Associations and EEG Coherence: A Two-Compartmental Model. Electroencephalogr. Clin. Neurophysiol. 1986, 64, 123–143. [Google Scholar] [CrossRef]
  65. Smets, E.M.; Garssen, B.; Bonke, B.; De Haes, J.C. The Multidimensional Fatigue Inventory (MFI) psychometric qualities of an instrument to assess fatigue. J. Psychosom. Res. 1995, 39, 315–325. [Google Scholar] [CrossRef] [Green Version]
  66. Available online: https://humansystems.arc.nasa.gov/groups/TLX/ (accessed on 15 December 2020).
  67. Kalauzi, A.; Bojić, T.; Rakić, L. Extracting complexity waveforms from one-dimensional signals. Nonlinear Biomed. Phys. 2009, 3, 8. [Google Scholar] [CrossRef] [Green Version]
Figure 1. (a) Protocol for the stress test. (b) Stroop Color Word Test. (c) Mental arithmetic test.
Applsci 13 08390 g001
Figure 2. (ad) Maps of the median values of the power of EEG signals averaged over all subjects at R1, S1, R2, and S2 stages of the experiment: (a) δ1-activity; (b) δ2-activity; (c) α-activity; (d) β/α-activity. Dots indicate the EEG leads. (eh) Normalized differences in the median values of spectral indices at stages S1 and R1, and stages S2 and R2: (e) Δδ1-activity; (f) Δδ2-activity; (g) Δα-activity; (h) Δβ/α-activity. Circles indicate the EEG leads that demonstrated statistically significant differences between the stages of rest and stress, while crosses indicate the EEG leads in which these differences were not statistically significant.
Applsci 13 08390 g002
Figure 3. (ad) Medians of distributions in the ensemble of mean values of the coherence between EEG leads in (a) δ1-range, (b) δ2-range, (c) δ-range, (d) θ-range at R1, S1, R2, and S2 stages of the experiment. (eh) Differences in coherence coefficients at stages S1 and R1, and stages S2 and R2 in: (e) δ1-range, (f) δ2-range, (g) δ-range, (h) θ-range. Circles indicate the EEG leads that demonstrated statistically significant differences between the stages of rest and stress, while crosses indicate the EEG leads in which these differences were not statistically significant.
Applsci 13 08390 g003
Figure 4. (ad) Changes in coherence between the pairs of EEG leads at stages S1 and R1, and stages S2 and R2 in (a) δ1-range, (b) δ2-range, (c) δ-range, (d) θ-range. The blue lines indicate a statistically significant decrease in coherence and red lines indicate an increase in coherence. (eh) Changes in directional coupling indices in (e) δ1-range, (f) δ2-range, (g) δ-range, (h) θ-range. The thick lines indicate statistically significant couplings in both directions and thin arrows indicate coupling in only one direction.
Applsci 13 08390 g004
Table 1. Medians and the first and third quartiles of distributions of individual differences between the coefficients of interhemispheric and intrahemispheric coherence of EEG leads at the stages of stress and rest.
CoefficientsSCWTMAT
Intrahemispheric
Δδ1-coherence −23 (−40; −6)−19 (−35; −4)
Δδ2-coherence−21 (−33; −8)−10 (−20; 1)
Δδ-coherence−7 (−17; 2)−4 (−11; 2)
Δθ-coherence−2 (−10; 2)2 (−3; 7)
Interhemispheric
Δδ1-coherence−6 (−30; 32)−9 (−32; 27)
Δδ2-coherence7 (−26; 57)29 (0; 81)
Δδ-coherence26 (8; 55)30 (11; 70)
Δθ-coherence6 (−3; 16)13 (4; 26)
Disclaimer/Publisher’s Note: The statements, opinions and data contained in all publications are solely those of the individual author(s) and contributor(s) and not of MDPI and/or the editor(s). MDPI and/or the editor(s) disclaim responsibility for any injury to people or property resulting from any ideas, methods, instructions or products referred to in the content.

