Article

Uncovering the Hidden Correlations between Socioeconomic Indicators and Aviation Accidents in the United States

1
ISEC Lisboa, Alameda das Linhas de Torres, 179, 1750-142 Lisboa, Portugal
2
Aeronautics and Astronautics Research Center (AEROG), Universidade da Beira Interior, Calçada Fonte do Lameiro, 6200-358 Covilhã, Portugal
3
Instituto de Engenharia Mecânica (IDMEC), Instituto Superior Técnico, Universidade de Lisboa, Av. Rovisco Pais 1, 1049-001 Lisboa, Portugal
*
Author to whom correspondence should be addressed.
Appl. Sci. 2023, 13(14), 7997; https://doi.org/10.3390/app13147997
Submission received: 14 June 2023 / Revised: 30 June 2023 / Accepted: 5 July 2023 / Published: 8 July 2023
(This article belongs to the Special Issue Research on Aviation Safety)

Abstract

:
Rules and regulations for accident mitigation have been implemented between all players. It is necessary to use new technologies and resources for human factors to mitigate future accidents to decrease accidents. It has been verified that accidents by sabotage are currently non-existent and that most of the fatalities are during the flight and in the runway approach phase. Severe accidents with associated fatalities are a small number that tend to decrease over time. Human errors, although with all the mitigations over time, are still the most significant cause of accidents; although accidents have decreased, other factors may be related to this type of error, such as the lack of personnel for the operation of a flight. Accidents can also be related to other factors, such as economic factors. GDP growth is positively correlated with accidents, and inflation is negatively correlated. It is also found that the inflation factor is also related to the number of flights due to a lack of demand.

1. Introduction

In the already highly regulated aviation industry, improving safety standards is a primary, constant, and ever-ongoing goal for the entire aviation ecosystem [1]. Air transport is considered the safest method of transportation due to the close interaction between all the organizations that are part of the aviation ecosystem [2]. However, the need for rules and regulations has driven the aviation industry to use safer and more reliable technologies and procedures [2].
One important way to minimize errors is to create a system that considers human factors, since these are one of the main reasons for accidents in industry. Since human error is inevitable, and although organizations increasingly tend to train their professionals to reduce this error, the feeling that technology is more reliable than humans lead them to be replaced by that same technology to mitigate the error. The number of accidents has decreased over time, but the decrease is not as significant if we consider the number of hours flown per occurrence [2]. Human errors are still the leading cause of air accidents in recent years, and there are several factors for them to happen; one of them is the lack of personnel, which jeopardizes the proper functioning of an operation because it will overload the remaining professionals in place. In other words, when there is a lack of staff, there is a higher possibility of errors occurring due to the stress factor of the remaining personnel. Although human error has been the most significant cause of accidents over the years in various studies, technical factors and environment have also had some relevance in this matter, still corresponding to a percentage, although minor, of significant air accidents. New technologies and new procedures have been introduced so that errors are increasingly fewer. Accidents caused by sabotage, which nowadays are not as likely to occur, have revolutionized safety on board aircraft and at airports, making them safer. Beyond all the internal factors in the industry that influence accidents and the number of flights during a year, external factors can also play a role. This is the case with economic factors such as inflation and the growth of the gross domestic product (GDP); these factors are also indirectly related to the number of flights per year and the existence of air accidents. This is expected since inflation often creates economic crises in various industries.
The aim of this study is to statistically analyze the transport aviation data to understand this quantitative trend and then extrapolate it into a qualitative form. This research of quantitative order, based on a statistical analysis based on the aviation safety network, will aim to understand the trend of the evolution of air accidents, both quantitatively and by accident per flight hour. Besides the historical and forecast evolution of accidents over the next few years, it is possible to identify external factors such as economic factors that may influence and change the course of accidents and flight hour.
The paper is structured as follows. Section 2 presents a brief state of the art of the hidden correlations between socioeconomic indicators and aviation accidents in the United States. Section 3 describes the methodology used in the research; and the database on civil aviation accidents in the last 40 years collected by the ASN. Section 4 shows the results of models applied, their validity, and the optimization of the algorithms. Finally, the conclusions are made in Section 5.

2. State of the Art

Safety is a facet of organizational culture that refers to all stakeholders’ norms, values, and practices in relation to safety and risk. This type of culture gained prominence after pressure was implemented to prioritize production, which negatively influenced values, norms, and practices in safety management. An organization’s primary standards for safety management are management commitment to safety, collaboration, incident reporting, communication, commitment, support, compliance, training, and safety rules. Safety is the most critical pillar of the aviation industry; a weak safety culture culminates in an increased likelihood of accidents, while a strong safety culture reduces the likelihood of accidents [3]. The EASA (European Union Aviation Safety Agency) defines safety as the result of all actions taken to prevent accidents, from the design of all aircraft applications to the operation of the aircraft. It defines safety standards to achieve the highest levels of safety. On the other hand, the ICAO (International Civil Aviation Organization) oversees the standards and practices of the participating nations to make the industry as safe and efficient as possible while also creating international standards to promote operational safety. When there is an accident, regardless of the location, the entire industry is negatively affected, especially if it is a fatal accident [4]). From the 1990s to the present day, aviation has entered an era of safety and reliability. Globally, with few exceptions, accidents have become infrequent to the point of becoming exceptional events (Figure 1). Although there are fewer and fewer accidents with fatalities and serious incidents, thus making risk assessment relatively difficult, there are new types of accidents that have been accounted for by the new type of causes (fatigue, “human error”, software failure, organizational failure). In the past, mental health was often neglected, although it has always been a serious factor in relation to accidents in aviation. Although airlines have created tools to preserve mental health, they are more focused on fatigue as a general problem. On the other hand, these tools sometimes served only to elude fatigue prevention [5].
Historically, whenever air transport had a relatively rapid growth, this has eventually culminated in a series of accidents. However, ICAO has shown that the fatality rate for commercial flight operations has decreased over time [6]. For example, between 1970 and 1993, the mortality rate fell from 0.18 to 0.04 per 100 million inhabitants [7].
Although nowadays we see that accidents do not result from a simple occurrence but from a set of factors, accidents have not always been seen this way; in the beginning, two constituents were considered to culminate in an accident: people and technology. Technology has always been seen as the main problem when an error or malfunction occurs, but technology has become more reliable and less likely to fail over time. As time passed and technology advanced, people became the leading cause and, more recently, organizations and culture took that role, as seen in [2] (Figure 2).
Accidents in aviation have decreased globally since the 1960s due to improvements and innovations in aircraft design and reliability and have been improved constantly to this day [8].
Over the years, several technologies have emerged for this purpose, to perform an operation with the least possible risk, namely the inclusion of autothrottle, fly by wire (FBW), or glass cockpit (EFIS/EICAS/ECAM) [9]. The certifications of the surrounding areas are increasingly essential, such as Design, Production, Modification: Part-21-Certifications Specifications, Maintenance, and Certification of maintenance personnel: Part-M, PART-CAMO, PART 145, PART 147, PART 66, operations PART-OPS, and lastly, Certification Air Crew: PART-AIRCREW [10].
The autothrottle system also allows the automatic control of the power generated by the motors for a given moment of operation, leaving conventional systems with a higher financial cost and lower efficiency. This control becomes essential so that pilots can pay attention to other tasks and possibly rest. Fly by wire (FBW) allows the surface actuators to be controlled and operated through electrical signals transmitted to an onboard computer. It has also brought numerous advantages, such as an increased aircraft performance, the ability to integrate additional controls to the movements, such as flaps for maneuvering the aircraft and not only for takeoffs and landings, and the possibility for the pilot to maneuver without worry. Lastly, the glass cockpit (EFIS/EICAS/ECAM) assists in the decision-making required for navigation. For decisions, pilots have screens and monitors called the glass cockpit that contemplates the navigation systems, engine instruments, and others. The system that provides cabin data is the electronic flight instrument system. In turn, the crew alert and engine indication system is called the engine indicating and crew alerting system—EICAS—and the aircraft’s central electronic monitor has the name electronic centralized aircraft monitor—ECAM [9].
In addition to investments in automation systems, human factors have evolved [11]. One of the most successful tools for managing human error was the introduction of CRM (crew resource management), which is designed to decrease error and increase crew efficiency and is defined for optimal crew use with all available resources (information, equipment, materials, and resources), and has encompassed a set of comportments and strategies that they have and must follow in the interest of safety, thus combining technical and human skills. The emergence of CRM is a milestone in the aviation–psychology relationship and changes the vision of aviation safety to reduce human error and increase crew efficiency [12].
The primary function of checklists is to ensure that the crew configures the aircraft properly to the flight segment—a standardization of cockpit procedures. The benefits of using a checklist are improved information processing, a reduced workload, reduced error, and improved response time. Unexpected situations are the main challenge, since an inherent problem of the checklist is the inability to foresee all the abnormal situations that the crew may encounter [13]. Another one of the objectives of the check-list is the effectiveness in promoting a positive attitude toward the use of this procedure; for the success of this mission, it is necessary that it is well-founded within the operational environment for it to have a good perception of its importance and not to consider it a bothersome task [14].
Safety management systems (SMSs) build on system safety but expand their view to include human factors, with human performance having a critical effect on safety during the entire system operation process. As a result, safety is responsible in all areas and levels of the entire organizational structure.
The four components of the SMS according to ICAO are its policy and objectives, risk management, safety promotion, and safety assurance. The main processes of a safety management system [15] are: (1) hazard identification; (2) safety reporting; (3) risk management; (4) performance measurement; and (5) safety assurance.
The main characteristics of any SMS are described as the management’s commitment to safety, as the management’s attitudes and actions can influence the organization’s culture and ways of working [16]. Weather is responsible for a portion of airplane accidents. Weather and aviation have a complex relationship that has plagued aviation for over 100 years [17]. Despite advances in scientific and technological understanding since the early 1900s, weather causes safety concerns, and little is known about the characteristics of weather-related fatal accidents in general aviation. These accidents happen most frequently between October and April, on weekends, in the morning and evening, and around mountainous locations [17]. There has been a reduction over time in weather-related aviation accidents and fatalities since the 1980s; however, these accidents still correspond to about 100 fatalities per year in the United States alone. Even with technological advances such as satellite radar in the cockpit, weather remains a consistent obstacle in overall aviation safety. Fatal accidents related to the environment decreased at slower rates than all general aviation accidents; weather-related accidents decreased at a rate 2.57 times slower than all general aviation accidents, and fatal accidents related to the environment have declined at a rate 1.73 times slower than all fatal general aviation accidents [17].
The 2021 safety report issued by the Aviation Safety Foundation identified a few safety risks that need to be mitigated, namely runway excursion, the loss of control in flight, and a controlled flight into terrain. Before the coronavirus pandemic, the commercial aviation sector was annually deploying over 37 million airplane departures and four billion passengers worldwide, with the ICAO expecting these numbers to reach 90 million and 10 billion, respectively, by 2040 [18].
The COVID-19 pandemic has caused operational changes, and these changes may cause new threats if they are not identified and mitigated [19]. In addition, the pandemic has affected the well-being of aviation professionals. All stakeholders must understand the impact and implement measures to address it. A total of 52% of the operators indicated that the staff described an increase in fatigue after returning to their duties, in addition to an increase in stress and, to a lesser extent, an increase in the level of reports of mental health problems during the pandemic [19]. Every year, different organizations such as the FAA, ICAO, CAA and the commercial aircraft manufacturers (Boing and Airbus), provide valuable reports on air accidents. These reports are based on the descriptive statistics of accidents, such as the rate of fatal accidents and fatality worldwide per year, the nature of flight, and the age of aircraft. They can also make analyses on different causal factors for these accidents and behaviors associated with these events [20].

3. Data Implementation

The methodology used in the research uses a quantitative approach that will be analyzed through a statistical analysis of the database on civil aviation accidents in the last 40 years, collected by the Aviation Safety Network [21].
A survey of the last 40 years of accidents and economic indicators that have occurred in U.S. airspace, covering the period 1980–2021 (40 years), has been organized and analyzed by the following data:
(1)
Number of accidents per year;
(2)
Number of fatalities and injuries per year;
(3)
Number of accidents by flight phases (ground, takeoff, en route, approach, and landing;
(4)
Number of accidents by root causes (technical, environmental, human error, and sabotage);
(5)
Type of flight (passenger flights, cargo flights);
(6)
Correlation with economic factors;
(7)
Correlation with the number of professionals in the operation of a flight.
The SPSS V27 software was the scientific tool chosen for the statistical analysis of this project. Besides a statistical analysis, it is also possible to check Pearson’s correlations, also elaborated in SPSS, with other data taken from World Bank databases to verify the correlation of accidents with GDP growth and inflation; the same flight cycles were also performed. To settle our curiosity, we went to check with the data we found in the FAA about the number of professionals involved in the operations and verified their correlation with the accidents and the causes of human errors. Pearson’s correlation is the correlation method used by the most used SPSS tool for making correlations. “Correlation is a bivariate association measure (strength) of the degree of relationship between two variables” [22]. The Pearson correlation coefficient (r) ranges from −1 to 1. The sign indicates the positive or negative direction of the relationship, and the value suggests the strength of the relationship between the variables. A perfect correlation (−1 or 1) indicates that the variables are linearly related. Conversely, a correlation of zero values indicates no linear relationship between the variables [22], although there may be a nonlinear relationship.
In addition to the correlation model, the ARIMA (autoregressive integrated moving average) model is an autoregressive moving average model. Moving average models use the average of the recorded observations as a forecast for a given period in the future. Moving averages can be simple, centered, or weighted in these models. The models that use the simple moving average are given by:
X t = x t 1 + x t 2 + + x t n / n
where n is the number of observations (observation window) and X t is the mean [23]. This model is also based on the plots of the autocorrelation function and the partial autocorrelation function so that, by visualizing the decays of the functions, it is possible to estimate the appropriate order of the model [24]. The ARIMA method is obtained with a set of factors. Although it checks the existing values in the previous years, i.e., if there is a change of factors in the forecast years or if the factors used are too many, there is always an associated error.

4. Results

4.1. Accidents by Years

The US evolution of the accidents (blue) and the US GDP growth (red) through time (1980–2020) are shown in Figure 1.
Figure 1. US evolution of the accidents (blue) and GDP growth (red) through time.
Applsci 13 07997 g001
In Figure 1, the evolution of the accidents through time in US (blue) can be reasonably described as constant, with a few peaks occurring during the 40 years under study. The years of economic crisis tend to decrease the number of accidents, as in the 2001 crisis, after the September 11 accident, when there was a decrease in the number of accidents.
In Figure 1, the GDP growth through time (red) remains the same throughout the years when accidents are also lower, as we can see in years 1990, 2001, 2009, and 2020, because they are the years of economic crisis in which the country has a lower financial capacity [25], leading to a poorer engagement in flying and, in the overhaul, a decrease in the number of flights and a consequent decrease in accidents. Therefore, we will make the correlation between these two lines to verify the evidence of the above lines.
Table 1 presents the correlation between the several analyzed factors, namely the number of accidents, human factors root cause and flight cycles (number of flights) with the variation of the GDP, inflation, and the number of aviation professionals. The relationship between the GDP and the number of accidents is such that they both move in the same direction. That is, an increase in GDP is associated with an increase in the number of accidents, and conversely, a decrease in GDP corresponds to a decrease in the number of accidents. This suggests a direct relationship between GDP and the number of accidents. However, the correlation between these two variables is relatively weak, as indicated by a correlation coefficient that is closer to 0 than to 1. In the case of inflation, we observe a similar pattern, albeit with a negative correlation. This implies that as inflation increases, the number of accidents tends to decrease.
The US evolution of the accidents through time (blue) and the US inflation evolution through time (red) (1980–2020) are shown in shown in Figure 2.
Figure 2. US evolution of the accidents through time (blue) and US inflation (red) through time.
Applsci 13 07997 g002
In Figure 2, the behavior of inflation (red) has some peaks comparable to those of GDP growth (red) in periods of crises, as observed in Figure 1. Let us correlate the two lines to verify their veracity. The correlation between the number of accidents and inflation is presented in Table 1; the number of accidents is negatively correlated with inflation [26], meaning that there is a week tendency when inflation is high, thus leading to a poorer engagement in flying and, in the overhaul, a decrease in the number of flights and a consequent decrease in accidents. Unlike economic growth, inflation behaves differently because, in this case, when one increases, the other decreases. This may constitute an influence because when inflation rises, it leaves the purchasing power of families more vulnerable, so it is reflected in all kinds of markets and services.

Accident Prediction

The evolution of accident prediction in the US (1980–2025) is shown in Figure 3.
In Figure 3, the evolution of accidents through time in the US is the red line; setting is the blue line; and the forecast is the green line. The total number of accidents in 2022 is higher than expected since the model predicted that there would be 32 accidents, but the values already exceeded predicted levels in 2022, with 45 recorded accidents. Therefore, in comparison with the year 2021, the year 2022 will have increased the number of accidents. However, we verify that the expected trend of accidents is a decrease, although not very accentuated, for the next 5 years.
The ARIMA model from the SPSS program was used to verify the accident forecast for the next 5 years. The correlation between human factors and the number of professionals (Table 1) shows the expected values for the next 5 years and it is possible to see that they are in line with what is expected.

4.2. Accidents Victims by Years

The US aircraft accident victims by year, fatalities (red), and injuries (blue) (1980–2020) are shown in Figure 4.
Concerning the victims of accidents, it is possible to observe in Figure 4 that this number has been decreasing in terms of fatalities (red) and injuries (blue). The most excellent highlight of the graph is in the line of fatalities in 2001, referring to the fateful day of September 11 with the terrorist attack against the twin towers. In the years that followed, it was possible to verify that there were fewer fatalities and injuries, including those of the above verified data, as well as fewer flights. Besides the number of flights, there was, after that day, a restructuring in flight and airport safety. From that day, more emphasis was given to security issues globally because it sounded an alert of the risk of new illicit events that were necessary for international organizations to adapt their regulatory framework according to the risks and the evolution of new technologies to protect civil aviation against these acts [26]. At that time, the first immediate measures to be taken were the entry of sharp materials in the List of Products Prohibited by ICAO and the need to implement more solid measures to enter the cabin doors [24]. Other measures were also taken over time. After September 11, we can observe a sharp decrease in the level of accidents with fatalities and injuries, which has been decreasing until today.

Accident Forecasting

The US aircraft fatalities and injuries forecast, observed (red), setting (blue), and forecast (green) (1980–2025) are shown in Figure 5.
According to the values observed in Figure 5, we verify that the fatalities are in the same line as in recent years. Likewise, regarding the wounded and the fatalities, the line is within the same values, with the slight difference that they are expected to decrease in the following years.
The number of injuries expected in the forecasts is higher than the actual values we could ascertain for 2022 in the ASN. However, concerning the number of fatalities, comparing the actual numbers with the numbers predicted by the chosen model, it is possible to verify that they are lower than expected, i.e., there were 50% fewer fatalities than predicted.

4.3. Flight Phases

It is possible to verify that, over the last 40 years, the flight phase in which there were more accidents (33%) was the landing phase. On the other hand, the phase with the fewest accidents (1%) is the aircraft pushback phase. The other three flight phases that stand out are en route, approach, and takeoff, as shown in Figure 6.

4.3.1. Ground Phase

The aircraft accidents on the ground represent the accidents in the following flight phases: standing, pushback, taxi, and maneuvering. This is the flight phase with the fewest fatalities and injuries because it happens even before the flight begins, and the percentage of accidents in these phases is 12%.
The number of accidents decreased between 1990 and 1992 and 2008 and 2010, but it is still possible to see that there has been a higher number of accidents from 2012 to 2018. However, there was a sharp decrease in 2019, and the accidents are still more severe than in other years.
The US aircraft prediction of accidents on the ground observed (red), setting (blue), and forecast (green) (1980–2025) are shown in Figure 7.
It is possible to observe the prediction of accidents on the ground in Figure 7, and it is possible to see that there is a tendency for accidents to remain constant in value between six accidents and eight accidents in the coming years, up to the point of 2022, where the ascertained values and the forecasted values are corresponding.

4.3.2. Takeoff and Initial Climb Phases

With regard to the accidents during takeoff and initial climb, it is possible to verify in Figure 6 that the evolution of accidents is not straightforward; it has significant variations over the years, with high accident peaks, as observed in 1984, and with low accident minimum peaks, as in the 2009. During the years of the global economic crisis, the values drop to the minimum in accidents, which is also reflected because the number of flights is lower due to a lack of demand.
The prediction of accidents in takeoff observed (red), setting (blue), and forecast (green) (1980–2025) are shown in Figure 8.
Upon analyzing the predicted values in Figure 8 for the coming years, the estimated values can already be examined with the already released data for the year 2022. Although the numbers are higher than those previously studied, the difference so far in the study is that the difference from the predicted value to the actual value is an additional two accidents.

4.3.3. En Route Phase

It is also possible to verify in other figures that the accidents at this stage have significant variations without a definite trend, with some well-known peaks, as the one in 2001 due to the terrorist attacks. We have other peaks, such as in 2016, 1992, and 1988. The en route phase of flight is a significant share of accidents; in-flight phases are also the accidents that cause the most fatalities when accidents occur.
The US accidents prediction en route observed (red), setting (blue), and forecast (green) (1980–2025) are shown in Figure 9.
In the coming years, there is expected to be a linear trend of new accidents along the same lines as the majority in recent years (between five and ten accidents). It is possible to verify in Figure 9 that in 2022, there were three accidents en route, that is, 50% less than expected. With this analysis, we can verify that we have been facing a recent decrease in the number of accidents en route.

4.3.4. Approach Phase

The accidents on the approach to the runway is one of the flight phases, with more accident cases at 17%. It is also one of the main phases after en route accidents with the highest fatalities. Although small, the trend of accidents in Figure 6 is a downward trend, even though it peaked in 2021.
The US accidents prediction on approach observed (red), setting (blue), and forecast (green) (1980–2025) are shown in Figure 10.
The prediction of runway approach accidents has a slight downward slope, as seen in Figure 10, but it predicts that in the next 5 years, there will be five approach accidents at most.
After the verification of Figure 10, it is possible to understand that the forecast and the available data are closely related. If the predictions are confirmed, we realize that in 5 years, the number of accidents in this phase will be even lower.

4.3.5. Landing Phase

The accidents on landing show that runway approach accidents have the highest percentage of cases among the other flight phases, with 33% of accidents in the last 40 years. On the other hand, it is the flight phase that is directly before the phase with the fewest fatalities; ground accident has a lower percentage of fatalities than runway approach accidents.
The prediction of US accidents on landing observed (red), setting (blue), and forecast (green) (1980–2025) are shown in Figure 11.
Figure 11 shows that a stabilization in the number of accidents predicted for the coming years is constant, between nine and thirteen accidents, with a tendency to decrease. A stagnation of accidents is observed in this phase.

4.4. Root Cause

Human errors are the largest share of the root causes of accidents. Several changes have been made at the technical level (better technologies) and the human level (CRM, human factors, among others) [15].
Despite all mitigating measures, 67% of accidents are still human reasons. Next, we have the technical errors that have also been mitigated with various technological advances.
The US accidents by root cause human error (blue), environment (red), technical (yellow), and sabotage (green) (1980–2020) are shown in Figure 12.

4.4.1. Human Error

In relation to the accidents due to human factors, it is possible to verify in Figure 12 that human errors are still the most significant cause of failure in civil aviation today. We have tended to a decrease in accidents, but these data and these values are still relatively high. In 2007, there was a peak in accidents due to this cause, with more than 30 accidents this year. The following year, there was a significant drop in accidents to less than 10 cases.
We used the correlation between the data of accidents due to human factors with the data of pilot and non-pilot professionals, attempting to determine if they were related.
The correlation between human factors and the number of professionals is presented in Table 1. In Table 1, it is stated that the two factors are negatively correlated: when there is an increase in professionals involved in flight activities, the number of accidents is lower.
The US accidents prediction due to human factors observed (red), setting (blue), and forecast (green) (1980–2025) are shown in Figure 13.
Predicting accidents with a human error factor for the next few years results in the same values we have ultimately had. In Figure 13, we have the predicted values that show that in the next few years, they will remain the same and then rise again.

4.4.2. Environment

It is possible to observe the accidents caused by environmental factors. In these accidents, in which the environment is the determining factor, we know that the expression of accidents with this type of cause is very low; most of these accidents are bird strikes (entry of a bird in the engines) and others by reduced visibility or winds at the time of landing or takeoff. The expression is 7% of global accidents in the last 40 years; we also know that it has a low relation with injuries and fatalities.
The US accidents prediction due to environmental factors observed (red), setting (blue), and forecast (green) (1980–2025) are shown in Figure 14.
Figure 14 represents the forecast for the coming years, which predicts that accidents with an environmental root cause will remain at a level between three and two accidents per year.

4.4.3. Technical

According to ICAO Annex 19, in 1945, accidents for technical reasons were higher [27,28]. Over the years, technological developments have been made to combat technical and human error problems to mitigate accidents and ensure safety, procedures, and certifications. Numerous technologies have emerged to operate with as little risk as possible. In recent times, significant improvements have not yet reached zero accidents as the root cause. From Figure 12, it is possible to verify that the accident interval is between two and six per year, with some years in which the values were higher, followed by years in which there were no more than two accidents for this cause.
The US accidents prediction due to technical factors observed (red), setting (blue) and forecast (green) (1980–2025) are shown in Figure 15.
The forecasts for the next few years are that the number of accidents will remain in the same range as in recent years, as seen in Figure 15.

4.4.4. Sabotage

Accidents due to airplane sabotage factors have occurred over the years. Because of this, the security conditions on board and at airports needed to be increasingly tighter so that it was increasingly difficult for passengers to sabotage and cause accidents on board airplanes.
From Figure 12, it is possible to see that over the years, there has been a very sharp decrease in air accidents due to sabotage; we know that in 2001 we had several accidents on the same day, September 11, with several planes being hijacked by terrorists and hence the peak in the graph. We can also see that after that accident, many things changed in aviation safety and its importance. It is also possible to verify that no sabotages have occurred since 2010.
The sabotage accident prediction observed (red), setting (blue), and forecast (green) (1980–2025) are shown in Figure 16.
In Figure 16, the accident forecasts for the coming years show a decreasing trend with up to no accidents; in this case, we know that these values correspond to zero accidents in the coming years, knowing that they are only predicted. For example, in 2022, according to predicted values, there were no accidents due to sabotage.

4.5. Flight Cycle

The flight departures from the US obtained from the Data World Bank [25], and how the flight cycles correlate with economic growth were studied.
The US flight cycles (1980–2020) [29] are shown in Figure 17.
The correlation between flight cycle and GDP growth (Table 1) and the correlation between flight cycle and inflation (Table 1) were studied. It can be seen from the above figure that GDP growth and flight cycles are uncorrelated; however, inflation and the number of departures are highly negatively correlated. That is, we can see that the number of flights decreases when inflation rises.
Table 2 presents an intriguing analysis of accident trends in the United States airspace from 1980 to 2021. The data reveal some fascinating insights into the frequency and nature of these incidents. On average, there were 32 accidents during this period, each presenting its unique circumstances and consequences. Upon further analysis, we find that, out of these accidents, an average of four occurred on the ground, while six took place during takeoff. Similarly, during the route and approach phases, the average number of accidents remained consistent at six. However, the most notable observation arises when we examine the landing phase, which recorded an average of 10 accidents—a relatively higher figure compared to other phases. On average, there were 89 victims associated with these accidents, with an average of 59 injuries. It is essential to note that these values display considerable variability over the 40-year period, as indicated by the respective standard deviation values. This fluctuation emphasizes the complex and dynamic nature of aviation safety. By examining the causes of these accidents, human factors emerged as the leading contributor, accounting for an average of 21 incidents. Environmental factors and technical issues followed, with averages of two and six accidents, respectively. Surprisingly, sabotage accounted for an average of only one accident, revealing the rare occurrence of intentional acts within the aviation domain. By delving deeper into the data, the calculation of the second quartile reinforces the trends observed in most variables studied. In general, there are close values between the average and the second quartile, signifying a consistent pattern over the years. However, when examining the variables “Number of victims” and “Number of injuries”, a deviation from this trend is evident. In 50% of the years analyzed, the number of fatalities did not exceed 45, while the number of injuries remained below 29. This comprehensive analysis provides crucial insights into the accident patterns and consequences within the United States airspace over a substantial period. By understanding these trends, we can pave the way for enhanced safety measures and interventions, aiming to mitigate risks and ensure a safer aviation landscape for all stakeholders involved. The authors in [30] have also explored the potential of probabilistic and statistical analysis tools, specifically ARIMA models, in enhancing aviation safety levels. By organizing available accident data probabilistically and conducting time series analyses, the researchers were able to forecast future values and trends in the European territory, reaching results. The insights gained from this study can be utilized by various aviation entities for proactive accident prevention, particularly in identifying key operational risk areas.

5. Conclusions

As it was possible to ascertain in the statistical analyses, the trend of air accidents has had a downward slope over the years, primarily due to the increasing attention on safety in the aviation sector. This is because safety is currently one of the main concerns of the sector, because whenever there is an air accident, the whole industry might suffer from it due to a lack of confidence from the passengers. Therefore, over the years preceding the global crisis, there has been a decrease in accidents, but there is also a decrease in passengers carried due to a lack of demand. After observing this fact, a correlation was made between accidents and the growth of the gross domestic product and inflation, and it was possible to conclude that both are correlated with accidents in different ways; we know that there is a positive correlation with the GDP (that is, when one rises, the other also rises, and vice versa) and a negative correlation with inflation. Thus, when there is higher inflation, the number of accidents can be expected to decrease. It is also noteworthy that, after the fateful day of 11 September 2001, there was a decrease in air accidents, much due to the security measures imposed after the event.
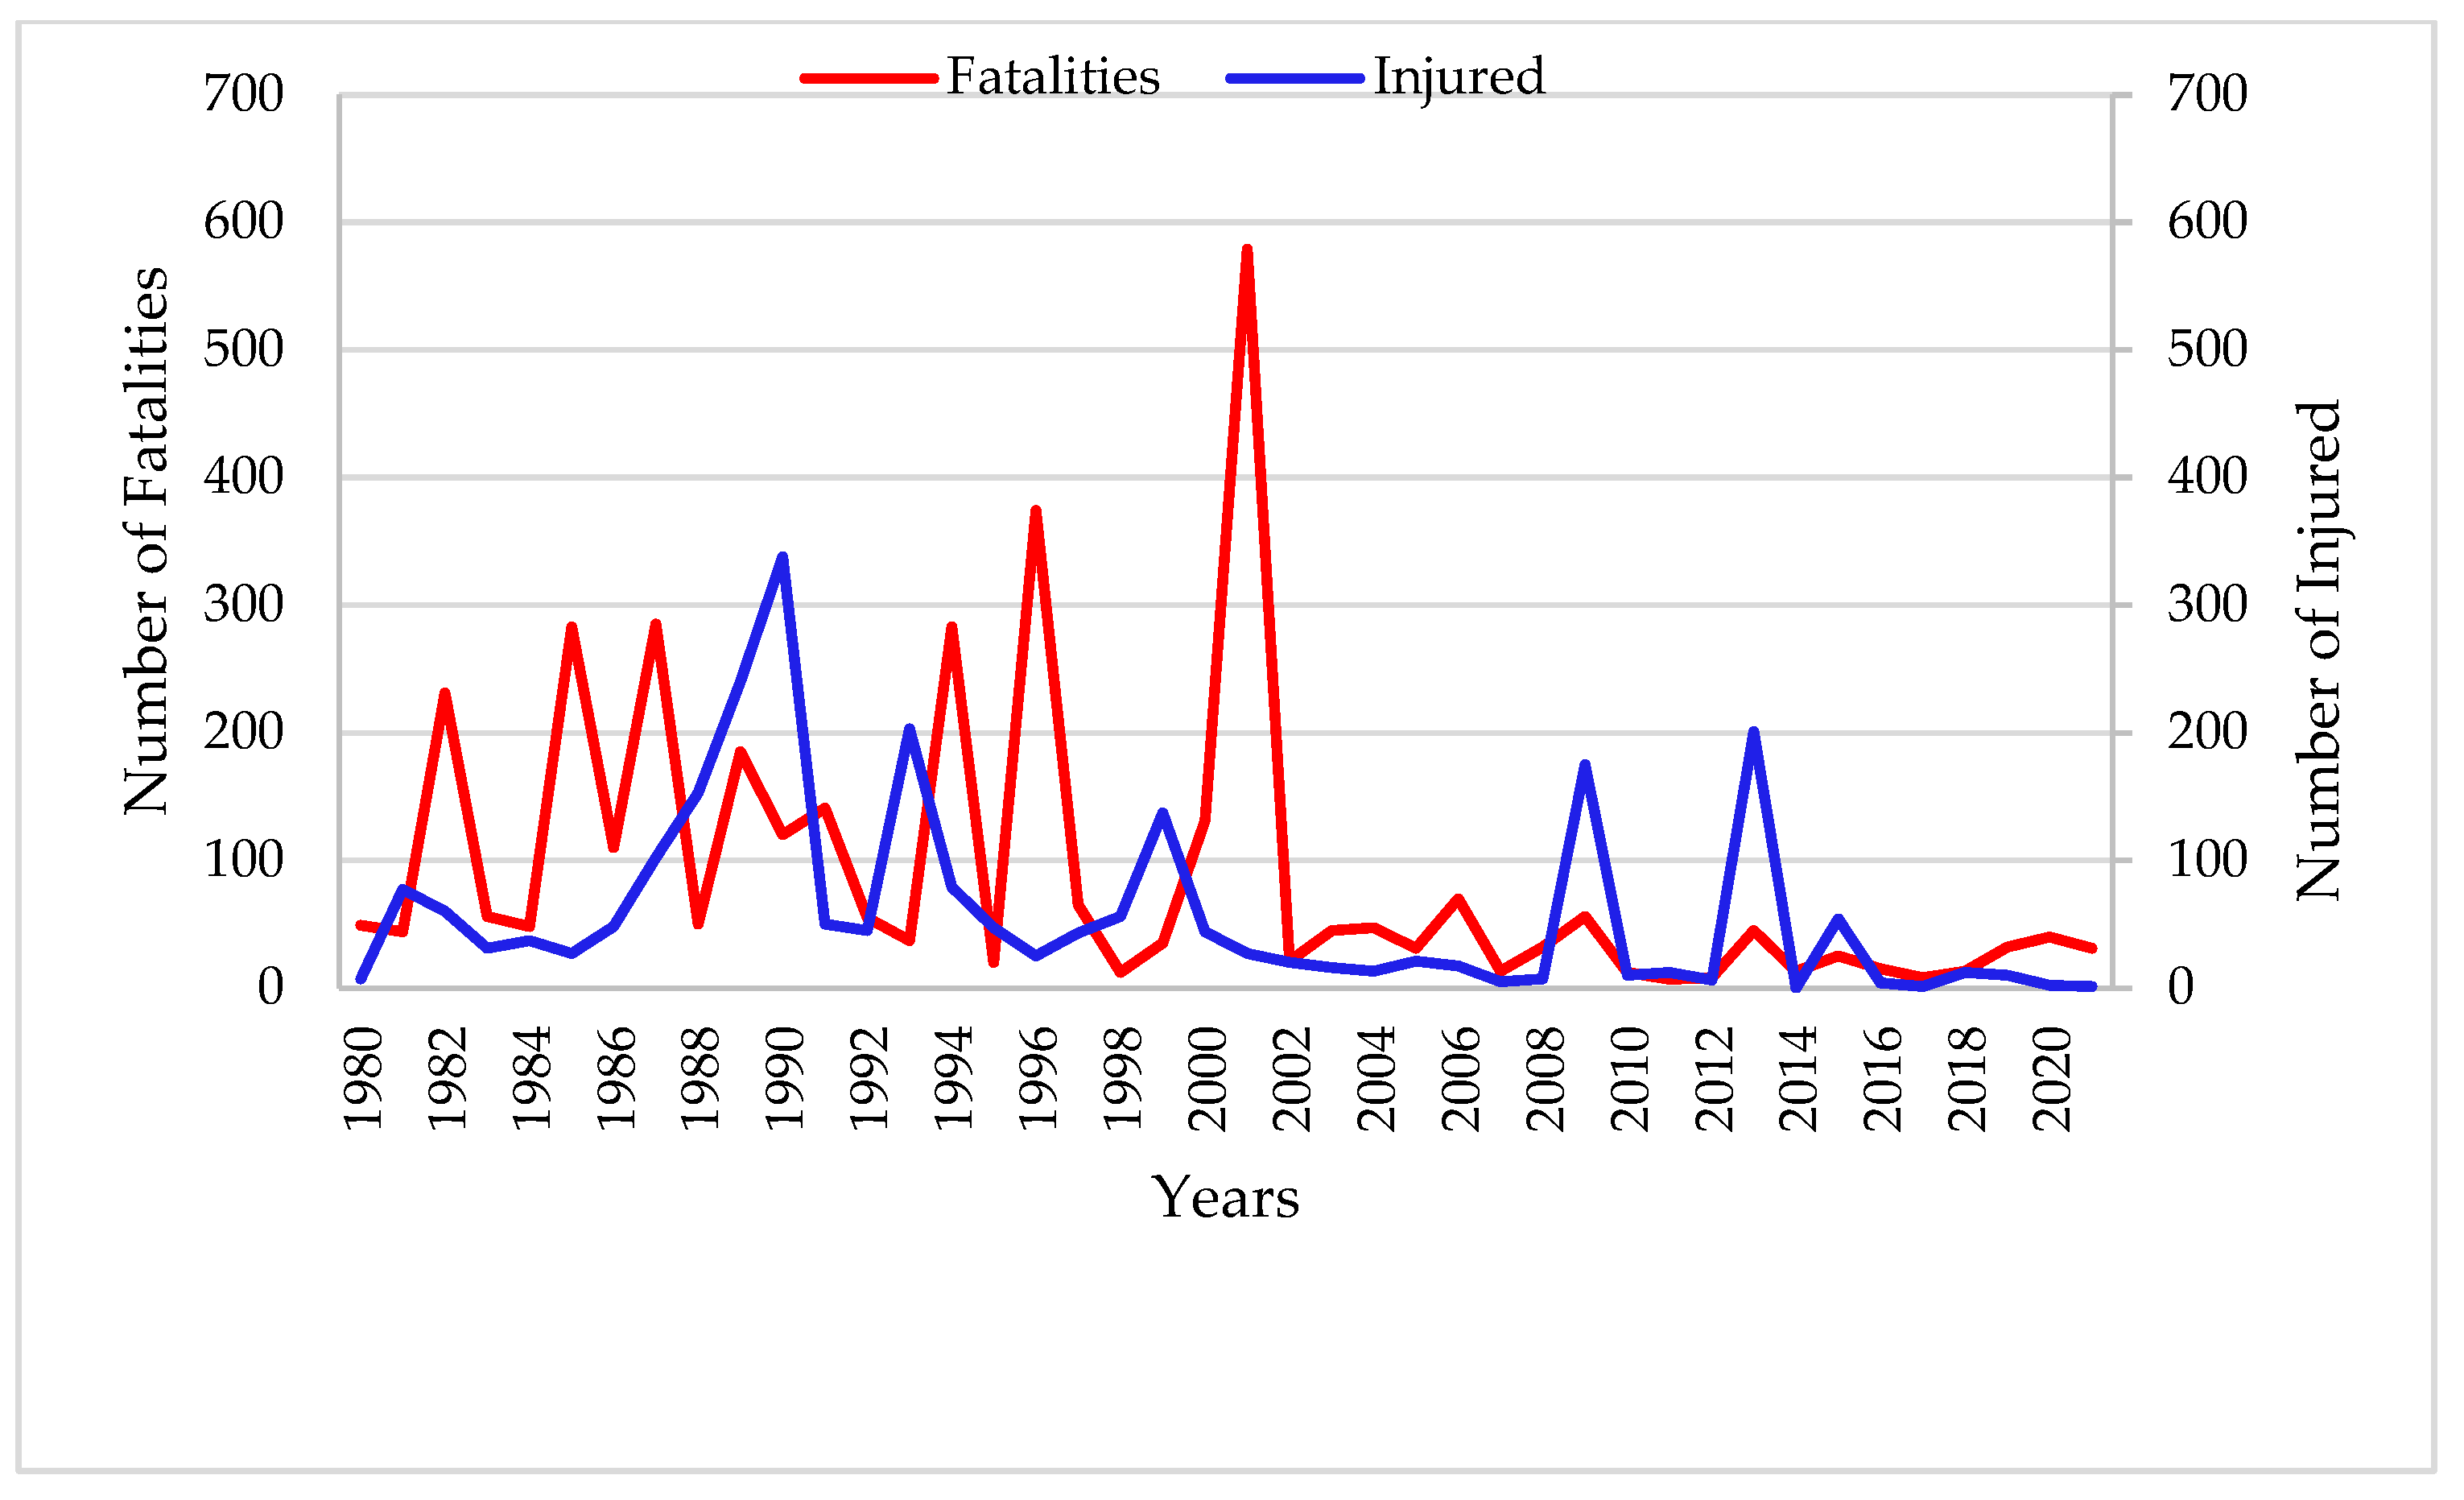
Since it has become imperative that safety should be seen as a priority, the number of casualties has tended to decrease as several efforts have been made to mitigate accidents to make the industry more appealing and trustworthy in the view of the population. As a result, the forecast for the coming years indicates a downward trend in fatalities while there is stagnation in the number of injuries.
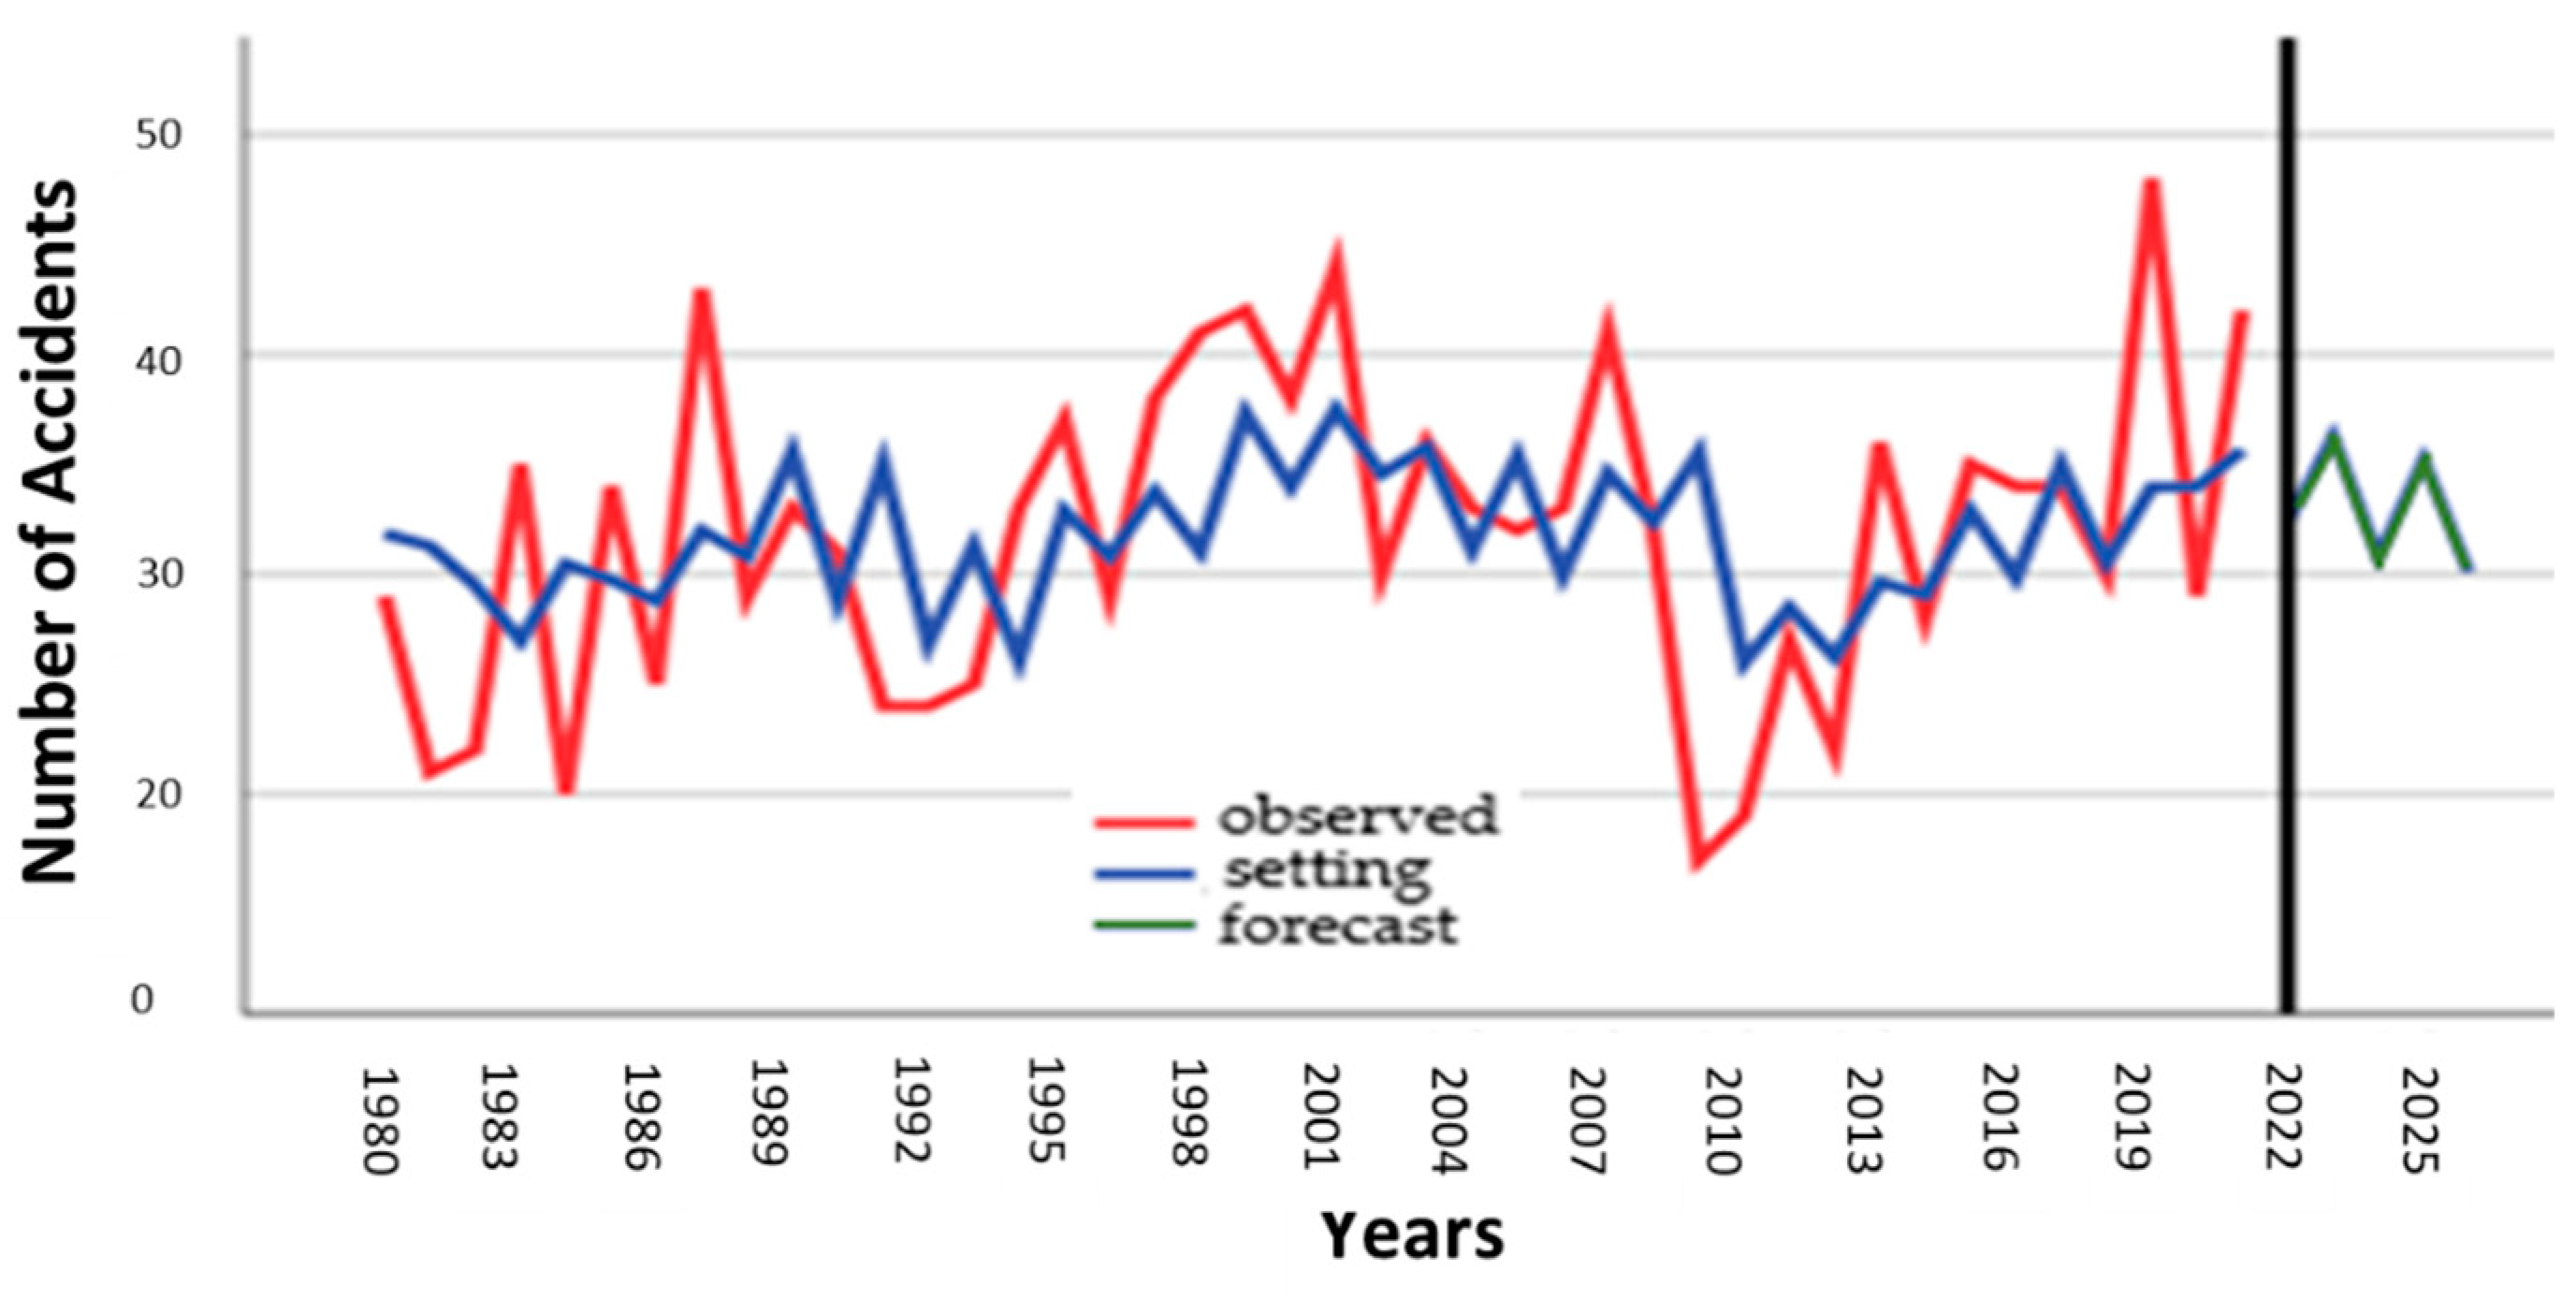
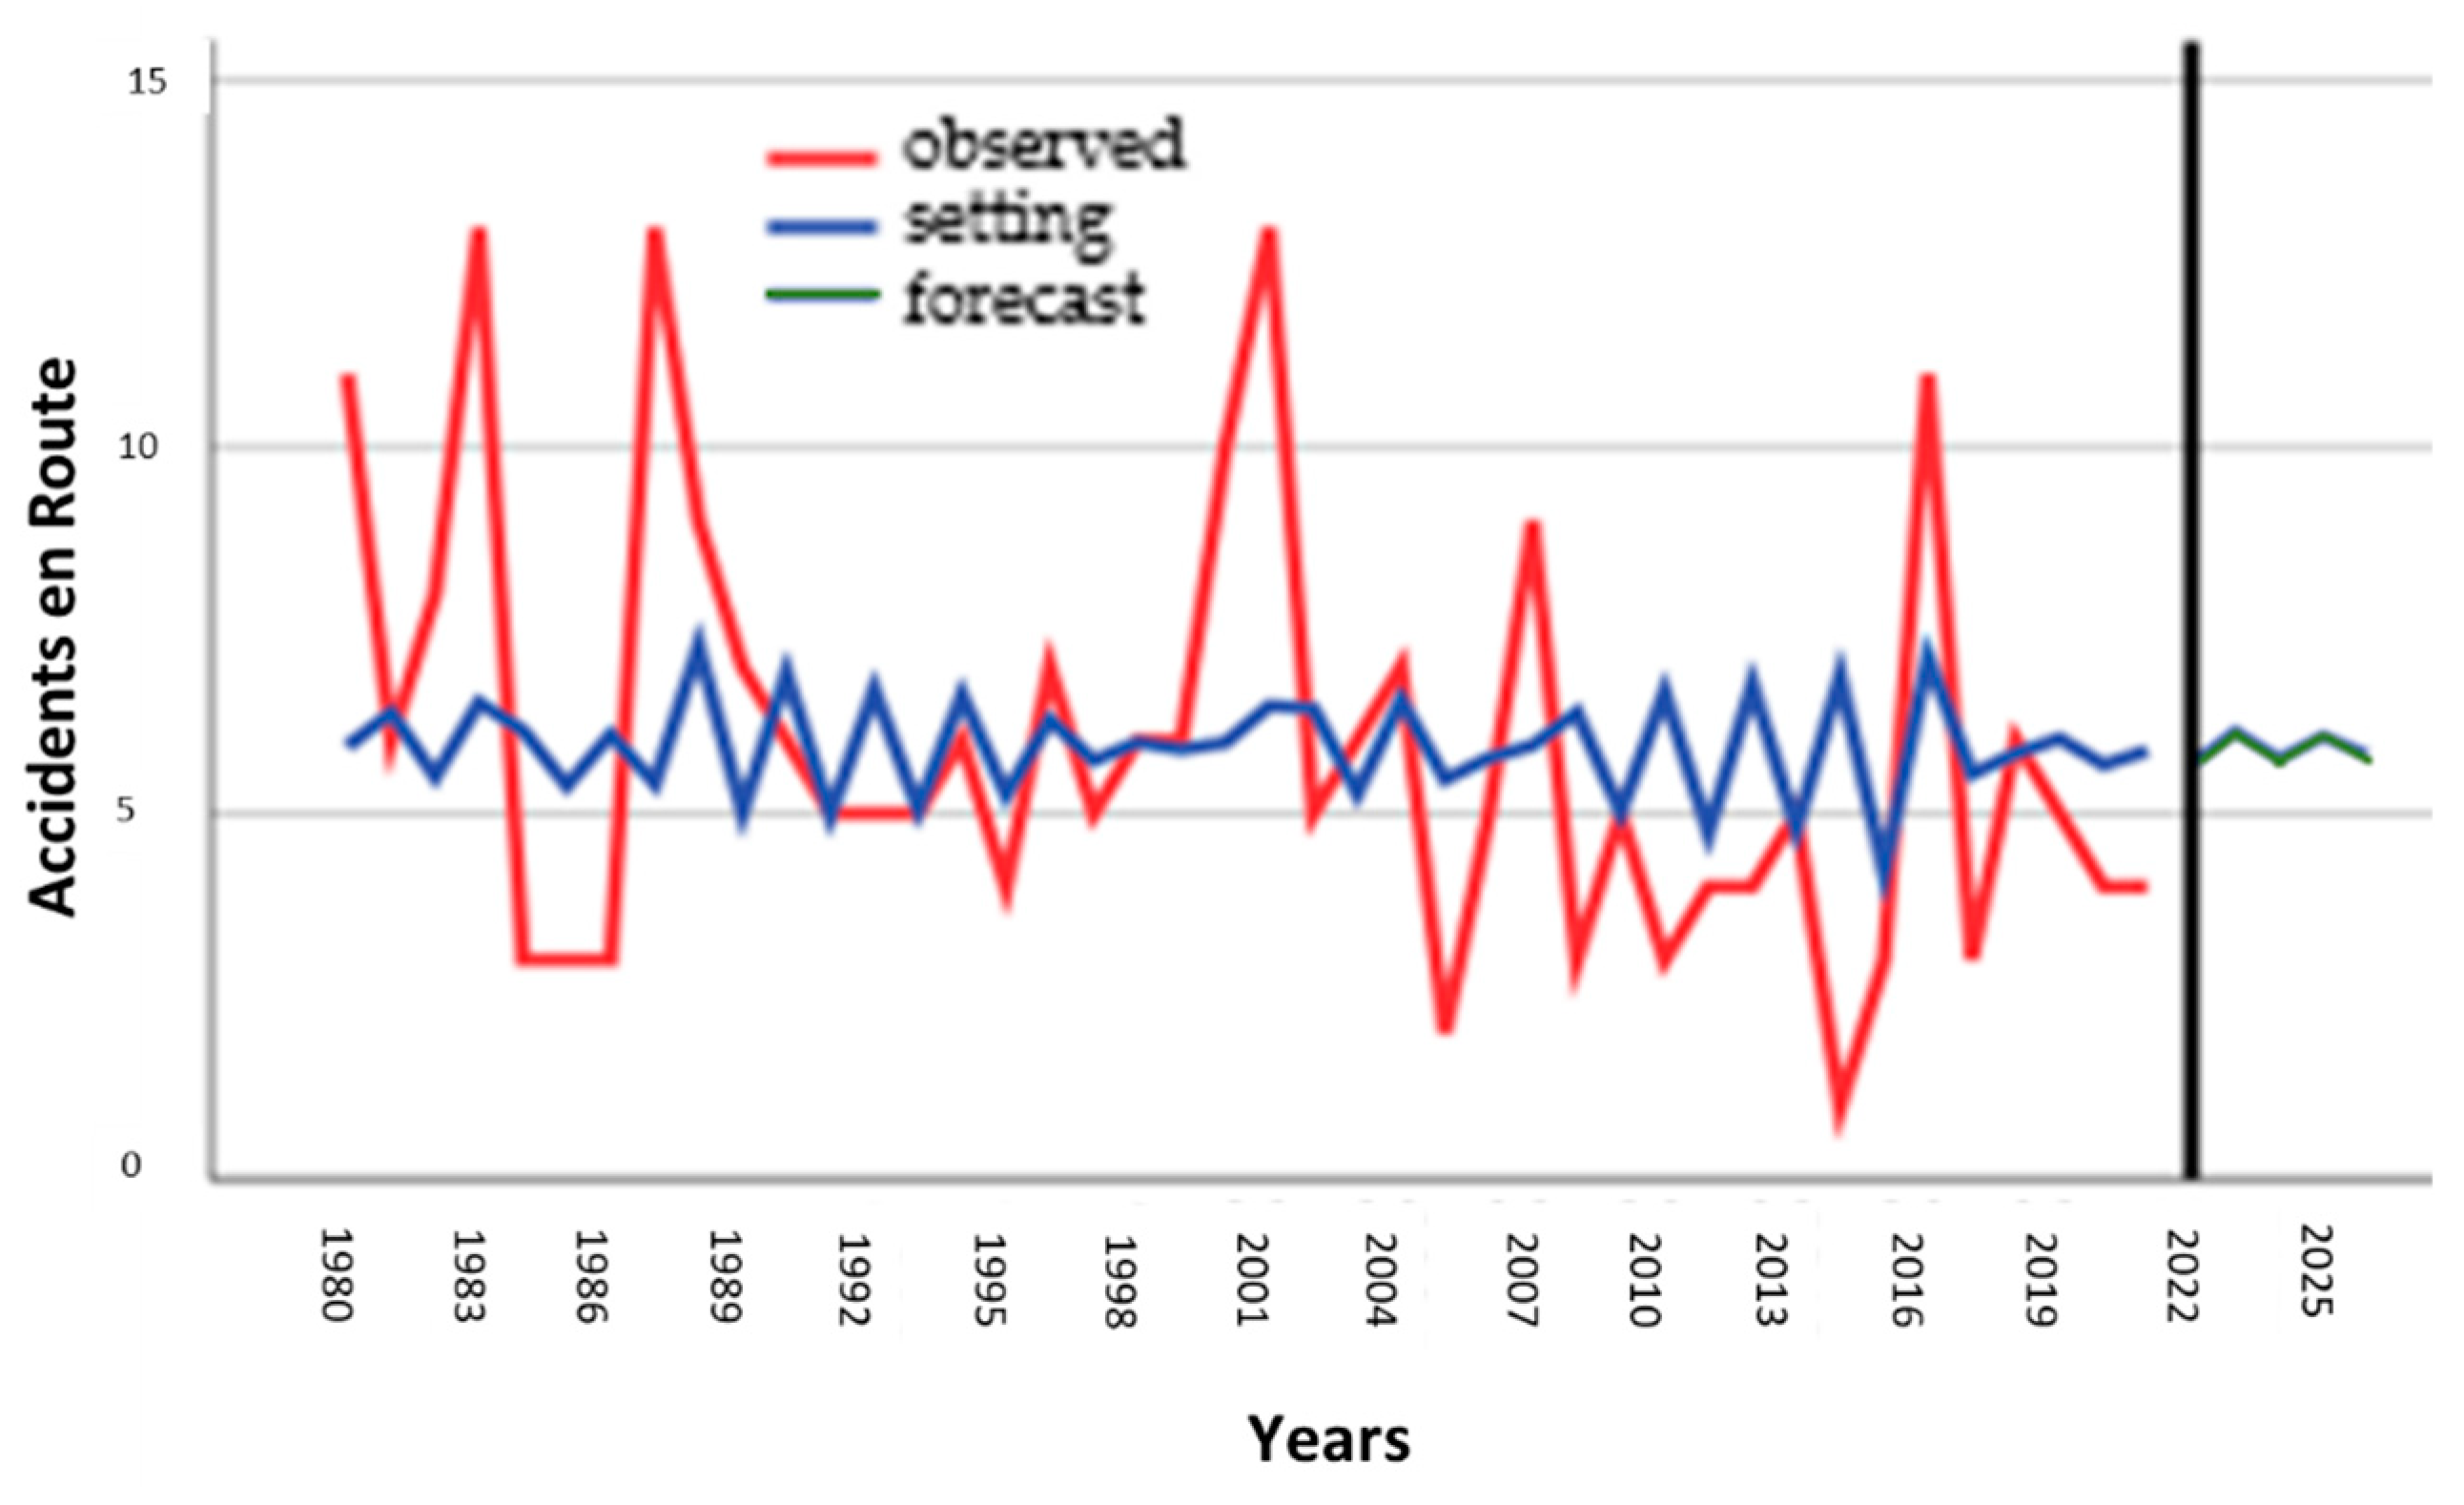
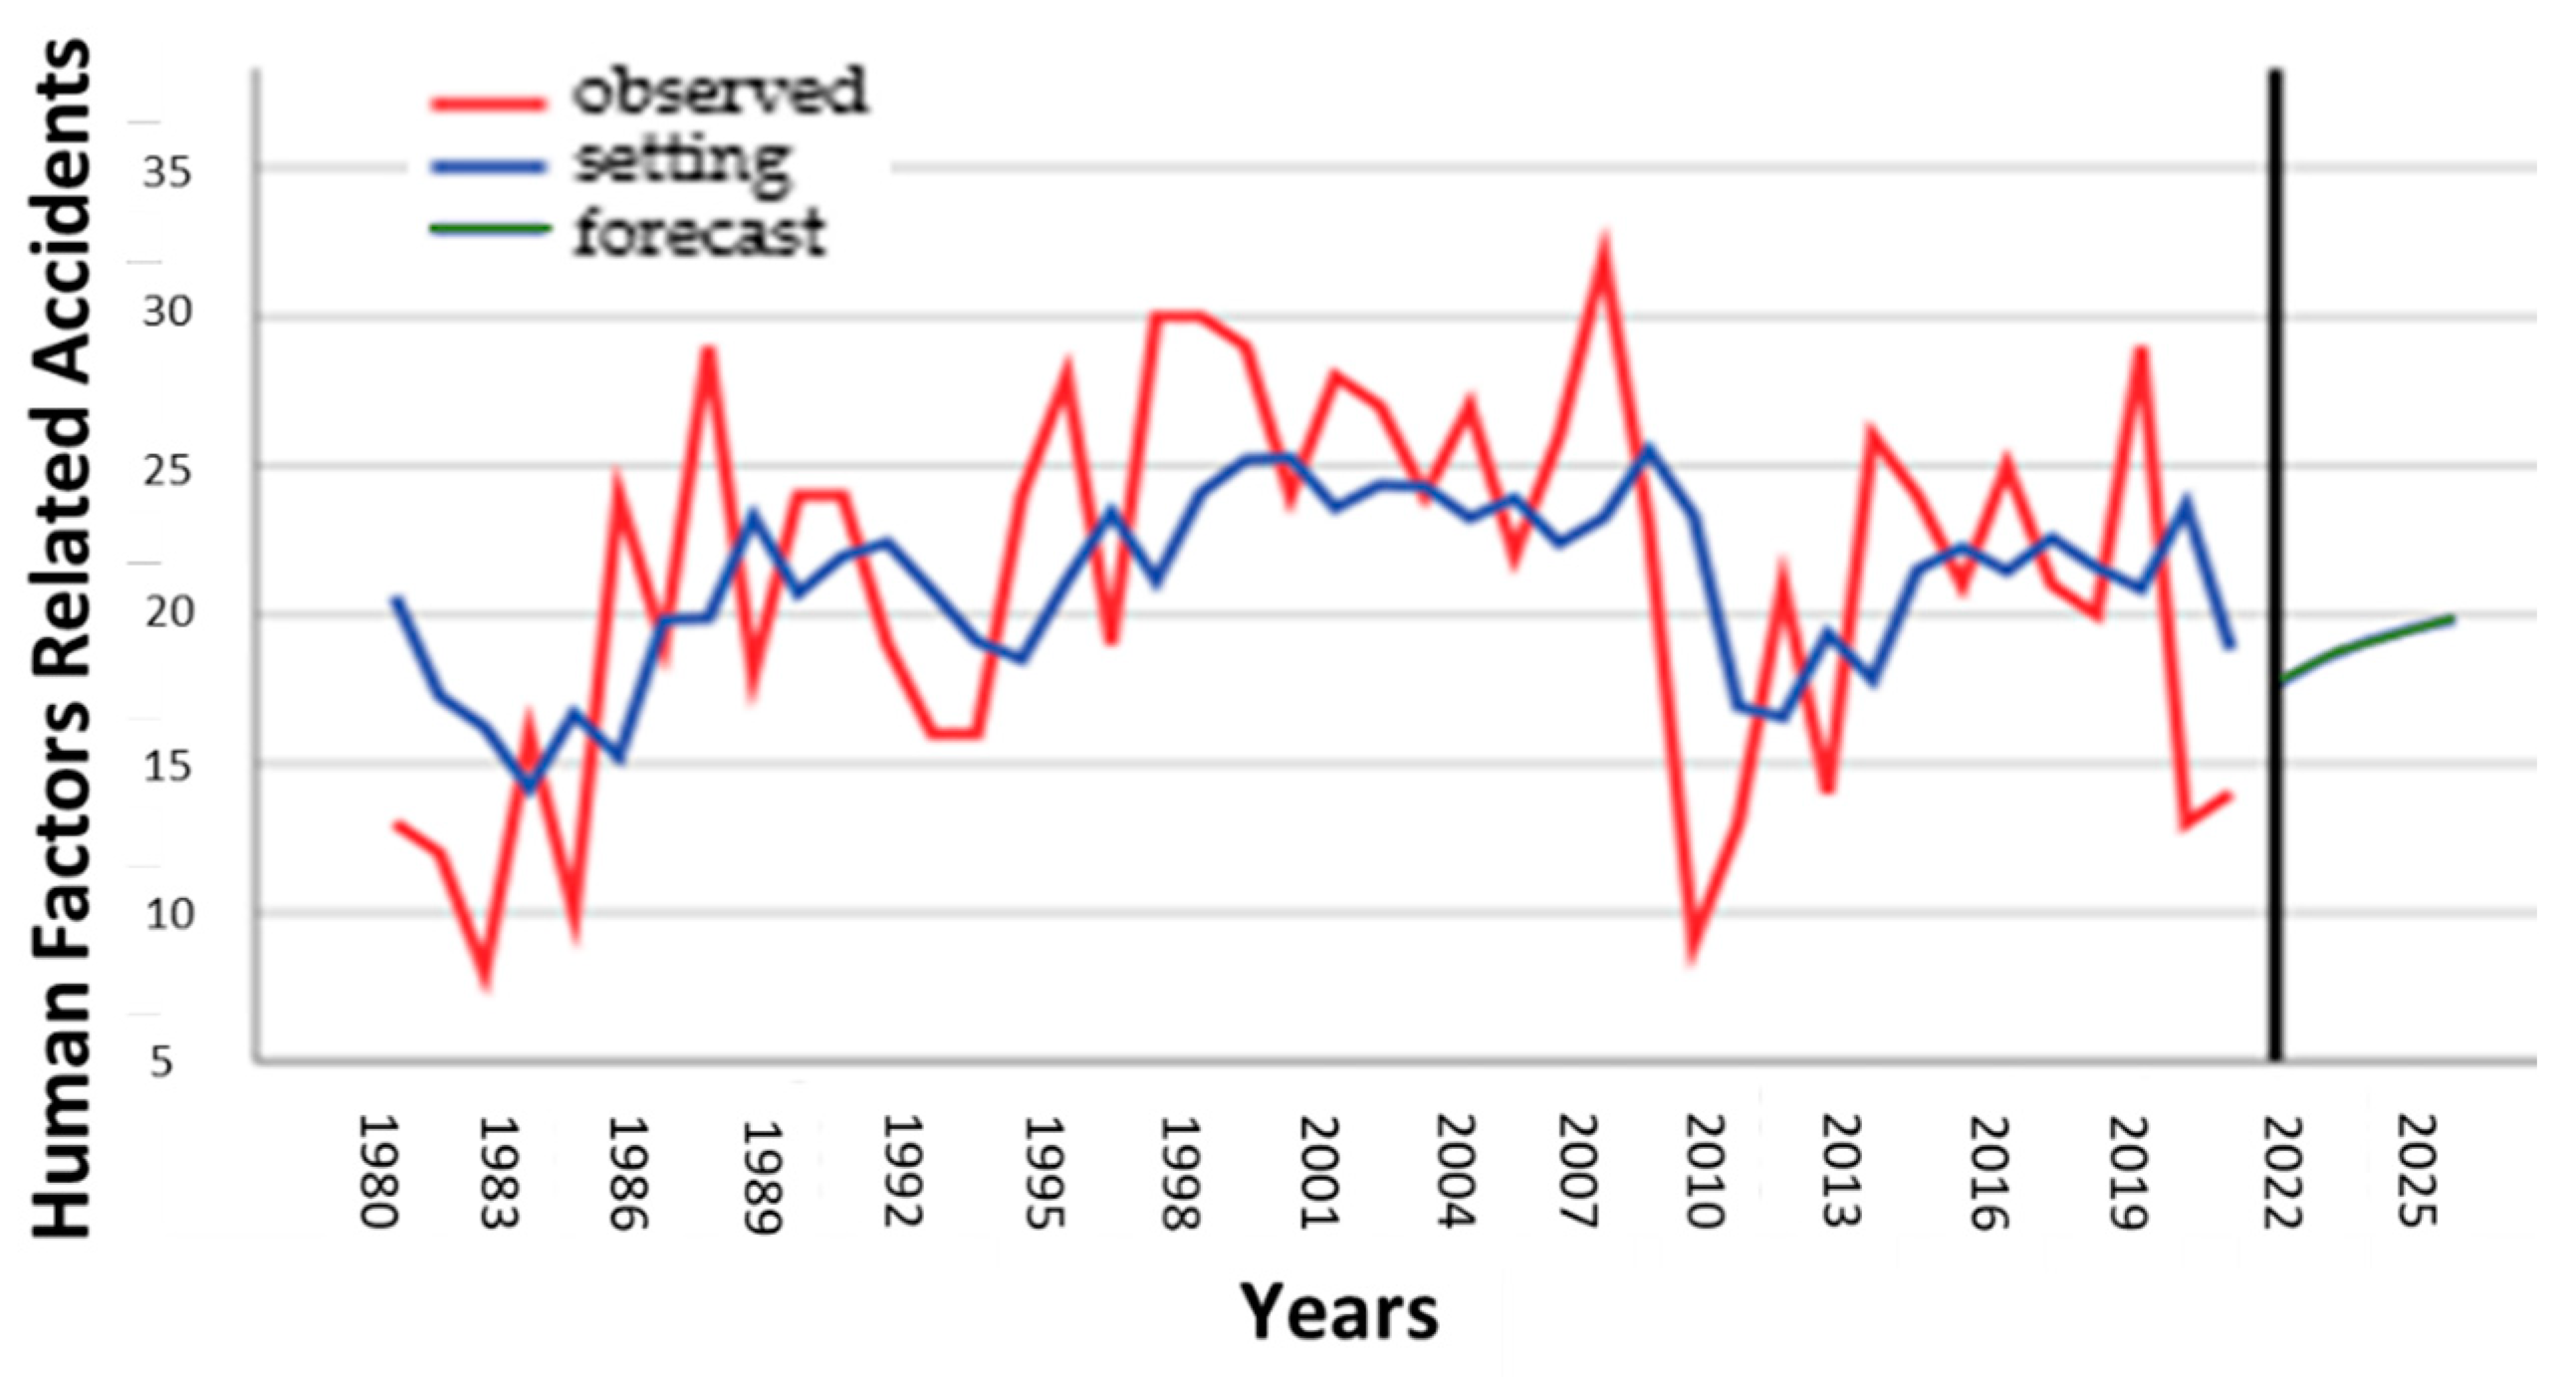
During the operation of an aircraft, there are flight phases that are more prone to accidents than others; as verified, it is on land that there are more accidents; however, it is during the route and approach that there are more fatalities, and in the landing phase that there are more injuries. In all phases of flight, the leading cause of accidents is human error; on the other hand, sabotage is the cause with the least expression in the causes of accidents. Therefore, it is possible to verify that sabotage occurs mainly during flight, and technical failures happen mostly during landing and during the flight.
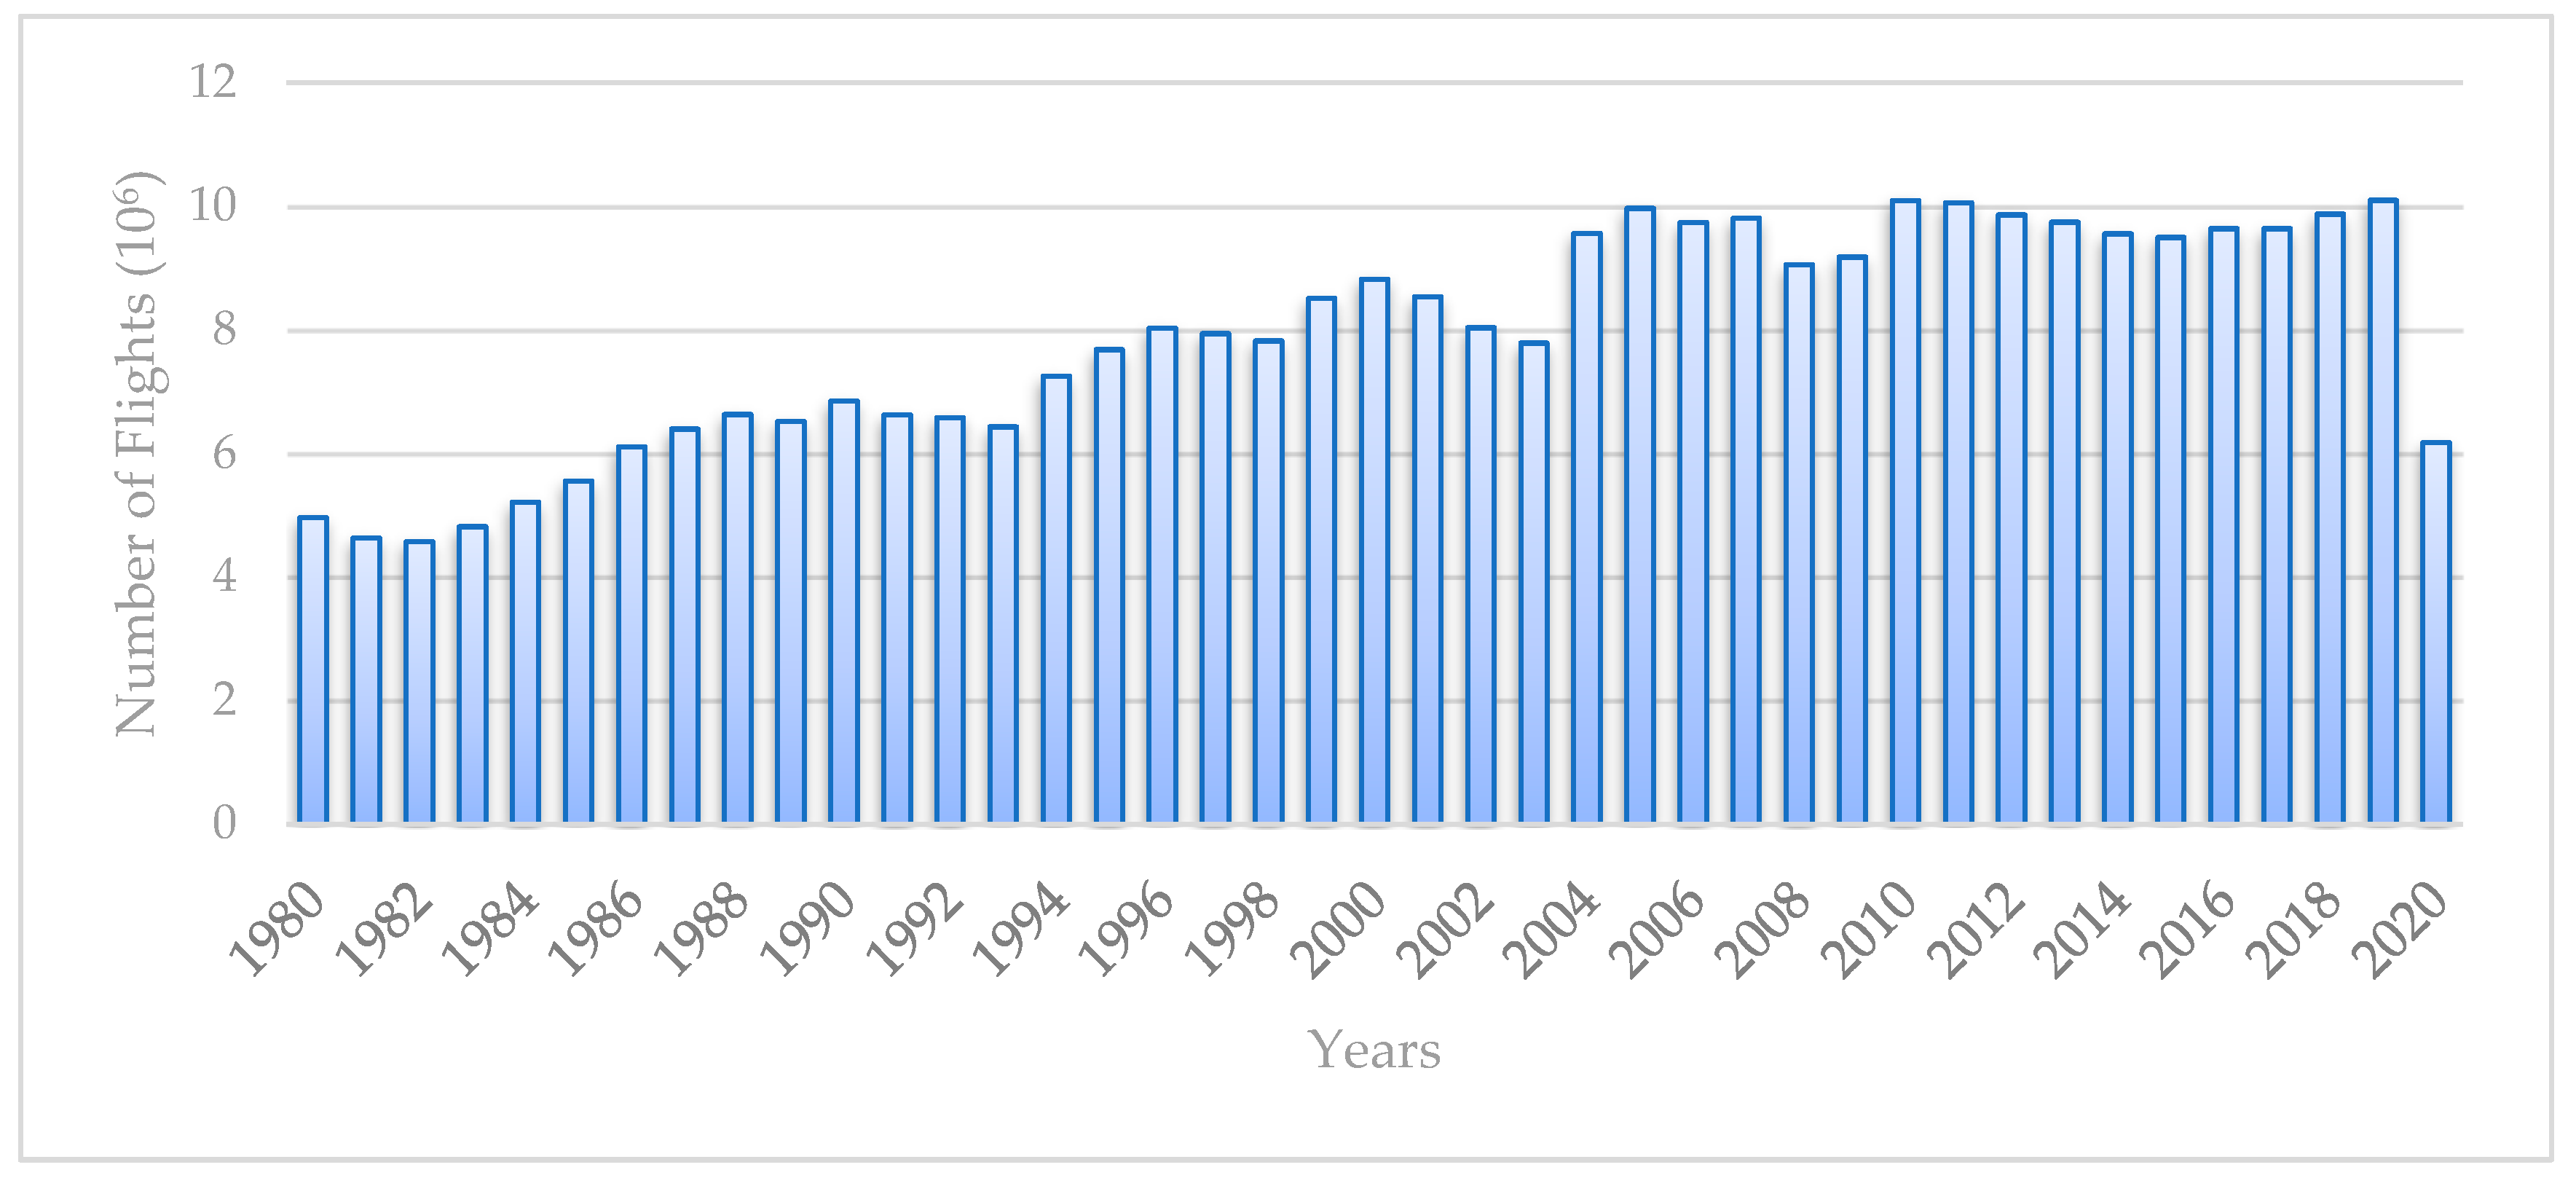
Human error is the most significant root cause of air accidents, with a percentage of 67%; it was possible to correlate human error with the existing human resources in the asset in order to verify if both could be linked, mainly because from the analysis, it was possible to conclude that they are strongly negatively correlated, and that when there are more professionals in the operations of a flight, there are fewer accidents. Human error has a decreasing trend, as do technical failures; however, in addition to comprising the most significant cause of accidents, human error is still the largest cause of injuries and fatalities, with the least cause being sabotage. Cases of sabotage are now zero and are expected to remain zero in the coming years; there is also a great deal of control onboard aircraft and at airports, so it is increasingly difficult to carry out an unlawful act. In the generality of flights in the United States, there are stagnant periods, as it was possible to ascertain during global or airline security crises. These were determined to be strongly negatively correlated with inflation and the number of flights (i.e., when inflation rises, the number of flights decreases) as whenever inflation increases, it means a loss of purchasing power for families; therefore, it is possible to verify that inflation directly affects the aviation industry.

Author Contributions

Conceptualization, J.S. and L.F.F.M.S.; methodology, J.S. and L.F.F.M.S.; software, J.S. and A.B.; validation, R.M., D.V. and L.F.F.M.S.; investigation, J.S.; resources, J.S.; data curation, J.S. and A.B.; writing—original draft preparation, J.S.; writing—review and editing, L.F.F.M.S., A.B., R.M. and D.V.; visualization, R.M. and D.V.; supervision, L.F.F.M.S. and R.M.; project administration, D.V.; funding acquisition, R.M. All authors have read and agreed to the published version of the manuscript.

Funding

This research received no external funding.

Institutional Review Board Statement

Not applicable.

Informed Consent Statement

Not applicable.

Data Availability Statement

Not applicable.

Acknowledgments

The authors would like to acknowledge Harro Ranter for kindly providing access to the Aviation Safety Network (ASN) Database for this research. This work was supported by: the Foundation for Science and Technology—FCT, through IDMEC, under LAETA, project UIDB/50022/2020. This work was also supported by: the Foundation for Science and Technology—FCT, through AEROG of the Laboratório Associado em Energia, Transportes e Aeronáutica (LAETA), under LAETA, project UIDB/50022/2020; UIDP/50022/2020, project LA/P/0079/2020.

Conflicts of Interest

The authors declare no conflict of interest.

References

  1. Nogueira, R.P.R.; Melicio, R.; Valério, D.; Santos, L.F.F.M. Learning methods and predictive modeling to identify failure by human factors in the aviation industry. Appl. Sci. 2023, 13, 4069. [Google Scholar] [CrossRef]
  2. Santos, L.F.; Melicio, R. Stress, pressure and fatigue on aircraft maintenance personal. Int. Rev. Aerosp. Eng. 2019, 12, 35–45. [Google Scholar] [CrossRef]
  3. Le Coze, J.C. Safety Science Research: Evolution, Challenges and New Directions, 1st ed.; CRC Press: Boca Raton, FL, USA, 2019. [Google Scholar] [CrossRef]
  4. Spence, B.; Richard, F.; Chien, L.; Stewart, S. International standardization compliance in aviation. J. Air Transp. Manag. 2015, 49, 1–8. [Google Scholar] [CrossRef] [Green Version]
  5. Silva, M.; Santos, L.F.F.M.; Melicio, R.; Valério, D.; Rocha, R.; Barqueira, A.; Brito, E. Aviation’s approach towards pilots’ mental health: A review. Int. Rev. Aerosp. Eng. 2022, 15, 294–307. [Google Scholar] [CrossRef]
  6. Milan, J. An assessment of risk and safety in civil aviation. J. Air Transp. Manag. 2000, 6, 43–50. [Google Scholar] [CrossRef]
  7. Ni, X.; Huawei, W.; Changchang, C.; Jiyu, H.; Zhongdong, S. Civil aviation safety evaluation based on deep belief network and principal component analysis. Saf. Sci. 2019, 112, 90–95. [Google Scholar] [CrossRef]
  8. Kelly, D.; Marina, E. An analysis of human factors in fifty controlled flight into terrain aviation accidents from 2007 to 2017. Saf. Res. 2019, 69, 155–165. [Google Scholar] [CrossRef]
  9. McClumpha, J.; James, M.; Green, G.; Belyavin, J.P. Attitudes to cockpit automation. In Proceedings of the 1991 Human Factors Society Annual Meeting, San Francisco, CA, USA, 2–6 September 1991; Volume 35, pp. 107–111. [Google Scholar] [CrossRef]
  10. EASA. Regulations Portal; European Union Aviation Safety Agency: Cologne, Germany. Available online: https://www.easa.europa.eu/en/regulations (accessed on 2 May 2023).
  11. Harris, D. The Human factors that relate to technological developments in aviation. In Innovation in Aeronautics; Young, T.M., Hirst, M., Eds.; Woodhead Publishing: Sawston, UK, 2012; pp. 132–154. [Google Scholar] [CrossRef]
  12. Muñoz-Marrón, D. Human factors in aviation: CRM (crew resource management). Psychol. Pap. 2018, 39, 190–202. Available online: https://www.redalyc.org/journal/778/77857281007/77857281007.pdf (accessed on 13 April 2023).
  13. Myers, L. Commercial aircraft electronic checklists: Benefits and challenges (literature review). Int. J. Aviat. Aeronaut. Aerosp. 2016, 3, 1–11. [Google Scholar] [CrossRef] [Green Version]
  14. Degani, A.; Wiener, L. Cockpit checklists: Concepts, design, and use. Hum. Factors 1993, 35, 345–359. [Google Scholar] [CrossRef] [Green Version]
  15. Dias, N.G.; Santos, L.F.; Melicio, R. Aircraft maintenance professionals: Stress, pressure and fatigue. In Proceedings of the 9th EASN International Conference on Innovation in Aviation and Space, Athens, Greece, 3–6 September 2019; Volume 304, pp. 1–7. [Google Scholar]
  16. Yeun, R.; Bates, P.; Murray, P. Aviation safety management systems. World Rev. Intermodal Transp. Res. 2014, 5, 168–196. [Google Scholar] [CrossRef] [Green Version]
  17. Fultz, J.; Walker, S. Fatal weather-related general aviation accidents in the United States. Phys. Geogr. 2016, 37, 291–312. [Google Scholar] [CrossRef] [Green Version]
  18. Madeira, T.; Melicio, R.; Valério, D.; Santos, L. Machine learning and natural language processing for prediction of human factors in aviation incident reports. Aerospace 2021, 8, 47. [Google Scholar] [CrossRef]
  19. Flight Safety Foundation. 2021 Safety Report Flight Safety Foundation: Alexandria, United States of America. Available online: https://aviation-safety.net/database/ (accessed on 2 May 2023).
  20. Das, K.P.; Asim, K.D. Quantifying the risk of extreme aviation accidents. Phys. A Stat. Mech. Its Appl. 2016, 463, 345–355. [Google Scholar]
  21. Ranter, H.; Lujan, F.I. Aviation Safety Network database 2016. Available online: https://aviation-safety.net/about/ (accessed on 10 February 2023).
  22. Šverko, Z.; Vrankić, M.; Vlahinić, S.; Rogelj, P. Complex Pearson correlation coefficient for EEG connectivity analysis. Sensors 2022, 22, 1477. [Google Scholar] [CrossRef] [PubMed]
  23. Tang, X.; Deng, G. Prediction of civil aviation passenger transportation based on ARIMA model. Open J. Stat. 2016, 6, 824–834. [Google Scholar] [CrossRef] [Green Version]
  24. Kanavos, A.; Kounelis, F.; Iliadis, L.; Makris, C. Deep learning models for forecasting aviation demand time series. Neural Comput. Appl. 2021, 33, 16329–16343. [Google Scholar] [CrossRef]
  25. World Data Bank. United States America GDP. 2021. Available online: https://data.worldbank.org/indicator/NY.GDP.MKTP.CD (accessed on 13 April 2023).
  26. World Data Bank. United States of America Inflation. 2021. Available online: https://data.worldbank.org/indicator/FP.CPI.TOTL.ZG (accessed on 13 April 2023).
  27. Cherniavsky, E.; Gentry, J.; Gordon, L.; Moreno-Hines, F. The impact of September 11, 2001 on United States Aviation. Air Traffic Control Q. 2003, 11, 1–20. [Google Scholar] [CrossRef]
  28. Gonçalves, S.; Santos, L.F.F.M.; Valério, D.; Melicio, R.; Barqueira, A.; Reis, P. Case study of 9/11 vs. COVID-19 and their impact in the number of flights and passengers. In Proceedings of the 12th EASN International Conference on Innovation in Aviation & Space for Opening New Horizons (EASN), Barcelona, Spain, 18–21 October 2022. [Google Scholar]
  29. ICAO. Annex 19 ‘Safety Management System’, 2nd ed.; International Civil Aviation Organization: Montreal, QC, Canada, 2016. [Google Scholar]
  30. Amaral, Y.; Santos, L.F.F.M.; Valério, D.; Melicio, R.; Barqueira, A. Probabilistic and statistical analysis of aviation accidents. J. Phys. Conf. Ser. 2023, 2526, 012107. [Google Scholar] [CrossRef]
Figure 3. US evolution of the accidents through time.
Applsci 13 07997 g003
Figure 4. US aircraft accident victims by year, fatalities (red), and injuries (blue) (1980–2020).
Applsci 13 07997 g004
Figure 5. US aircraft fatalities and injuries forecast, observed (red), setting (blue), and forecast (green) (1980–2025).
Applsci 13 07997 g005
Figure 6. US accidents by flight phases (1980–2020).
Applsci 13 07997 g006
Figure 7. US aircraft prediction of accidents on the ground forecast, observed (red), setting (blue), and forecast (green) (1980–2025).
Applsci 13 07997 g007
Figure 8. US aircraft accidents prediction in takeoff, observed (red), setting (blue), and forecast (green) (1980–2025).
Applsci 13 07997 g008
Figure 9. US aircraft accidents prediction en route, observed (red), setting (blue), and forecast (green) (1980–2025).
Applsci 13 07997 g009
Figure 10. US aircraft accidents prediction on approach, observed (red), setting (blue), and forecast (green) (1980–2025).
Applsci 13 07997 g010
Figure 11. US aircraft accidents prediction on landing, observed (red), setting (blue), and forecast (green) (1980–2025).
Applsci 13 07997 g011
Figure 12. US accidents by root cause human error (blue), environment (red), technical (yellow), and sabotage (green) (1980–2020).
Applsci 13 07997 g012
Figure 13. US accidents prediction due to human factors, observed (red), setting (blue), and forecast (green) (1980–2025).
Applsci 13 07997 g013
Figure 14. US accidents prediction due to environmental factors, observed (red), setting (blue), and forecast (green) (1980–2025).
Applsci 13 07997 g014
Figure 15. US accidents prediction due to technical factors, observed (red), setting (bleu), and forecast (green) (1980–2025).
Applsci 13 07997 g015
Figure 16. US sabotage accident prediction observed (red), setting (bleu), and forecast (green) (1980–2025).
Applsci 13 07997 g016
Figure 17. US flight cycles (1980–2020).
Applsci 13 07997 g017
Table 1. Correlations between the number of accidents and GDP growth in the US.
CauseGDP Growth
(%)
Inflation
(%)
N° of Professionals
(%)
N° of accidents0.290−0.160--
Human factors----−0.518
Flight cycles−0.032−0.583--
Table 2. Descriptive statistics of the time series under forecaster by ARIMA.
Time Series\Descriptive StatisticsMeanStandard Deviation1st Quartile2nd Quartile3rd Quartile
Number of accidents31.797.3526.5032.5036.25
Number of victims89.45118.5520.7545.00112.50
Number of injuries58.6475.4710.0029.0064.25
Accidents on the ground4.122.782.003.506.00
Takeoff accidents5.982.174.006.007.00
Accidents en route5.933.014.005.007.00
Accidents on approach5.453.233.005.506.25
Landing accidents10.404.706.7510.0013.00
Human factors-related accidents21.216.4016.0022.5026.25
Accidents environmental factors2.261.361.002.003.00
Accidents technical factors5.712.474.006.007.00
Accidents by sabotage1.262.050.000.002.00
Disclaimer/Publisher’s Note: The statements, opinions and data contained in all publications are solely those of the individual author(s) and contributor(s) and not of MDPI and/or the editor(s). MDPI and/or the editor(s) disclaim responsibility for any injury to people or property resulting from any ideas, methods, instructions or products referred to in the content.

