
Evaluation of Hidden Cost Risk of Prefabricated Construction Based on SEM-MEECM

Abstract
:1. Introduction
2. Literature Review and Hypothesis Development
3. Research Methods
3.1. Development of Index System
3.2. Questionnaire Design and Samples
3.3. Reliability and Validity Test
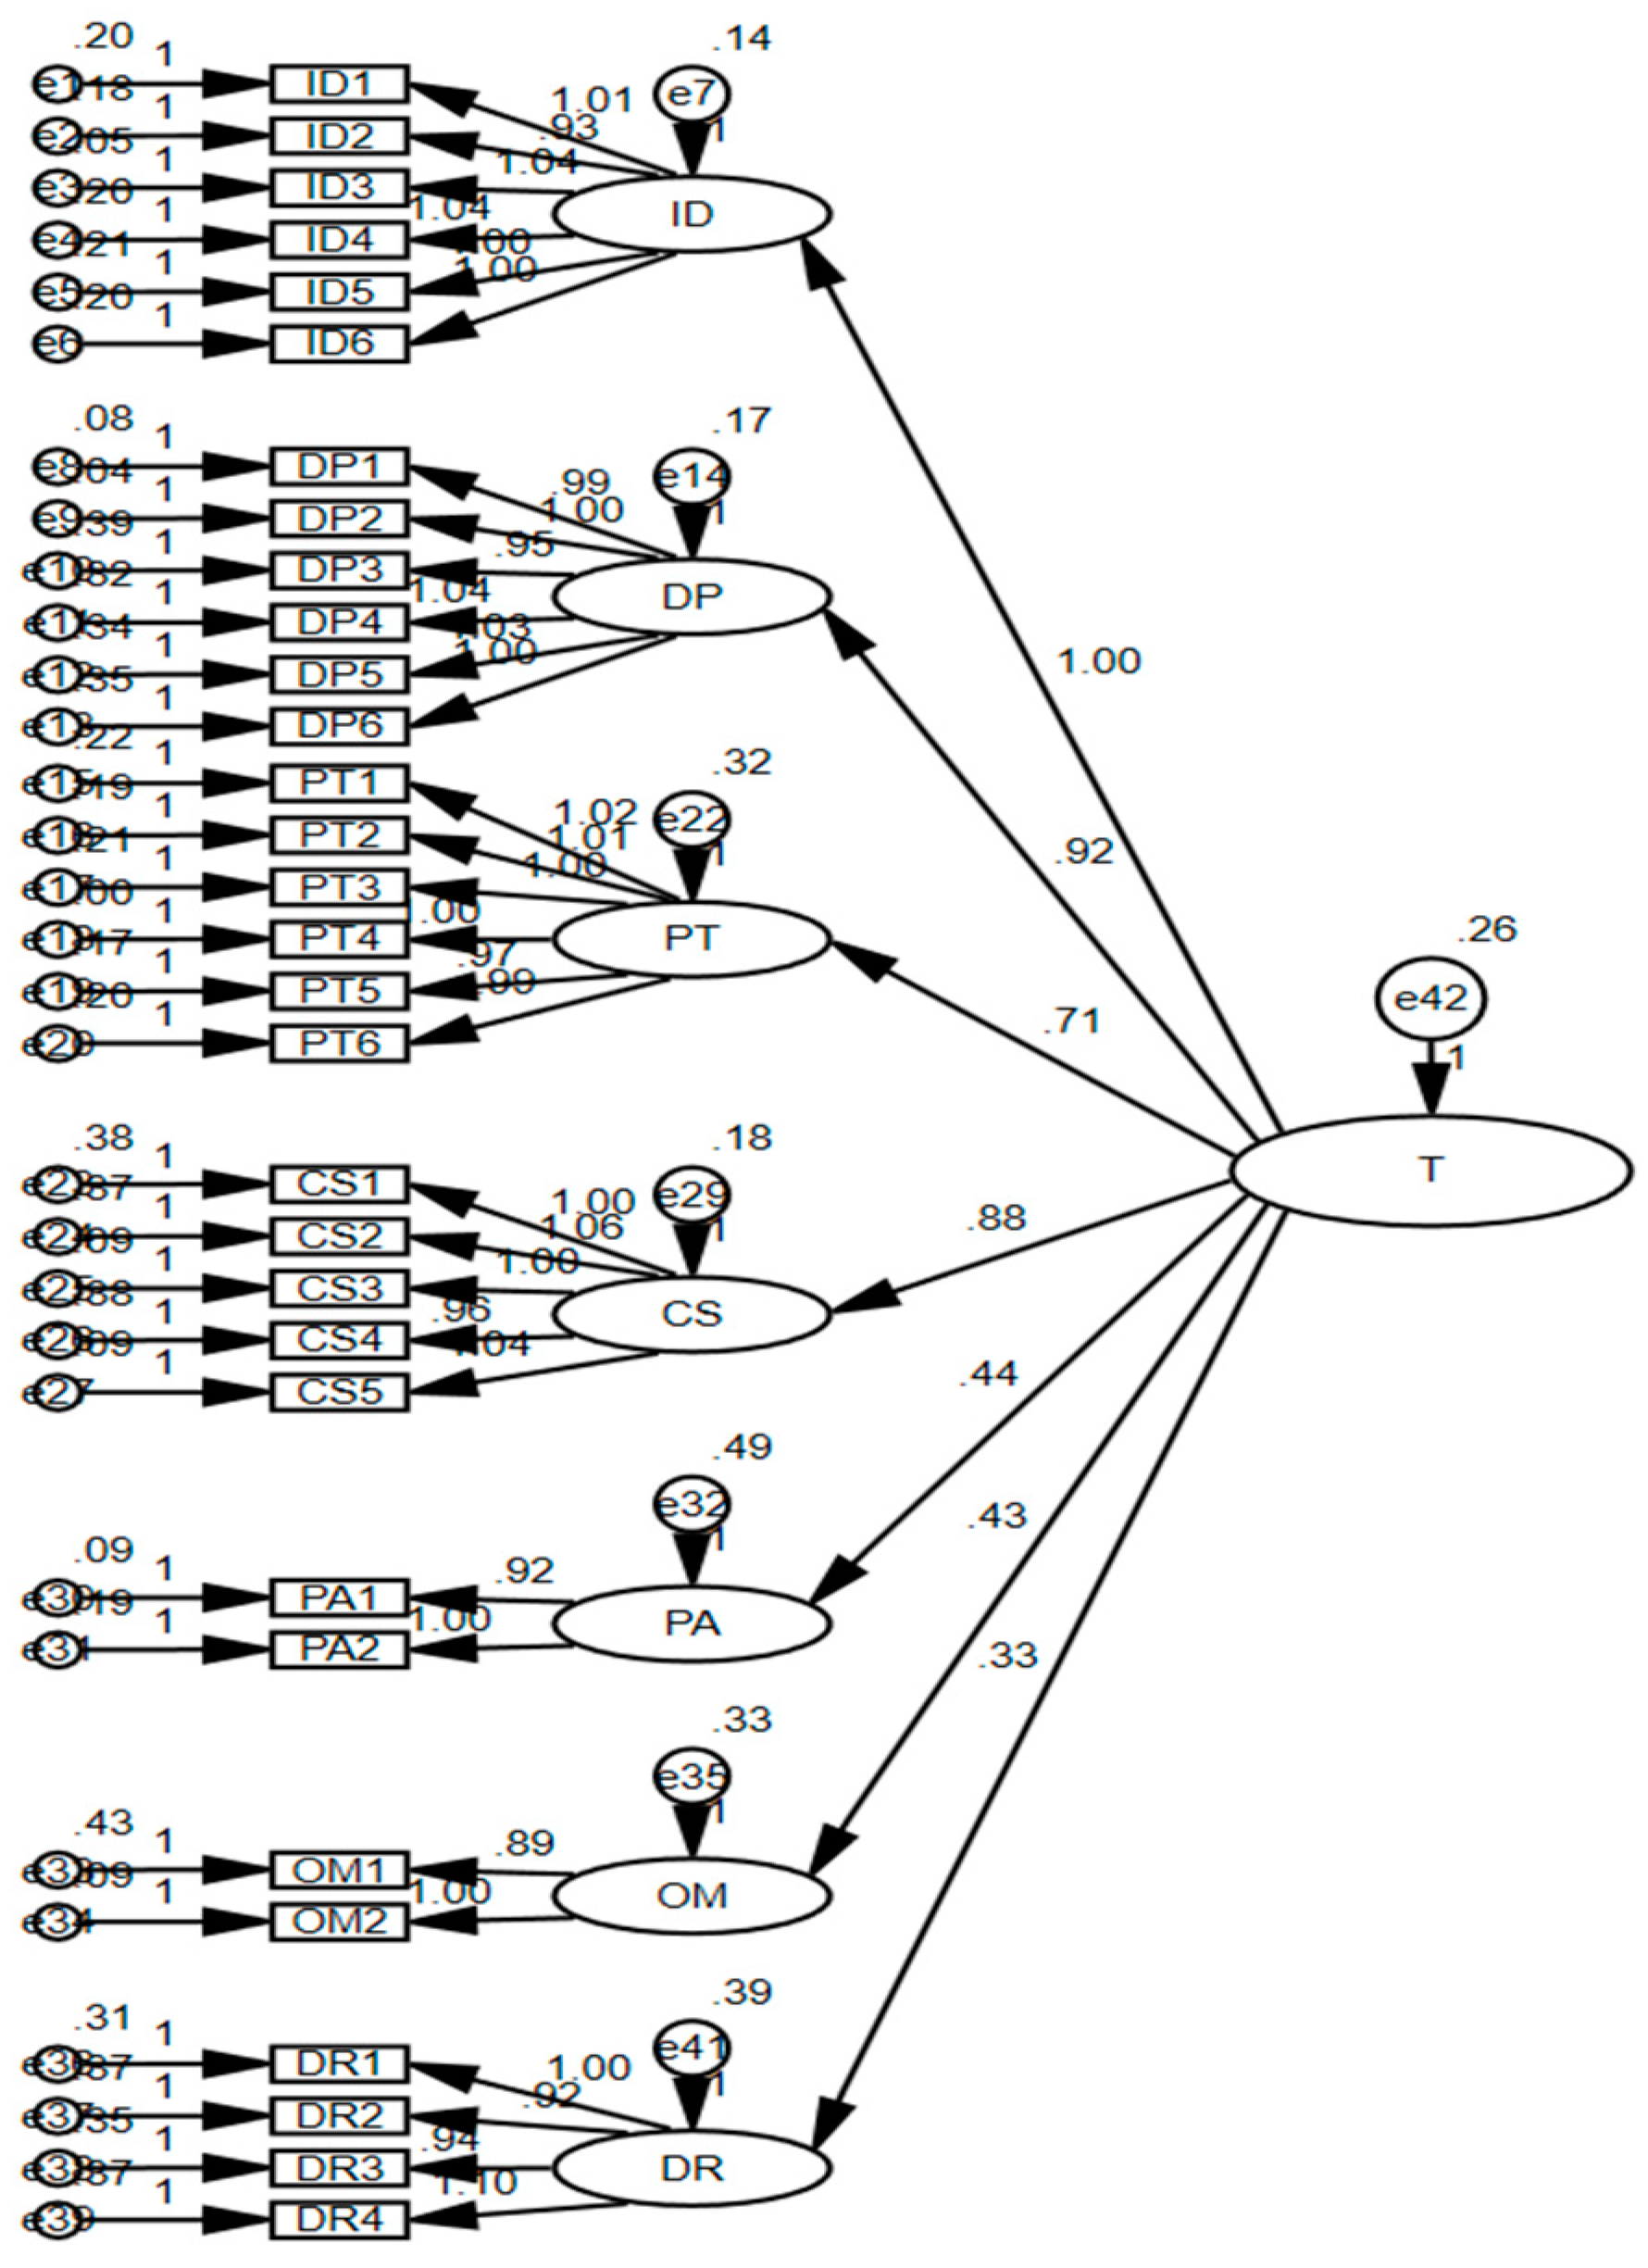
3.4. Structural Equation Modeling
3.5. Evaluation Based on Matter–Element Extension Cloud Model (MEECM)
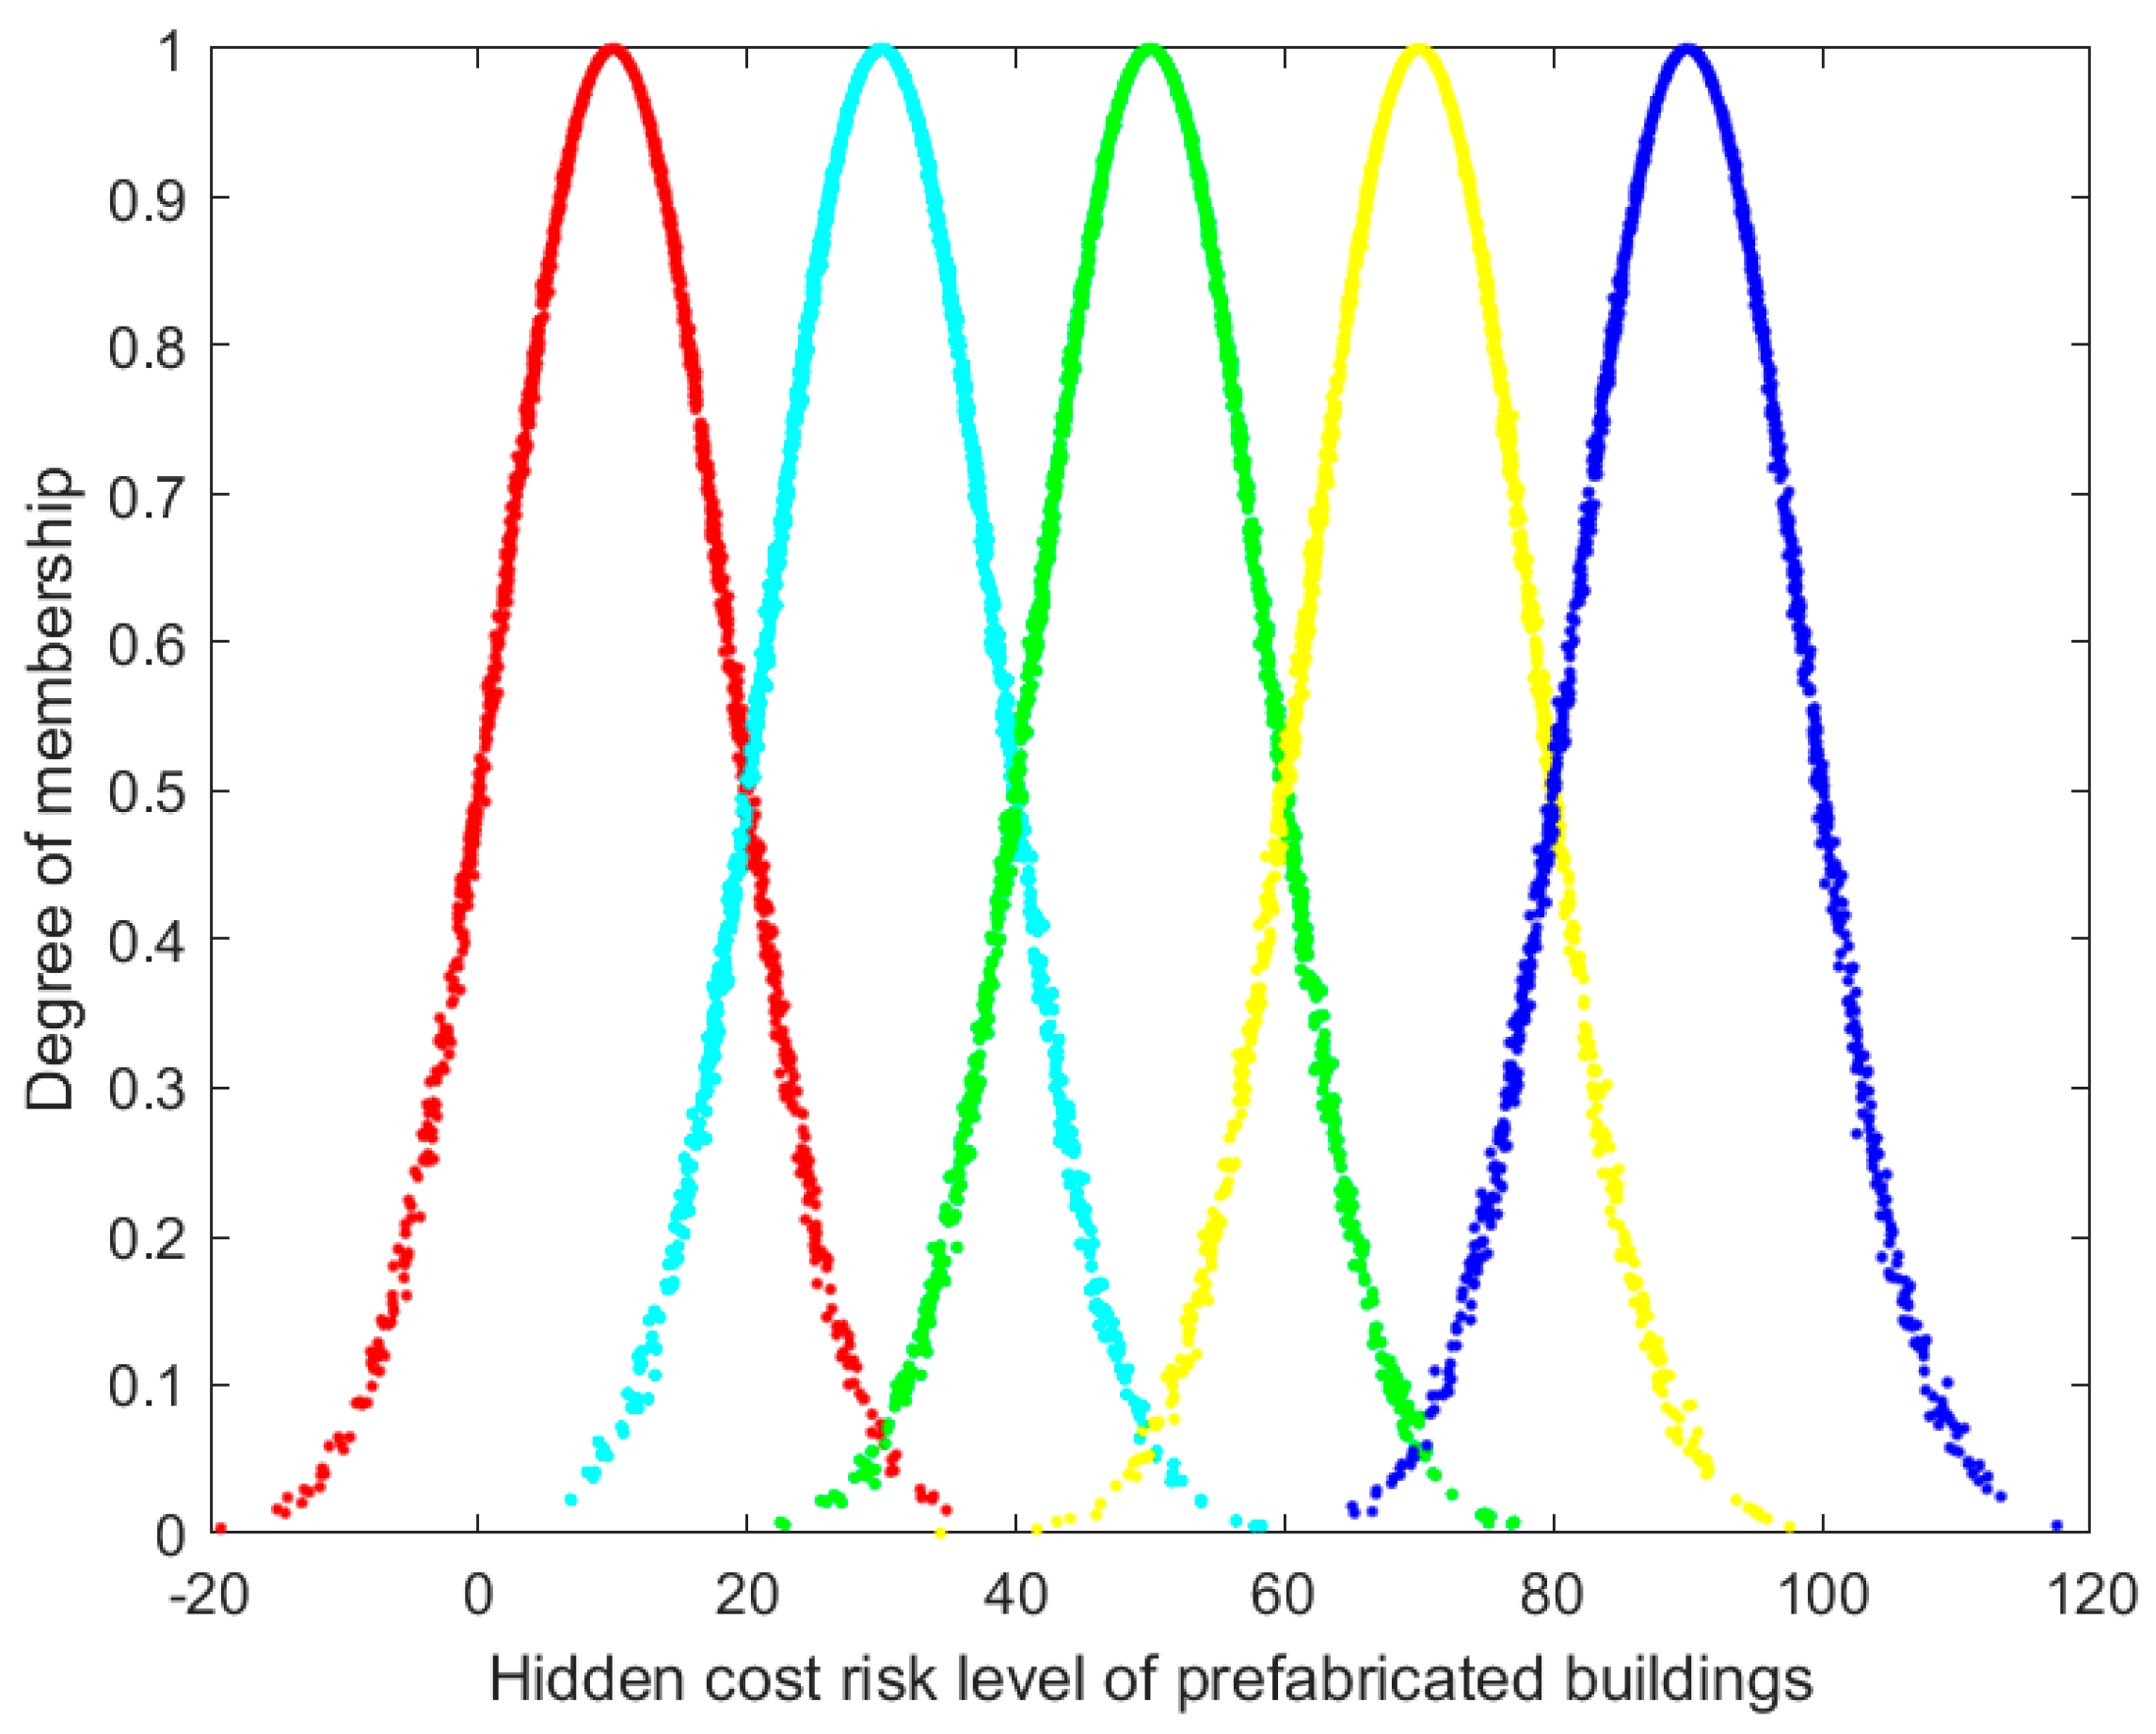
3.5.1. Determination of Classical and Joint Domains
3.5.2. Determination of Comprehensive Evaluation Matrix
3.5.3. Correlation Degree Calculation and Level Evaluation
4. Results
4.1. Data Reliability and Validity
4.2. Model Building and Fitting
4.3. Indicator Weight Calculation
4.4. Evaluation of a Case Project
5. Conclusions
Author Contributions
Funding
Institutional Review Board Statement
Informed Consent Statement
Data Availability Statement
Conflicts of Interest
References
- Li, X.J.; Chen, W.; Ali, A.; Shilpi, B. Game analysis on prefabricated building evolution based on dynamic revenue risks in China. J. Clean. Prod. 2020, 267, 121730. [Google Scholar] [CrossRef]
- Hong, J.; Shen, G.Q.; Mao, C.; Li, Z.; Li, K. Life-cycle energy analysis of prefabricated building components: An input–output-based hybrid model. J. Cleaner. Prod. 2016, 112, 2198–2207. [Google Scholar] [CrossRef] [Green Version]
- Zhu, H.; Hong, J.; Geoffrey, S. The exploration of the life-cycle energy saving potential for using prefabrication in residential buildings in China. Energy Build. 2018, 166, 561–570. [Google Scholar] [CrossRef]
- Xue, H.; Zhang, S.; Su, Y.; Wu, Z. Factors Affecting the Capital Cost of Prefabrication—A Case Study of China. Sustainability 2017, 9, 1512. [Google Scholar] [CrossRef] [Green Version]
- Standfield, K. Intangible Management: Tools for Solving the Accounting and Management Crisis; Academic Press: San Diego, CA, USA, 2002. [Google Scholar]
- Sellés, M.E.S.; Rubio, J.A.C.; Mullor, J.R. Development of a Quantification Proposal for Hidden Quality Costs: Applied to the Construction Sector. J. Constr. Eng. Manag. 2008, 134, 749–757. [Google Scholar] [CrossRef]
- Shao, W. Research on Estimation Mode of Construction Project Implicit Cost Based on Activity-Based Costing. Constr. Econ. 2012, 10, 38–42. [Google Scholar]
- Lu, W.; Zhang, L.; Pan, J. Identification and analyses of hidden transaction costs in project dispute resolutions. Int. J. Proj. Manag. 2015, 33, 711–718. [Google Scholar] [CrossRef]
- Arif, M.; Egbu, C. Making a case for offsite construction in China. Eng. Constr. Archit. Manag. 2010, 17, 536–548. [Google Scholar] [CrossRef]
- Chang, C.G.; Zhang, Y. Study on the production cost control of assembly building components. J. Shenyang Univ. Archit. Soc. Sci. Ed. 2016, 5, 470–475. [Google Scholar]
- Rafaela, B.; Carlos, T.F.; Daniela, D.V. Site logistics planning and control for engineer-to-order prefabricated building systems using BIM 4D modeling. Automat. Constr. 2019, 98, 248–264. [Google Scholar]
- Khalili, A.; Chua, D. IFC-Based Framework to Move beyond Individual Building Elements toward Configuring a Higher Level of Prefabrication. J. Comput. Civ. Eng. 2013, 27, 243–253. [Google Scholar] [CrossRef]
- Peng, J.; Zhou, J.; Meng, F.; Yu, Y. Analysis on the hidden cost of prefabricated buildings based on FISM-BN. PLoS ONE 2021, 16, e0252138. [Google Scholar] [CrossRef] [PubMed]
- Hong, J.; Shen, G.; Li, Z.; Zhang, W. Barriers to promoting prefabricated construction in China: A cost benefit analysis. J. Cleaner Prod. 2018, 172, 649–660. [Google Scholar] [CrossRef]
- Li, X.J. Research on Investment Risk Influence Factors of Prefabricated Building Projects. J. Civ. Eng. Manag. 2020, 26, 599–613. [Google Scholar] [CrossRef]
- Yan, H.Y.; He, Z.; Gao, C.; Xie, M.J.; Sheng, H.Y.; Chen, H.H. Investment estimation of prefabricated concrete buildings based on XGBoost machine learning algorithm. Adv. Eng. Inform. 2022, 54, 101789. [Google Scholar] [CrossRef]
- Yan, E.H.; Yong, Q.L. Technical Analysis of Optimal Design for Building Structure Considering Cost Constraint of Project. Appl. Mech. Mater. 2014, 496, 2563–2568. [Google Scholar]
- Fiorentino, A. Cost drivers-based method for machining and assembly cost estimations in mould manufacturing. Int. J. Adv. Manuf. Technol. 2014, 70, 1437–1444. [Google Scholar] [CrossRef]
- Shakantu, W.; Tookey, J.E.; Bowen, P.A. The Hidden Cost of Transportation of Construction Materials: An Overview. J. Eng. Des. Technol. 2003, 1, 103–118. [Google Scholar] [CrossRef]
- Hwang, B.G.; Shan, M.; Looi, K.Y. Key Constraints and mitigation strategies for prefabricated prefinished volumetric construction. J. Clean. Prod. 2018, 183, 183–193. [Google Scholar] [CrossRef]
- Tazikova, A.; Strukova, Z. The impact of logistics on the cost of prefabricated construction. Acta Logist. 2021, 8, 65–71. [Google Scholar] [CrossRef]
- Chang, C.G.; Wu, F.F.; Dan, L. Optimization Model of Load and Transportation for Prefabricated Construction Components. In Proceedings of the 2016 International Forum on Energy, Environment and Sustainable Development, Shenzhen, China, 16–17 April 2016. [Google Scholar]
- Demiralp, G.; Guven, G.; Ergen, E. Analyzing the benefits of RFID technology for cost sharing in construction supply chains: A case study on prefabricated precast components. Autom. Constr. 2012, 24, 120–129. [Google Scholar] [CrossRef]
- Yang, Y.H.; Liu, P. Benefits and Development of Adoption Building Information Models for Construction Management. In Proceedings of the International Conference on Electromechanical Control Technology and Transportation (ICECTT), Zhuhai, China, 31 October–1 November 2015. [Google Scholar]
- Ye, M.W.; Wang, J.W.; Si, X.; Zhao, S.M.; Huang, Q.Y. Analysis on Dynamic Evolution of the Cost Risk of Prefabricated Building Based on DBN. Sustainability 2022, 14, 1864. [Google Scholar] [CrossRef]
- Guo, Z.X.; Li, L.H. A Study of Collaborative Innovation Mechanism of Prefabricated Construction Enterprises Using Order Parameter. Front. Built Environ. 2022, 8, 858650. [Google Scholar] [CrossRef]
- Luan, H.Y.; Li, L.; Zhang, S.X. Exploring the Impact Mechanism of Interface Management Performance of Sustainable Prefabricated Construction: The Perspective of Stakeholder Engagement. Sustainability 2022, 14, 10704. [Google Scholar] [CrossRef]
- Samani, P.; Gregory, J.; Leal, V.; Mendes, A.; Correia, N. Lifecycle Cost Analysis of Prefabricated Composite and Masonry Buildings: Comparative Study. J. Archit. Eng. 2018, 24, 05017012. [Google Scholar] [CrossRef]
- Ruiz, L.A.L.; Ramon, X.R.; Domingo, S.G. The circular economy in the construction and demolition waste sector—A review and an integrative model approach. J. Clean. Prod. 2020, 248I, 119238. [Google Scholar] [CrossRef]
- Vitale, P.; Arena, N.; Di Gregorio, F.; Arena, U. Life cycle assessment of the end-of-life phase of a residential building. Waste Manag. 2017, 60, 311–321. [Google Scholar] [CrossRef]
- Dosho, Y. Development of a Sustainable Concrete Waste Recycling System. J. Adv. Concr. Technol. 2007, 5, 27–42. [Google Scholar] [CrossRef] [Green Version]
- Wang, H.; Zhang, Y.Q.; Gao, W.J.; Kuroki, S. Life Cycle Environmental and Cost Performance of Prefabricated Buildings. Sustainability 2020, 12, 2609. [Google Scholar] [CrossRef] [Green Version]
- Purchase, C.K.; Al Zulayq, D.M.; O’Brien, B.T.; Kowalewski, M.J.; Berenjian, A.; Tarighaleslami, A.H.; Seifan, M. Circular Economy of Construction and Demolition Waste: A Literature Review on Lessons, Challenges, and Benefits. Materials 2022, 15, 76. [Google Scholar] [CrossRef]


| First-Order Index | Secondary Index | Index Interpretation |
|---|---|---|
| Investment decision stage ID | National construction standards and tax policies ID1 | Non-compliance with national codes in a project can result in higher financial losses due to increased tax rates on prefabricated components compared to on-site construction. This shift in tax policy increases the cost risk for businesses. |
| Reasonable selection of supplier ID2 | The selection of suppliers without a rational and scientific examination can eventually increase the cost risk. | |
| Assembly project personalized and standardized decision ID3 | The extent to which personalization and standardization are incorporated into prefabricated construction affects hidden cost risk. | |
| Degree of integration of design and production ID4 | Insufficient integration between component design and production increases the cost risk. | |
| Project capital occupancy cost ID5 | Borrowing funds incurs interest cost risk, whereas using own funds incurs opportunity cost risk. | |
| Project function analysis and area allocation ID6 | Function analysis and area allocation facilitate scientific examination and objective demonstration of economic and technical factors. | |
| Design phase DP | Standardization and integration of prefabricated components DP1 | Modular integration of uniform components promotes universality and interchangeability, accelerates design time, enhances construction efficiency, and lowers cost risk. |
| Design degree and rationality of prefabricated component splitting DP2 | Unreasonable splitting of prefabricated parts can increase the difficulty of shipping and lifting, leading to potential production cost increases. | |
| Maturity of the design system DP3 | The risk of component production cost depends on the building design and how secondary splitting of components is managed. | |
| Prefabrication rate and assembly rate DP4 | Prefabrication rates impact cost growth in various ways. Higher prefabrication rates can speed up construction but also raise project cost risk. | |
| Cooperation efficiency of project participants DP5 | Effective cooperation among project participants, correct information sharing, and prompt implementation can reduce cost risk. | |
| The degree of positive design using BIM technology DP6 | BIM technology enables forward design and digital disclosure of quality and safety aspects throughout the project’s life cycle, ultimately leading to cost risk reduction. | |
| Production and transportation stage PT | Turnover of production mold PT1 | Low turnover of mold production increases hidden cost risk. |
| Resource allocation efficiency PT2 | Rational allocation of resources can improve production efficiency and reduce cost risk. | |
| Intelligent construction of new technology, new equipment application level PT3 | Scientific and rational use of new equipment and technology improves quality and efficiency, reducing cost risk. | |
| Timeliness of prefabricated component supply PT4 | Delayed supply of prefabricated components can paralyze the construction site, increasing the risk of hoisting equipment expenses, personnel costs, and other costs. | |
| Working efficiency and mechanical utilization rate of production personnel PT5 | Low human and machine efficiency leads to increased cost risk. | |
| Location of component factory PT6 | Unreasonable location of component factories increases transportation cost risk. | |
| Construction and hoisting stage CS | Construction organization design and construction management scheme CS1 | A scientific and reasonable construction group design and construction management system is crucial for successful project completion. |
| Risk of fatigue and slow work CS2 | Staff fatigue reduces production efficiency, resulting in less engineering being completed in the same amount of time and increasing the risk of final cost, idle labor costs, and material cost growth during idle labor. | |
| The technical level of the professionals CS3 | The ability of professionals to optimize project construction impacts project cost risk. | |
| Application degree of information technology CS4 | The level of application of BIM construction simulation and the perfection of a BIM collaborative management system affect cost risk. | |
| Mechanical efficiency of site lifting CS5 | Site hoisting mechanical efficiency greatly affects the construction period, and improper operation increases hidden cost risk. | |
| Completion acceptance phase PA | Cost of lost goodwill PA1 | Goodwill loss cost includes brand image, enterprise integrity loss, social identity feeling, enterprise prospect loss, and qualification rating loss. This can increase hidden cost risk. |
| Cost of damage to builder relationship PA2 | The cost of damaged builder relationship includes reducing owner satisfaction, maintaining customer relationship, saving customers, and redeveloping customers. This can increase hidden cost risk. | |
| Operation and maintenance phase OM | Application degree of intelligent operation and maintenance system OM1 | The degree of application of intelligent operation and maintenance systems affects labor cost in the operation and maintenance stage, ultimately impacting overall cost. |
| BIM and RFID technology application degree OM2 | RFID tags and BIM databases can facilitate the timely and accurate installation of prefabricated components, analyze and detect building structure safety and durability, avoid structural damage, and remind stakeholders in a timely manner to prevent greater losses, ultimately reducing cost risk. | |
| Demolition and recovery stage DR | Degree of environmental recovery difficulty DR1 | Failure to address environmental problems and comply with regulations can result in penalties and increased cost risk. |
| Recovery rate of prefabricated components DR2 | High component recovery and regeneration rates ultimately lead to reduced cost risk. | |
| Site selection of recycling component factory DR4 | The unreasonable location of the component recovery plant can increase cost risk. | |
| Remove simulation refinement and visualization degree DR3 | A complete visual database improves the efficiency of the demolition recovery process. The high degree of simulation during demolition minimizes impact on the surrounding environment, reducing the risk of environmental restoration cost. |
| KMO | Bartlett Test | ||
|---|---|---|---|
| Approximate Chi-Square | Degree of Freedom | Significance | |
| 0.917 | 9563.932 | 465 | 0.000 |
| Latent Variable | Observed Variable Compound Values | Cronbach’s α |
|---|---|---|
| Investment and decision stage | 6 | 0.933 |
| Design stage | 6 | 0.901 |
| Production and transportation stage | 6 | 0.941 |
| Construction stage | 5 | 0.880 |
| Completion acceptance stage | 2 | 0.876 |
| Operation and maintenance stage | 2 | 0.718 |
| Demolition and recovery stage | 4 | 0.822 |
| Total | 31 | 0.922 |
| Measured Variable | Correlation | Latent Variable | Estimate | S.E. | C.R. | p | Label | Estimate (Standardization) |
|---|---|---|---|---|---|---|---|---|
| ID | <--- | T | 1 | 0.806 | ||||
| DP | <--- | T | 0.915 | 0.087 | 10.483 | *** | par_25 | 0.75 |
| PT | <--- | T | 0.706 | 0.077 | 9.16 | *** | par_26 | 0.538 |
| CS | <--- | T | 0.876 | 0.075 | 11.616 | *** | par_27 | 0.726 |
| PA | <--- | T | 0.444 | 0.091 | 4.879 | *** | par_28 | 0.307 |
| OM | <--- | T | 0.433 | 0.073 | 5.903 | *** | par_29 | 0.358 |
| DR | <--- | T | 0.332 | 0.077 | 4.338 | *** | par_30 | 0.262 |
| ID6 | <--- | ID | 1 | 0.817 | ||||
| ID5 | <--- | ID | 1.003 | 0.051 | 19.832 | *** | par_1 | 0.808 |
| ID4 | <--- | ID | 1.043 | 0.051 | 20.511 | *** | par_2 | 0.829 |
| ID3 | <--- | ID | 1.045 | 0.041 | 25.227 | *** | par_3 | 0.946 |
| ID2 | <--- | ID | 0.932 | 0.046 | 20.123 | *** | par_4 | 0.814 |
| ID1 | <--- | ID | 1.01 | 0.05 | 20.349 | *** | par_5 | 0.821 |
| DP6 | <--- | DP | 1 | 0.724 | ||||
| DP5 | <--- | DP | 1.028 | 0.067 | 15.312 | *** | par_6 | 0.74 |
| DP4 | <--- | DP | 1.036 | 0.067 | 15.524 | *** | par_7 | 0.75 |
| DP3 | <--- | DP | 0.955 | 0.067 | 14.195 | *** | par_8 | 0.69 |
| DP2 | <--- | DP | 1.001 | 0.051 | 19.73 | *** | par_9 | 0.947 |
| DP1 | <--- | DP | 0.985 | 0.052 | 19.03 | *** | par_10 | 0.912 |
| PT6 | <--- | PT | 0.988 | 0.046 | 21.49 | *** | par_11 | 0.829 |
| PT5 | <--- | PT | 0.974 | 0.044 | 22.214 | *** | par_12 | 0.846 |
| PT4 | <--- | PT | 0.997 | 0.034 | 29.572 | *** | par_13 | 1 |
| PT3 | <--- | PT | 1 | 0.823 | ||||
| PT2 | <--- | PT | 1.014 | 0.046 | 21.946 | *** | par_14 | 0.84 |
| PT1 | <--- | PT | 1.015 | 0.048 | 21.205 | *** | par_15 | 0.821 |
| CS5 | <--- | CS | 1.038 | 0.038 | 26.979 | *** | par_16 | 0.901 |
| CS4 | <--- | CS | 0.96 | 0.056 | 17.032 | *** | par_17 | 0.692 |
| CS3 | <--- | CS | 1 | 0.899 | ||||
| CS2 | <--- | CS | 1.056 | 0.057 | 18.527 | *** | par_18 | 0.731 |
| CS1 | <--- | CS | 0.999 | 0.057 | 17.626 | *** | par_19 | 0.706 |
| PA2 | <--- | PA | 1 | 0.862 | ||||
| PA1 | <--- | PA | 0.916 | 0.118 | 7.759 | *** | par_20 | 0.914 |
| OM2 | <--- | OM | 1 | 0.898 | ||||
| OM1 | <--- | OM | 0.887 | 0.173 | 5.118 | *** | par_21 | 0.639 |
| DR4 | <--- | DR | 1.097 | 0.08 | 13.77 | *** | par_22 | 0.76 |
| DR3 | <--- | DR | 0.937 | 0.07 | 13.465 | *** | par_23 | 0.715 |
| DR2 | <--- | DR | 0.924 | 0.07 | 13.276 | *** | par_24 | 0.699 |
| DR1 | <--- | DR | 1 | 0.76 |
| Parameter | Value | Standard | Parameter | Value | Standard |
|---|---|---|---|---|---|
| χ2/df | 1.063 | <5 | RMSEA | 0.012 | <0.05 |
| GFI | 0.938 | >0.9 | TLI | 0.997 | >0.9 |
| IFI | 0.997 | >0.9 | CFI | 0.997 | >0.9 |
| PGFI | 0.808 | >0.5 | PNFI | 0.876 | >0.5 |
| Latent Variable | System Weight | Measurement Variable | Indicator Weight | Indicator Total Weight |
|---|---|---|---|---|
| ID | 0.2151 | ID1 | 0.1623 | 0.0349 |
| ID2 | 0.1605 | 0.0345 | ||
| ID3 | 0.1646 | 0.0354 | ||
| ID4 | 0.1879 | 0.0404 | ||
| ID5 | 0.1617 | 0.0348 | ||
| ID6 | 0.1631 | 0.0351 | ||
| DP | 0.2002 | DP1 | 0.1520 | 0.0304 |
| DP2 | 0.1554 | 0.0311 | ||
| DP3 | 0.1575 | 0.0315 | ||
| DP4 | 0.1449 | 0.0290 | ||
| DP5 | 0.1988 | 0.0398 | ||
| DP6 | 0.1915 | 0.0383 | ||
| PT | 0.1436 | PT1 | 0.1607 | 0.0231 |
| PT2 | 0.1640 | 0.0235 | ||
| PT3 | 0.1938 | 0.0278 | ||
| PT4 | 0.1595 | 0.0229 | ||
| PT5 | 0.1628 | 0.0234 | ||
| PT6 | 0.1591 | 0.0228 | ||
| CS | 0.1938 | CS1 | 0.2293 | 0.0444 |
| CS2 | 0.1761 | 0.0341 | ||
| CS3 | 0.2288 | 0.0443 | ||
| CS4 | 0.1861 | 0.0360 | ||
| CS5 | 0.1797 | 0.0348 | ||
| PA | 0.0819 | PA1 | 0.4854 | 0.0398 |
| PA2 | 0.5146 | 0.0422 | ||
| OM | 0.0955 | OM1 | 0.5843 | 0.0558 |
| OM2 | 0.4157 | 0.0397 | ||
| DR | 0.0699 | DR1 | 0.2590 | 0.0181 |
| DR2 | 0.2437 | 0.0170 | ||
| DR3 | 0.2382 | 0.0167 | ||
| DR4 | 0.2590 | 0.0181 |
| Project Overview | Building No. 10 | Building No. 15 |
|---|---|---|
| Area of structure (m2) | 17,715.53 | 23,766.73 |
| Building height (m) | 79.51 | 89.98 |
| Number of floors | 21 | 25 |
| Story height (m) | 3.5 | 3.5 |
| Prefabricated floor | 2~21F | 2~25F |
| Structural system | Assemble the monolithic shear wall structure | Assemble the monolithic shear wall structure |
| Assembly rate | 61.35% | 60.5% |
| Type of prefabricated component | Prefabricated truss reinforced composite plate (including balcony), prefabricated staircase segment, prefabricated beam, prefabricated air conditioning board | Prefabricated truss reinforced composite plate (including balcony), prefabricated staircase segment, prefabricated beam, prefabricated air conditioning board |
| Index | I | II | III | IV | V |
|---|---|---|---|---|---|
| ID1 | (0, 20] | (20, 40] | (40, 60] | (60, 80] | (80, 100] |
| ID2 | (0, 20] | (20, 40] | (40, 60] | (60, 80] | (80, 100] |
| ID3 | (0, 20] | (20, 40] | (40, 60] | (60, 80] | (80, 100] |
| ID4 | (0, 20] | (20, 40] | (40, 60] | (60, 80] | (80, 100] |
| ID5 | (0, 20] | (20, 40] | (40, 60] | (60, 80] | (80, 100] |
| ID6 | (0, 20] | (20, 40] | (40, 60] | (60, 80] | (80, 100] |
| DP1 | (0, 20] | (20, 40] | (40, 60] | (60, 80] | (80, 100] |
| DP2 | (0, 20] | (20, 40] | (40, 60] | (60, 80] | (80, 100] |
| DP3 | (0, 20] | (20, 40] | (40, 60] | (60, 80] | (80, 100] |
| DP4 | (0, 20] | (20, 40] | (40, 60] | (60, 80] | (80, 100] |
| DP5 | (0, 20] | (20, 40] | (40, 60] | (60, 80] | (80, 100] |
| DP6 | (0, 20] | (20, 40] | (40, 60] | (60, 80] | (80, 100] |
| PT1 | (0, 20] | (20, 40] | (40, 60] | (60, 80] | (80, 100] |
| PT2 | (0, 20] | (20, 40] | (40, 60] | (60, 80] | (80, 100] |
| PT3 | (0, 20] | (20, 40] | (40, 60] | (60, 80] | (80, 100] |
| PT4 | (0, 20] | (20, 40] | (40, 60] | (60, 80] | (80, 100] |
| PT5 | (0, 20] | (20, 40] | (40, 60] | (60, 80] | (80, 100] |
| PT6 | (0, 20] | (20, 40] | (40, 60] | (60, 80] | (80, 100] |
| CS1 | (0, 20] | (20, 40] | (40, 60] | (60, 80] | (80, 100] |
| CS2 | (0, 20] | (20, 40] | (40, 60] | (60, 80] | (80, 100] |
| CS3 | (0, 20] | (20, 40] | (40, 60] | (60, 80] | (80, 100] |
| CS4 | (0, 20] | (20, 40] | (40, 60] | (60, 80] | (80, 100] |
| CS5 | (0, 20] | (20, 40] | (40, 60] | (60, 80] | (80, 100] |
| PA1 | (0, 20] | (20, 40] | (40, 60] | (60, 80] | (80, 100] |
| PA2 | (0, 20] | (20, 40] | (40, 60] | (60, 80] | (80, 100] |
| OM1 | (0, 20] | (20, 40] | (40, 60] | (60, 80] | (80, 100] |
| OM2 | (0, 20] | (20, 40] | (40, 60] | (60, 80] | (80, 100] |
| DR1 | (0, 20] | (20, 40] | (40, 60] | (60, 80] | (80, 100] |
| DR2 | (0, 20] | (20, 40] | (40, 60] | (60, 80] | (80, 100] |
| DR3 | (0, 20] | (20, 40] | (40, 60] | (60, 80] | (80, 100] |
| DR4 | (0, 20] | (20, 40] | (40, 60] | (60, 80] | (80, 100] |
| I | II | III | IV | V | |
|---|---|---|---|---|---|
| ID1 | (10, 8.4933, 0.04) | (30, 8.4933, 0.04) | (50, 8.4933, 0.04) | (70, 8.4933, 0.04) | (90, 8.4933, 0.04) |
| ID2 | (10, 8.4933, 0.04) | (30, 8.4933, 0.04) | (50, 8.4933, 0.04) | (70, 8.4933, 0.04) | (90, 8.4933, 0.04) |
| ID3 | (10, 8.4933, 0.04) | (30, 8.4933, 0.04) | (50, 8.4933, 0.04) | (70, 8.4933, 0.04) | (90, 8.4933, 0.04) |
| ID4 | (10, 8.4933, 0.04) | (30, 8.4933, 0.04) | (50, 8.4933, 0.04) | (70, 8.4933, 0.04) | (90, 8.4933, 0.04) |
| ID5 | (10, 8.4933, 0.04) | (30, 8.4933, 0.04) | (50, 8.4933, 0.04) | (70, 8.4933, 0.04) | (90, 8.4933, 0.04) |
| ID6 | (10, 8.4933, 0.04) | (30, 8.4933, 0.04) | (50, 8.4933, 0.04) | (70, 8.4933, 0.04) | (90, 8.4933, 0.04) |
| DP1 | (10, 8.4933, 0.04) | (30, 8.4933, 0.04) | (50, 8.4933, 0.04) | (70, 8.4933, 0.04) | (90, 8.4933, 0.04) |
| DP2 | (10, 8.4933, 0.04) | (30, 8.4933, 0.04) | (50, 8.4933, 0.04) | (70, 8.4933, 0.04) | (90, 8.4933, 0.04) |
| DP3 | (10, 8.4933, 0.04) | (30, 8.4933, 0.04) | (50, 8.4933, 0.04) | (70, 8.4933, 0.04) | (90, 8.4933, 0.04) |
| DP4 | (10, 8.4933, 0.04) | (30, 8.4933, 0.04) | (50, 8.4933, 0.04) | (70, 8.4933, 0.04) | (90, 8.4933, 0.04) |
| DP5 | (10, 8.4933, 0.04) | (30, 8.4933, 0.04) | (50, 8.4933, 0.04) | (70, 8.4933, 0.04) | (90, 8.4933, 0.04) |
| DP6 | (10, 8.4933, 0.04) | (30, 8.4933, 0.04) | (50, 8.4933, 0.04) | (70, 8.4933, 0.04) | (90, 8.4933, 0.04) |
| PT1 | (10, 8.4933, 0.04) | (30, 8.4933, 0.04) | (50, 8.4933, 0.04) | (70, 8.4933, 0.04) | (90, 8.4933, 0.04) |
| PT2 | (10, 8.4933, 0.04) | (30, 8.4933, 0.04) | (50, 8.4933, 0.04) | (70, 8.4933, 0.04) | (90, 8.4933, 0.04) |
| PT3 | (10, 8.4933, 0.04) | (30, 8.4933, 0.04) | (50, 8.4933, 0.04) | (70, 8.4933, 0.04) | (90, 8.4933, 0.04) |
| PT4 | (10, 8.4933, 0.04) | (30, 8.4933, 0.04) | (50, 8.4933, 0.04) | (70, 8.4933, 0.04) | (90, 8.4933, 0.04) |
| PT5 | (10, 8.4933, 0.04) | (30, 8.4933, 0.04) | (50, 8.4933, 0.04) | (70, 8.4933, 0.04) | (90, 8.4933, 0.04) |
| PT6 | (10, 8.4933, 0.04) | (30, 8.4933, 0.04) | (50, 8.4933, 0.04) | (70, 8.4933, 0.04) | (90, 8.4933, 0.04) |
| CS1 | (10, 8.4933, 0.04) | (30, 8.4933, 0.04) | (50, 8.4933, 0.04) | (70, 8.4933, 0.04) | (90, 8.4933, 0.04) |
| CS2 | (10, 8.4933, 0.04) | (30, 8.4933, 0.04) | (50, 8.4933, 0.04) | (70, 8.4933, 0.04) | (90, 8.4933, 0.04) |
| CS3 | (10, 8.4933, 0.04) | (30, 8.4933, 0.04) | (50, 8.4933, 0.04) | (70, 8.4933, 0.04) | (90, 8.4933, 0.04) |
| CS4 | (10, 8.4933, 0.04) | (30, 8.4933, 0.04) | (50, 8.4933, 0.04) | (70, 8.4933, 0.04) | (90, 8.4933, 0.04) |
| CS5 | (10, 8.4933, 0.04) | (30, 8.4933, 0.04) | (50, 8.4933, 0.04) | (70, 8.4933, 0.04) | (90, 8.4933, 0.04) |
| PA1 | (10, 8.4933, 0.04) | (30, 8.4933, 0.04) | (50, 8.4933, 0.04) | (70, 8.4933, 0.04) | (90, 8.4933, 0.04) |
| PA2 | (10, 8.4933, 0.04) | (30, 8.4933, 0.04) | (50, 8.4933, 0.04) | (70, 8.4933, 0.04) | (90, 8.4933, 0.04) |
| OM1 | (10, 8.4933, 0.04) | (30, 8.4933, 0.04) | (50, 8.4933, 0.04) | (70, 8.4933, 0.04) | (90, 8.4933, 0.04) |
| OM2 | (10, 8.4933, 0.04) | (30, 8.4933, 0.04) | (50, 8.4933, 0.04) | (70, 8.4933, 0.04) | (90, 8.4933, 0.04) |
| DR1 | (10, 8.4933, 0.04) | (30, 8.4933, 0.04) | (50, 8.4933, 0.04) | (70, 8.4933, 0.04) | (90, 8.4933, 0.04) |
| DR2 | (10, 8.4933, 0.04) | (30, 8.4933, 0.04) | (50, 8.4933, 0.04) | (70, 8.4933, 0.04) | (90, 8.4933, 0.04) |
| DR3 | (10, 8.4933, 0.04) | (30, 8.4933, 0.04) | (50, 8.4933, 0.04) | (70, 8.4933, 0.04) | (90, 8.4933, 0.04) |
| DR4 | (10, 8.4933, 0.04) | (30, 8.4933, 0.04) | (50, 8.4933, 0.04) | (70, 8.4933, 0.04) | (90, 8.4933, 0.04) |
| Classification | Researcher | Government Sector | Design Sector | Construction Sector | Operation Sector |
|---|---|---|---|---|---|
| Number | 3 | 3 | 2 | 2 | 2 |
| E1 | E2 | E3 | E4 | E5 | E6 | E7 | E8 | E9 | E10 | E11 | E12 | Final Score | |
|---|---|---|---|---|---|---|---|---|---|---|---|---|---|
| ID1 | 80 | 94 | 85 | 91 | 93 | 82 | 86 | 84 | 76 | 77 | 70 | 73 | 82.7 |
| ID2 | 45 | 57 | 64 | 55 | 53 | 61 | 62 | 47 | 48 | 50 | 44 | 50 | 52.8 |
| ID3 | 56 | 69 | 54 | 62 | 66 | 63 | 68 | 49 | 48 | 60 | 47 | 61 | 58.7 |
| ID4 | 81 | 83 | 79 | 73 | 82 | 80 | 79 | 78 | 71 | 76 | 72 | 77 | 77.7 |
| ID5 | 50 | 50 | 53 | 52 | 47 | 44 | 48 | 55 | 56 | 51 | 53 | 53 | 51.2 |
| ID6 | 61 | 64 | 67 | 63 | 65 | 66 | 59 | 70 | 71 | 61 | 64 | 61 | 64.2 |
| DP1 | 71 | 73 | 65 | 74 | 78 | 80 | 64 | 72 | 71 | 73 | 72 | 68 | 71.7 |
| DP2 | 87 | 87 | 90 | 85 | 93 | 91 | 80 | 82 | 86 | 87 | 86 | 85 | 86.6 |
| DP3 | 56 | 54 | 51 | 61 | 54 | 53 | 57 | 62 | 66 | 58 | 62 | 60 | 57.7 |
| DP4 | 75 | 77 | 69 | 72 | 80 | 78 | 81 | 74 | 72 | 72 | 76 | 77 | 75.3 |
| DP5 | 69 | 72 | 68 | 72 | 70 | 75 | 74 | 78 | 73 | 74 | 69 | 73 | 72.1 |
| DP6 | 51 | 51 | 53 | 52 | 56 | 49 | 57 | 51 | 48 | 47 | 49 | 53 | 51.3 |
| PT1 | 51 | 57 | 60 | 54 | 49 | 57 | 62 | 52 | 53 | 55 | 51 | 53 | 54.3 |
| PT2 | 53 | 56 | 62 | 54 | 54 | 51 | 60 | 52 | 58 | 57 | 53 | 54 | 55.1 |
| PT3 | 70 | 70 | 71 | 68 | 68 | 73 | 72 | 77 | 69 | 65 | 70 | 72 | 70.3 |
| PT4 | 62 | 64 | 64 | 67 | 68 | 59 | 67 | 70 | 72 | 68 | 66 | 67 | 66.3 |
| PT5 | 57 | 52 | 61 | 54 | 60 | 53 | 55 | 62 | 65 | 57 | 63 | 65 | 58.7 |
| PT6 | 54 | 54 | 59 | 56 | 61 | 57 | 58 | 60 | 57 | 62 | 64 | 62 | 58.6 |
| CS1 | 50 | 55 | 53 | 60 | 56 | 54 | 57 | 63 | 60 | 59 | 58 | 60 | 57.2 |
| CS2 | 49 | 51 | 52 | 63 | 56 | 55 | 61 | 62 | 48 | 51 | 60 | 56 | 55.3 |
| CS3 | 67 | 65 | 68 | 74 | 76 | 74 | 74 | 75 | 69 | 70 | 71 | 76 | 71.8 |
| CS4 | 45 | 47 | 46 | 47 | 48 | 47 | 46 | 45 | 44 | 45 | 45 | 45 | 45.8 |
| CS5 | 51 | 55 | 51 | 56 | 53 | 55 | 57 | 53 | 52 | 56 | 53 | 49 | 53.5 |
| PA1 | 73 | 68 | 71 | 72 | 68 | 75 | 72 | 73 | 69 | 73 | 75 | 70 | 71.6 |
| PA2 | 64 | 63 | 65 | 67 | 68 | 70 | 73 | 69 | 69 | 71 | 71 | 73 | 68.7 |
| OM1 | 50 | 55 | 51 | 52 | 49 | 47 | 61 | 63 | 48 | 57 | 56 | 54 | 53.3 |
| OM2 | 51 | 52 | 61 | 46 | 47 | 48 | 59 | 58 | 55 | 51 | 55 | 52 | 52.8 |
| DR1 | 60 | 59 | 61 | 63 | 57 | 56 | 54 | 55 | 54 | 51 | 55 | 58 | 56.9 |
| DR2 | 58 | 60 | 57 | 51 | 53 | 62 | 67 | 55 | 59 | 61 | 59 | 58 | 58.2 |
| DR3 | 54 | 54 | 49 | 60 | 56 | 58 | 48 | 62 | 55 | 55 | 56 | 58 | 55.5 |
| DR4 | 33 | 34 | 31 | 34 | 36 | 34 | 41 | 35 | 35 | 35 | 33 | 32 | 34.1 |
| Highest Risk | Higher Risk | General Risk | Tolerable Risk | Lower Risk | Max | Subordination Level | |
|---|---|---|---|---|---|---|---|
| ID | 0.000000 | 0.002666 | 0.097040 | 0.088257 | 0.038493 | 0.097040 | III |
| DP | 0.000000 | 0.001848 | 0.061843 | 0.111256 | 0.042632 | 0.111256 | IV |
| PT | 0.000000 | 0.000837 | 0.072518 | 0.076819 | 0.002440 | 0.076819 | IV |
| CS | 0.000006 | 0.007711 | 0.124568 | 0.071508 | 0.004595 | 0.124568 | III |
| PA | 0.000000 | 0.000001 | 0.005357 | 0.080743 | 0.005542 | 0.080743 | IV |
| OM | 0.000000 | 0.002357 | 0.089309 | 0.013061 | 0.000007 | 0.089309 | III |
| DR | 0.000343 | 0.016481 | 0.040363 | 0.015740 | 0.000029 | 0.040363 | III |
| Comprehensive correlation degree | 0.000025 | 0.003935 | 0.079598 | 0.075108 | 0.018512 | 0.079598 | III |
Disclaimer/Publisher’s Note: The statements, opinions and data contained in all publications are solely those of the individual author(s) and contributor(s) and not of MDPI and/or the editor(s). MDPI and/or the editor(s) disclaim responsibility for any injury to people or property resulting from any ideas, methods, instructions or products referred to in the content. |
© 2023 by the authors. Licensee MDPI, Basel, Switzerland. This article is an open access article distributed under the terms and conditions of the Creative Commons Attribution (CC BY) license (https://creativecommons.org/licenses/by/4.0/).
Share and Cite
Zhang, J.; Wei, W.; Chen, L.; Jiang, Z. Evaluation of Hidden Cost Risk of Prefabricated Construction Based on SEM-MEECM. Appl. Sci. 2023, 13, 7902. https://doi.org/10.3390/app13137902
Zhang J, Wei W, Chen L, Jiang Z. Evaluation of Hidden Cost Risk of Prefabricated Construction Based on SEM-MEECM. Applied Sciences. 2023; 13(13):7902. https://doi.org/10.3390/app13137902
Chicago/Turabian StyleZhang, Jiehui, Wei Wei, Leyan Chen, and Zehao Jiang. 2023. "Evaluation of Hidden Cost Risk of Prefabricated Construction Based on SEM-MEECM" Applied Sciences 13, no. 13: 7902. https://doi.org/10.3390/app13137902