Article

Water and Sediment Quality Changes in Mangrove Systems with Shrimp Farms in the Northern Ecuadorean Coast

by
Eduardo Rebolledo Monsalve
1,2,* and
Lita Verduga Vergara
2
1
Programa Cooperativo Doctorado en Acuicultura, Pontificia Universidad Católica de Valparaíso, Valparaíso 2340000, Chile
2
Área de Industria, Construcción y Ambiente, Pontificia Universidad Católica del Ecuador, Sede Esmeraldas 080150, Ecuador
*
Author to whom correspondence should be addressed.
Appl. Sci. 2023, 13(13), 7749; https://doi.org/10.3390/app13137749
Submission received: 23 March 2023 / Revised: 23 June 2023 / Accepted: 23 June 2023 / Published: 30 June 2023
(This article belongs to the Special Issue Aquatic Toxicology and Aquaculture: Questions and Advances)

Abstract

:
The environmental quality of mangroves is influenced by multiple factors, among which shrimp aquaculture currently plays a major role. This study describes the alterations of natural conditions of mangrove systems that house shrimp farms in the northern Ecuadorean coast. Water, sediment quality and the structure of benthic assemblages of four sectors with different proportions of mangroves and shrimp ponds are described. The samples were collected at the confluence of mangrove drainages or tidal creeks, as well as in the modified drainages for shrimp farm infrastructures towards navigable channels, during the dry and rainy seasons. Shrimp farm drainage water had a 17% higher dissolved oxygen concentration and 2.5 times higher total ammonium and phosphorus compared to mangrove drainage water. The sediment in the latter decreased their total organic matter and nitrogen content by 44% and 53%, respectively, slightly increasing the pH level and increasing the ammonium content by 93%. Furthermore, the redox profiles were different between the types of drainages. The soft-bottom benthic assemblages involved 56 species in the study area and exhibited a variety of sectoral structures, with better indicators of ecological status in sectors with fewer shrimp farms. Finally, improvements are suggested for monitoring the environmental quality of shrimp farms in Ecuadorean mangrove systems.

1. Introduction

The whiteleg shrimp Penaeus vannamei (Boone, 1831), which is the most cultivated aquaculture resource in the world, began its production with 10 t in Ecuador in 1968 [1] reaching 5,812,180 t produced by 45 nations in 2020. Until 2002, its records occurred exclusively from brackish waters. Since then, it was also recorded from freshwater and, as of 2015, it was reported from the marine environment [2].
The rapid expansion in shrimp farming has caused side effects however, such as inadequate culture technology, disease outbreaks, water pollution, and other environmental degradation-related problems [3]. Shrimp farming is an industry in tropical and subtropical climate countries [4]; it plays a crucial role in mangrove area reduction, as exemplified by numerous studies in Asia and Latin America [5].
From 1990 to 2020, shrimp and other forms of aquaculture have driven the conversion of 38% and 14% of mangrove areas, respectively, globally [6,7].
Consolidated studies reported 137,600 km2 of mangroves for 2010 [8] and 147,000 km2 for 2020 [9], as well as a decrease of 8600 km2 in global mangrove coverage between 1990 and 2020 [10]. In Ecuador, a national loss of mangrove areas of 43% was estimated between 1969 and 1999 [11], which would have extended up to 70% by 2018 [12].
Multiple studies describe the cumulative effects of the transformation and fragmentation of mangroves on shrimp infrastructure [13,14]. Shrimp farming involves the loss of ecological and socioeconomic functions of mangrove ecosystems, including changes in hydrology [4], salinization [15,16], the introduction of non-native species [17], and disease outbreaks [18,19]. Other issues include the pollution from effluents, chemicals and drugs [20], the use of wild fish for feed [21], the capture of wild shrimp seed and the loss of livelihoods and social conflicts which may arise therof [22,23]. Due to growing concern about climate change, several studies have quantified the effects of the mangrove conversion to shrimp ponds on the soil carbon stocks [24] and greenhouse gas emissions [25,26].
Shrimp farming employs ponds with a flow-through system that uses water exchange rates to maintain optimal hydrological and biological parameters for the shrimp culture [27]. The water used in the ponds will have physicochemical and biological alterations since effluents of shrimp farms add nutrients, organic matter and suspended solids to the receiving water bodies [28,29].
Pond sediments therefore were high in the concentration of nutrients, organic matter, and the density of microorganisms throughout the water column by several orders of magnitude [30]. A large portion of the labile sediments from each productive cycle will be released to the environment during the exchange of water discharge and after pond harvest [31,32]. Thus, the effects of water discharge, along with the loss of mangroves, becomes the main eco-hydrological impact on the site of an operating shrimp farm [33].
Several studies report changes to sectors associated with shrimp effluents in the composition and content of organic matter and nutrients in the receiving water bodies [34,35,36,37,38]. Additionally, a decrease in dissolved oxygen concentration [39,40], and an increase in trace compounds have also been reported [41,42,43,44]. These effects extend to sediments associated with shrimp effluents in concern with the level oforganic compounds [45,46,47,48,49,50] and the content of metalloids [51,52,53], which influence the assembly of benthic organisms [54,55].
Knowledge of the impacts of aquaculture facilities on mangroves led to a global ban on aquaculture farm facilities in mangroves and coastal wetlands. It also led to the requirement in certain countries to implement crop water treatment systems prior to discharge. This measure is theoretically required in Ecuador, given that in 2021, it was the largest producer of whiteleg shrimp farmed in brackish waters, totaling at least 2150 farms with an area of 72.598 ha located in sectors of beaches and bays [56].
The present study describes the alterations of the natural conditions of Ecuadorean mangrove systems that house shrimp farms to establish the chemical state of waters and sediments, as well as the ecological state of the benthic assemblages in areas near shrimp farms, which are currently not required to include water treatment systems in Ecuador.

2. Materials and Methods
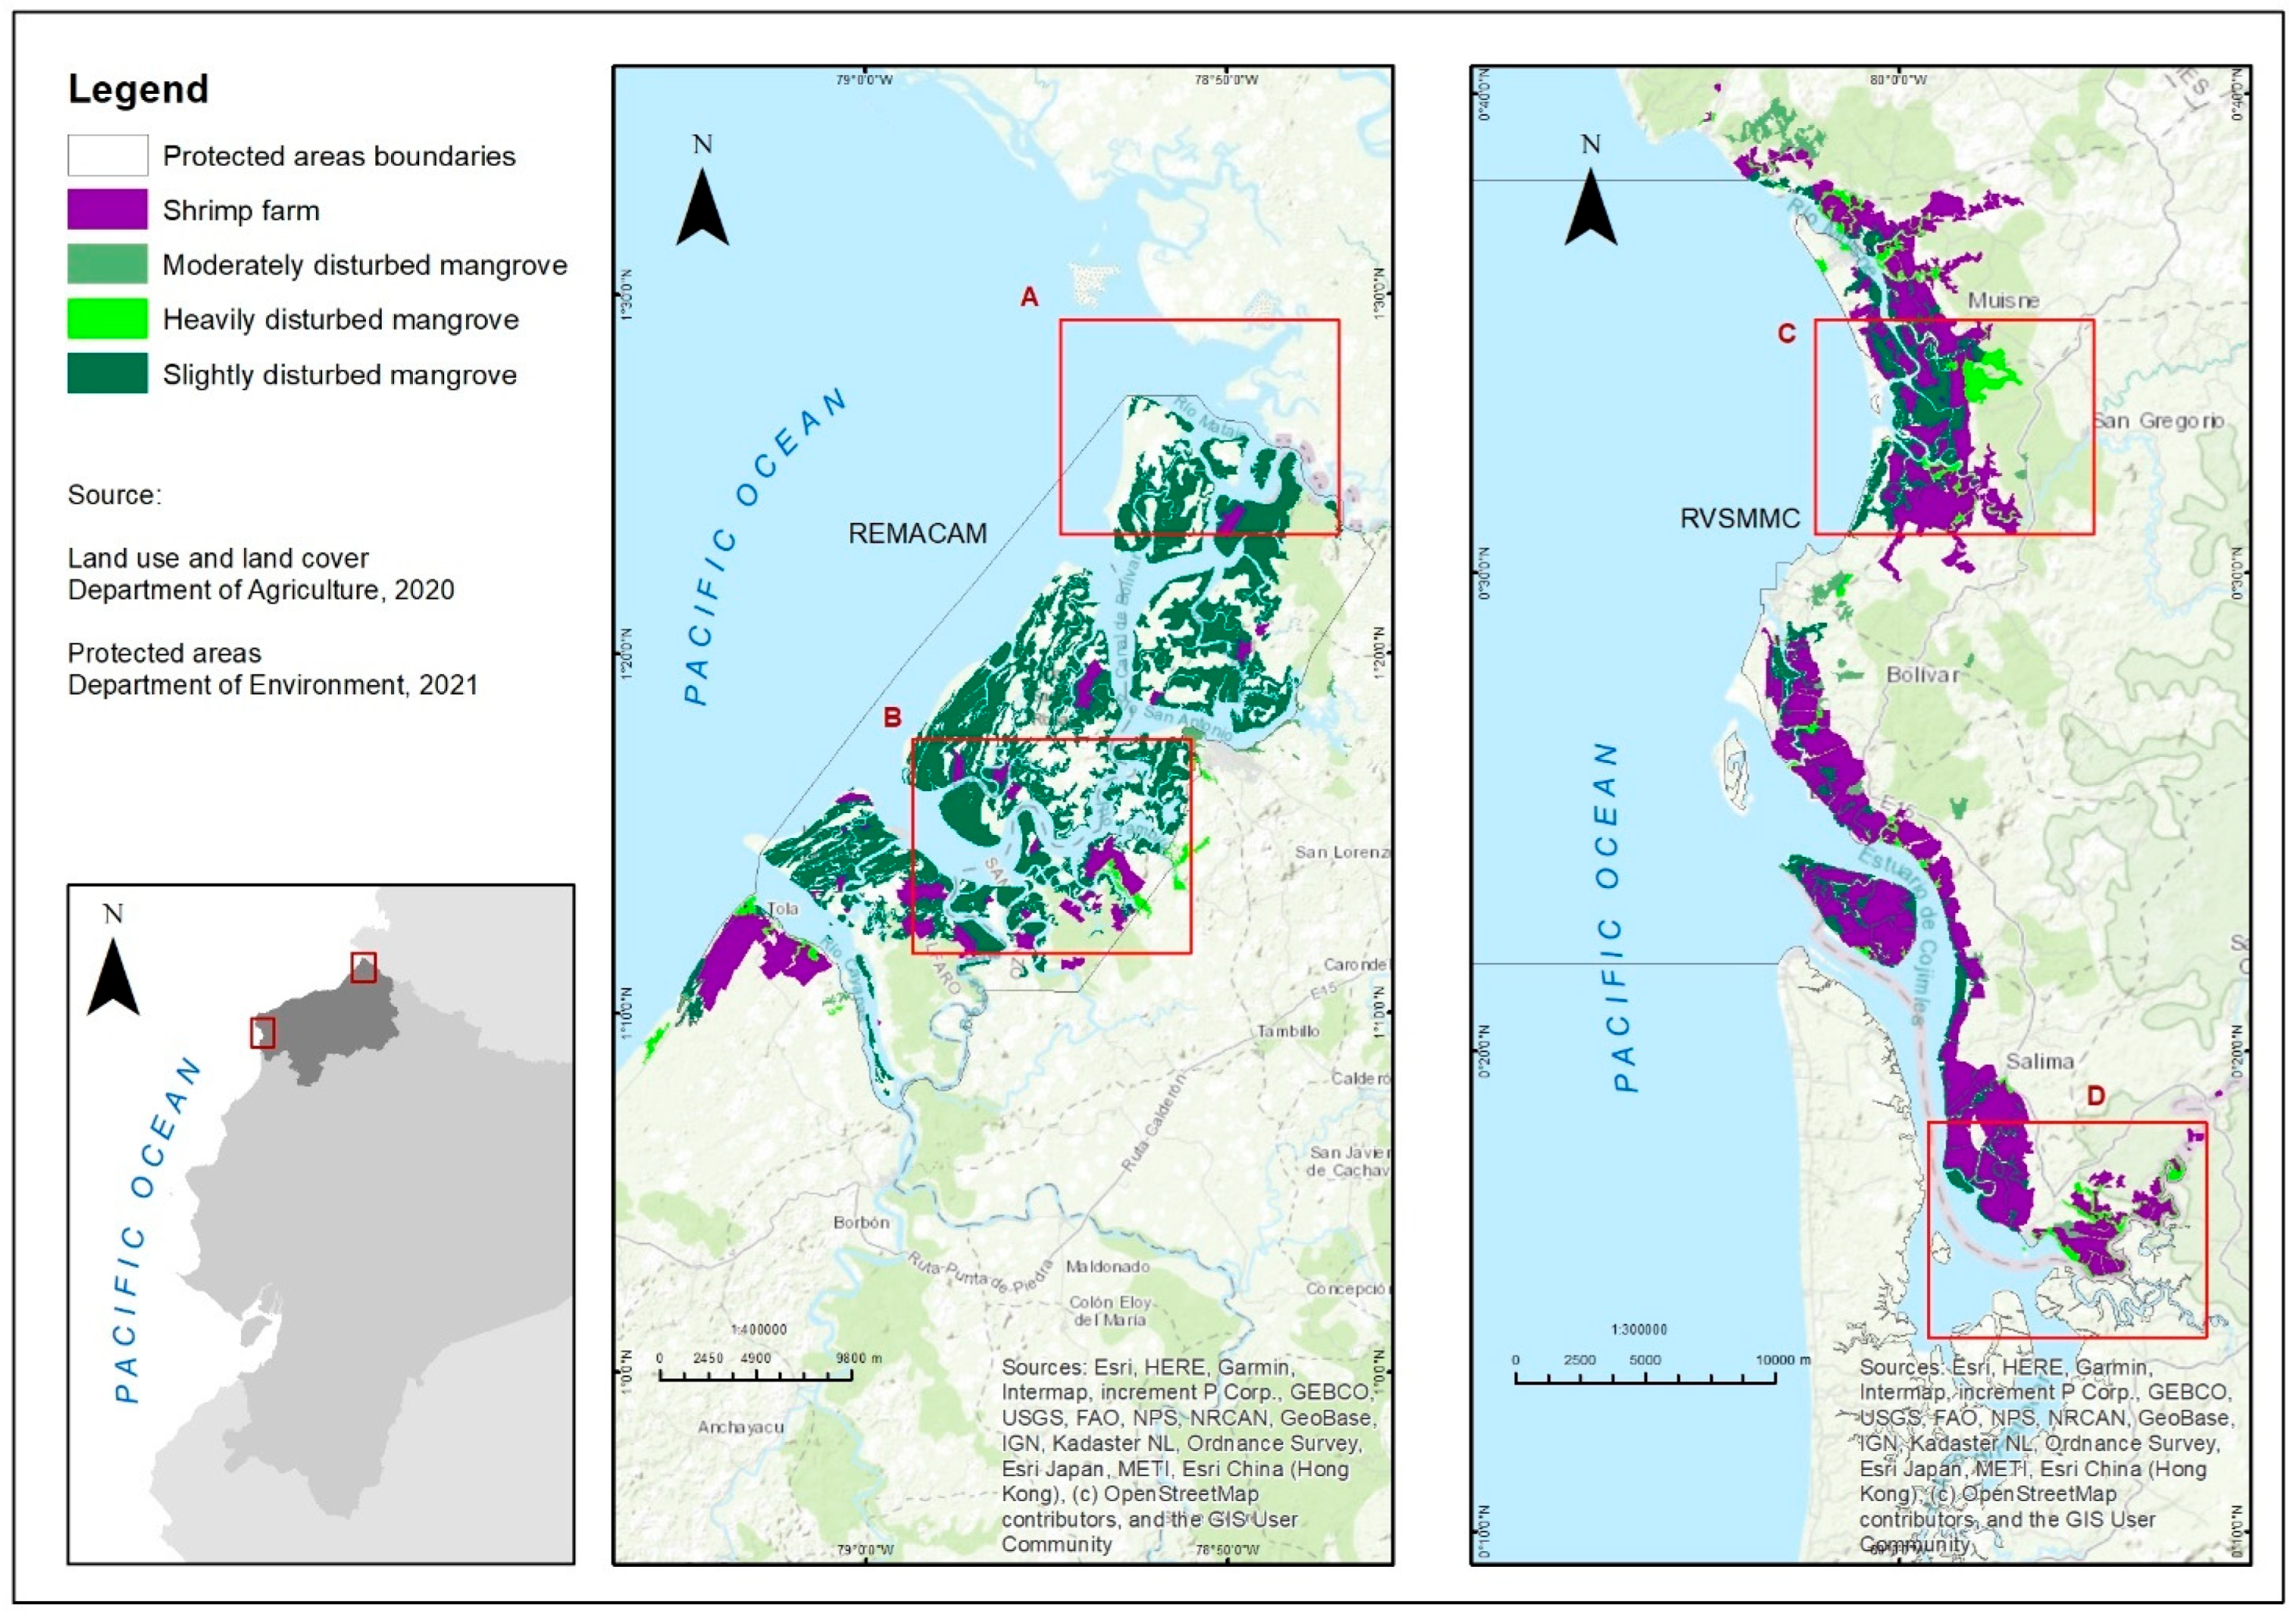
2.1. Study Area

This research was carried out in two Ecuadorean coastal systems with mangrove reserves in the province of Esmeraldas (Figure 1): the deltaic system the Ecological Reserve Manglares Cayapas Mataje REMACAM (REM) located to the north on the border with Colombia, and the estuarine system the Mangroves Estuary of the Muisne River Wildlife Refuge RVSMMC (RVS) [57] located to the south of the province of Esmeraldas. In each system, two main sectors were chosen: Palma Real (PR) and Tambillo (TA) in REM, and Cojimíes (CO) and Muisne (MU) in RVS. Sectors were chosen based on their different levels of conversion of mangroves to shrimp farms in 2020 [58].

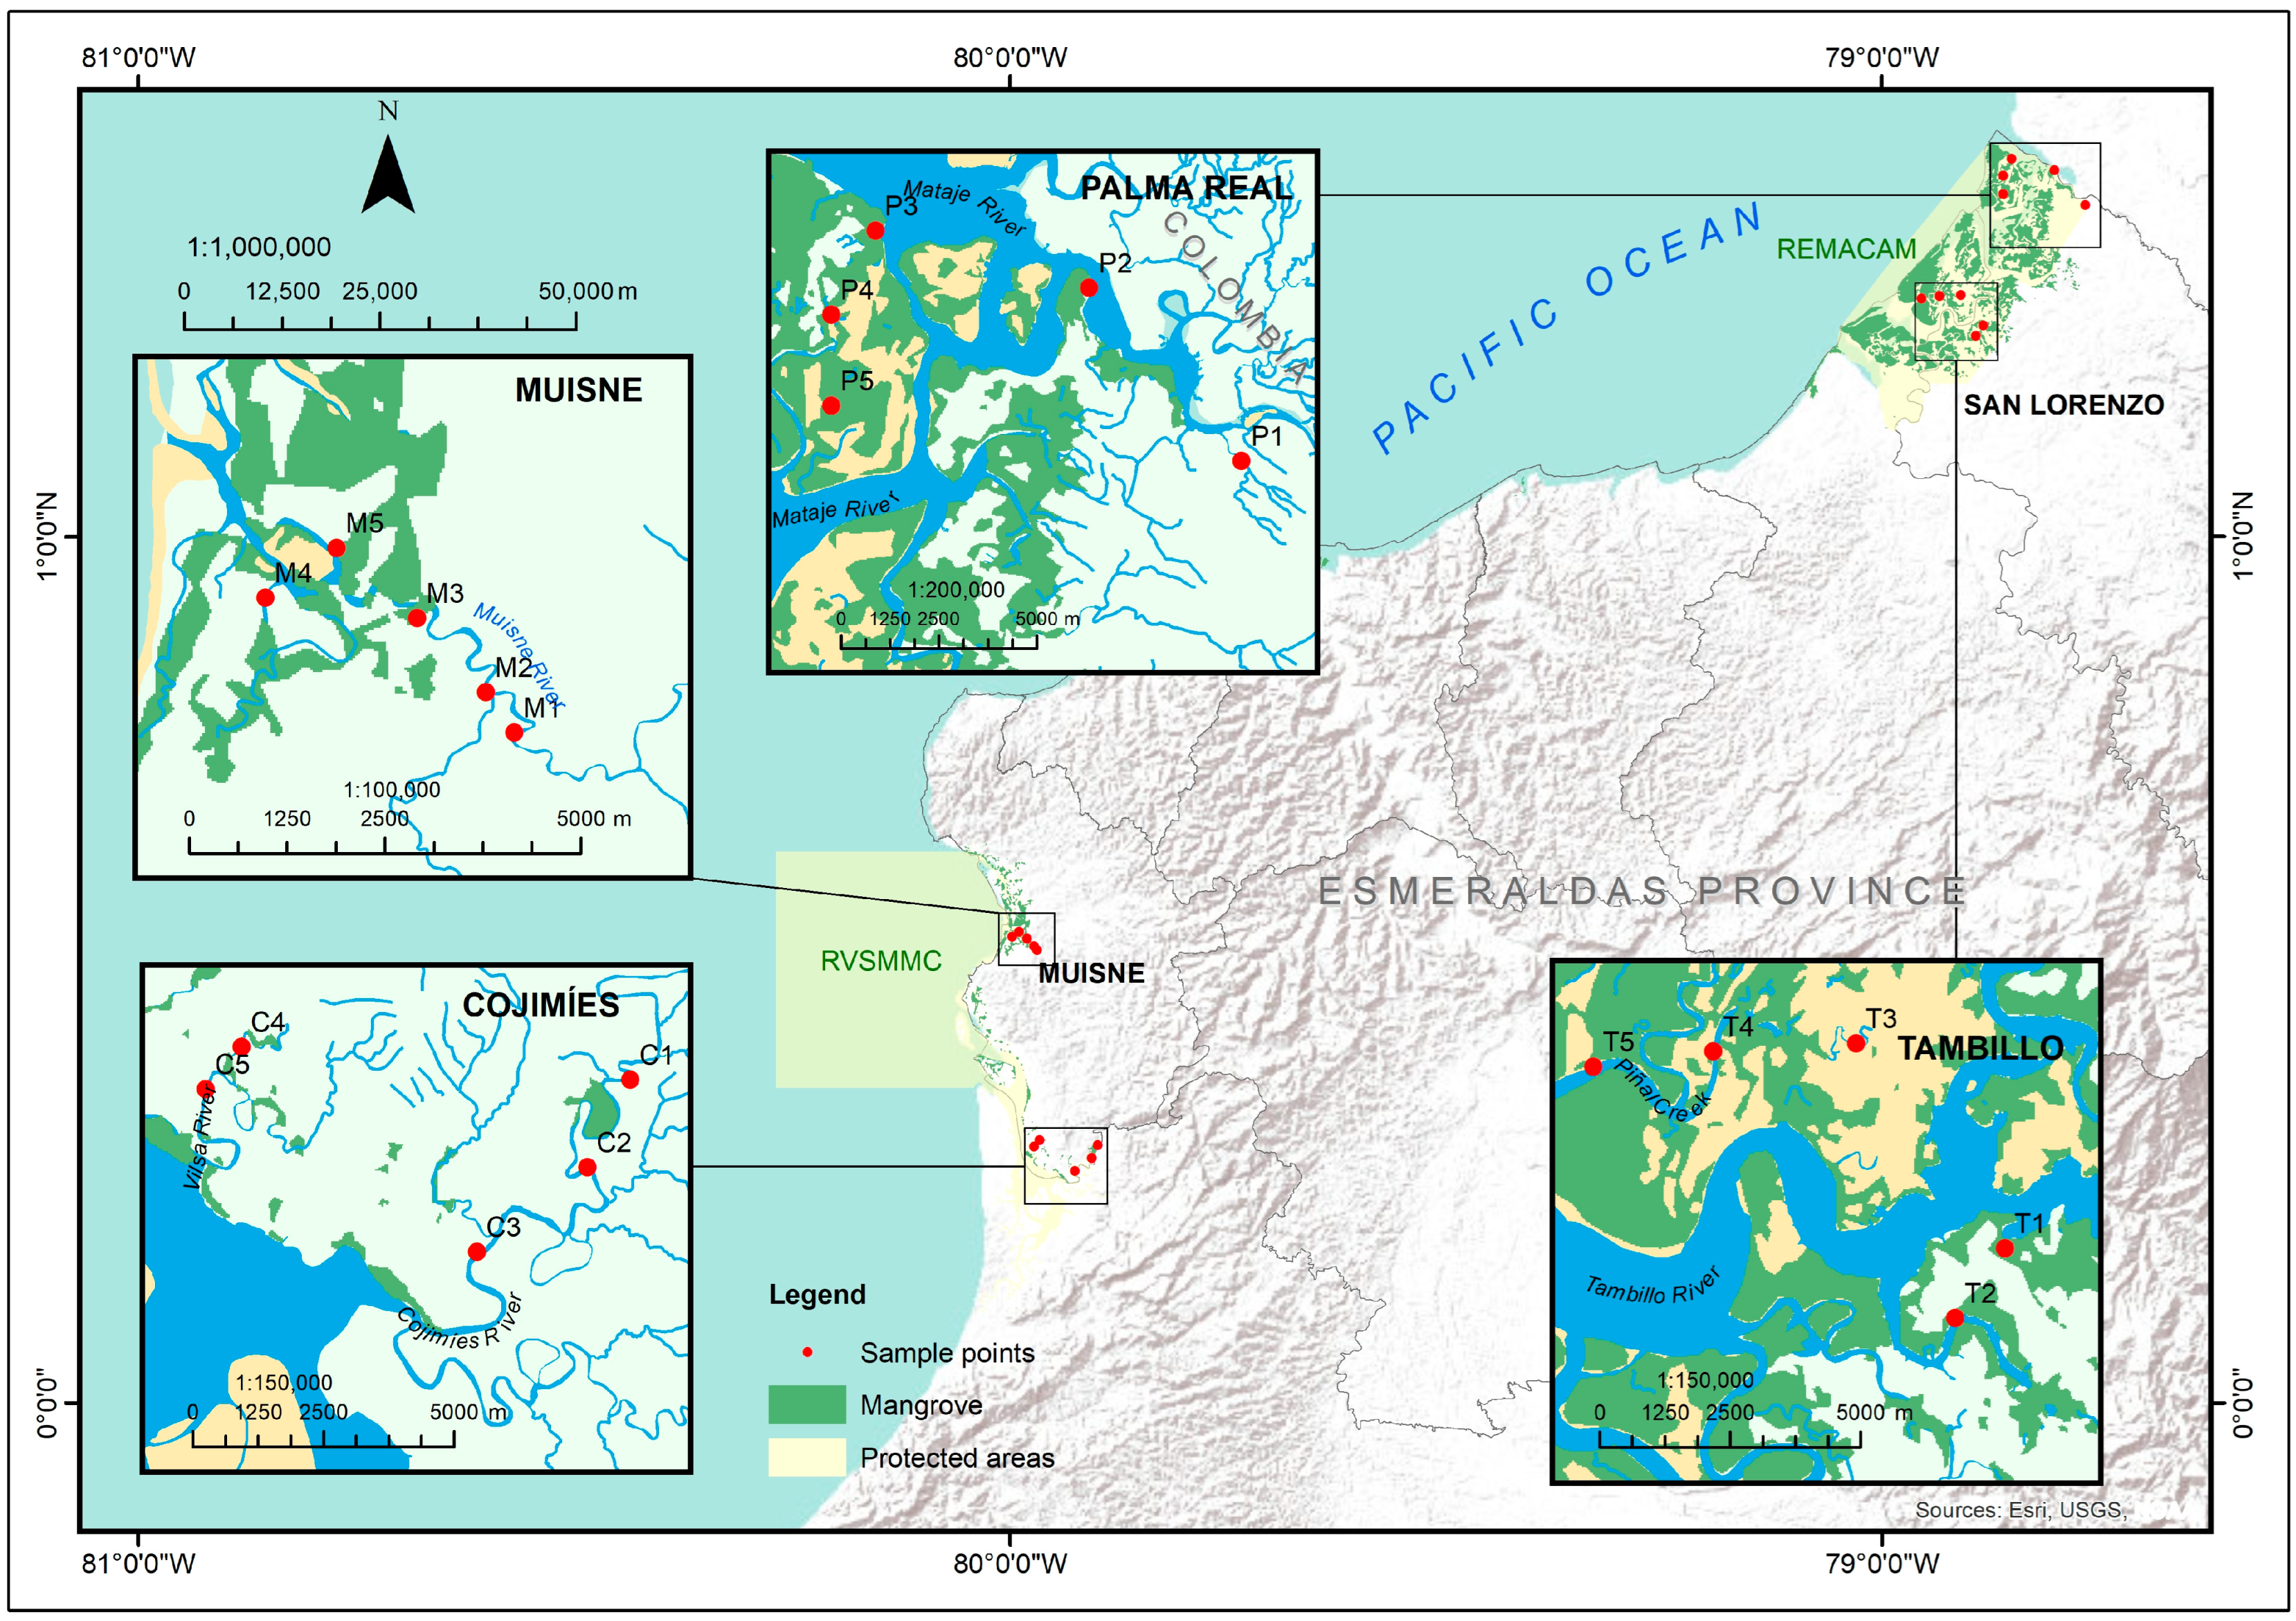
2.2. Location of Sampling Sites

The selection of sites was carried out considering the greater presence of conglomerates of aquaculture ponds in conjunction with mangrove formations. Spatial data were based on the Land Use and Cover data updated in 2020 by the Ministry of Agriculture and Livestock of Ecuador and was analyzed with the ArcGIS® software by ESRI. Conglomerates of shrimp ponds and mangroves were first detected, and subsequently, the water bodies to be evaluated were selected. The length of the water bodies was considered from upstream of the shrimp/mangrove facilities to their mouth toward a main transition body. During the initial navigational observation, similar drainages were located and distributed in the defined sections. Five sampling sites were allocated in each principal sector (Figure 2). The sampling sites corresponded to the confluence of natural drainages or tidal creeks entering the mangrove forest (MG) towards navigable channels, and in similar drainages which transformed into shrimp farm (SF) infrastructures such as water discharge gates and harvesting that are exemplified in Figure 3.

2.3. Water Analysis

The samplings were carried out during periods of low tide in November and December 2020, corresponding to the dry season of the Ecuadorean coast, and during June 2021, near the end of the rainy season. At each site, the water quality parameters of temperature (°C), conductivity (µS/cm), salinity (ppt), dissolved oxygen (mg O2/L), and pH were recorded with a HQ40d multiparameter sensor (HACH Company, Loveland, CO, USA). Additionally, a 3 L sample of subsurface water was collected with a Van Dorn ABT-VD-04 Bottle (Aquatic Biotechnology, Cadiz, Spain) by filling plastic bottles without the addition of fixing agents and kept in a cooler until transported to the aquaculture reference laboratory of the National Center for Aquaculture and Marine Research (CENAIM ESPOL) within less than 24 h after collection. The content of the following chemical parameters was determined: nitrate NO3, nitrite NO2, ammonium NH4+, total Kjeldahl nitrogen (TKN), phosphate PO43−, total phosphorus, solids in suspension SS, total settleable solids SST and the biochemical oxygen demand in five days BDO5 expressed in mg/L, while chlorophyll a was recorded in µg/L. The measurements were made following protocols described in the texts “Water Quality and Pond Soil Analysis for Aquaculture” [59] and “Standard Methods for the Examination of Water and Wastewater” [60].

2.4. Sediment Analysis

Sediment samples (1 kg of the first three superficial centimeters) were obtained with a 0.08 m2 Van Been-type dredge and were transported to the GRUENTEC Cia. Ltd.a. laboratory, which recorded pH (U.S. EPA 9045 D/SM 4500 H/MM-AG/S-01) and conductivity (EPA 9050 A/MM-AG/S-02). The content of nitrate, nitrite, phosphate (EPA 300.1/MM-S-37), ammonium (SM 4500 Norg/MM-AG-15), and the metals copper, lead, mercury and zinc (EPA 6020 A/MM-AG/S-39) was determined in wet weight. The total Kjeldahl nitrogen content (HACH 8038/MM-S-35) was determined in dry weight.
A second sample of sediments from columnar cores was obtained with transparent polycarbonate tubes of a 65 cm length and a 3 inchs internal diameter, connected to a one-way valve to generate suction when lifted. The samples were sealed and kept cold during their transfer to the laboratory, where they were refrigerated. Each cylinder of sediment was sectioned every 2 cm using a plunger to move the sample, registering for each stratum the oxidation-reduction potential (mV) with a HACH HQ40d redox sensor and adjusting the registered values with a correction factor of 200 mV. These sections were then dried at 60 °C for 24 h, homogenized in porcelain mortars after removing major residues such as fragments of wood, leaves, rocks, concrete and mollusk shells when sieved at 300 µm. Subsequently, they were incinerated at 550 °C for 5 h in a THERMO muffle, determining the content of Total Organic Matter (TOM) as a function of the decrease in mass by means of ignition [61].

2.5. Benthic Assemblage Analysis

The benthic assemblages analyzed came from the content of three dredges that were deposited in a 20 L bucket. The content was reduced by washing with surrounding water inside a 300 µm nitex sleeve and being deposited in 0.75 L plastic bottles. The bottles were left with water for 25 min to allow the collected organisms to relax and extend the useful structures for their later identification. Afterward, the excess water was replaced by 70% ethyl alcohol plus 3 mL of 37% formaldehyde as fixing agents. In the laboratory, the samples were spread on white trays with good lighting, removing the visible organisms and saving them in 60 mL flasks. The identification and count were carried out with a 1.3 MP Dinolite -Premier digital magnifying glass (AnMo Electronics Corporation Taipei City, China) and the use of keys, reaching the lowest possible taxonomic level. The descriptors of the organisms’ assemblages included: abundance, species richness, dominance, the Shannon-Weaner H’ index and the AZTI Marine Biotic Index AMBI developed by the AZTI institute [62]. Its multivariate application M-AMBI [63,64] was carried out through the free software PAST3x and AZTI-AMBI.

2.6. Data Treatment

The data obtained were grouped by sampling sectors: Palma Real (PR), Tambillo (TA), Muisne (MU), and Cojimíes (CO); main mangrove systems: REMACAM and RVSMMC; drain type: Natural drainages or mangroves (MG) and Modified drainages to shrimp farm facilities (SF); in addition to the Summer (SU) and Winter (WI) sampling period. After checking for normality using the Shapiro-Wilk’s test [65] and homoscedasticity of variables using the Fligner-Killeen test [66], one-way ANOVAS were performed among the different contrasting categories without using more contrasting ways, since not all the grouping categories were shared among the four main sectors. Palma real presented exclusively natural drainages (MG) and Muisne modified drainages toward shrimp farms (SF). To determine between which compartments significant differences occurred, Tukey’s a posteriori tests were performed, and Holm’s for the Kruskal-Wallis analyses with at least 95% confidence level.
Additionally, all the variables were processed through multivariate analysis of PCA principal components and CCA canonical correspondence analysis to identify variables that better explained the observed changes and their relationship with the benthic species shared in the four sectors. Given the different magnitudes of variables, these were scaled [67,68]. To observe the formation of conglomerates of benthic assemblages, an n-MDS analysis was performed on the Bray Curtis similarity, exclusively integrating sediment quality variables using the free software PAST 3x-The Past of the Future (Natural History Museum, Oslo, Norwey) [69] and Rstudio 4.1.2 (Integrating Development Environment for R, Boston MA, USA) [70].

3. Results

3.1. Water Quality

Table 1 shows the mean values of water quality variables grouped by main sectors, types of drainage, and seasonality. Water temperature differed among sectors (KW = 21.949, p < 0.01) and types of drainage (KW = 6.743, p < 0.01). These differences were attributed to warmer water temperature in REMACAM, located to the north of Esmeraldas. REMACAM includes eight of the nine sites corresponding to natural drainages, RVSMMC includes nine of the eleven shrimp drainages in this study. There were no temperature differences among the seasons. (KW = 3.387, p > 0.05).
There were no significative differences in the salinity between systems (KW = 0.77359, p > 0.05) and sectors (KW = 4.5588, p > 0.05). Muisne exhibited the highest salinity variation (15,507 ± 11,075 ppt).
Dissolved oxygen levels did not differ among sectors (KW = 0.30855, p > 0.05) and sampling periods (KW = 3.0769, p > 0.05). However, the SF drains with a mean of 5.16 ± 1.37 mg O2/L exceeded the natural MG drains (KW = 4.6878, p < 0.05) with a mean of 4.19 ±1.26 mg O2/L. The biochemical oxygen demand in five days (BOD5) presented differences among sectors (F3,36 = 2.98 p < 0.01) that were restricted towards Cojimíes (8.21 ± 2.75 mg O2/L) and Muisne (12.16 ± 4.21 mg O2/L), having robust differences between sampling periods (F1,38 = 11.25, p < 0.01), increasing the BOD5 in summer periods (13.65 ± 6.49 mg O2/L) and improving the condition of the water in winter (8.36 ± 2.74 mg O2/L) without differing between estuaries and type of drainage.
The pH exhibited differences among sectors (F3,33 = 6.37, p < 0.01) which occurred between Muisne (7.74 ± 0.16) and Cojimíes (7.45 ± 0.36) with respect to Tambillo with the lowest pH of 6.90 ± 0.51. In addition, the water from natural drainages was more acidic than the water from shrimp drainages (F1,35 = 4.301, p < 0.05). The differences in pH were amplified when considering the main systems (F1,35 = 10.46, p < 0.01) and seasonality (F1,35 = 34.23, p < 0.001), observing a decrease in the pH from a summer value (7.74 ± 0.17) compared to winter (7.08 ± 0.43), the rainy and warm period of the Ecuadorean coast. No differences in Redox values were found among sectors (F3,36 = 2.858, p > 0.05), types of drainage (F1,38 = 2.306, p > 0.05) and sampling periods (F1,38 = 1.698, p > 0.05).
The greatest differences occurred in organic variables, with subtle differences in ammonium content when considering sectors (F3,36 = 2.832, p < 0.01), which extends to main systems (F1,38 = 8.787, p < 0.01) and drainage type (F1,38 = 8.459, p < 0.01), where RVS doubles REM. The ammonium content increased during the summer months (F1,38 = 4.688, p < 0.05).
The nitrate content differed among sectors (F3,36 = 6.65, p < 0.01) with the highest record in Cojimíes (0.270 ± 0.237 mg/L) that exceeded Tambillo (0.051 ± 0.058 mg/L) and Palma Real (0.034 ± 0.031 mg/L). The difference was greater between main systems (F1,38 = 14.38, p < 0.001). The nitrate content in RVS (0.21 ± 0.18 mg/L) was four times the value observed in REM (0.04 ± 0.05 mg/L). However, there were no differences between types of drainage (F1,38 = 2.05, p > 0.05) or sampling period (F1,38 = 0.465, p > 0.05). Likewise, differences in nitrite levels among sectors were also found (F3,36 = 4.45, p < 0.01). Cojimíes nitrate levels (0.130 ± 0.132 mg/L) were higher than Palma Real (0.018 ± 0.010 mg/L) and Muisne (0.022 ± 0.009 mg/L), while no differences between estuaries (F1,38 = 1.986, p > 0.05), sampling seasons (F1,38 = 1.578, p > 0.05) and type of drainage (F1,38 = 0.031, p > 0.05) were observed.
The total nitrogen in water exhibited differences by sectors (F3,36 = 7.575, p < 0.001) which occurred between Tambillo, with the lowest nitrogen content (2.830 ± 0.338 mg/L), and Muisne (4.567 ± 1.853 mg/L) and Cojimíes (5.726 ± 1.327 mg/L). The differences were amplified between main systems (F1,38 = 12.97, p < 0.001), without differing between Drainage Types (F1,38 = 2.428, p > 0.05) or seasons (F1,38 = 3.431, p > 0.05).
The Phosphate content showed marked differences by sector (KW = 6.55, p < 0.001) in Muisne (0.20 ± 0.08 mg/L), exceeding the values observed at Cojimíes (0.12 ± 0.04 mg/L), Palma Real (0.09 ± 0.02 mg/L) and Tambillo (0.07 ± 0.03 mg/L). Significant differences were observed in this parameter between the main systems (KW = 19.001, p < 0.001) and type of drainage (KW = 4.667, p < 0.05), where shrimp drainages (0.147 ± 0.129 mg/L) exceeded the value in natural drainages (0.060 ± 0.059 mg/L), but not observed between seasons. Total phosphorus content differed between the estuaries (KW = 14.877, p < 0.05) and drainage type (KW = 6.936, p < 0.05). The phosphorus content in RVS (0.16 ± 0.11 mg/L) surpassed REM (0.07 ± 0.10 mg/L), without differing between seasons.
The concentration of chlorophyll a differed between the type of drainage (KW = 8.314, p < 0.01), with the values for modified drainages (31.165 ± 13.87 µg/L) exceeding the values observed in natural drainages (17.76 ± 9.31 µg/L). No differences by sector (KW = 3.8363, p > 0.05), larger systems (KW = 1.778, p > 0.05) or sampling periods (KW = 0.38033, p > 0.05) were found. Finally, the content fo settleable solids only varied by season (KW = 9.824, p < 0.01), doubling the sedimentation during the summer (73.86 ± 50.98 mg/L) with respect to the winter period (34 ± 15.47 mg/L).

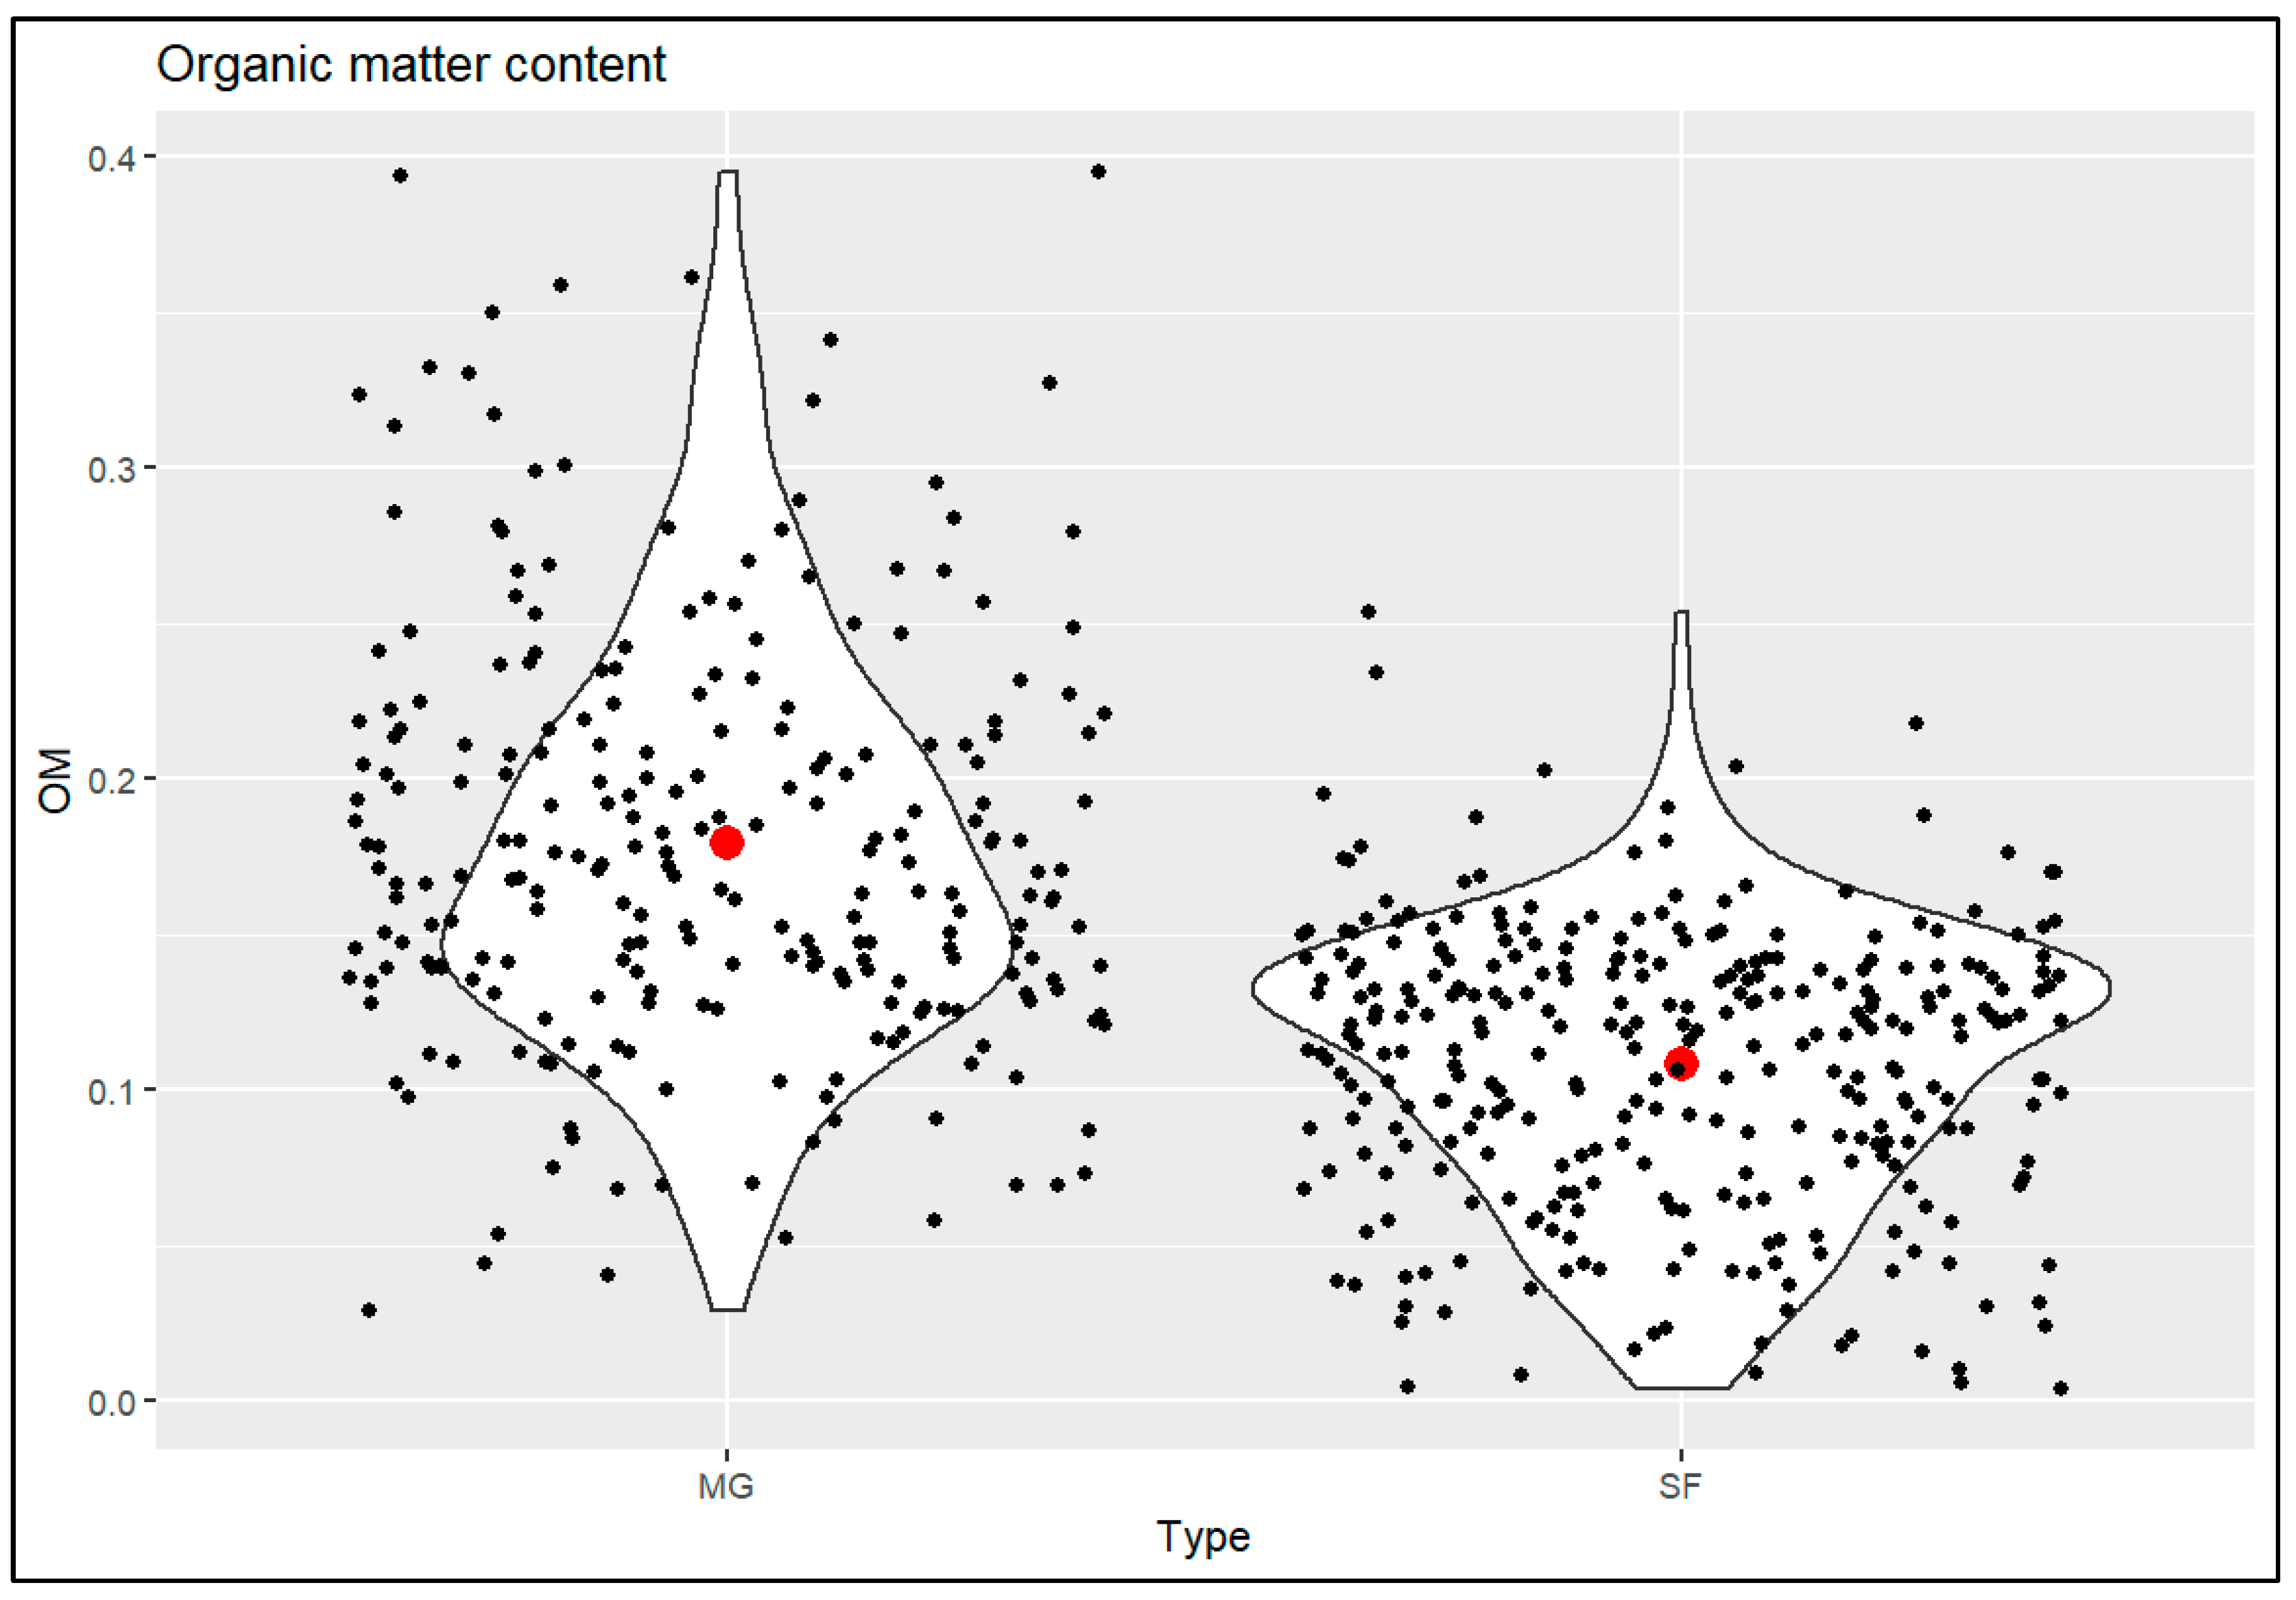
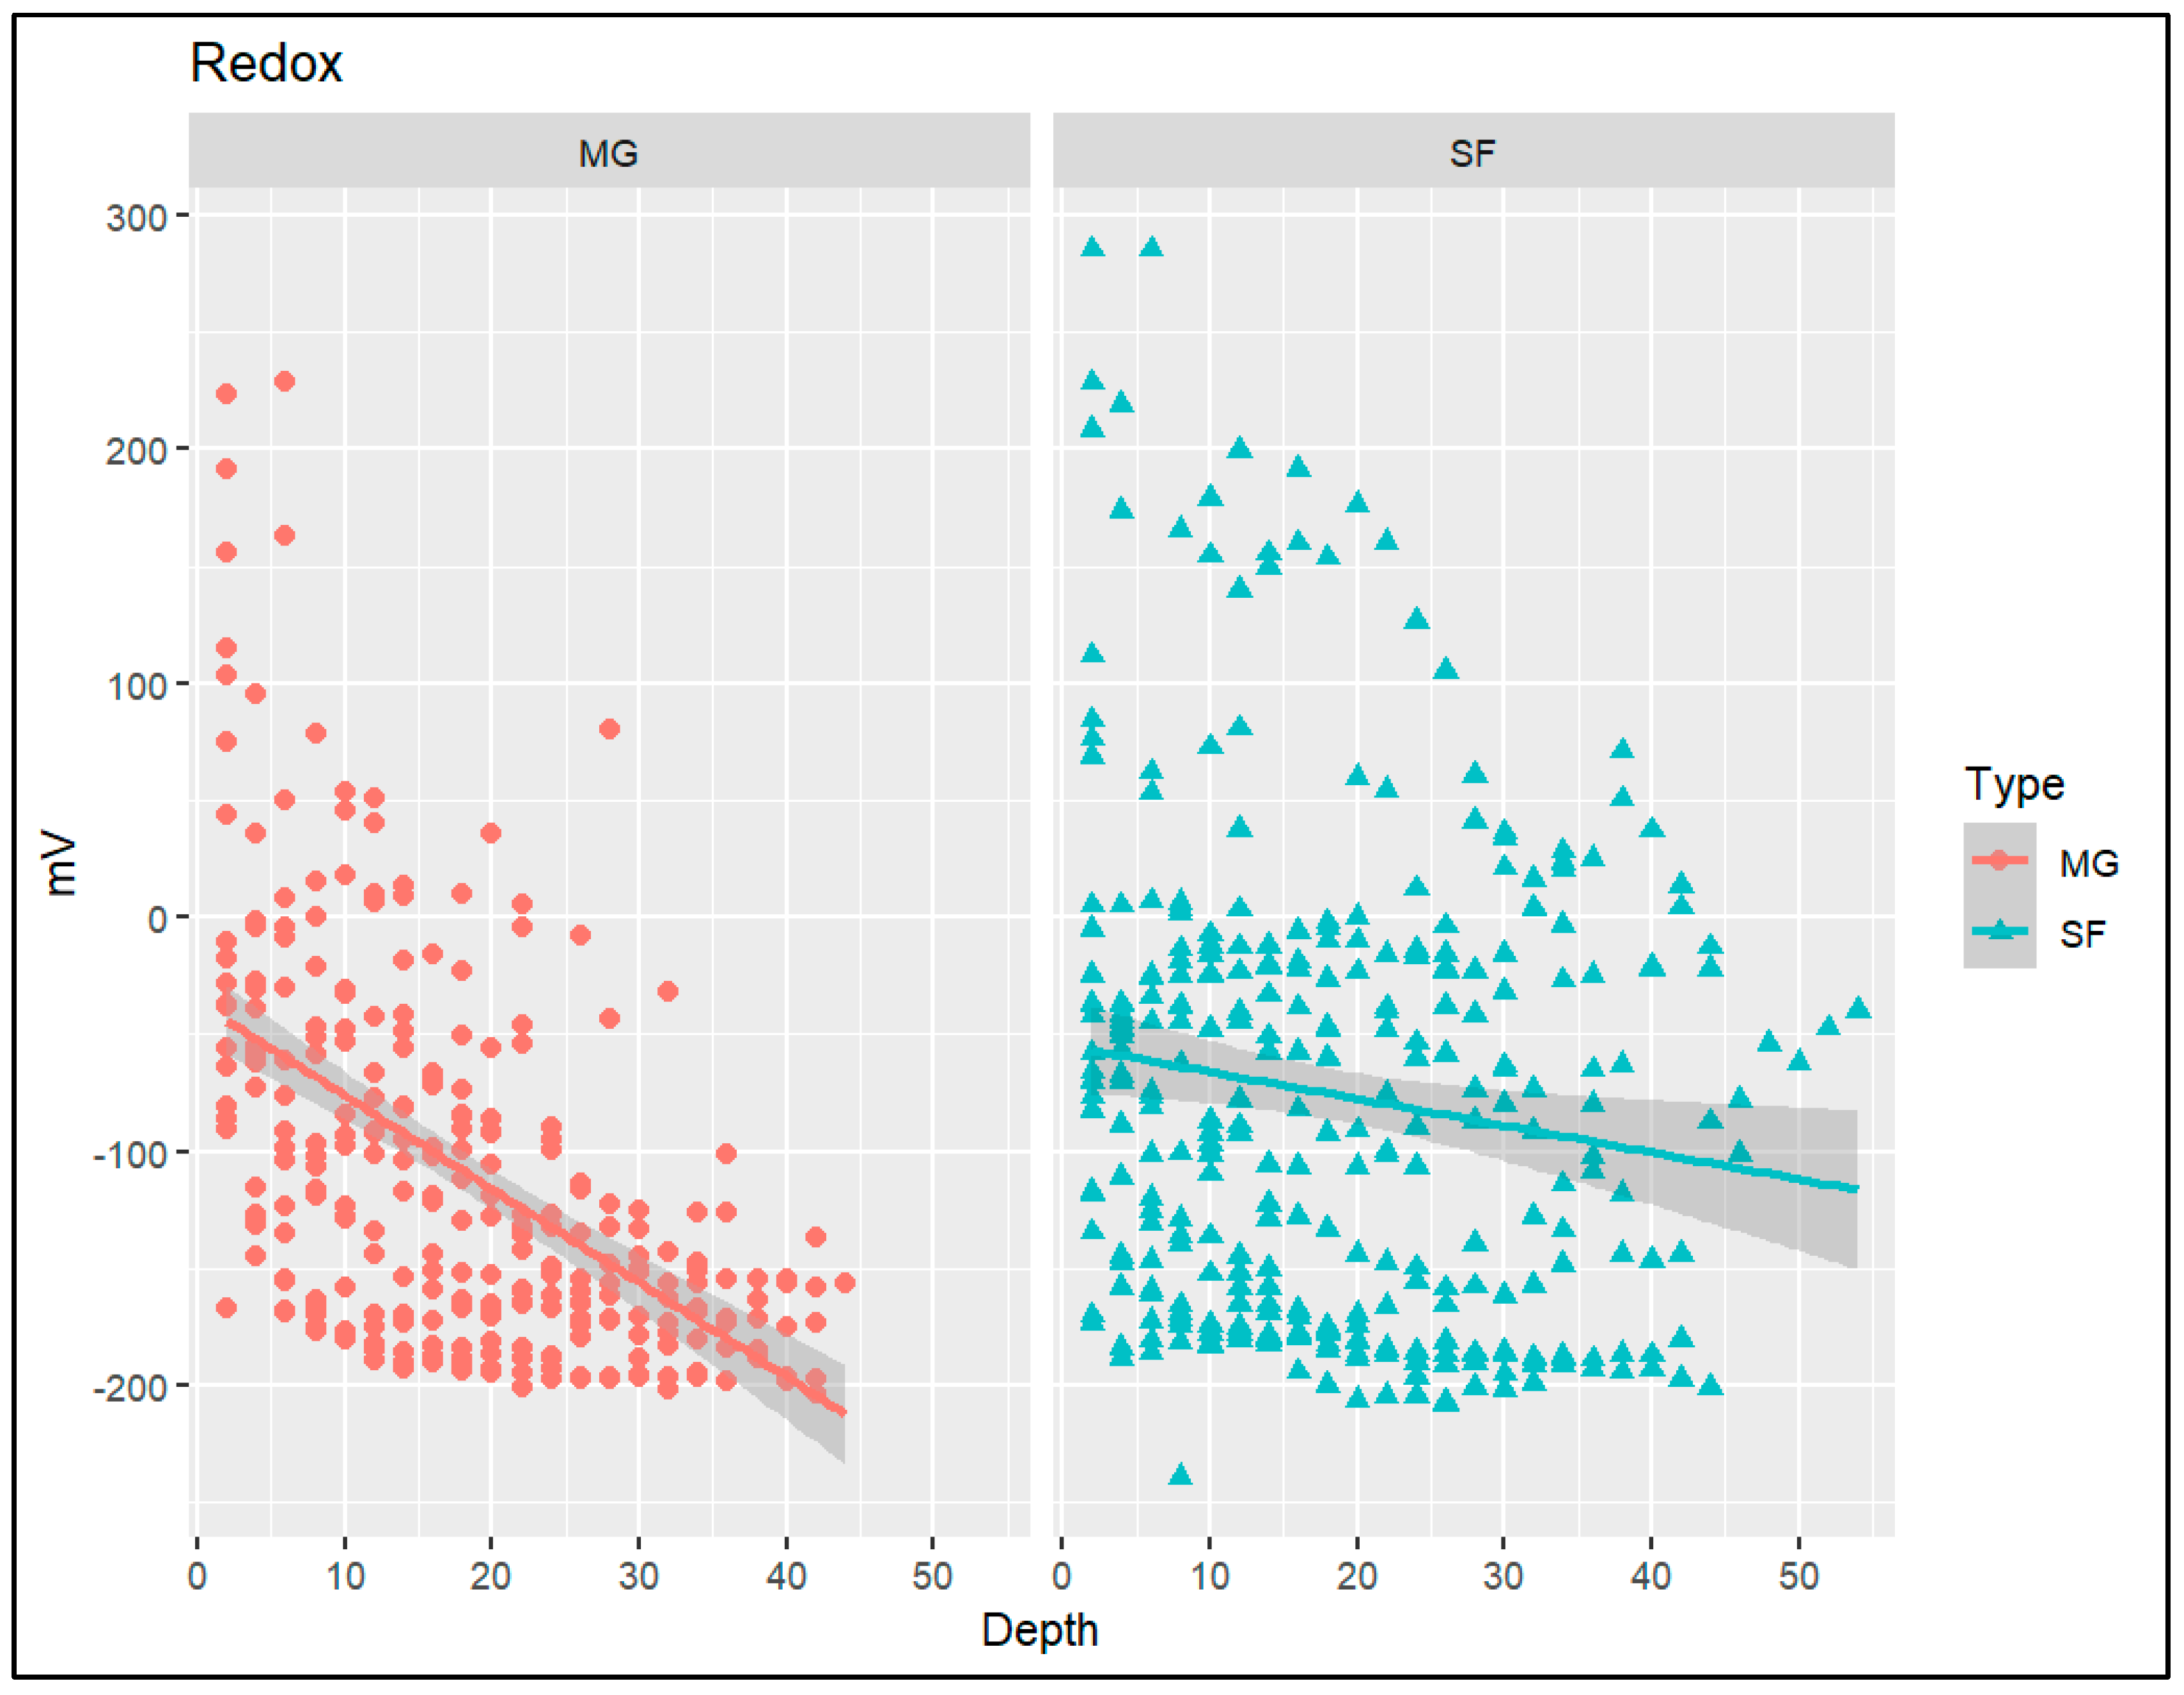
3.2. Sediment Quality

There were large differences in the sediment’s characteristics among sectors, main systems and type of drainages (Table 2). The sediment pH displayed differences by sector (KW = 14.503, p < 0.05), with the Palma Real sector being the most acidic (6.302 ± 0.391), differing from Muisne (7.01 ± 0.354) and Cojimíes (6.979 ± 0.197). This difference is transferred to the main estuaries (KW = 11.609, p < 0.05) and the type of drainage (KW = 12.078, p < 0.05). Natural drainages have a lower pH (6.412 ± 0.473) compared to shrimp ponds drainages (6.955 ± 0.307), while winter (6.89 ± 0.37) showed higher pH levels than those of summer (6.58 ± 0.50), evaluated through non-parametric tests.
The redox potential of the superficial layer of sediments did not show differences among sectors (KW = 3.983, p > 0.05), main systems (KW = 2.812, p > 0.05), type of drainage (KW = 0.019, p > 0.05) or station (KW = 3.793, p > 0.05). However, the average value became negative during winter (−22.605 ± 131 mV), while remaining positive during the summer (29.19 ± 100.63 mV). The Cojimíes sediments were the only sediments that yielded a negative average (−52.69 ± 115.78 mV).
In a similar situation, the electrical conductivity with a global average of 8094 ± 3107 µS/cm did not show differences in all the contrasts carried out. The ammonium content in sediments showed large differences by sector (F3,34 = 9.308, p < 0.001). Cojimíes (14.875 ± 7.772 mg/kg) showed the highest ammonium content among the sectors (PR = 4.45 ± 2.871, TA = 4.850 ± 3.958, MU = 5.250 ± 3.924). The excess of ammonium in Cojimíes resulted in ammonium content differences among main systems (F1,36 = 6.823, p < 0.05) and types of drainages (F1,36 = 5.862, p < 0.05). The natural drainages or mangroves averaged 4.133 ± 2.608 mg/kg and the modified drainages averaged 8.804 ± 7.139 mg/kg, without any differences between sampling periods (F1,36 = 0.121, p > 0.05).
An opposite situation occurred with the total nitrogen content that presents sectorial differences (KW = 19.305, p < 0.001), where Palma Real (3325 ± 980 mg/kg) exceeds Tambillo (2189 ± 962 mg/kg), Muisne (1179 ± 754 mg/kg) and Cojimíes (1174 ± 730 mg/kg), and Tambillo exceeds Muisne and Cojimíes, who did not differ from each other. The differences are transferred to systems (KW = 16.277, p < 0.001) and drainage type (KW = 15.895, p < 0.001) where natural drains (2992 ± 1005 mg/kg) practically double in total nitrogen to shrimp drains (1367 ± 899 mg/kg), there are also seasonal differences (KW = 4.807, p < 0.05) where the nitrogen content increases during winters.
The phosphorus content expressed as phosphate did not exhibit significant differences. A similar situation occurred with the metalloid content, with no differences in the content of Cu, Hg and Pb. However, the Zn content exhibited seasonal differences (KW = 15.159, p < 0.001), increasing during summer (55.2 ± 12.52 mg/L) compared to winter (38.06 ± 10.44 mg/L).
The content of total organic matter (TOM) in the first 3 cm of the surface exhibited differences by sector (KW = 7.425, p < 0.05), observed between Palma Real (19.38 ± 4.56%) and Muisne (11.13 ± 3.66%), sectors integrated exclusively by natural drainages and modified drainages, respectively. This difference increased when contrasting types of drainages (KW = 17.379, p < 0.001). Natural drainages averaged a TOM content of 20.52 ± 6.09% while modified drainages averaged 11.73 ± 4.49%. Seasonal differences (KW = 1.416, p > 0.05) were not observed.
The analysis of 636 sections obtained every 2 cm of depth from 40 columnar sediment samples showed that the OM content differed considerably among sectors (F3,560 = 52.07, p < 0.001). Palma real had 18.29 ± 6.02% OM content; followed by Tambillo, with 14.68 ± 8.02%; Cojimíes, 12.31 ± 3.78%; and finally, Muisne, with 10 ± 4.39%. In all sectors except Muisne, a slight increase in OM was observed with increasing depth. The differences were strengthened when contrasting the type of drainage (F1,533 = 225.3, p < 0.001), observing a decrease in organic matter content in modified drainages (10.82 ± 4.5%), compared to natural drainages (17.92 ± 6.73) (Figure 4).
The vertical distribution of the redox potential by type of drainage appears in Figure 5. The redox potential exhibited different vertical patterns according to the type of drainage. Natural drainages, considering all the depth strata (n = 286), had a mean of −91 ± 94 mV and described an inverse correlation of −0.530 (p < 0.01) with increasing depth without differing among sectors (F2,275 = 0.647, p > 0.05). However, differences were found between sampling locations (F9,268 = 7.074, p < 0.001), the ones located towards the interior of the mangroves without connections to freshwater rivers showed values that fluctuate between -148 to −158 mV, while sites located closer to the sea or connected to freshwater courses in the headwaters of mangroves presented had reported values in the range −58 to −76 mV; sediments from modified drainages (n = 350) showed a redox potential of −76 ± 101 mV. Depth slightly affected the decrease in redox potential, describing a correlation of −0.135 (p < 0.05) at these sites.
Unlike natural drainages, modified drainages differed among sectors (F2,325 = 65.18, p < 0.001) and showed the lowest redox potential values recorded in Cojimíes (−155 ± 56 mV), compared to Muisne (−38 ± 102 mV) and Tambillo (−42 ± 83 mV). Cojimíes redox potential values showed magnitudes between −171 and −176 mV in remnants of internal Cojimíes mangroves connected to small watercourses, while locations close to the sea and headwaters of bodies of water showed positive values of 15 mV in T5 and 124 MV in M1.

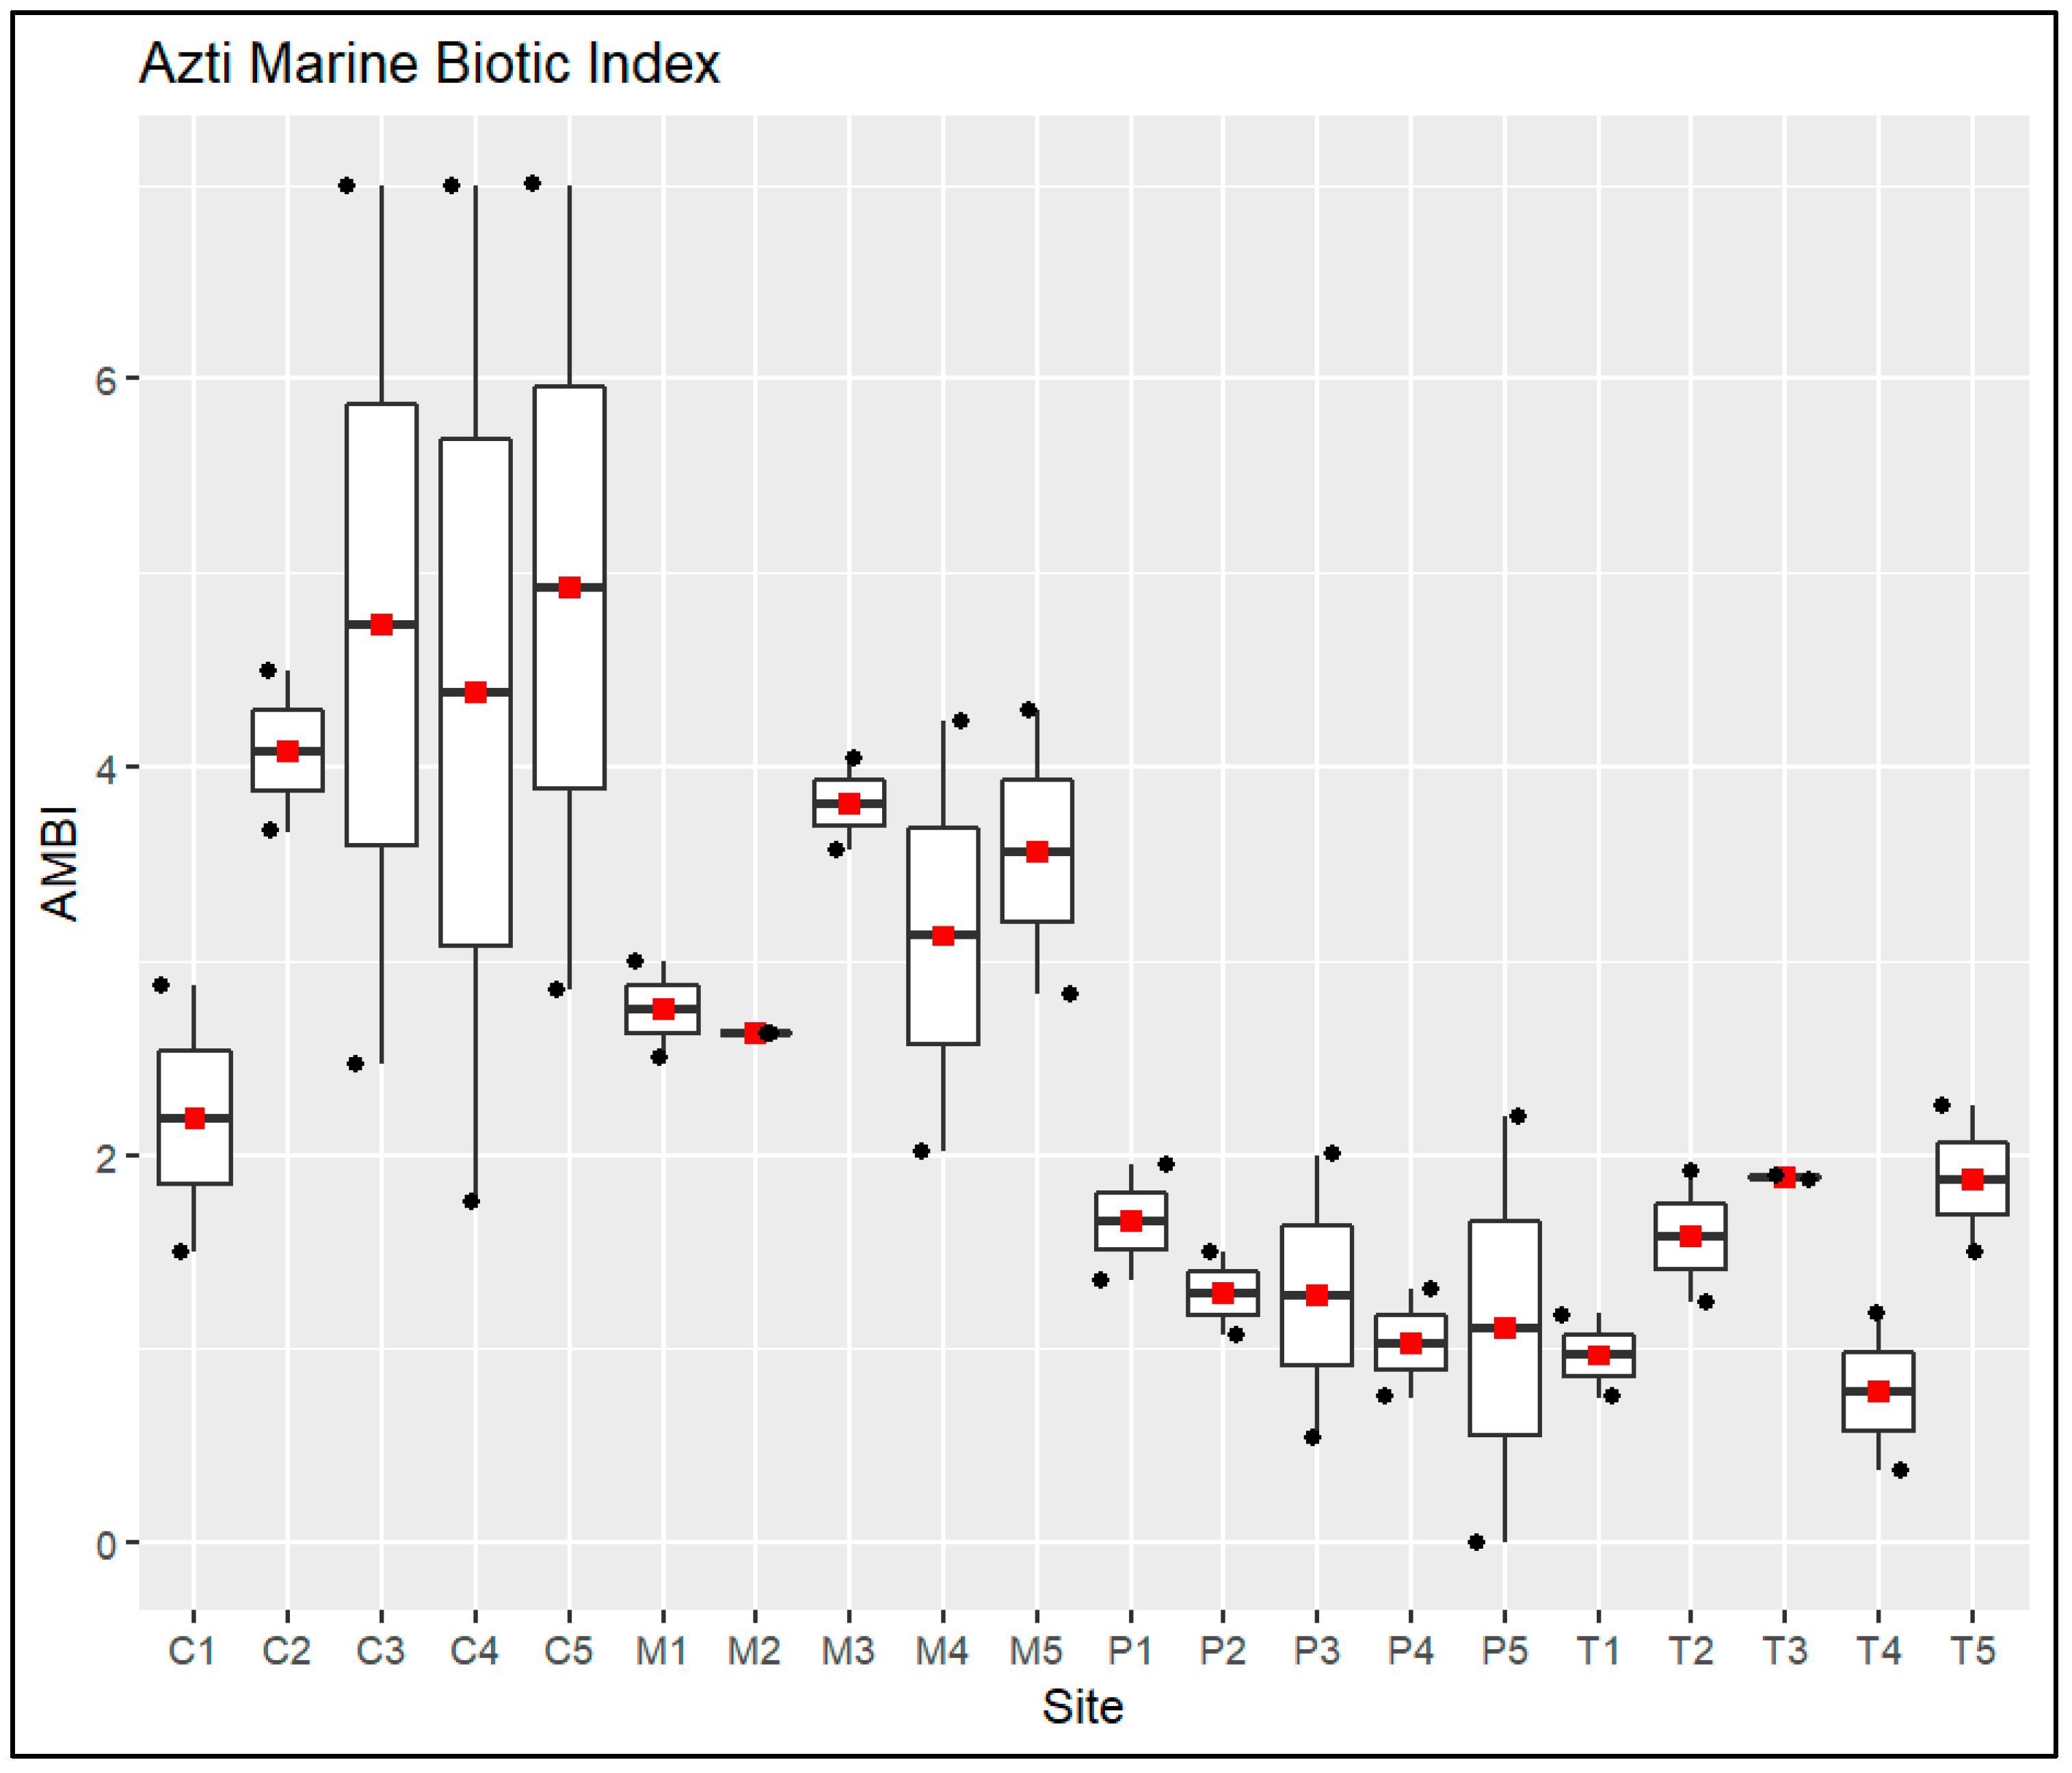
3.3. Benthic Assemblages

A total of 801 benthic organisms of 56 species were collected (Table 3). The most abundant and richest groups were polychaetes with 24 species (78.03% relative abundance), followed by malacostracan arthropods with 13 species (9.24%). In third position were the bivalve mollusks with nine species (7.12%). In fourth place appeared insects with only two species in larval stages (2.15%). Among the less abundant groups appeared ophiuroids with two species (1.12%), gastropod mollusks with three species (0.87%), one planarian (0.87%), and one individual from each of the phyla Bryozoa and Cnidaria (0.12%). A great variation in the richness of benthic assemblages was observed in the different sampling periods. During the summer of 2021, 406 specimens of 51 species were collected, while during the winter of 2022, 395 specimens of 29 species.
Just 11 species were common in the four study sectors. Cossura rostrata polychaetes accounted for 15.3% of the total organisms collected. Followed by Prionosprio sp. (11.61%), Capitella sp. (11.36%), Euclymene sp. (7.74%), Phillodoce sp. (5.49%), Perinereis sp. (3.99%), Nephthys sp1. (3.62%), Arabella sp. (3.62%) and Nephthys sp2 (2.62%). On the other hand, the malacostraca Carcinoplax sp represented 1.62% and the bivalve Polymesoda inflata represented 0.99% of the total number of individuals collected. These eleven species represented 68.03% of all the organisms collected.
Using the abundance of benthic assemblages as an input for a non-metric multidimensional scaling analysis (n-MDS) using the Bray Curtis operator as a dissimilarity factor, two distinct clusters are obtained (Figure 6).
Table 4 shows the ecological descriptors of the benthic assemblages. The abundance of benthic organisms showed weak differences by sector (F3,36 = 2.483, p < 0.1) between Muisne, with an average collection of 30 organisms collected per site, and Cojimíes, with only 10 individuals. The abundance of benthic organisms did not differ between systems, drainage types or sampling periods. Dominance did not differ between assemblages. Even though Shannon—Weaner H′ diversity did not vary between sectors, it did vary between major systems (KW = 4.359, p < 0.05), where REM presented a medium diversity condition (H′ = 1.758) versus RVS that showed a low level of diversity (H′ = 1.311). There were differences between sampling periods (KW = 6.478, p < 0.05) but none between drainage types. Summer assemblages showed an intermediate diversity (H′ = 1.824), but winter assemblages showed a low diversity (H′ = 1.233).
A significant seasonal decrease in benthic richness was observed (KW = 5.902, p < 0.05), finding richer assemblages in summer, with 9 ± 5 benthic species per sampling site compared to 5 ± 4 species in winter. Differences by sector were also observed (KW = 8.945, p < 0.05) between Tambillo with 10 ± 5 species and Cojimíes, 4 ± 4, as well as between main systems (KW = 5.968, p < 0.05), where REM with 9 ± 5 species per site surpassed RVS with 5 ± 4 species. However, no differences in benthic richness were detected when considering the type of drainage (KW = 1.137, p > 0.05).
The AMBI Index, which assesses the ecological status of marine environments, had a global mean of 2.481 and interpreted the study area as a slightly disturbed system with large differences by sector (F3,36 = 11.78, p < 0.001). Thus, Tambillo (1.416 ±0.583) and Palma Real (1.269 ± 0.697) were interpreted as slightly disturbed sectors close to the condition of undisturbed sectors, while Muisne (3.175 ± 0.808) was interpreted as a slightly disturbed sector close to a moderately disturbed condition, and Cojimíes (4.06 ± 2.199) as a moderately disturbed sector (Figure 7).
The differences increase when contrasting principal systems (F1,38 = 32.31, p < 0.001). REM (1.342 ± 0.630), in a slightly disturbed condition, approached a situation of an undisturbed sector, while RVS (3.61 ± 1.675) was found to be moderately disturbed. A similar situation was observed between natural drainages and modified drainages (F1,38 = 5.729, p < 0.05).
Although the ANOVA test did not detect seasonal differences in AMBI values, it is important to note the considerable variation in the ecological condition in RVS associated with seasonality. During the summer of 2020, eight of the ten sites evaluated were interpreted as slightly disturbed and two sites as moderately disturbed. By winter 2021, three sites were azoic and therefore extremely disturbed, four sites were moderately disturbed, and only three sites remained slightly disturbed.
These changes were not as pronounced in REM where in the summer of 2020, six of the ten evaluated sites were considered slightly disturbed, and the remaining four were considered undisturbed sites. This proportion was preserved during the winter of 2021, with six sites that continued being slightly disturbed. In the Tambillo sector, the T1 and T4 sites remained undisturbed, while in Palma Real, the P2 and P4 sites that were considered undisturbed during the summer 2020 changed to moderate and good conditions, however, the sites P3 and P5, were considered unaltered during the winter of 2021.
Finally, M-AMBI, which incorporates the variables of H′ diversity and species richness, showed significant differences by sector (KW = 14.79, p < 0.01), where Palma Real and Tambillo differed from Cojimíes. This analysis establishes five intervals of ecological quality from 0, which is interpreted as the worst condition, to 1, which is understood as a pristine state. Thus, values in the interval from 0 to 0.2 suggest a poor ecological condition; from 0.2 to 0.4, an impoverished quality; from 0.4 to 0.6, a moderate quality; 0.6 to 0.8, a good ecological condition; and from 0.8 to 1 is interpreted as high ecological quality.
According to M-AMBI, it should be interpreted that for the summer of 2020, of the 10 sites of the RVS estuary, four had a good ecological condition, four sites had a moderate quality, only one site was considered impoverished, and one site returned a poor condition. Switching over winter, where only one site was of moderate quality, six sites had impoverished, and three sites were azoic.
The fluctuations in REM went from having four sites with moderate quality, four sites with good quality, and two sites with high ecological quality in summer 2020, to having one impoverished site, three sites with moderate quality, and six sites with a good ecological condition during winter 2021.

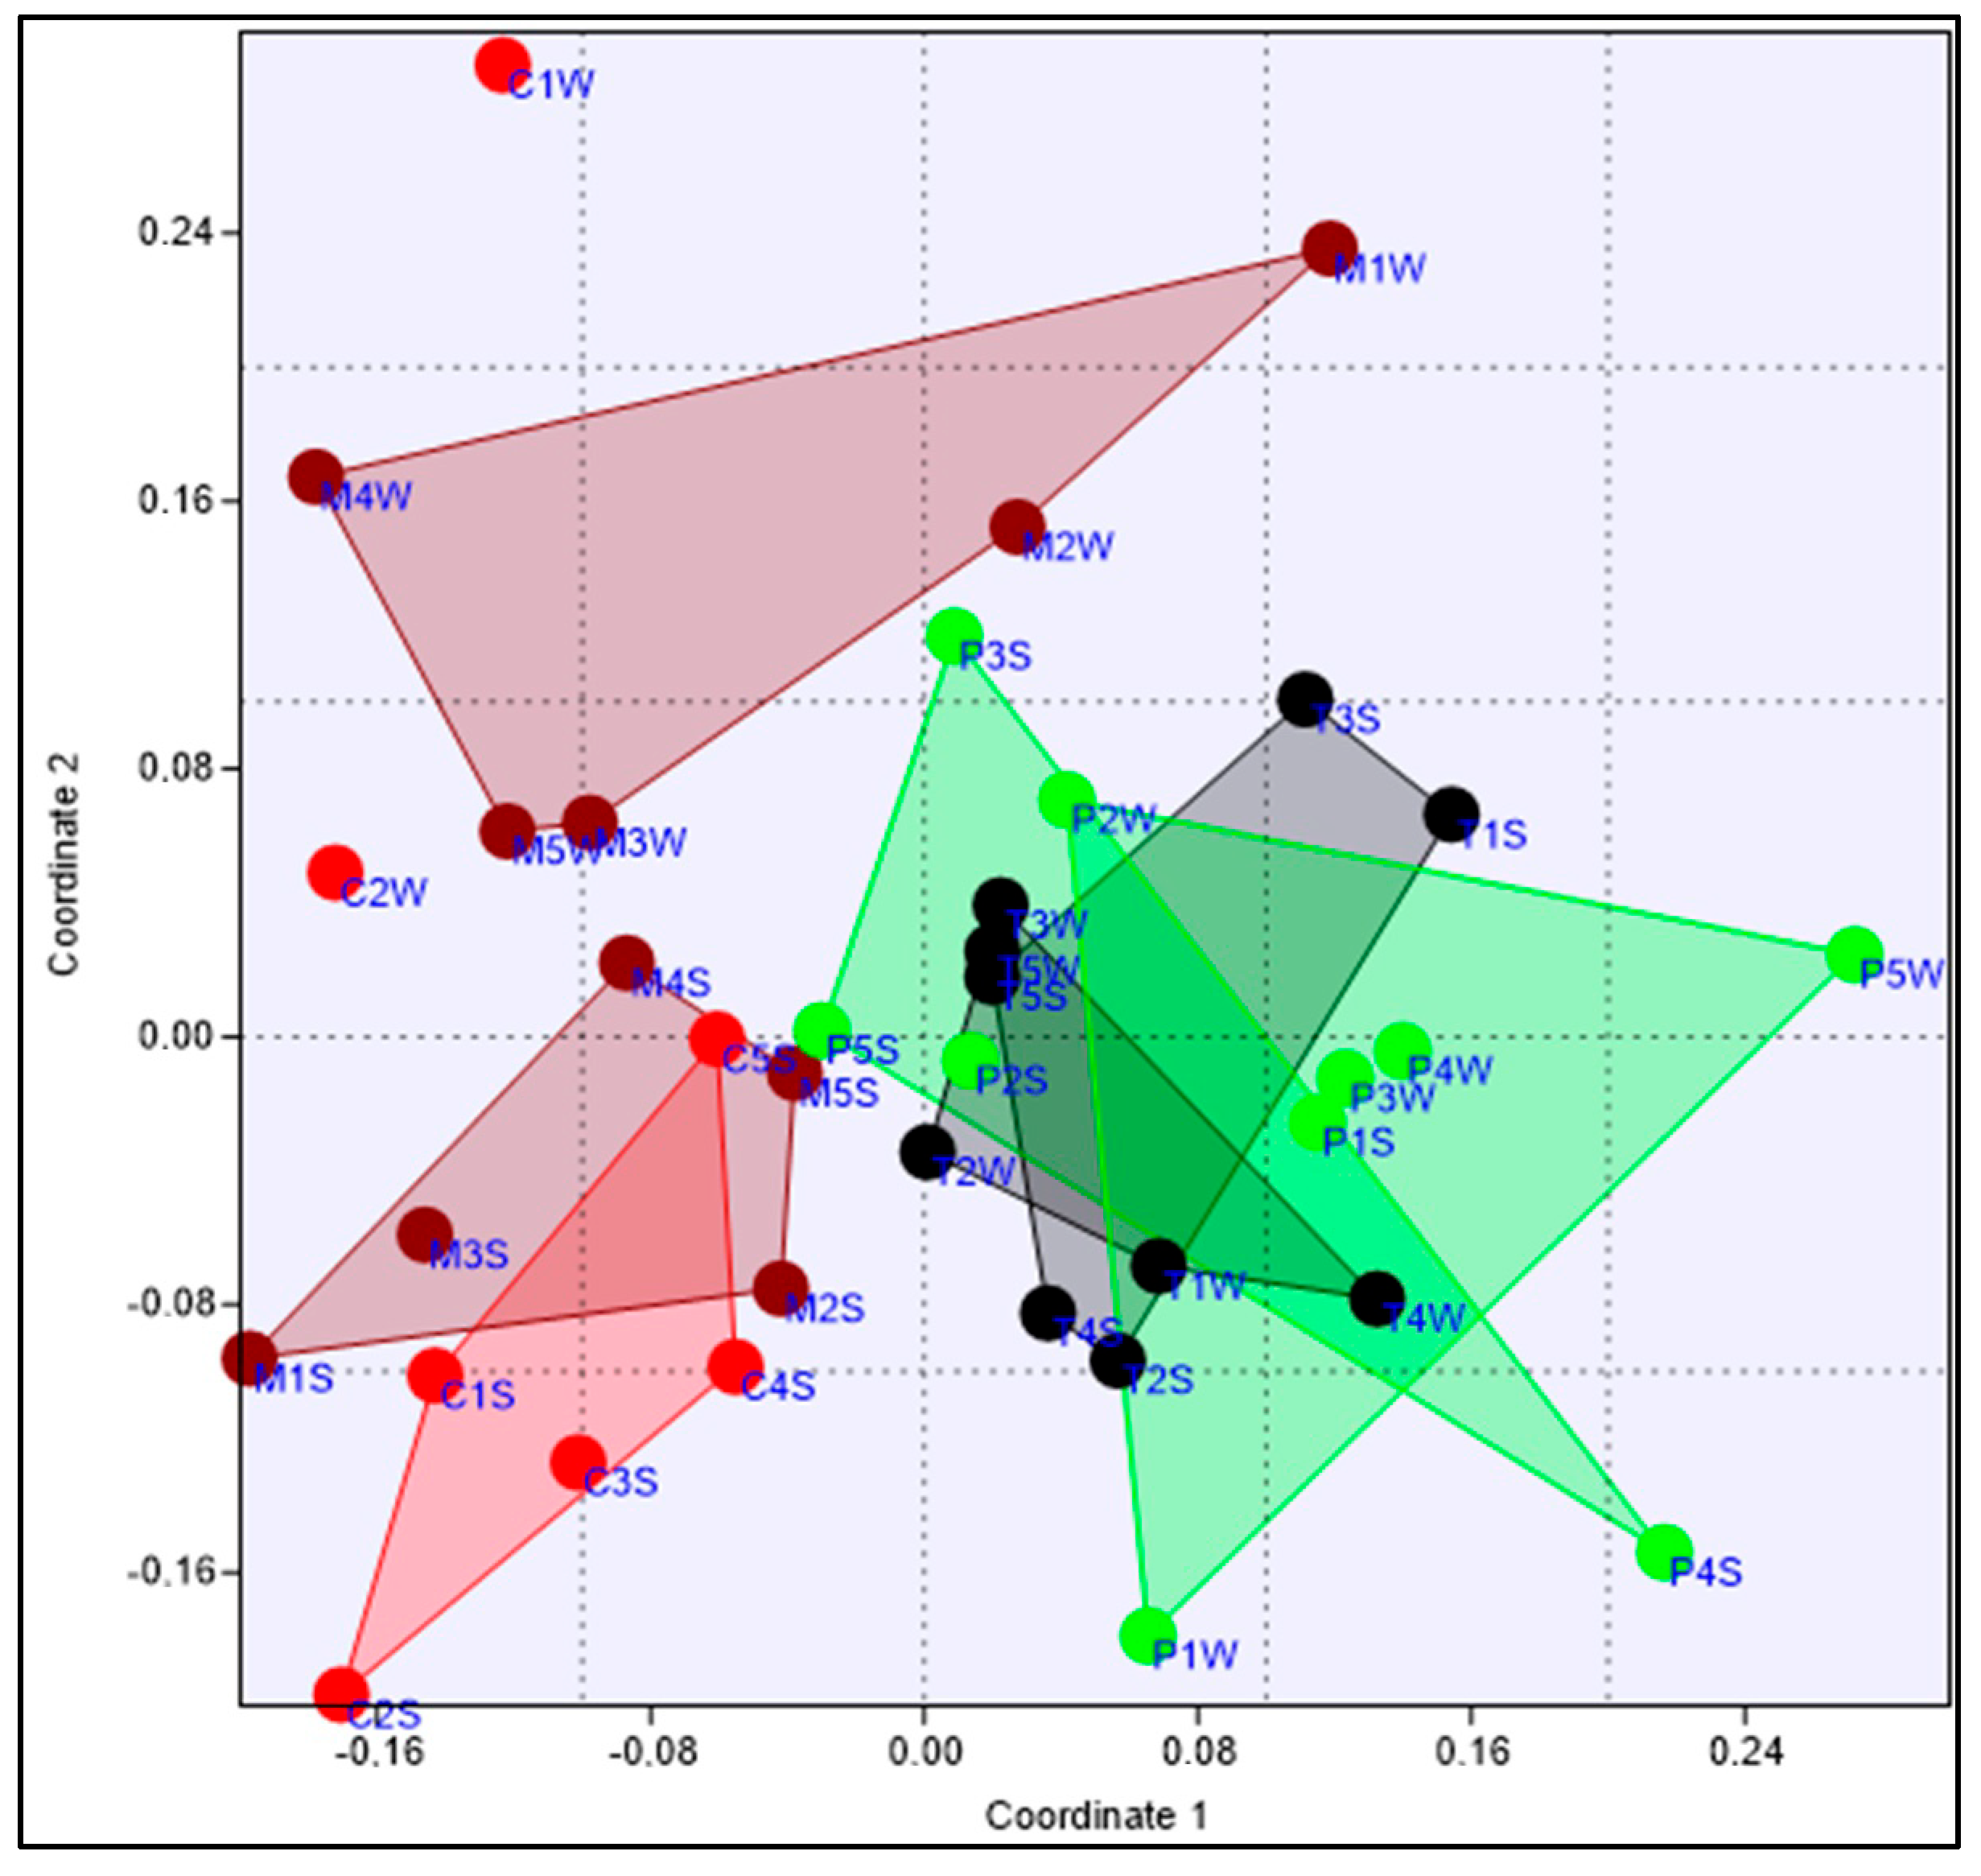
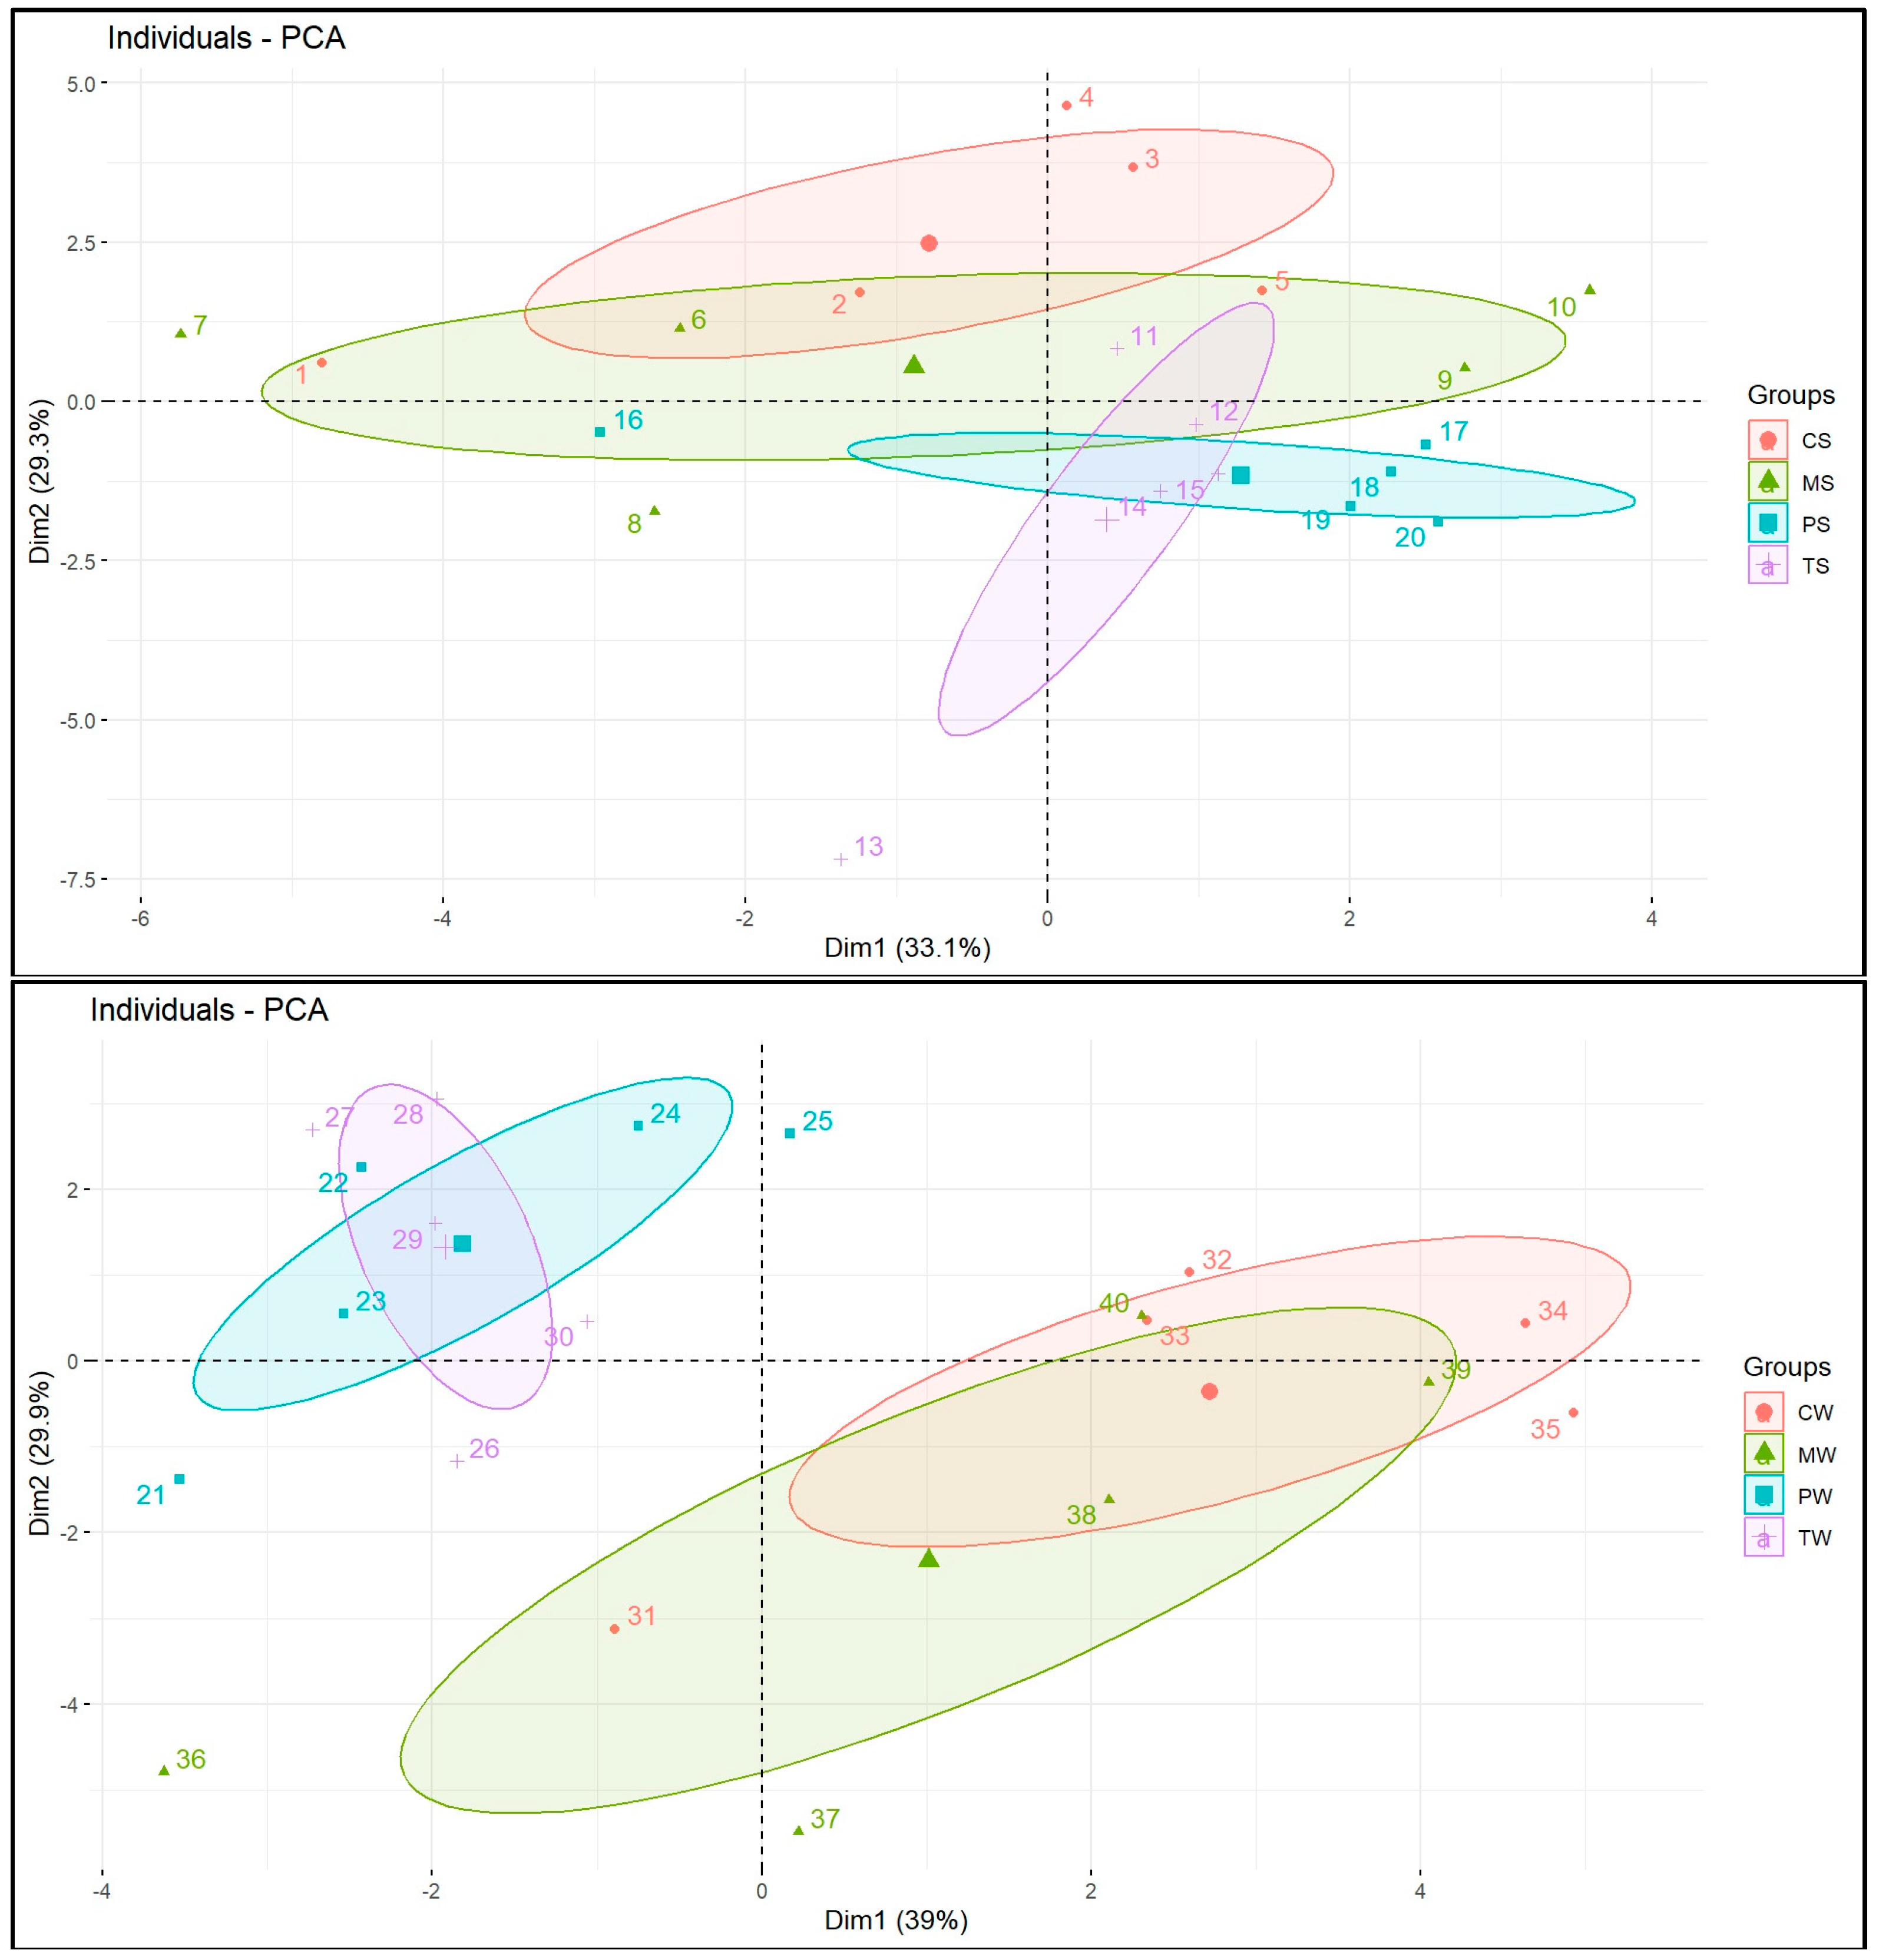
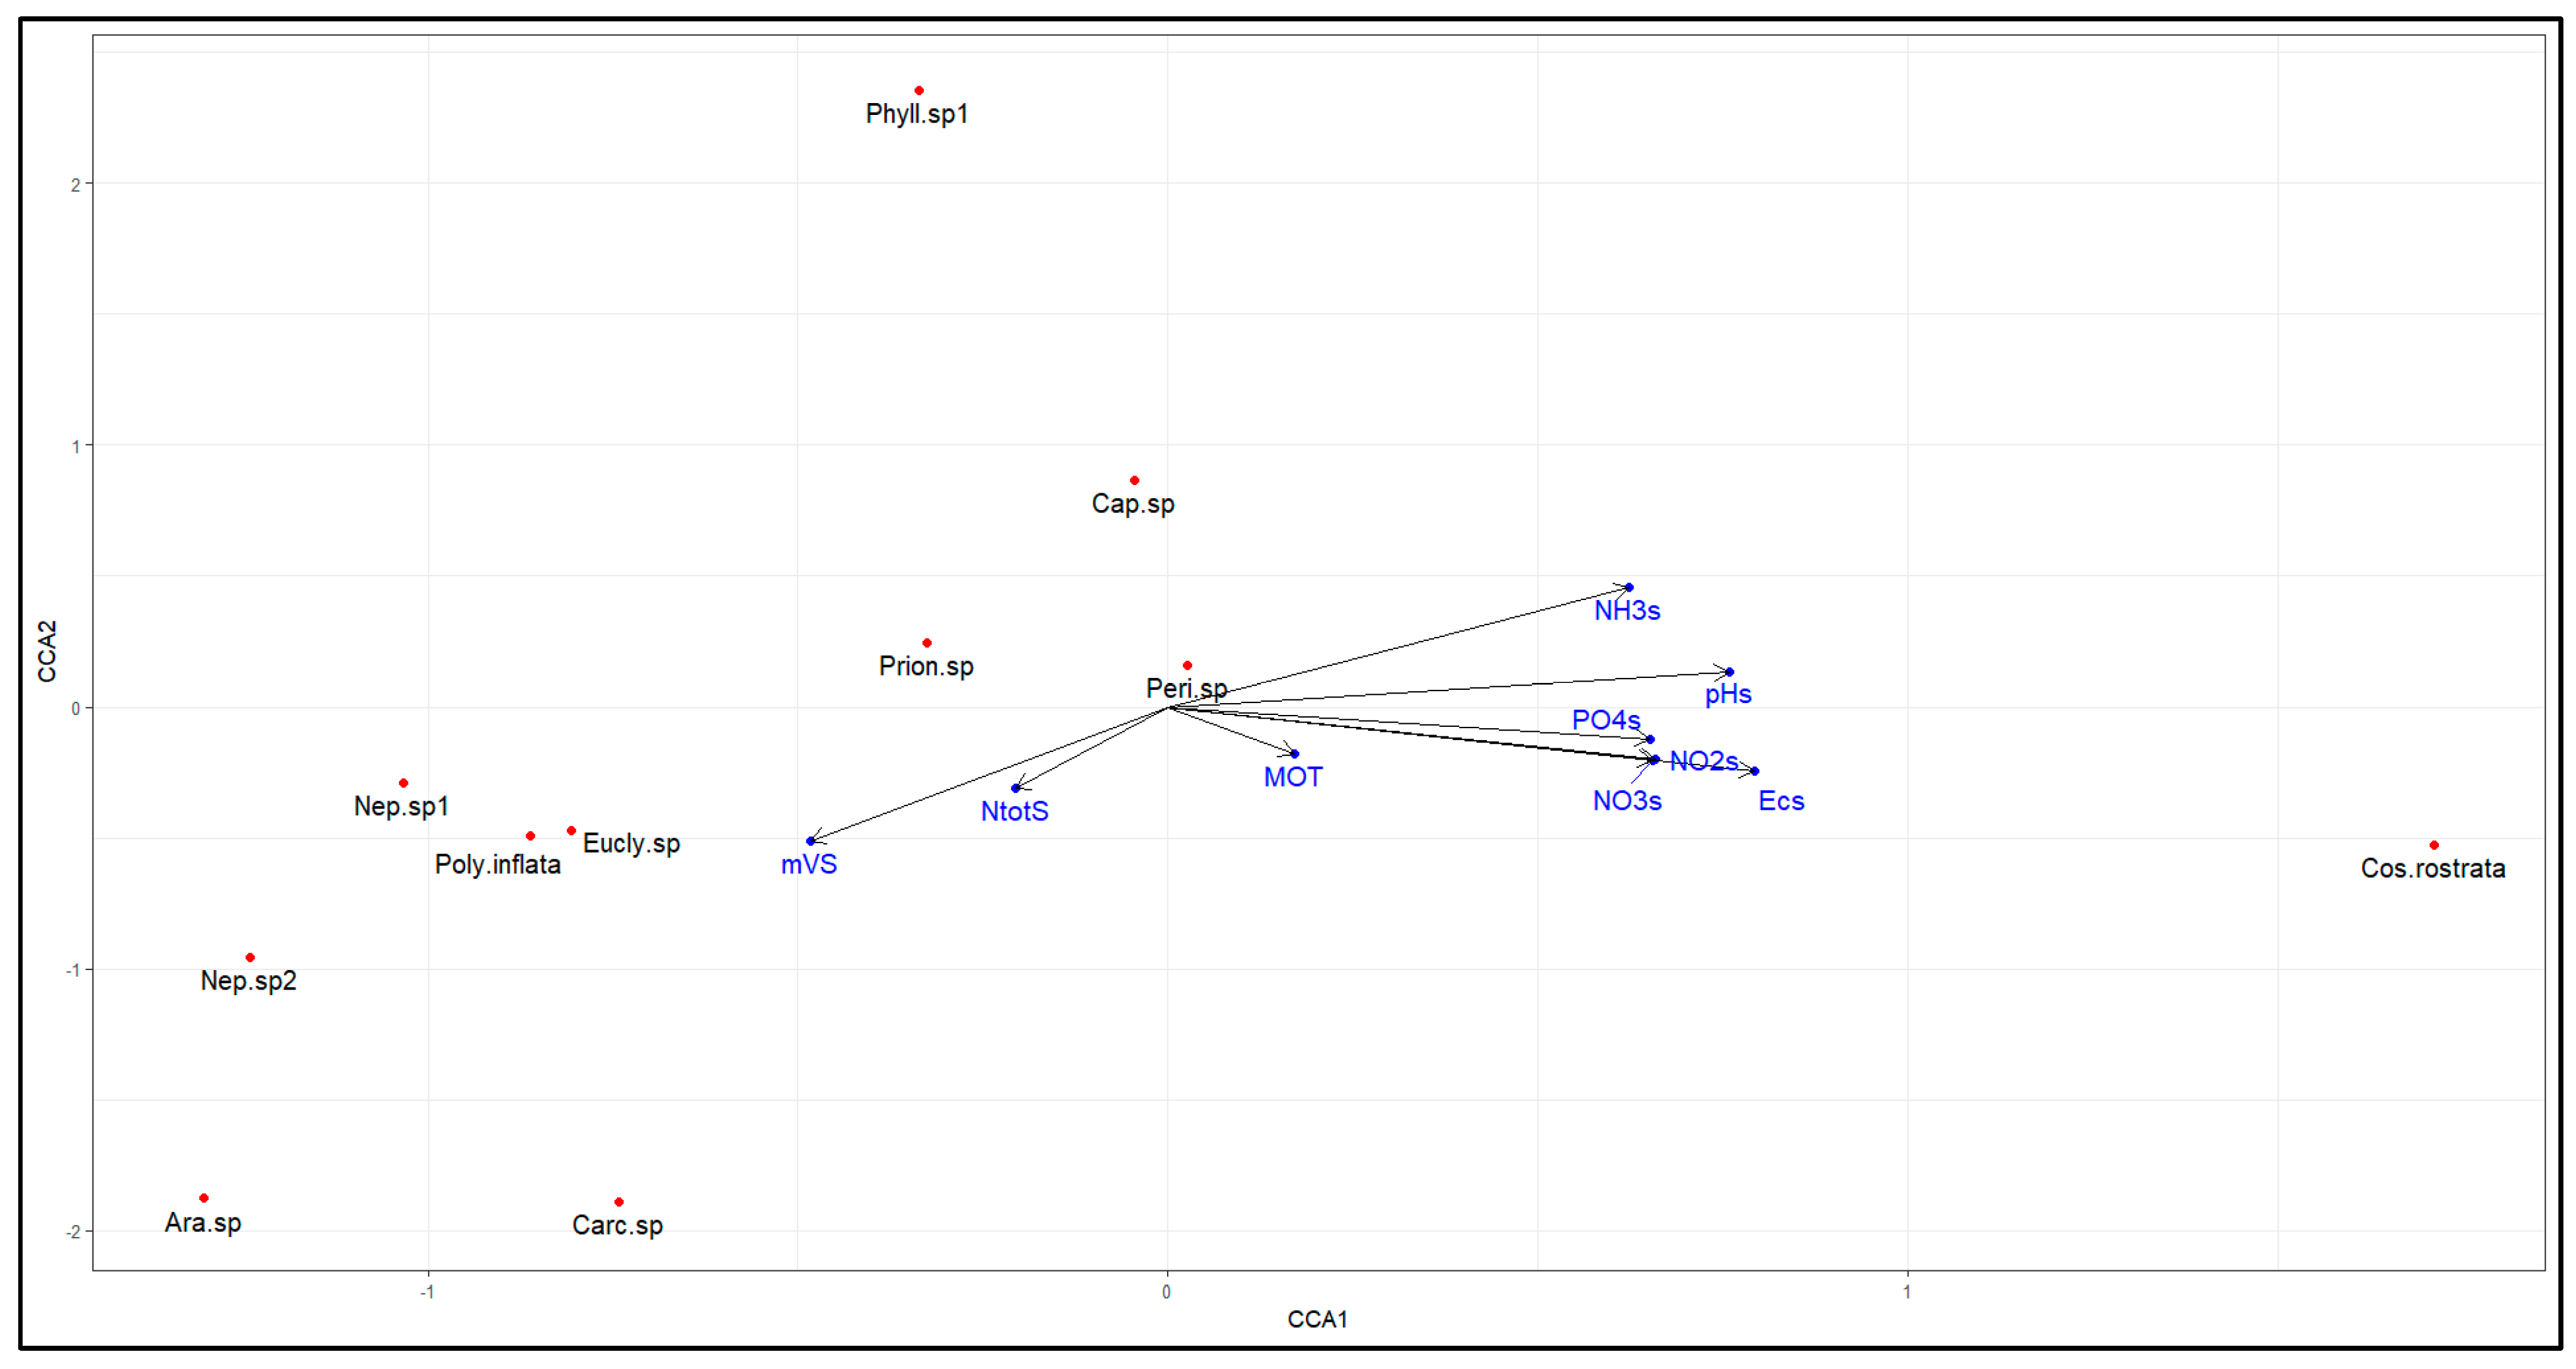
3.4. Multivariate Analyses

The analysis of 35 components analyzed by PCA showed that more than 70% of the accumulated variance resided in seven components. When adjusting the analysis towards these seven components and plotting the distribution of sites, the first component accumulated 48.06% of the variance and the second 19.74%.
The distribution of sites categorized by sector and seasons is shown in Figure 8. The factors that determine the distribution of these with the greatest weight in the first component were the organic compounds accumulated in sediments: nitrite, nitrate, ammonium and phosphate, followed by the electrical conductivity and REDOX of sediments, as well as the salinity-electrical conductivity of the water and to a lesser extent the abundance and richness of benthic organisms.
In the second component, the variables with the highest incidence were the water pH, OD and parameters involved in the organic enrichment of the water, such as total nitrogen, ammonium, nitrate the ammonium, followed by the pH of sediments and suspended settleable solids.
The distribution of sites and sectoral groups showed different situations between sampling periods. RVS sites concerning REM drift apart during the winter (Figure 8, lower graph). During the summer (Figure 8, upper graph) the PCA analysis showed a high similarity of conditions between Tambillo, Palma Real and Muisne.
The analysis of canonical correspondences between sedimentary variables and benthic species did not show a distribution determined by sector when inputting the 56 collected species. This was attributed to the low relative abundance of 23 species (less than 1%) and nine species with single collections. By adjusting the analysis towards the 11 species shared between the four sectors in any seasonal period (Figure 9), the Polychaetes Nephthydae Nephtys sp1, Maldanidae Euclymene sp and the bivalve Polymesoda inflata would decrease associated with the lower values of REDOX and the total nitrogen content in the sediments. Moreover, the polychaete Cossuridae Cossura rostrata would increase with the accumulation of ammonium, nitrates, nitrites, phosphates and the increase in electrical conductivity and pH of sediments.

4. Discussion

The REMACAM deltaic system comprises a plain of 49,350 ha of mangroves [71] and by the year 2019, it had 3848 ha of shrimp ponds in operation [72]. It exhibited salinity values that varied from 5.15 ppt in its most internal locations to 23.7 ppt at its closest spot to the sea. On the other hand, the RVSMMC estuary, with only 3153 ha of mangroves [73], houses 6404 ha of shrimp ponds. It is a narrow system flanked by a coastal mountain range that compresses the area with mangroves towards the Muisne sector, which registered salinity values of 1.11 ppt at its innermost point and 30.5 ppt at its closest site to the sea.
Several authors consider shrimp production in mangroves as unsustainable [74] given its direct relationship with the loss of these scarce ecosystems. Ecuador does not escape this reality and has the highest rate of mangrove loss in the American continents, estimated at an 80% loss of the stock of live carbon or biomass of mangrove forests on its continental coast due to the displacement of mangroves to shrimp farms [75].
There are different criteria regarding the radius of influence of the shrimp farm infrastructures in mangroves estuaries, and the environmental impact of aquatic cultures depends largely on the culture method, the stocking density, type of feeding and the hydrography of the culture site [76]. The changes in the TSS and organic compound content of the water are estimated to be imperceptible within 750 m of a discharge [77].
The determination of similar sites to compare systems with mangroves and shrimp farms is not simple given the great heterogeneity of the study area. The present study aimed to cover a wide range of conditions in which drainages or tidal streams of mangrove forests are useful as evidence of alterations after being modified to function as shrimp infrastructures, showing differences in the chemical state of the water and sediments as well as in the ecological state of benthic assemblages.
The observed changes respond to a transformation gradient. The best condition was observed in Palma Real of the REMACAM system, which lacked shrimp production. The worst scenario occurred in Cojimíes of the RVSMMC system, with the highest transformation to shrimp farms in the study area, estimated at 50% of its surface until the year 2014 [58].
The study involved four main sectors that integrated seven navigable channels at low tide, with hydrological differences related to the proximity of the outlet to the sea and whether there was an upstream connection with a freshwater course and the received flow. Inland mangrove spaces without a superficial connection to freshwater courses, known locally as “blind” mangroves (2 channels present in REMACAM), or those connected to small bodies of freshwater, will have greater tidal stagnation of water in dry periods. This reduces the levels of dissolved oxygen and increases the deposition of fine settleable material, such as the accumulation of leaves and mangrove wood, generating substrates loaded with more OM rich in nitrogen [78] that will have an acidic nature.
This situation was known for decades. Therefore, the first shrimp farms installed in the late 1980s in RVSMMC were located near outlets to the sea with longer hours for water exchange to the ponds. This thus lowered the risk of contaminants entering from the runoff from oil palm crops, livestock activities, population centers lacking sewage treatment systems and other shrimp farms that proliferated upstream over time.
However, the natural conditions of mangrove systems defy environmental quality models developed for other ecosystems while providing multiple benefits, highlighting their high capacity to store carbon in unfavorable conditions [79], the anoxic and salty conditions in mangrove substrates, root remnants, and litterfall accumulate in the sediments making them some of the most carbon-rich ecosystems on earth [80,81]. The alteration of these “unfavorable” natural conditions must be interpreted as impacts.
Regarding the quality of the water, the modified drainages had 17% more dissolved oxygen. Due to the large cultivated shrimp population (90,000–150,000 individuals/ha) concentrated in waters with little movement and higher temperatures (from the absence of shadows on the ponds), there was an expectation of significant oxygen consumption. However, there were records higher than 7mg O2/L which were associated with routine water changes. The cause of this increase could be attributed to the widespread use of aerator systems in aquaculture ponds. This situation results in benefits for shrimp producers who, being able to reduce water exchange rates due to the avoided oxygen depletion, continue in the search to enter zooplankton as additional food to the artificial diet supplied and reduce the accumulation of organic compounds in ponds. This situation was also evidenced in the higher pH of shrimp drainages that could be linked to the entry and subsequent discharge of water, with a greater marine influence being pumped in at high tides.
Despite the recurrent use of bacterial agents to improve the water quality in ponds and the improvement of oxygen supply, there was 2.5 times more ammonium and total phosphorus content in the modified drainage water. This increase led to a subsequent increase of 47% nitrate, 36% phosphate and 35% chlorophyll a with respect to natural drainage. Ammonium is regulated in Ecuador. Its highest record occurred in a narrow interior channel connected to a small body of fresh water in the Cojimíes sector, with values of 0.24 and 0.3 mg/L in summer and winter, close to the maximum admissible value for the protection of aquatic life established at 0.354 mg/L for marine/estuarine waters, with a temperature close to 25 °C and a pH of 8 [82].
Although the water quality indicators did not show major excesses, it is important to remember the samplings carried out were punctual and occurred in periods of flooding when the difference in intertidal height increases, sometimes exceeding 4 m. The samplings coincided with dates without shrimp harvests, when the increase of compounds generated by the total emptying of ponds that carry labile sediments would last for up to five days after a harvest [37]. Therefore, it is feasible to expect worse water quality scenarios when sectoral harvests coincide.
This aspect should be considered for future environmental monitoring efforts where the continuity of records becomes relevant, given the increase in organic compounds in rainy seasons that mask the role of shrimp farms in the face of the greater runoff of compounds generated on land.
The modified drainage sediments presented higher pH values and increased ammonium content by 93%, while total nitrogen content decreased by 53% and total organic matter by 48%. This trend of decreasing TN differs from studies that report its increase in mangrove forests closest to shrimp farms [44,49].
The behavior of the redox potential associated with the depth of sediments also showed differences. Natural drainages registered more negative values at lower depths, having an average value of −100 mV at 20 cm. However, this value was registered after 40 cm in modified drains. A different situation is reported for semi-arid mangroves in Brazil, where drainages influenced by shrimp farm effluents had lower values than sectors not influenced by shrimp farms, both exhibiting positive values [45,48,50].
The pH, the redox potential and the total organic matter content are used to evaluate the environmental quality of water bodies associated with fish cultured in cage rafts located in coastal waters of temperate countries. A team led by Hargrave described that the enrichment of organic matter in sediments produced anoxia and decreased the pH and redox potential in sediments associated with salmon farming [83,84]. These indicators were included in the regulatory frameworks of salmon-producing countries such as Chile, which established thresholds to allow the continuity of the operation of production centers when the sediments under and in the vicinity of cages have a pH value greater than 7.1, a redox potential greater than −50 mV and the organic matter content did not exceed 9%, in accordance with Resolution No. 3612 of 2009 [85].
Although these indicators are practical for monitoring, since they allow (except for OM content) in situ recording with easily acquired sensors, their usefulness would require multiple verification tests (lines of evidence) in addition to the opinion of mangrove experts once they were established, since tropical mangrove systems behave differently from temperate and cold-water environments with higher dissolved oxygen contents.
The capacity to store carbon in mangrove systems varies between different environmental factors that combine the origin of the sediments (terrigenous or carbonated) with different geomorphic settings (deltas, estuaries, lagoons and open coasts). Terrigenous deltaic and estuarine mangroves corresponding to the studied area are the ones that accumulate the most carbon [86].
The loss of carbon would be proportional to the loss of total organic matter following the Van Bemmelen factor 1.724 [87]. Nitrogen is associated with deforestation processes and the removal of previous soils when shrimp ponds were built. The decrease of OM in shrimp ponds and mangroves receiving shrimp effluents has been described for Brazil [14], Saudi Arabia [88] and southern Ecuador [89], and the increase of carbon in mangroves by shrimp effluents has been described in China [90]; changes in the composition of mangrove sediments receiving shrimp farm effluents decrease the diversity of the bacterial microbiome [91].
In the Matang Mangrove Forest Reserve system of Malaysia, it was described that one year after the mangrove felling, the content of carbon and nitrogen in soils and fallen wood decreased by half. After 40 years of reforestation, the same sites had 26% less carbon and 15% less nitrogen compared to control forests [92]. These results allow us to notice the slow recovery of mangroves that takes several decades.
The assessment and monitoring of sediment quality in tidal creeks receiving shrimp farm effluent can support environmental protection and decision making for sustainable development in coastal areas, since sediment quality often shows essential information on long-term aquatic ecosystem health. Chemistry and the data of benthic assemblages combined produced a better description of the quality and impacts of the evaluated environments [55]. The multivariate analyses of this study confirmed that sediment quality variables have a greater influence on the structuring of sector groupings, as well as on the distribution of benthic creatures shared among the compared sectors.
A canonical correspondence analysis integrating both sampling periods shows ten species decreasing when the total nitrogen content and REDOX of the sediment decrease; four polychaetes (Euclymene sp., two types of Nepthyidae and Arabella sp.) and one bivalve Polymesoda inflata would be more related to this trend, and only one polychaete Cossura rostrata increased its population when the organic compounds and the pH level increased; however, two sampling campaigns of 20 sites are not enough to conclude on this regard, as there are considerable interannual variations in the wild productivity along the Ecuadorian coast [93].
Although differences were not significant in the benthic assemblages between drainages, differences in the richness and H′ diversity of the benthic assemblages between the studied mangrove systems were found. The AMBI index interpreted the REMACAM system as slightly disturbed but close to an undisturbed situation. RVSMMC was in a situation of moderate disturbance that increased in the Cojimíes sector.
The applicability of the AMBI index and its variant M-AMBI in tropical estuarine systems has been confirmed [94,95]. Despite the complexity of the identification of non-commercial marine invertebrates, this study presents the first description of benthic assemblages for systems within mangroves from the Esmeraldas province. Although the species level could not be reached in several organisms, the values assigned to different ecological groups categorized by AMBI were consistent within families [96], and differences not perceived by traditional ecological descriptors were detected.
Without substantial differences in water quality and sediments between the seasons concerning the rest of the sites, the azoic condition observed in three Cojimíes sites during the winter of 2021 would respond to harmful practices performed by empirical shrimp farmers in this sector. These practices include adding biocidal compounds to the ponds between production cycles during the winters, due to the proliferation of the fish Poecelia reticulata and other invertebrates in ponds. This has been denounced by conservation organizations [97] and local fishermen who express the absence of fish populations in the zone with their return after two to three months [98]. Likewise, massive mortalities of bivalve mollusks and crustaceans have been reported in mangrove swamps close to shrimp farms. In the present study, pesticide residues in the water or sediments were not analyzed due to their high cost, but it is considered feasible that pesticide runoff from oil palm plantations also affects the Cojimíes and Palma Real sectors.
Situations of this type corroborate the need for a specific environmental regulation for aquaculture activities in Ecuador, as there are still gaps in the permission and control of aquaculture centers in operating in coastal systems with mangroves. The regulation of the current fishing and aquaculture law [99] establishes that new aquaculture concessions cannot be granted near beaches and bays while existing ones must be regularized. The latter are required to obtain operating permits for a period of one year that may be renewed after completing administrative procedures and issuing an environmental permit.
The environmental permit should include a baseline description, which currently does not require the survey of environmental quality indicators in the area near the farm. Nonetheless, this turns out to be a basic aspect for subsequent monitoring of the chemical and ecological state of a body of water. Likewise, the permit should contain an Environmental Management Program where an Environmental Monitoring and Follow-up Plan should be specified. However, its implementation is at the discretion of the applicant, since there is no specific guideline for it, and, as mentioned, indicators to be monitored were not determined, nor is the volume of information specified (i.e., number of samples required with respect to the surface or the number of ponds involved, and the frequency of sampling that should be related to each production cycle).
As expected, the quality of studies and audits varies between large companies capable of contracting competitive services and opting for international certifications versus small aquaculture producers who will seek the cheapest available offer.
There are also limitations to the correct monitoring of environmental quality in Ecuador, such as an inadequately installed analytical capacity. In the present study, it was not feasible to analyze the content of sulfides and sulfates in water and sediments, which provide important information on biogeochemical processes.
Given these restrictions, it is recommended to use other specific bioindicators in addition to benthic assemblages, such as the macroinvertebrates developed on the roots of red mangroves with intertidal exposure. Other suggestions include installing water quality dataloggers from the coastal edge to the limit of mangroves in inland waters, whose costs would decrease with the increasing demand in the country, and developing programs that increase the national coverage of environmental quality information, an initiative that is increasingly necessary for a situation of uncertain environmental changes as a result of climate change.
Finally, the conservation of mangrove systems is not guaranteed. These systems provide services that benefit shrimp farmers due to their ability to remove excess organic compounds in the vicinity of shrimp farm drainage, functioning as biofilters [100,101,102,103]. Hence, the involvement of the shrimp sector in the development of applied research and local strengthening actions (i.e., support for the training of local professionals, support for communities in their area of influence in mangrove reforestation) is necessary. The conservation of mangrove systems coexisting with shrimp farms must involve the participation of all its actors.

5. Conclusions

Shrimp farming in Esmeraldas’ mangroves systems reduces water quality and modifies the characteristics of sediments and their benthic assemblages. Shrimp farming increases the organic enrichment in the water while reducing the organic matter content in sediments or the equivalent carbon storage, one of the most important functions of mangrove ecosystems.
The proximity to sea outlets and the connectivity with the watercourses allow for more favorable conditions than the inland sites where tidal currents decrease. The three inland locations of Cojimies presented the worst conditions within the evaluated sectors, and the REMACAM close to sea outlets showed good conditions.
Cossura rostrata populations increase in shrimp farms drainages and the polychaetes Nepthyidae, Oenonidae and Maldanidae and the bivalve Polymesoda inflata populations decrease with total nitrogen levels in the sediments, however, to corroborate their quality as indicators, further sampling is required in more estuaries with mangroves on the Ecuadorean coast.
The analysis of more biological variables associated with sediment quality, such as the description of microbial communities, should be included in future monitoring systems exclusively focused on water quality.
Finally, the regulatory framework for shrimp farms in mangrove systems should be more specific regarding information requirements on the chemical and ecological status within farms and their adjacent environment.

Author Contributions

E.R.M. Conceptualization, Fundind adquisition, Project administration, methodology, investigation, formal analysis, writing—original draft preparation. L.V.V., validation, GIS software, writing—review and editing. All authors have read and agreed to the published version of the manuscript.

Funding

This work has been financed in part by the PUCV Postgraduate Internal Sscholarship 2018 and the Scholarships for Postgraduate Teachers and PUCESE administratives 2018-2021 and the investigators.

Institutional Review Board Statement

Not applicable.

Informed Consent Statement

Not applicable.

Data Availability Statement

Not applicable.

Acknowledgments

We thank the Ministerio del Ambiente Agua y Transicion Ecologica del Ecuador (MAATE), the Pontificia Universidad Católica del Ecuador Sede Esmeraldas (PUCESE) and the Pontificia Universidad Catolica de Valparaiso PUCV for their technical support.

Conflicts of Interest

The authors declare no conflict of interest.

References

  1. FAO. Ecuador. Available online: https://www.fao.org/fishery/en/countrysector/ec/en?lang=en (accessed on 21 June 2022).
  2. FAO. FishStatJ Version: 4.02.06. Available online: www.fao.org/fishery/statistics/software/fishstatj/es (accessed on 21 June 2022).
  3. Zhao, M.; Yao, D.; Li, S.; Zhang, Y.; Aweya, J.J. Effects of ammonia on shrimp physiology and immunity: A review. Rev. Aquac. 2020, 12, 2194–2211. [Google Scholar] [CrossRef]
  4. Sohel, S.I.; Ullah, H. Ecohydrology: A framework for overcoming the environmental impacts of shrimp aquaculture on the coastal zone of Bangladesh. Ocean Coast. Manag. 2012, 63, 67–78. [Google Scholar] [CrossRef]
  5. Ottinger, M.; Clauss, K.; Kuenzer, C. Aquaculture: Relevance, distribution, impacts and spatial assessments—A review. Ocean Coast. Manag. 2016, 119, 244–266. [Google Scholar] [CrossRef]
  6. Jayanthi, M.; Thirumurthy, S.; Muralidhar, M.; Ravichandran, P. Impact of shrimp aquaculture development on important ecosystems in India. Glob. Environ. Chang. 2018, 52, 10–21. [Google Scholar] [CrossRef]
  7. Treviño, M.; Murillo-Sandoval, P.J. Uneven consequences: Gendered impacts of shrimp aquaculture development on man-grove dependent communities. Ocean Coast Manag. 2021, 210, 105688. [Google Scholar] [CrossRef]
  8. Bunting, P.; Rosenqvist, A.; Lucas, R.M.; Rebelo, L.M.; Hilarides, L.; Thomas, N.; Hardy, A.; Itoh, T.; Shimada, M.; Finlayson, C.M. The global mangrove watch—A new 2010 global baseline of mangrove extent. Remote Sens. 2018, 10, 1669. [Google Scholar] [CrossRef] [Green Version]
  9. Leal, M.; Spalding, M.D. (Eds.) The State of the World’s Mangroves 2022. Global Mangrove Alliance. Available online: https://www.mangrovealliance.org/wp-content/uploads/2022/09/The-State-of-the-Worlds-Mangroves-Report_2022.pdf (accessed on 15 February 2023).
  10. Bhowmik, A.K.; Padmanaban, R.; Cabral, P.; Romeiras, M.M. Global Mangrove Deforestation and Its Interacting Social-Ecological Drivers: A Systematic Review and Synthesis. Sustainability 2022, 14, 4433. [Google Scholar] [CrossRef]
  11. CLIRSEN; PMRC. Actualización del Estudio Multitemporal de Manglares, Camaroneras y Áreas Salinas en la Costa Conti-Nental Ecuatoriana al Año 2006. 2007. Available online: http://cpps.dyndns.info/cpps-docs-web/planaccion/docs2013/manglares/Informe%20Final%20PMRC-CLIRSEN.PDF (accessed on 25 June 2018).
  12. CCONDEM 2020 Informe: Como la Certificación Ambiental Y Social Encubre la Violación de Derechos Humanos y de la Natura-leza en Ecuador. La Acuicultura Industrial del Camarón en el Periodo 2008–2018. Available online: https://www.wrm.org.uy/wp-content/uploads/2021/03/C-Condem-Ecuador-Certificacion-Acuacultura.pdf (accessed on 15 September 2021).
  13. Herbeck, L.S.; Krumme, U.; Andersen, T.J.; Jennerjahn, T.C. Decadal trends in mangrove and pond aquaculture cover on Hainan (China) since 1966: Mangrove loss, fragmentation and associated biogeochemical changes. Estuar. Coast. Shelf Sci. 2019, 233, 106531. [Google Scholar] [CrossRef]
  14. Santos-Andrade, M.; Hatje, V.; Arias-Ortiz, A.; Patire, V.F.; da Silva, L.A. Human disturbance drives loss of soil organic matter and changes its stability and sources in mangroves. Environ. Res. 2021, 202, 111663. [Google Scholar] [CrossRef]
  15. Bournazel, J.; Kumara, M.P.; Jayatissa, L.P.; Viergever, K.; Morel, V.; Huxham, M. The impacts of shrimp farming on land-use and carbon storage around Puttalam lagoon, Sri Lanka. Ocean Coast. Manag. 2015, 113, 18–28. [Google Scholar] [CrossRef] [Green Version]
  16. Morshed, M.; Islam, S.; Das Lohano, H.; Shyamsundar, P. Production externalities of shrimp aquaculture on paddy farming in coastal Bangladesh. Agric. Water Manag. 2020, 238, 106213. [Google Scholar] [CrossRef]
  17. Aldridge, D.; Salazar, M.; Serna, A.; Cock, J. Density-dependent effects of a new invasive false mussel, Mytilopsis trautwineana (Tryon 1866), on shrimp, Litopenaeus vannamei (Boone 1931), aquaculture in Colombia. Aquaculture 2008, 281, 34–42. [Google Scholar] [CrossRef]
  18. Khanjani, M.H.; da Silva, L.O.B.; Fóes, G.K.; Vieira, F.D.N.; Poli, M.A.; Santos, M.; Emerenciano, M.G.C. Synbiotics and aquamimicry as alternative microbial-based approaches in intensive shrimp farming and biofloc: Novel disruptive techniques or complementary management tools? A scientific-based overview. Aquaculture 2023, 567, 739273. [Google Scholar] [CrossRef]
  19. Camacho-Jiménez, L.; Álvarez-Sánchez, A.R.; Mejía-Ruíz, C.H. Silver nanoparticles (AgNPs) as antimicrobials in marine shrimp farming: A review. Aquac. Rep. 2020, 18, 100512. [Google Scholar] [CrossRef]
  20. Luu, Q.H.; Nguyen, T.B.T.; Nguyen, T.L.A.; Do, T.T.T.; Dao, T.H.T.; Padungtod, P. Antibiotics use in fish and shrimp farms in Vietnam. Aquac. Rep. 2021, 20, 100711. [Google Scholar] [CrossRef]
  21. Nunes, A.J.; Dalen, L.L.; Leonardi, G.; Burri, L. Developing sustainable, cost-effective and high-performance shrimp feed formulations containing low fish meal levels. Aquac. Rep. 2022, 27, 101422. [Google Scholar] [CrossRef]
  22. Latorre, S. Resisting environmental dispossession in Ecuador: Whom does the political category of “ancestral peoples of the mangrove ecosystem” include and aim to empower? J. Agrar. Chang. 2014, 14, 541–563. [Google Scholar] [CrossRef]
  23. Mialhe, F.; Gunnell, Y.; Mering, C. The impacts of shrimp farming on land use, employment and migration in Tumbes, northern Peru. Ocean Coast. Manag. 2013, 73, 1–12. [Google Scholar] [CrossRef]
  24. Arifanti, V.B.; Kauffman, J.B.; Hadriyanto, D.; Murdiyarso, D.; Diana, R. Carbon dynamics and land use carbon footprints in mangrove-converted aquaculture: The case of the Mahakam Delta, Indonesia. For. Ecol. Manag. 2018, 432, 17–29. [Google Scholar] [CrossRef]
  25. Tan, J.; Lichtfouse, E.; Luo, M.; Liu, Y.; Tan, F.; Zhang, C.; Chen, X.; Huang, J.; Xiao, L. Aquaculture drastically increases methane production by favoring acetoclastic rather than hydrogenotrophic methanogenesis in shrimp pond sediments. Aquaculture 2023, 563, 738999. [Google Scholar] [CrossRef]
  26. Queiroz, H.M.; Artur, A.G.; Taniguchi, C.A.K.; Silveira, S.A.K.; Nascimento, M.S.; Nóbrega, J.C.; Otero, G.N.; Ferreira, X.L.; Osorio, T. Hidden contribution of shrimp farming effluents to greenhouse gas emissions from mangrove soils. Estuar. Coast. Shelf Sci. 2019, 221, 8–14. [Google Scholar] [CrossRef]
  27. Thomas, Y.; Courties, C.; El Helwe, Y.; Herbland, A.; Lemonnier, H. Spatial and temporal extension of eutrophication associated with shrimp farm wastewater discharges in the New Caledonia lagoon. Mar. Pollut. Bull. 2010, 61, 387–398. [Google Scholar] [CrossRef] [PubMed] [Green Version]
  28. Barraza-Guardado, R.H.; Arreola-Lizárraga, J.A.; Miranda-Baeza, A.; Juárez-García, M.; Juvera-Hoyos, A.; Casillas-Hernández, R. Enhancing Ecoefficiency in Shrimp Farming through Interconnected Ponds. BioMed Res. Int. 2015, 2015, 873748. [Google Scholar] [CrossRef] [PubMed] [Green Version]
  29. Medina-Galván, J.; Osuna-Martínez, C.C.; Padilla-Arredondo, G.; Frías-Espericueta, M.G.; Barraza-Guardado, R.H.; Arreola-Lizárraga, J.A. Comparing the biogeochemical functioning of two arid subtropical coastal lagoons: The effect of wastewater discharges. Ecosyst. Heal. Sustain. 2021, 7. [Google Scholar] [CrossRef]
  30. Avnimelech, Y.; Ritvo, G. Shrimp and fish pond soils: Processes and management. Aquaculture 2003, 220, 549–567. [Google Scholar] [CrossRef] [Green Version]
  31. Funge-Smith, S.J.; Briggs, M.R. Nutrient budgets in intensive shrimp ponds: Implications for sustainability. Aquaculture 1998, 164, 117–133. [Google Scholar] [CrossRef]
  32. Molnar, N.; Welsh, D.T.; Marchand, C.; Deborde, J.; Meziane, T. Impacts of shrimp farm effluent on water quality, benthic metabolism and N-dynamics in a mangrove forest (New Caledonia). Estuar. Coast. Shelf Sci. 2013, 117, 12–21. [Google Scholar] [CrossRef]
  33. Páez-Osuna, F. The environmental impact of shrimp aquaculture: Causes, effects, and mitigating alternatives. Environ. Manag. 2001, 28, 131–140. [Google Scholar] [CrossRef]
  34. Biao, X.; Ding, Z.; Wang, X. Impact of the intensive shrimp farming on the water quality of the adjacent coastal creeks from Eastern China. Mar. Pollut. Bull. 2004, 48, 543–553. [Google Scholar] [CrossRef]
  35. Bui, T.D.; Luong-Van, J.; Austin, C.M. Impact of shrimp farm effluent on water quality in coastal areas of the world heritage-listed Ha Long Bay. Am. J. Environ. Sci. 2012, 8, 104–116. [Google Scholar]
  36. Herbeck, L.S.; Unger, D.; Wu, Y.; Jennerjahn, T.C. Effluent, nutrient and organic matter export from shrimp and fish ponds causing eutrophication in coastal and back-reef waters of NE Hainan, tropical China. Cont. Shelf Res. 2013, 57, 92–104. [Google Scholar] [CrossRef]
  37. Cardoso-Mohedano, J.-G.; Bernardello, R.; Sanchez-Cabeza, J.-A.; Páez-Osuna, F.; Ruiz-Fernández, A.-C.; Molino-Minero-Re, E.; Cruzado, A. Reducing nutrient impacts from shrimp effluents in a subtropical coastal lagoon. Sci. Total Environ. 2016, 571, 388–397. [Google Scholar] [CrossRef]
  38. Barcellos, D.; Queiroz, H.M.; Nóbrega, G.N.; de Oliveira Filho, R.L.; Santaella, S.T.; Otero, X.L.; Ferreira, T.O. Phosphorus en-riched effluents increase eutrophication risks for mangrove systems in northeastern Brazil. Mar. Pollut. Bull. 2019, 142, 58–63. [Google Scholar] [CrossRef]
  39. Bravo Aguas, Y.M. Valoración Económica de Manglares del Sur de la Reserva REMACAM Próximos a Camaroneras Mediante el Método de Reposición de Daño. Master’s Thesis, Escuela de Gestión Ambiental, Pontificia Universidad Católica del Ecuador Sede Esmeraldas, Esmeraldas, Ecuador, 2018. [Google Scholar]
  40. Mohanty, R.K.; Ambast, S.; Panigrahi, P.; Mandal, K. Water quality suitability and water use indices: Useful management tools in coastal aquaculture of Litopenaeus vannamei. Aquaculture 2018, 485, 210–219. [Google Scholar] [CrossRef]
  41. Costa, B.G.B.; Soares, T.M.; Torres, R.F.; Lacerda, L.D. Mercury distribution in a mangrove tidal creek affected by intensive shrimp farming. Bull. Environ. Contam. Toxicol. 2013, 90, 537–541. [Google Scholar] [CrossRef]
  42. León-Cañedo, J.A.; Alarcón-Silvas, S.G.; Fierro-Sañudo, J.F.; Mariscal-Lagarda, M.M.; Díaz-Valdés, T.; Páez-Osuna, F. Assessment of environmental loads of Cu and Zn from intensive inland shrimp aquaculture. Environ. Monit. Assess. 2017, 189, 69. [Google Scholar] [CrossRef]
  43. Na Nakorn, A.; Chevakidagarn, P.; Danteravanich, S. Environmental impact of white shrimp culture during 2012–2013 at Bandon Bay, Surat Thani Province: A case study investigating farm size. Agric. Nat. Resour. 2017, 51, 109–116. [Google Scholar] [CrossRef]
  44. Bui, T.D.; Luong-Van, J.; Maier, S.W.; Austin, C.M. Assessment and monitoring of nutrient loading in the sediments of tidal creeks receiving shrimp farm effluent in Quang Ninh, Vietnam. Environ. Monit. Assess. 2013, 185, 8715–8731. [Google Scholar] [CrossRef]
  45. Nóbrega, G.N.; Ferreira, T.O.; Romero, R.E.; Marques, A.G.B.; Otero, X.L. Iron and sulfur geochemistry in semi-arid mangrove soils (Ceará, Brazil) in relation to seasonal changes and shrimp farming effluents. Environ. Monit. Assess. 2013, 185, 7393–7407. [Google Scholar] [CrossRef]
  46. Nuto Nóbrega, G.; Otero, X.L.; Macias, F.; Ferreira, T. Phosphorus geochemistry in a Brasilian semiarid mangrove soil af-fected by shrimp farm effluents. Environ. Monit. Assess. 2014, 186, 5749–5762. [Google Scholar] [CrossRef]
  47. Aschenbroich, A.; Marchand, C.; Molnar, N.; Deborde, J.; Hubas, C.; Rybarczyk, H.; Meziane, T. Spatio-temporal variations in the composition of organic matter in surface sediments of a mangrove receiving shrimp farm effluents (New Caledonia). Sci. Total Environ. 2015, 512–513, 296–307. [Google Scholar] [CrossRef] [PubMed]
  48. Suarez-Abelenda, M.; Ferreira, T.; Camps-Arbestain, M.; Rivera-Monroy, V.; Macias, F.; Nuto Nóbrega, G.; Otero, X.L. The effect of nutrient-rich effluents from shrimp farming on mangrove soil carbon storage and geochemistry under semi-arid climate conditions in Northern Brasil. Geoderma 2014, 213, 551–559. [Google Scholar] [CrossRef]
  49. Pérez, A.; Machado, W.; Gutiérrez, D.; Saldarriaga, M.S.; Sanders, C.J. Shrimp farming influence on carbon and nutrient accu-mulation within Peruvian mangroves sediments. Estuar. Coast. Shelf Sci. 2020, 243, 106879. [Google Scholar] [CrossRef]
  50. Queiroz, H.M.; Ferreira, T.O.; Taniguchi, C.A.K.; Barcellos, D.; Costa do Nascimento, N.; Otero, X.L.; Arthur, A.G. Nitrogen min-eralization and eutrophication risk in mangroves receiving shrimp farming effluents. Environ. Sci. Pollut. Res. 2020, 27, 34941–34950. [Google Scholar] [CrossRef]
  51. Hidayati, N.V.; Prudent, P.; Asis, L.; Vassalo, L.; Torre, F.; Widowati, I.; Sabdono, A.; Syakti, A.D.; Doumenq, P. Assesstment of the ecological and human health risks from metal in shrimp aquaculture environments in Central Java, Indonesia. Eviron. Sci. Pollut. Res. 2020, 27, 41668–41687. [Google Scholar] [CrossRef]
  52. Hong, A.H.; Hargan, K.E.; Williams, B.; Nuangsaeng, B.; Siriwong, S.; Tassawad, P.; Chaiharn, C.; Los Huertos, M. Mollusc as bioincicator of shrimp aquaculture effluent contamination in a southeast Asian mangrove. Ecol. Indic. 2020, 115, 106365. [Google Scholar] [CrossRef]
  53. de Lacerda, L.D.; Ward, R.D.; Godoy, M.D.P.; Meireles, A.J.D.A.; Borges, R.; Ferreira, A.C. 20-Years Cumulative Impact from Shrimp Farming on Mangroves of Northeast Brazil. Front. For. Glob. Chang. 2021, 4, 653096. [Google Scholar] [CrossRef]
  54. Ribeiro, L.; Eca, G.; Barros, F.; Hatje, V. Impacts of shrimp farming cultivation cycles on macrobenthic assemblages and chem-istry of sediments. Environ. Pollut. 2016, 211, 307–315. [Google Scholar] [CrossRef]
  55. Hatje, V.; de Souza, M.M.; Ribeiro, L.F.; Eça, G.F.; Barros, F. Detection of environmental impacts of shrimp farming through multiple lines of evidence. Environ. Pollut. 2016, 219, 672–684. [Google Scholar] [CrossRef]
  56. Hernandez, L.D.C. Subsecretario de Acuicultura. Oficio N° MAP-SUBACUA-2018-0392-O, Relativo a Predios ca-maroneros dirigido a la Cámara nacional de Acuacultura, Guayaquil 7 de marzo 2018.Ministerio de Acuacultura y Pesca del Ecuador, MAP 2018.
  57. Worthington, T.A.; Zu Ermgassen, P.S.E.; Friess, D.A.; Krauss, K.W.; Lovelock, C.E.; Thorley, J.; Tingey, R.; Woodroffe, C.D.; Bunting, P.; Cormier, N.; et al. A global biophysical typology of mangroves and its relevance for ecosystem structure and deforestation. Sci. Rep. 2020, 10, 14652. [Google Scholar] [CrossRef]
  58. Hamilton, S. Mangroves and Aquaculture, a Five-Decade Remote Sensing Analysis of Ecuador’s Estuarine Environmental; Coastal Reserach Library; Springer: Boca Raton, FL, USA, 2020; Volume 33, p. 211. [Google Scholar]
  59. Boyd, C.E.; Tucker, C.S. Water Quality and Pond Soil Analysis for Aquaculture; Alabama Agricultural Experiment Station, Auburn University: Auburn, AL, USA, 1992; p. 183. [Google Scholar]
  60. American Public Health Association; American Water Works Association; Water Environmental Federation. APHA Standard Methods for the Examination of Water and Wastewater, 20th ed.; American Public Health Association, American Water Works Association and Water Environmental Federation: Washington, DC, USA, 1998. [Google Scholar]
  61. Byers, S.C.; Mills, E.L.; Stewart, P.L. A comparison of methods of determining organic carbon in marine sediments, with suggestions for a standard method. Hydrobiologia 1978, 58, 43–47. [Google Scholar] [CrossRef]
  62. Borja, A.; Franco, J.; Pérez, V. A marine biotic index to establish the ecological quality of soft-bottom Bentos Within European Estuarine and coastal environments. Mar. Pollut. Bull. 2000, 40, 1100–1114. [Google Scholar] [CrossRef]
  63. Bald, J.; Borja, A.; Muxika, I.; Franco, J.; Valencia, V. Assessing reference conditions and physico-chemical status according to the European Water Framework Directive: A case-study from the Basque Country (Northern Spain). Mar. Pollut. Bull. 2005, 50, 1508–1522. [Google Scholar] [CrossRef]
  64. Muxika, I.; Borja, A.; Bald, J. Using historical data, expert judgement, and multivariate analysis in assessing reference condi-tions and benthic ecological status, according to the European Water Framework Directive. Mar. Pollut. Bull. 2007, 55, 16–29. [Google Scholar] [CrossRef]
  65. Royston, J.P. An extension of Shapiro and Wilk’s W test for normality to large samples. Appl. Stat. 1982, 31, 115–124. [Google Scholar] [CrossRef]
  66. Conover, W.; Johnson, M.E.; Johnson, M.M. A comparative study of tests for homogeneity of variances, with applications to the outer continental shelf bidding data. Technometrics 1981, 23, 351–361. [Google Scholar] [CrossRef]
  67. Forrest, W. Young. Scaling. Annual Review of Psychology. Aims Scope J. 1974, 35, 55–81. [Google Scholar]
  68. Ahsan, M.; Mahmud, M.A.P.; Saha, P.K.; Gupta, K.D.; Siddique, Z. Effect of Data Scaling Methods on Machine Learning Algorithms and Model Performance. Technologies 2021, 9, 52. [Google Scholar] [CrossRef]
  69. Past3x. The Past of the Future Natural History Museum and University of Oslo. 2013. Available online: https://www.nhm.uio.no/english/research/resources/past/ (accessed on 15 February 2020).
  70. R Core Team. R: A Language and Environment for Statistical Computing; R Foundation for Statistical Computing: Vienna, Austria, 2021; Available online: https://www.R-project.org/ (accessed on 20 March 2018).
  71. Reserva Ecológica Manglares Cayapas-Mataje. Available online: https://www.ambiente.gob.ec/reserva-ecologica-manglares-cayapas-mataje/ (accessed on 10 March 2023).
  72. Inpectoria de Acuicultura; (Base de Datos de Predios Camaroneros de la Provincia de Esmeraldas, Esmeraldas, Ecuador). Personal Communication, 2019.
  73. Refúgio de Vida Silvestre Manglares Rio Muisne. Available online: http://areasprotegidas.ambiente.gob.ec/es/areas-protegidas/refugio-de-vida-silvestre-manglar-el-estuario-del-r%C3%ADo-muisne (accessed on 10 March 2023).
  74. Ofori, S.A.; Kodikara, S.K.A.; Jayatissa, L.P.; Madarasinghe, S.K.; Mafaziya Nijamdeen, T.W.G.F.; Dahdouh-Guebas, F. What is the ecological footprint of aquaculture after 5 decades of competition between mangrove conservation and shrimp farm de-velopment. Aquat. Conserv. Mar. Freshw. Ecosyst. 2023, 33, 15–28. [Google Scholar] [CrossRef]
  75. Hamilton, S.E.; Lovette, J. Ecuador’s Mangrove Forest carbon Stocks: A Spatiotemporal Analysis of Living Carbon Holdings and Their depletion since the Asvent of Commercial Aquaculture. PLoS ONE 2015, 10, e0118880. [Google Scholar] [CrossRef]
  76. Wu, R. The environmental impact of marine fish culture: Towards a sustainable future. Mar. Pollut. Bull. 1995, 31, 159–166. [Google Scholar] [CrossRef]
  77. Jones, A.; O’Donohue, M.; Udy, J.; Dennison, W. Assessing ecological impacts of shrimp and sewage effluent: Biological indicators with standard water quality analyses. Estuar. Coast. Shelf Sci. 2001, 52, 91–109. [Google Scholar] [CrossRef]
  78. Alongi, D.M.; Boto, K.G.; Robertson, A.I. Nitrogen and phosphorus cycles. In Tropical Mangrove Ecosystems; Robertson, A.I., Alongi, D.M., Eds.; Coastal and estuarine studies 41; AGU: Washington, DC, USA, 1992; pp. 251–292. [Google Scholar]
  79. Rao, K.; Ramanathan, A.; Raju, N.J. Assessment of Blue Carbon Stock of Coringa mangroves: Climate change Perspective. J. Clim. Chang. 2022, 8, 41–58. [Google Scholar] [CrossRef]
  80. Adame, M.F.; Connolly, R.M.; Turschwell, M.P.; Lovelock, C.E.; Fatoyinbo, T.; Lagomasino, D.; Goldberg, L.A.; Holdorf, J.; Friess, D.A.; Sasmito, S.D.; et al. Future carbon emissions from global mangrove forest loss. Glob. Chang. Biol. 2021, 27, 2856–2866. [Google Scholar] [CrossRef] [PubMed]
  81. Donato, D.C.; Kauffman, J.B.; Murdiyarso, D.; Kurnianto, S.; Stidham, M.; Kanninen, M. Mangroves among the most carbon-rich forests in the tropics. Nat. Geosci. 2011, 4, 293–297. [Google Scholar] [CrossRef]
  82. Acuerdo 097-A, Anexo 1, Libro VI del Texto Unificado de Legislación Secundaria del Ministerio del Ambiente: Norma de Calidad Ambiental y de Descarga de Efluentes Recurso Agua. Available online: https://www.gob.ec/sites/default/files/regulations/2018-09/Documento_Registro-Oficial-No-387-04-noviembre-2015_0.pdf (accessed on 24 April 2021).
  83. Hargrave, B.T.; Phillips, G.A.; Doucette, L.I.; White, M.J.; Milligan, T.G.; Wildish, D.J.; Cranston, R.-E. Assessing benthic im-pacts of organic enrichment from marine aquaculture. Water Air Soil Pollut. 1997, 99, 641–650. [Google Scholar] [CrossRef]
  84. Hargrave, B.T.; Holmer, M.; Newcombe, C.P. Towards a classification of organic enrichment in marine sediments based on biochemical indicators. Mar. Pollut. Bull. 2008, 56, 810–824. [Google Scholar] [CrossRef]
  85. Normativa Sectorial: Reglamento Ambiental para la Acuicultura, Gobierno de Chile 2016. Available online: https://mma.gob.cl/wp-content/uploads/2017/09/16_Susana-Giglio_Subpesca.pdf (accessed on 24 December 2022).
  86. Breithaupt, L.; Steinmuller, H.E. Refining the Global Estimate of Mangrove Carbon Burial Rates Using Sedimentary and Geo-Morphic Settings. Geophys. Res. Lett. 2022, 49, 100177. [Google Scholar] [CrossRef]
  87. Buringh, P. Organic carbon in soils of the world. In The Role of Terrestrial Vegetation in the Global Carbon Cycle: Measurement by Remote Sensing; Woodwell, G.M., Ed.; John Wiley & Sons Ltd.: New York, NY, USA, 1984; pp. 91–109. [Google Scholar]
  88. Eid, E.M.; Arshad, M.; Shaltour, K.H.; El-Sheik, M.A.; Alfarhan, A.H.; Píco, Y.; Barcelo, D. Effect of the conversion of mangroves into shrimp farms on carbon stock in the sediment along the southern Red Sea coast, Saudi Arabia, 2019. Environ. Res. 2019, 176, 108536. [Google Scholar] [CrossRef]
  89. Merecí-Guamán, J.; Casanoves, F.; Delgado-Rodríguez, D.; Ochoa, P.; Cifuentes-Jara, M. Impact of shrimp ponds on Mangrove Blue Carbon Stocks in Ecuador. Forests 2021, 12, 816. [Google Scholar] [CrossRef]
  90. Tian, Y.; Chen, G.; Lu, H.; Zhu, H.; Ye, Y. Effects of shrimp ponds on stocks of organic carbon, nitrogen and phosphorus in soils of Kandelia obovata forest along Jiulong River Estuary. Mar. Pollut. Bull. 2019, 149, 110657. [Google Scholar] [CrossRef]
  91. Loiola, M.; Silva, A.E.T.; Krull, M.; Barbosa, F.A.; Galvão, E.H.; Patire, V.F.; Cruz, I.C.S.; Barros, F.; Hatje, V.; Meirelles, P.M. Mangrove microbial community recovery and their role in early stages of forest recolonization within shrimp ponds. Sci. Total. Environ. 2023, 855, 158863. [Google Scholar] [CrossRef]
  92. Adame, M.F.; Zakaria, R.M.; Fry, B.; Chong, V.C.; Then, Y.H.A.; Brown, C.J.; Lee, S.Y. Loss and recovery of carbon and nitrogen after mangrove clearing. Ocean. Coast. Manag. 2018, 161, 117–126. [Google Scholar] [CrossRef]
  93. Chinacalle-Martínez, N.; García-Rada, E.; López-Macías, J.; Pinoargote, S.; Loor, G.; Zevallos-Rosado, J.; Cruz, P.; Andrade, D.P.B.; Robalino-Mejia, C.; Añazco, F.; et al. Oceanic primary production trend pat-terns along coast of Ecuador. Neotrop. Biodivers. 2021, 7, 379–391. [Google Scholar] [CrossRef]
  94. Feebarani, J.; Joydas, T.; Damodaran, R.; Borja, A. Benthic quality assessment in a naturally- and human-stressed tropical estuary. Ecol. Indic. 2016, 67, 380–390. [Google Scholar] [CrossRef]
  95. Kamalifar, R.; Aeinjamshid, K.; Nurinejad, M.; Dehghan-Mediseh, S.; Vazirizadeh, A. Ecological status assessment of Bidkhun mangrove swamp from Bushehr province, Persian Gulf, using macrofauna community structure. AACL Aquac. Aquar. Conserv. Legis. 2016, 9, 8–19. [Google Scholar]
  96. Tweedley, J.R.; Warwick, R.M.; Robert Clarke, K.; Potter, I.C. Family-level AMBI is valid for use in the north-eastern Atlantic but not for assesing the health of microtidal Australian estuaries. Estuar. Coast. Shelf Sci. 2014, 141, 85–96. [Google Scholar] [CrossRef] [Green Version]
  97. Perfil para la zona del Estuario de Cojimíes. Centro Regional para el Manejo de Ecosistemas Costeros, EcoCostas. Agosto 2005. USAID. Available online: https://www.crc.uri.edu/download/Cojimies_final-1.pdf (accessed on 3 March 2023).
  98. Navarro, E. Ecuador: La codicia camaronera en Cojimíes. Notícias de Navarra. 2022. Available online: https://www.noticiasdenavarra.com/mundo/2022/09/25/ecuador-codicia-camaronera-cojimies-6026032.html (accessed on 3 March 2023).
  99. Reglamento General a la ley Orgánica para el Desarrollo de la Acuicultura y Pesca. Available online: https://www.produccion.gob.ec/wp-content/uploads/downloads/2022/03/Decreto-Ejecutivo-No.-362-Reglamento-General-a-la-Ley-Organica-para-el-Desarrollo-de-la-Acuicultura-y-Pesca.pdf (accessed on 6 June 2022).
  100. Gautier, D. The Integration of Mangrove and Shrimp Farming: A Case Study on the Caribbean Coast of Colombia; Department of fisheries and Allied Aquacultures, Auburn University, Alabama 36849 USA. In Report Prepared for the World Bank, Network of Aquaculture Centres in Asia-Pacific, World Wildlife Foundation and FAO Consortium Program on Shrimp Farming and the Environment; Work in Progress for Public Discussion; The Consortium: Singapore, 2002; p. 26. [Google Scholar]
  101. Primavera, J.; Altamirano, J.; Lebata, M.J.H.L.; de los Reyes, A.A., Jr.; Pitogo, C.L. Mangroves and shrimp pond culture effluents in Aklan, Panay Is., central Philippines. Bull. Mar. Sci. 2007, 80, 795–804. [Google Scholar]
  102. Zaldivar-Jimenez, A.; Herrera-Silveira, J.; Perez-Ceballos, R.; Teutli-Hernandez, C. Evaluación del uso de humedales de manglar como biofiltro de efluentes de camaroneras en Yucatán, México. Rev. Biol. Mar. Oceanogr. 2012, 47, 395–405. [Google Scholar] [CrossRef]
  103. Colette, M.; Guentas, L.; Gunkel-Grillon, P.; Callac, N.; Della Patrona, L. Is halophyte species growing in the vicinity of the shrimp ponds a promising agri-aquaculture system for shrimp ponds remediation in New Caledonia? Mar. Pollut. Bull. 2022, 177, 113563. [Google Scholar] [CrossRef]
Figure 1. Study area and principal sectors. Left, Ecological Reserve Manglares Cayapas Mataje REMACAM inside of this A = Palma Real, B = Tambillo; right, Mangroves Estuary of the Muisne River Wildlife Refuge RVSMMC, C = Muisne and D = Cojimies. The map is adapted from the geographic information on land use and cover of the Ministry of Agriculture of Ecuador, within the official borders of the protected areas of the Ministry of the environment, water and ecological transition of Ecuador.
Applsci 13 07749 g001
Figure 2. Location of sampling sites by principal sectors. The map shows the mangrove coverage provided by Global Mangrove Watch within the official borders of protected areas of the Ministry of the environment, water and ecological transition of Ecuador.
Applsci 13 07749 g002
Figure 3. (a): Natural Drainage or mangrove (MG). (b): Modified drainage to Shrimp Farm (SF).
Applsci 13 07749 g003
Figure 4. Violin plots of sediment organic matter content in natural drainages (MG) and modified drainages (SF).
Applsci 13 07749 g004
Figure 5. Redox potential by depth in natural drainages (MG) and modified drainages (SF).
Applsci 13 07749 g005
Figure 6. n-MDS plot of benthic assemblages considering sector and season with Bray Curtis similarity coefficient. C = Cojimies, M = Muisne; T = Tambillo, P = Palma Real. W = Winter, S = Summer.
Applsci 13 07749 g006
Figure 7. Boxplots of AMBI index values integrating benthic assemblages by site. C = Cojimíes, M = Muisne, P = Palma Real and T = Tambillo.
Applsci 13 07749 g007
Figure 8. Principal components analysis. Sectors: C = Cojimies, M = Muisne; T = Tambillo, P = Palma Real. W = Winter (lower graph), S = Summer (upper graph).
Applsci 13 07749 g008
Figure 9. Canonical correspondence analysis between common benthic species and quality parameters of sediments. Species code: Phyl. Sp1 = Phyllodoce sp1, Cap. sp = Capitella sp., Peri. sp = Perinereis sp., Prion. sp = Prionosprio sp., Cos. Rostrata = Cossura rostrata, Carc. sp = Carcinoplax sp., Eucly. sp = Euclymene sp., Poly. Inflata = Polymesoda inflata, Nep. sp1 = Nepthys sp1, Nep. sp2 = Nepthys sp2, Ara. sp = Arabella sp.
Applsci 13 07749 g009
Table 1. Summary of water quality parameters (mean ± SD) measured in the confluence of drainages and the navigable channels of estuaries with mangroves in the study area.
ParameterGlobal MeanSECTORSSYSTEMTYPESEASON
PRTAMUCOREMRVSSFMGSUWI
Temperature (°C)27.07 ± 1.3927.85 ± 0.62 a28.25 ± 0.95 a26.34 ± 1.14 b25.85 ± 1.18 b28.05 ± 0.81 a26.09 ± 1.15 b26.63 ± 1.48 b27.73 ± 0.96 a26.53 ± 1.5427.62 ± 0.99
Salinity (ppt)15.82 ± 7.2917.07 ± 6.8113.23 ± 1.0715.51 ± 11.0717.49 ± 6.9215.15 ± 5.1416.50 ± 9.0415.91 ± 8.3115.69 ± 5.6816.72 ± 7.7014.93 ± 6.94
Dissolved oxigen *4.78 ± 1.364.62 ± 1.174.73 ± 1.315.18 ± 1.384.59 ± 1.664.68 ± 1.214.89 ± 1.525.13 ± 1.35 a4.26 ± 1.25 b5.17 ± 1.374.39 ± 1.27
Oxigen
saturation %
60.30 ± 17.1559.71 ± 15.6860.65 ± 16.6864.13 ± 17.5556.72 ± 20.2960.04 ± 17.0558.71 ± 21.3064.91 ± 19.0255.14 ± 17.8665.44 ± 18.45 a51.68 ± 16.98 b
DBO5 *11.01 ± 5.619.21 ± 3.47 a,b14.46 ± 8.46 a12.16 ± 4.22 a,b8.21 ± 2.75 b11.84 ± 6.8510.18 ± 4.0211.73 ± 5.569.93 ± 5.6713.65 ± 6.49 a8.36 ± 2.74 b
Electrical
conductivity (µS/cm)
27.53 ± 10.8929.55 ± 11.3223.22 ± 2.2428.33 ± 15.9929.26 ± 11.8726.38 ± 8.5828.88 ± 13.2427.79 ± 12.0627.18 ± 9.4729.85 ± 9.7525.55 ± 11.63
REDOX (mV)132.59 ± 60.29112.11 ± 47.40133.08 ± 90.40110.12 ± 32.80175.04 ± 35.01122.59 ± 71.07142.58 ± 46.90144.21 ± 43.27115.15 ± 77.71120.28 ± 74.02144.90 ± 40.77
pH 7.32 ± 0.49 a,b6.90 ± 0.52 b7.74 ± 0.16 a7.46 ± 0.36 a7.14 ± 0.53 b7.60 ± 0.31 a7.52 ± 0.40 a7.23 ± 0.50 b7.75 ± 0.17 a7.08 ± 0.44 b
Ammonium *0.08 ± 0.070.05 ± 0.040.05 ± 0.040.11 ± 0.060.10 ± 0.100.05 ± 0.04 b0.11 ± 0.08 a0.10 ± 0.07 a0.04 ± 0.04 b0.10 ± 0.06 a0.06 ± 0.08 b
Nitrate *0.12 ± 0.160.03 ± 0.03 b0.05 ± 0.06 b0.14 ± 0.10 a,b0.270 ± 0.24 a0.04 ± 0.05 b0.21 ± 0.19 a0.15 ± 0.170.08 ± 0.140.14 ± 0.180.11 ± 0.14
Nitrite *0.06 ± 0.090.02 ± 0.01 b0.06 ± 0.08 a,b0.02 ± 0.01 b0.13 ± 0.13 a0.04 ± 0.060.08 ± 0.110.06 ± 0.080.05 ± 0.090.04 ± 0.080.07 ± 0.09
Total Nitrogen *4.31 ± 1.694.10 ± 1.51 a,b2.83 ± 0.34 b4.57 ± 1.85 a5.73 ± 1.33 a3.46 ± 1.25 b5.15 ± 1.68 a4.64 ± 1.833.80 ± 1.353.83 ± 1.264.79 ± 1.95
Phosphate*0.12 ± 0.070.09 ± 0.02 b0.07 ± 0.03 b0.20 ± 0.08 a0.12 ± 0.04 b0.08 ± 0.03 b0.16 ± 0.07 a0.14 ± 0.08 a0.09 ± 0.03 b0.13 ± 0.090.11 ± 0.04
Total
Phosphorus *
0.11 ± 0.110.04 ± 0.030.09 ± 0.140.16 ± 0.060.16 ± 0.150.07 ± 0.10 b0.16 ± 0.11 a0.15 ± 0.13 a0.06 ± 0.06 b0.11 ± 0.130.11 ± 0.10
Chlorophyll a (µg/L)25.72 ± 12.9518.16 ± 7.8226.66 ± 15.1726.59 ± 9.5327.47 ± 16.7622.41 ± 12.5327.03 ± 13.2729.27 ± 13.32 a17.89± 9.01 b22.67 ± 10.2926.77 ± 15.16
Settleable solids *0.14 ± 0.400.10 ± 0.250.10 ± 0.120.06 ± 0.100.31± 0.740.10 ± 0.190.19 ± 0.530.18 ± 0.480.08 ± 0.200.25 ± 0.540.04 ± 0.08
Total suspended solids *51.08 ± 40.0659.61 ± 43.4133.46 ± 19.3065.76 ± 54.1839.92 ± 17.5146.53 ± 35.3457.15 ± 46.1954.03 ± 41.2447.14 ± 373.86 ± 50.98 a34 ± 15.47 b
PR = Palma Real, TA = Tambillo, MU = Muisne, CO = Cojimies, REM = REMACAM, RVS = RVVMMC, SF = Shrimp Farm, MG = Mangrove, SU = Summer and WI = Winter. * = measured in mg/L. Lowercase letters mean statistical differences; Cursive letters mean Kruskal-Wallis’s comparisons.
Table 2. Summary of Physical and chemical parameters (mean ± SD) of sediments acquired in the confluence of drainages and navigable channels of coastal systems with mangroves in Esmeralda´s province, Ecuador.
ParameterGlobal MeanSECTORSYSTEMTYPESEASON
PRTAMUCOREMRVSSFMGSUWI
Electrical conductivity µS/cm7973 ± 31778563 ± 27477204 ± 14707344 ± 43738779 ± 35647883 ± 22558062 ± 39527772 ± 36268273 ± 24338108 ± 30507837 ± 3373
REDOX
mV
3.29 ± 118.2522.80 ± 101.1732.29 ± 107.8411.04 ± 142.76−52.96 ± 115.7827.55 ± 101.89−20.96 ± 130.70−7.29 ± 124.0419.17 ± 110.9629.19 ± 100.63−22.61 ± 131
pH6.72 ± 0.466.30 ± 0.39 b6.67 ± 0.51 a,b7.10 ± 0.35 a,b6.98 ± 0.19 a6.49 ± 0.48 b6.92 ± 0.52 a6.87 ± 0.52 a6.45 ± 0.47 b6.49 ± 0.61 b6.91 ± 0.37 a
Ammonium *6.91 ± 6.034.45 ± 2.87 b4.85 ± 3.96 b5.250 ± 3.92 b13.10 ± 7.82 a4.66 ± 3.37 b9.18 ± 7.24 a8.56 ± 7.07 a4.43 ± 2.63 b6.62 ± 6.727.20 ± 5.41
Total Nitrogen *2052 ± 12133325 ± 981 a2189 ± 963 b1179 ± 755 b1516 ± 967 b2757 ± 1111 a1347 ± 861 b1567 ± 962 b2779 ± 1211 a1586 ± 1302 b2519 ± 931 a
Phosphate *4.30 ± 1.424.15 ± 1.394.5 ± 1.053.85 ± 1.924.70 ± 1.304.33 ± 1.224.28 ± 1.634.29 ± 1.544.31 ± 1.254.30 ± 1.234.30 ± 1.62
TOM %15.25 ± 6.7319.38 ± 4.57 a17.07 ± 10.17 a,b11.13 ± 3.66 b13.42 ± 3.58 a b18.23 ± 7.77 a12.27 ± 3.72 b11.74 ± 4.50 b20.53 ± 6.10 a14.02 ± 6.9816.49 ± 6.39
Coppe r *34.3 ± 11.7834.2 ± 12.4834.2 ± 15.5133.9 ± 12.6834.9 ± 6.5734.2 ± 13.7134.4 ± 9.8535.75 ± 11.7032.13 ± 11.9336.75 ± 14.0331.85 ± 8.67
Mercury *0.05 ± 0.010.05 ± 00.06 ± 0.020.05 ± 00.05 ± 00.05 ± 0.010.05 ± 00.05 ± 00.05 ± 0.010.05 ± 0.010.05 ± 0
Lead *3.69 ± 1.363.79 ± 1.77 a,b3.04 ± 1.19 b3.24 ± 0.99 a,b4.69 ± 0.80 a3.42 ± 1.523.97 ± 1.153.80 ± 1.113.52 ± 1.683.57 ± 1.483.81 ± 1.25
Zinc *47.3 ± 14.0343.4 ± 17.6245.10 ± 17.6649.30 ± 10.5751.4 ± 8.5744.25 ± 17.1950.35 ± 9.4350.38 ± 12.1842.68 ± 15.6955.20 ± 12.52 a39.04 ± 10.44 b
PR = Palma Real, TA = Tambillo, MU = Muisne, CO = Cojimies, REM = REMACAM, RVS = RVVMMC, SF = Shrimp Farm, MG = Mangrove, SU = Summer and WI = Winter. * = measured in mg/Kg. Lowercase letters mean statistical differences, cursive letters mean Kruskal-Wallis’s comparisons.
Table 3. Collected benthic species from soft sediments in the confluence of drainages and navigable channels of estuaries with mangroves in the study area.
SYSTEM
REMRVS
SECTORS
PRTAMUCO
Phyllum/ClassFamilyGenus/Specie/TypeSUWISUWISUWISUWI
1Annellida, PolychaetaCapitellidaeCapitella sp.61452827119
2Notomastus sp.----3---
3NephtyidaeNepthys sp26252132-
4Nepthys sp1181244---
5NereididaePerinereis sp.1-58468-
6Nereis succinea1-1-----
7HessionidaeHesione picta111-2---2
8MaldanidaeMaldane sp.12-4-13--
9Euclymene sp.2121821522-
10TerebellidaeTerebellidae1-------
11PhyllodocidaePhyllodoce sp1414116324
12Phyllodoce sp21-3-1-8-
13PoecilochaeitidaePoecilochaetus sp.2--13-2-
14OenonidaeArabella sp.67142----
15Drilonereis sp.1-113---
16OpheliidaeArmandia sp.531-1---
17SpionidaePrionosprio sp.13713148344-
18GonionidaeGlycinde sp.2-43----
19CossuridaeCossura rostrata--1-9107-6
20CirratulidaeCaulleriella sp.----1-2-
21GlyceridaeGlycera sp.1-1-1---
22OweniidaeOweniidae1-2---1-
23PecteneridaeAmphictene sp.---2----
24SternaspidaeSternaspis sp.-2------
25Mollusca,
Bivalvia
CyrenidaeCorbicula fluminea------3-
26MytilidaeModiolus sp.------1-
27VeneridaeLeukoma asperrima1-----2-
28TellinidaeTellina ecuadoriana--6-20---
29Tellina recurvata----2---
30SolecurtidaeTagelus bourgeoisae1--131--
31MytilidaeMytella guyanensis--22----
32CyrenidaePolymesoda inflata1142----
33CrassatellidaeCrasinella pacifica--4-----
34Molusca,
Gastropods
ColumbellidaeCosmioconcha modesta4-------
35PolinicinaePolinices grayi--1-----
36NassariinaeNassarius versicolor2-------
37Arthropoda, MalacostracaPanopeidaePanopeus sp.------5-
38PenaeidaePenaeus vannamei1-1---1-
49Protrachypene precipua11-1----
39PortunidaeCallinectes sp.------1-
40MithracidaeMicrophrys bicornutus------2-
41OcipodidaeUca sp.----4---
42AlpheidaeAlpheus sp.2-421---
43LeptocheliidaeChondrochelia sp.-102-----
44ParatanaidaePseudoparatanais sp.----5---
45AmphilochidaeAmphilochus sp.-12---1--
46GoneplacidaeCarcinoplax sp.432211--
47BalanidaeBalanus sp. ------1-
48HexapodidaeMariaplax sp.1---1---
53Arthropoda, InsectaDipteraNA----1---
54ChironomidaeChironomus sp.-2-15-2--
50Echinodermata, OphiuroideaOphiotrichidaeOphiotrix spiculata--1-1---
51OphiodermatidaeOphioderma panamense1-3-1-2-
52PlatyhelminthesPlanariidaePlanaria sp.2-122---
55BryozoaStenolaemataBriozoa------1-
56CnidariaAnthozoaAnemone 1---1----
PR = Palma Real, TA = Tambillo, MU = Muisne, CO = Cojimies, REM = REMACAM, RVS = RVVMMC, SF = Shrimp Farm, MG = Mangrove, SU = Summer and WI = Winter.
Table 4. Descriptors of soft bottom benthic assemblages, acquired in the confluence of drainages and navigable channels of coastal systems with mangroves in Esmeralda’s province, Ecuador.
Descriptor/
Index
Global MeanSECTORSYSTEMTYPESEASON
PRTAMUCOREMRVSSFMGSUWI
Richness7 ± 58 ± 5 a,b10 ± 5 a7 ± 4 a,b4 ± 4 b9 ± 5 a5 ± 4 b6 ± 58 ± 59 ± 5a5 ± 4 b
Abundance20 ± 1818 ±14 a,b21 ± 13 a,b31 ± 27 a10 ± 10 b19 ± 1321 ± 2221 ± 2118 ± 1220 ± 1420 ± 22
Dominance0.313 ± 0.2290.302 ± 0.2610.213 ± 0.1020.383 ± 0.2260.371 ± 0.3040.257 ± 0.1980.378 ±
0.252
0.335 ± 0.2390.283 ± 0.2200.222 ± 0.1270.420 ± 0.277
Shannon1.552 ± 0.6871.627 ±
0.746
1.888 ±
0.513
1.314 ±
0.663
1.306 ±
0.759
1.758 ± 0.637 a1.311 ± 0.681 b1.485 ± 0.7001.640 ± 0.6811.824 ±
0.605
1.233 ± 0.652
AMBI2.481 ± 1.6701.269 ±
0.698 b
1.416 ±
0.584 b
3.175 ±
0.808 a
4.062 ±
2.199 a
1.343 ± 0.6313.619 ±
1.676
2.977 ± 1.8611.737 ± 1.1032.145± 1.0222.817 ± 2.156
M-AMBI0.476 ± 0.2340.580 ±
0.173
0.632 ± 0.1510.425 ±
0.171
0.273 ± 0.2620.606 ± 0.1600.349 ±
0.229
0.426 ± 0.2540.555 ± 0.1830.581 ± 0.1980.374 ± 0.226
PR = Palma Real, TA = Tambillo, MU = Muisne, CO = Cojimies, REM = REMACAM, RVS = RVVMMC, SF = Shrimp Farm, MG = Mangrove, SU = Summer and WI = Winter. The lowercase letter means statistical differences, cursive letters means Kruskal-Wallis’s comparisons.
Disclaimer/Publisher’s Note: The statements, opinions and data contained in all publications are solely those of the individual author(s) and contributor(s) and not of MDPI and/or the editor(s). MDPI and/or the editor(s) disclaim responsibility for any injury to people or property resulting from any ideas, methods, instructions or products referred to in the content.

