Article

Research and Application of the Obstacle Avoidance System for High-Speed Railway Tunnel Lining Inspection Train Based on Integrated 3D LiDAR and 2D Camera Machine Vision Technology

Infrastructure Inspection Research Institute, China Academy of Railway Sciences, Beijing 100081, China
*
Author to whom correspondence should be addressed.
Appl. Sci. 2023, 13(13), 7689; https://doi.org/10.3390/app13137689
Submission received: 24 May 2023 / Revised: 15 June 2023 / Accepted: 15 June 2023 / Published: 29 June 2023
(This article belongs to the Special Issue Intelligent Transportation Systems in Smart Cities)

Abstract

:
This study presents an innovative, intelligent obstacle avoidance module intended to significantly enhance the collision prevention capabilities of the robotic arm mechanism onboard a high-speed rail tunnel lining inspection train. The proposed module employs a fusion of ORB-SLAM3 and Normal Distribution Transform (NDT) point cloud registration techniques to achieve real-time point cloud densification, ensuring reliable detection of small-volume targets. By leveraging spatial filtering, cluster computation, and feature extraction, precise obstacle localization information is further obtained. A fusion of multi-modal data is achieved by jointly calibrating 3D LiDAR and camera images. Upon validation through field testing, it is demonstrated that the module can effectively detect obstacles with a minimum diameter of 0.5 cm, with an average deviation controlled within a 1–2 cm range and a safety margin of 3 cm, effectively preventing collisions. Compared to traditional obstacle avoidance sensors, this module provides information across more dimensions, offering robust support for the construction of powerful automated tunnel inspection control systems and digital twin lifecycle analysis techniques for railway tunnels.

1. Introduction

Obstacle detection is one of the key technologies in intelligent obstacle avoidance, which is of great significance for the realization of autonomous driving, intelligent transportation, and robotics. At present, widely applied technologies include obstacle sensing technology [1] and digital twin technology [2,3,4,5]. Obstacle sensing technology mainly collects environmental data through sensors, such as LiDAR (Light Detection and Ranging), millimeter-wave radar, and cameras, and then uses algorithms based on point cloud recognition and machine vision image recognition for obstacle detection and tracking. Digital twin technology is a method for comparing real-world scenarios with virtual ones, which can improve the accuracy of obstacle detection. Many scholars have made significant contributions to the intelligent obstacle avoidance field in terms of sensor usage and algorithm improvement.
In regard to sensor usage, Z.Q. et al. [6] proposed an intelligent obstacle detection system using industrial cameras and LiDAR, enhancing safety in fully automated train operation systems. Milioto et al. [7] presented an improved semantic segmentation method for LiDAR data to address discretization errors and blurry CNN outputs. Multi-sensor fusion approaches [8,9] have increased the reliability of obstacle detection and avoidance. Yang et al. [10] introduced PIXOR, a single-stage detector for real-time object detection in point clouds for autonomous driving, offering accuracy and real-time performance. X.D. et al. [11] improved the reliability of autonomous vehicles with a 3D LiDAR-based obstacle detection and tracking method. Defauw, Nils, et al. [12] proposed real-time vehicle detection on occupancy grid maps, contributing to a dependable environmental model for autonomous driving.
Moreover, deep learning has achieved significant progress in point cloud recognition, as exemplified by PointNet [13], PointNet++ [14], and PointCNN [15]. However, challenges, such as point cloud density, small objects, occlusions, and noise, persist [13,14,15]. In machine vision image recognition, Li, Peiliang, et al. [16] improved obstacle detection with a 3D object detection method based on stereo imagery. Deep learning-based image recognition methods, such as YOLO [17], SSD [18], DeepLab [19], and PSPNet [20], have been extensively applied, enabling obstacle detection through pixel classification. In addition, DK Dewangan et al. [21,22,23,24] applied the advanced methods of deep learning to the field of road detection and also achieved remarkable results. Nonetheless, complex environments with varying illumination and shadows impact the accuracy of machine vision-based technologies.
As for the application of digital twin technology, it offers the potential for testing obstacle detection algorithms in virtual environments through data collection, modeling, and simulation [25,26]. However, challenges such as data quality, model reliability and accuracy, data privacy, and security remain [27,28], necessitating further research in this field.
Although obstacle detection technology has been widely applied in fields such as autonomous driving and intelligent transportation, it still lacks effective applications in high-speed rail tunnel non-destructive testing. Currently, for vehicle-mounted GPR to inspect high-speed rail tunnel lining, it is crucial to maintain a continuous operating distance of 10 cm ± 2 cm from the lining surface [29,30]. Real-time and accurate detection of visual obstacles, such as the “anchor section” of the railway contact network (Figure 1a), surface cables of the lining (Figure 1b), and protruding objects (Figure 1c), is necessary to avoid damage to the detection device and to ensure the quality of the collected data. Therefore, research on intelligent obstacle avoidance for vehicle-mounted GPR detection devices is of utmost importance.
Currently, the collision risk warning for vehicle-mounted GPR detection equipment primarily relies on 2D scanning, which results in blind spots in the detection and warning of critical collision risks posed by the protrusion size of obstacles. Additionally, real-time manual attention to front-end risks is required during practical operations. This, combined with the limited recognition capacity of the human eye, hinders the improvement of detection efficiency.
In response to these issues, this study conducts comprehensive research on upgrading the obstacle avoidance system. Firstly, through the analysis of overall technical parameter requirements and structure, the fundamental preconditions for module development are proposed. Then, by integrating research on ORB-SLAM3 and Normal Distribution Transform (NDT) techniques for point cloud alignment and thickening method study, obstacle risk detection and localization based on safety boundary models, and multi-modal data fusion technologies, collision risks for the robotic arm are timely warned. The obstacle avoidance instruction is instantly fed back to the control system, achieving real-time monitoring of the space ahead and intelligent obstacle avoidance.
Finally, through the development and testing of prototypes, the system’s adaptability and reliability are validated. Results indicate that the system can accurately and effectively identify and avoid obstacles in the detection direction. Moreover, it can not only qualitatively detect obstacles present in the environment but also output accurate quantitative results for their spatial relative intrusion size. This lays the informational groundwork for subsequent prediction and health management over the full lifecycle of the tunnel.

2. Overall Technical Parameter Requirements and Architecture Analysis

At present, the obstacle avoidance system of high-speed railway tunnel inspection vehicles still relies on a combination of single-line laser 2D plane scanning and manual real-time monitoring for detection and obstacle avoidance. This approach has insufficient detection capabilities for small obstacles generating sparse point clouds, and the risk warning methods are relatively singular. To adapt to the obstacle avoidance requirements of high-speed railway tunnel inspection, as shown in Table 1, according to the obstacle avoidance requirements of the tunnel inspection vehicle in many practical applications, this paper analyzes and summarizes the technical indicators required for the vehicle-mounted Ground Penetrating Radar (GPR) detection device’s obstacle avoidance system. A hierarchical architecture (as shown in Figure 2) is adopted, and a comprehensive upgrade of the hardware, software, and basic interface design is conducted based on the existing system.

2.1. Hardware Model

The hardware model mainly includes the following devices:
(1)
Front-end sensors: these consist of 3D LiDAR and cameras for real-time detection of obstacles in the environment and capturing image information to obtain the three-dimensional position information of objects and improve system detection accuracy.
(2)
Processors: responsible for receiving data collected by sensors and conducting algorithmic processing for multi-modal data fusion, obstacle detection, and identification.
(3)
Communication module: this ensures real-time communication between LiDAR, cameras, and processors.
(4)
Human–machine interaction interface: the interface displays detection results, allowing operators to view obstacle information and alarm prompts.

2.2. Software Configuration

The software configuration mainly includes the following aspects:
(1)
Data collection and processing: preprocessing, time synchronization, and spatial registration operations are performed on the data collected by LiDAR and cameras to facilitate subsequent data fusion and processing.
(2)
Multi-modal data fusion: by integrating 3D LiDAR detection results with image data, the system achieves complementary data advantages and improves detection accuracy.
(3)
Obstacle detection and identification: design and implementation of obstacle detection and identification methods based on the information obtained from multi-modal data fusion.
(4)
Human–machine interaction interface: develop a user-friendly human–machine interaction interface for displaying obstacle detection results and alarm information.
(5)
System integration and testing: integrate various modules and perform performance testing and validation of the entire system.
Through the above overall architectural design, an intelligent detection and obstacle avoidance system integrating 3D stereoscopic visualization safety monitoring, real-time high-density point cloud detection, and hierarchical refined risk warning is formed. This system provides high-precision obstacle avoidance feedback and collision risk warning for subsequent robotic arms.

3. Main Technical Research

3.1. Research on Point Cloud Registration and Thickening Method Combining ORB-SLAM3 and NDT Technology

Addressing the issue of the sparseness of target object point clouds acquired by single-frame LiDAR that fails to meet the detection requirements of small-volume obstacles in high-speed rail tunnels, this study introduces a point cloud registration and densification method integrating Oriented FAST and Rotated BRIEF Simultaneous Localization and Mapping 3 (ORB-SLAM3) [31] and Normal Distributions Transform (NDT) techniques. This method, by computing the transformation matrix between adjacent frames, aligns multi-frame consecutive point cloud data within a certain time window to the coordinate system of the real-time frame. As a result, real-time point cloud registration and multi-frame accumulation are realized, enhancing the point cloud density and enabling the reliable detection of small-volume obstacles in high-speed rail tunnels.

3.1.1. Point Cloud Registration

Point cloud registration refers to the process of transforming the overlapping parts of point clouds into a unified coordinate system by solving the transformation matrix. Registration includes coarse registration and fine registration. Coarse registration is performed when the position difference between two frames of point clouds is large, and the relative pose is completely unknown, providing a better transformation initial value for subsequent fine registration. Fine registration further optimizes the given initial transformation matrix to obtain a more accurate transformation. Currently, widely used point cloud registration methods include iterative closest point (ICP) and normal distribution transformation (NDT) [32].
For ICP registration, it minimizes the distance between two sets of point clouds by finding the closest point pairs and iteratively calculating and applying translation and rotation transformations. NDT is a probability distribution-based point cloud registration method. It first divides the point cloud data into multiple grids and models the point cloud data in each grid with Gaussian distribution. Then, it achieves registration by finding the transformation that maximizes the overlap between the probability distributions of the two sets of point cloud data. Furthermore, its primary steps are as follows:
(1)
Acquisition and Preprocessing of Point Cloud: acquire the target point cloud and the point cloud to be registered and preprocess them.
(2)
Division of Target Point Cloud: divide the target point cloud into standard grids, with each grid containing at least six points.
(3)
Modeling: For each point x in the grid, a Gaussian probability density function P(x) is modeled based on normal distribution by calculating the mean vector q and covariance matrix C. This results in a Gaussian probability density function for each grid point:
P ( x ) = c e [ 1 2 ( x q ) T C 1 ( x q ) ]
Here, c is a normalization constant.
(4)
Setting the Initial Transformation Matrix: bring the point cloud to be registered close to the target point cloud.
(5)
Calculation of Score: Insert the points from the point cloud to be registered into P(x) and calculate the probability values in each grid unit. Calculate these to obtain the total score.
(6)
Solution for Optimal Parameters: maximize the objective function obtained by multiplying all score values to find the optimal parameters.
In order to compare the applicability of the two methods in high-speed rail tunnel detection, this paper selects the road point cloud data of the KITTI dataset [33] for comparative testing of the two methods. Considering the characteristics of high-speed rail tunnels with few plane structures, the experimental data is rotated 10° along the Z-axis, and then point cloud registration is performed separately. The experimental results are shown in Figure 3. After registration, the root mean square error (RMSE) of the ICP method is significantly larger than that of the NDT method. In order to further compare the applicability of the two methods to the registration of rotating planes, this paper conducted eight experiments from 0 to 30 degrees, and the RMSE of the two methods is shown in Figure 4. As can be seen from the figure, the registration error of the ICP method increases sharply from 0.4 m at 8° to 1.12 m at 10°, while the registration error of the NDT method remains stable at around 0.45. The standard deviations of RMSE for the two groups of experiments are 0.52 (ICP) and 0.02 (NDT), indicating that the NDT method is more suitable for point cloud registration in the presence of rotation. Therefore, this paper selects the NDT method as the point cloud registration algorithm.

3.1.2. Optimization and Densification of Point Cloud Registration

In order to enhance the accuracy of point cloud registration and achieve real-time densification, this study first employs a spatial filtering algorithm to eliminate vehicular interference from the point cloud, retaining the fundamental point cloud of the tunnel and tunnel wall to improve matching precision. Following this, the ORB-SLAM3 technique is integrated, combining vehicular camera information with point cloud data for joint analysis. When leveraging the coupling relationship between the point cloud and the image, distinctive features in the visual images are extracted, and the results of ORB-SLAM3 computation are utilized to constrain the outcomes of point cloud registration. Lastly, using a real-time mapping computation method, an adjustable mapping frame threshold N (information on the number of data frames contained in real-time mapping) is designed. The first frame of mapping data, Map1, is obtained, and subsequent frame data are cumulatively transformed into Map1 via the interframe transformation matrix, generating a new mapping (Map2). If the number of frames in Map2 is less than the predetermined threshold N, the computation of the transformation matrix for the next frame continues. This process is repeated, integrating each frame of data into the current mapping dataset via cumulative matrix transformation until the frame count reaches the threshold N, thus achieving real-time densification of the point cloud. The degree of interframe registration error is defined by the score size: a smaller score corresponds to a smaller registration error and higher matching precision, and vice versa.
In summary, the NDT point cloud registration algorithm, with the support of grid division technology and its independence from corresponding point feature computation and matching, is advantageous. It is applicable for registering large, dense point cloud maps and non-rigid point cloud data. For high-speed rail tunnels characterized by low overlap rates and minimal plane structure, the point cloud registration and densification method integrating ORB-SLAM3 and NDT techniques can effectively acquire dense, real-time point cloud data.

3.2. Research on Obstacle Risk Detection and Localization Based on Security Boundary Model

To robustly and precisely evaluate potential collision risks, this paper proposes an obstacle risk identification and positioning method based on a safety boundary model, as depicted in Figure 5. Initially, a two-dimensional contour model is constructed, incorporating the mechanical arm, as well as the attached GPRs and sensors. When using sensor data, the motion path of the mechanical arm relative to the tunnel is predicted in real time. Subsequently, a safety margin of 3 cm is set, an inflation transformation is performed on the two-dimensional contour, and spatial envelope segmentation is carried out along the predicted motion direction to determine the safety boundary area and risk monitoring area. Finally, spatial filtering and clustering computations are conducted to eliminate accumulated point cloud data within the safety boundary area, and the pose and size information of potential invading objects within the risk monitoring area is fed back to the mechanical arm control system to evaluate collision risks. This method significantly reduces the amount of invalid point cloud data, lowers the frequency of missed and false reports, and enhances the efficiency and reliability of obstacle avoidance warnings.

3.2.1. Research on Obstacle Detection Based on KD-Tree Nearest Search and Euclidean Clustering

In order to address the detection of invading foreign object point clouds, this paper employs a method based on KD-tree (K-Dimensional tree) nearest search and Euclidean clustering for accurate positioning and multi-object pose detection and localization. KD-tree, a balanced binary tree structure that divides k-dimensional spatial data points, adopts a divide-and-conquer strategy to partition space into multiple subparts. The core idea of the KD-tree nearest point search algorithm can be divided into two stages: constructing the KD-tree and searching for the nearest point.
Constructing the KD-tree: As illustrated in Figure 6, for a dataset composed of n-dimensional data, the dataset is divided into two subsets, the left and right subtrees, through a recursive process by selecting the splitting dimension and splitting point. The dimension with the highest data variance is usually chosen as the splitting dimension, and the median of the data in the splitting dimension is selected as the splitting point. The above process is recursively applied to the left and right subtrees until the amount of data in each subtree is smaller than the system-set maximum threshold.
Searching for the nearest point: Starting from the root node of the KD-tree, the search proceeds downward along the tree structure until the leaf node containing the target point is found. Then, other subtrees are examined during backtracking to find closer points. By comparing the distance between the target point and the current node and the distance between the target point and the current node’s splitting dimension, it is determined whether to search the other subtree. If a closer point is found during backtracking, the current nearest point is updated.
As shown in Figure 7, Euclidean clustering is performed after completing the KD-tree nearest point search. First, a point in space is located, and the nearest n points are found using the KD-tree. The distances are then assessed, and points satisfying the threshold condition are grouped into a cluster. This operation is repeated until no new points are added to the cluster, resulting in a clustering subset.

3.2.2. Study on Obstacle Pose Localization

This paper applies the Oriented Bounding Box (OBB) algorithm to the clustering subset’s point cloud for feature extraction, constructing a 3D Box bounding box to obtain more precise obstacle localization information. The OBB algorithm considers the spatial distribution of object vertices and finds the optimal direction and size to generate a compact bounding box. The main steps include:
(1)
Using the PCA method to obtain the point cloud’s three principal directions, centroid, covariance matrix, and eigenvectors;
(2)
Transforming the input point cloud to the origin, and constructing a bounding box for the origin point cloud;
(3)
Setting the input point cloud’s principal direction and bounding box and obtaining the bounding box vertex coordinates of the original input point cloud through inverse transformation.
As shown in Figure 8, the visual effect of a triangular frame point cloud before and after the OBB algorithm is given, then its more accurate position and attitude are obtained.

3.3. Study on Multi-Modal Data Fusion Technology for Obstacle Avoidance System

In order to quickly and intuitively view the warning information, the fusion display of point cloud and camera data is particularly important. Therefore, how to effectively merge point cloud and camera data is the focus of this research. This paper proposes a multi-modal data fusion scheme based on time synchronization and spatial registration, addressing the issue of fusing LiDAR and camera data within the system.
In terms of time synchronization, due to the different data acquisition rates of LiDAR and cameras, it is not feasible to employ multi-camera synchronization strategies typically found in the field of machine vision. Instead, this paper adopts a method of adding timestamps, thus actively searching for the nearest neighbor data in the data stream for synchronization. Specifically, a nearest-time matching strategy is implemented for time fusion. The time of the LiDAR data frame is taken as the baseline, matching the image closest to it in time to meet the system’s application requirements.
In spatial registration, LiDAR point cloud data and image pixel points need to be matched one-to-one to determine the coordinate transformation relationship between the LiDAR and the camera. The transformation relationship between the LiDAR’s three-dimensional world coordinates and the image pixel coordinates is then solved based on the camera’s intrinsic and extrinsic parameters. This paper uses the Zhang Zhengyou calibration method [34] to correct camera distortion and employs an algorithm based on a calibration board to calculate the extrinsic parameters of the camera and LiDAR using the feature point matching of 3D LiDAR point cloud and camera images. Through combined calibration and spatial registration, the 3D LiDAR point cloud targets can be remapped to the image target position according to the extrinsic parameters.
Figure 9 shows the remapping image of point clouds and images in the KITTI dataset. After temporal synchronization and spatial registration, the matching error reaches to the centimeter level, which meets the requirements of the system.
By implementing the above methods, the advantages of 3D LiDAR and image data are complementary, enabling more accurate detection and localization of tunnel obstacles.

4. System Development and Experimental Verification

4.1. System Development

To meet the overall technical parameter requirements and architecture analysis proposed in this paper, software and hardware system development was conducted based on the proposed high-speed rail tunnel obstacle detection and identification method.

4.1.1. Hardware System Development

The hardware system is the foundation of intelligent obstacle avoidance design, primarily consisting of front-end sensors and onboard hardware. The front-end sensor integrates high-performance LiDAR and high-definition cameras (as shown in Figure 10), including eight onboard cameras and eight LiDARs. The LiDAR can perform area scanning within an 80° × 25° range, with a high scanning point density of up to 240,000 points per second. It can accurately obtain the distance and orientation information of obstacles and can monitor the space ahead in real time. The high-resolution (5 M) and high frame rate (30 fps) of the cameras provide users with rich image information, assisting in identifying the shape and nature of obstacles. The onboard hardware, including servers, power supply boxes, displays, amplifiers and speakers, routers, etc., is primarily responsible for processing the data collected by the sensors and implementing corresponding obstacle avoidance strategies. The server, as the core of the entire system, runs the obstacle avoidance algorithm and coordinates the work of various modules. The power supply box provides stable electrical support to all components, ensuring the stable operation of the system under harsh conditions. The display is used to show the operating status and alarm information of the obstacle avoidance system in real time, helping operators understand the working conditions of the system. The amplifier and speaker are used to emit sound alerts, reminding operators of potential risks. The router is responsible for ensuring communication between the various components, ensuring efficient and stable data transmission.

4.1.2. Software System Development

The software system comprises four main levels: collection, perception, decision, and HMI interaction layers. The collection layer is responsible for base code, image distortion correction, sensor external parameter calibration, point cloud coordinate transformation, LiDAR PTP synchronization, data collection, and outputs registered images and point cloud data streams in real time. The perception layer is responsible for modules such as real-time point cloud registration densification, real-time drawing of the robotic arm’s 3D passable area, abnormal point cloud cluster detection, AI recognition of hazardous objects based on images, hazardous object classification, and equipment status self-check. The decision layer assesses the risk level, calculates the adjustment amount required by the robotic arm to avoid collisions, and generates and saves log information. The HMI interaction layer executes the commands of the decision layer, generates prompt videos and sound alerts, and sends avoidance action information via the communication interface, completing the risk warning process. The specific software process is shown in the Figure 11 below:

4.1.3. Communication Interface and HMI Interaction Design

This system uses the Modbus-TCP communication protocol for data transmission between it and the robotic arm control system. Modbus is a communication protocol applied to the seventh layer of the OSI model, used to achieve client/server communication between devices of different types of buses or networks. MODBUS is a request/response protocol and provides services specified by function codes. MODBUS function codes are elements of MODBUS request/response PDUs. In the communication process, the host (this system) sends request information, including address code, function code, data, and CRC check to the slave (robotic arm control system). The address code is used to identify the address of the slave; the function code is used to specify the type of operation requested, and the data represents the registered address and quantity to be read or written. CRC check ensures the correctness of data transmission. After the slave receives the request, it parses and processes it and executes the corresponding operation according to the function code. After the operation is completed, the slave returns the result to the host. The returned data includes address code, function code, data, and CRC check information. After the host receives the response data, it parses the data. During system operation, access to external networks is prohibited, and communication within the local area network is only allowed with the robotic arm system, thereby achieving secure communication with the robotic arm control system.
As shown in Figure 12, the HMI interaction design includes camera imaging modules, radar imaging modules, equipment status modules, obstacle warning modules, accessory control modules, and data processing modules. Users can independently configure UI display modes and point cloud display parameters, manually start the camera and LiDAR devices, and control data processing functions.

4.2. Experimental Verification

The purpose of the experiment was to carry out dynamic data collection in a real tunnel environment, to verify the performance of each software and algorithmic submodule, to fully test the system to meet the requirements of real-time detection, to evaluate the processing performance of the algorithm on obstacles of different scales, and to confirm the warning function of the system. The experiment mainly used a high-speed rail tunnel detection vehicle, which was equipped with a set of geological radar equipment integrated with a new generation of intelligent obstacle avoidance systems (see Figure 13a). Through the danger warning information fed back by the sensors, the mechanical arm system was guided to extend and retract the radar support and bending arm to avoid obstacles. The experiment mainly conducted on-site intelligent obstacle avoidance tests on protrusions on the tunnel wall and contact network frames (see Figure 13b,c).

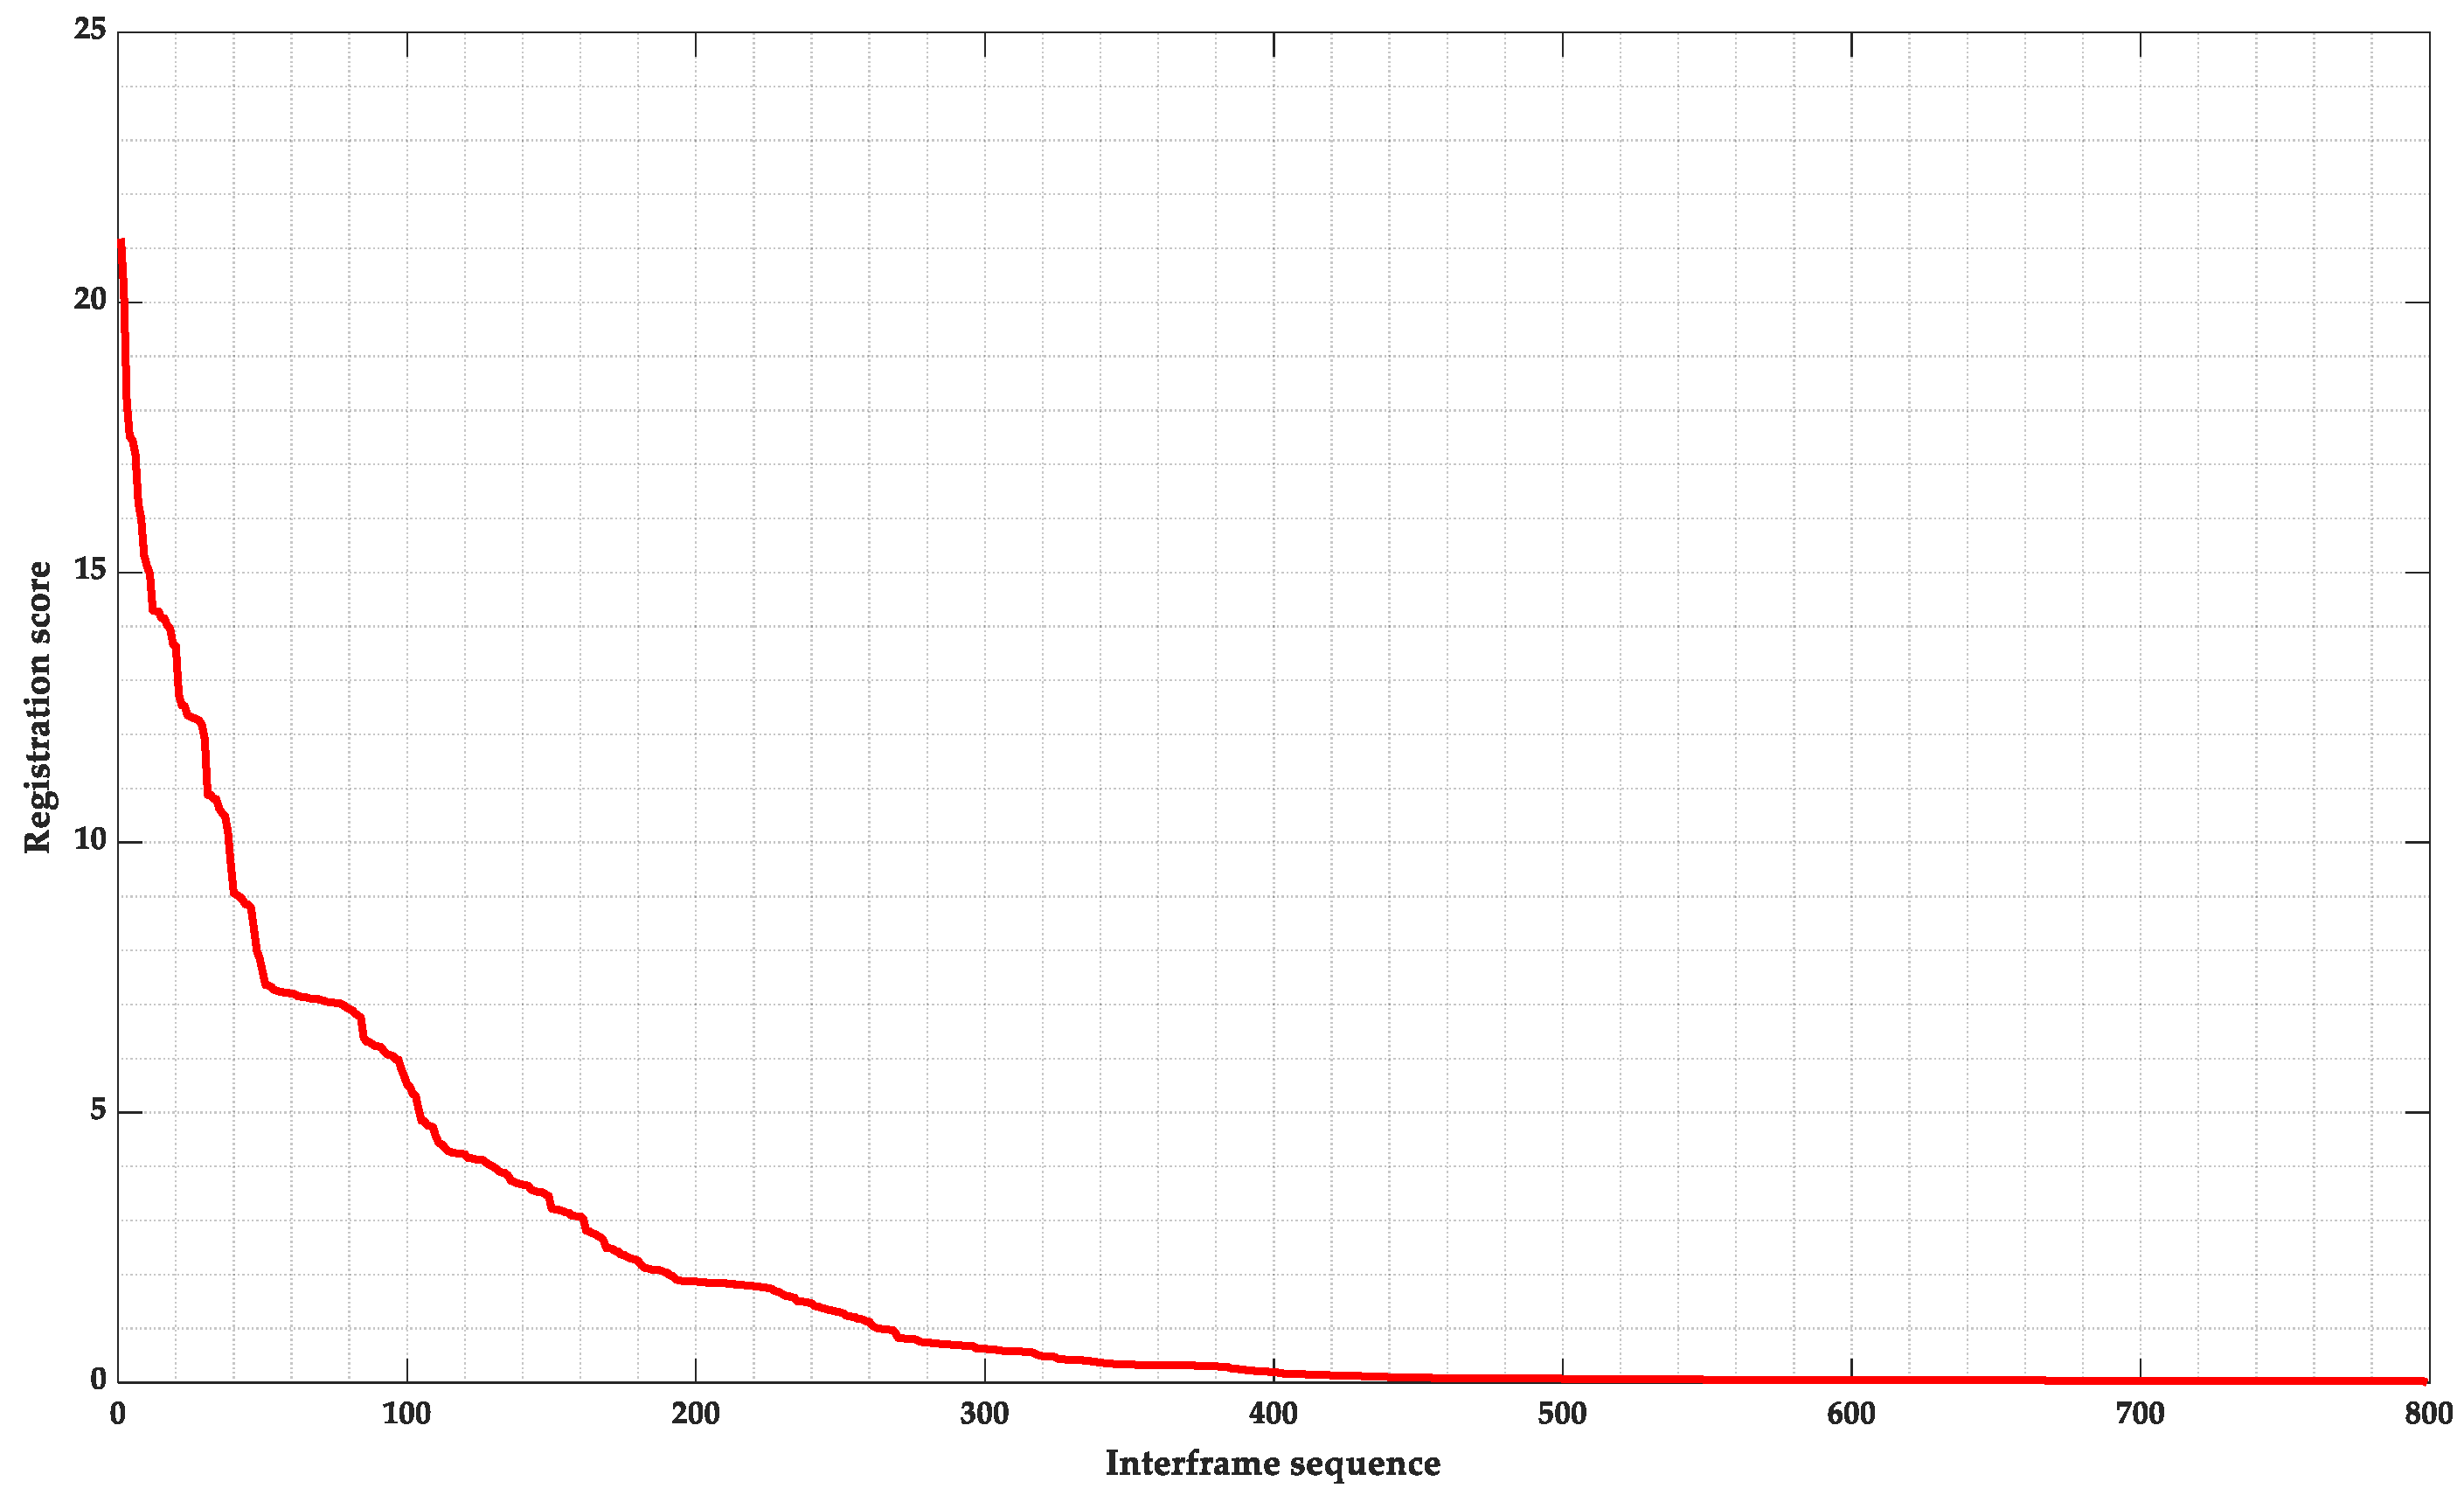
4.2.1. Experimental Verification of Point Cloud Registration and Densification Method

To verify the effectiveness of the NDT point cloud registration and densification method fused with ORB-SLAM3 technology, the spatial ROI filtering algorithm was first applied to remove the interfering point cloud of the car body. The experimental results, as shown in Figure 14, effectively remove the point cloud information of the car body after filtering and only retain the basic point cloud of the tunnel and tunnel wall, making the point cloud registration more focused on the target area.
Secondly, to balance the detection efficiency and obstacle recognition, we set the mapping frame threshold N to 10. The experimental results are shown in Figure 15: images a and b show the tunnel point cloud registration situation with registration error scores of 21.18 and 0.04, respectively. The point cloud information of the tunnel wall and contact network line in these two pictures is clearly visible.
After completing the point cloud registration of all collected adjacent frame data, we obtained the analysis result in Figure 16. Figure 16 shows that during the forward process of the detection device, the registration error score of the adjacent frames gradually drops from the highest of 21.18 to close to zero, indicating that the registration accuracy continues to improve.
Finally, a point cloud densification enhancement experiment was conducted based on single-frame registration results. The results are shown in Figure 17: The left image is the original point cloud information image, with a total of 24,000 point cloud data, and the right image is the point cloud information image after densification, with the point cloud data increased to 240,000. As can be seen from the figure, the tunnel point cloud, especially the contact network line point cloud, is significantly densified, which further enhances the recognition of small targets.
It can be seen that the point cloud registration and densification method combining ORB-SLAM3 and NDT technology has good effects in the application of high-speed rail tunnel obstacle detection and can meet the detection requirements of small-volume obstacles in high-speed rail tunnels.

4.2.2. Obstacle Risk Detection and Location Method Experimental Verification

To verify the obstacle risk detection and location method based on the safety limit model proposed in the previous section of the article, we first built a two-dimensional contour model of the mechanical arm and detection equipment and divided the spatial envelope along the predicted direction of motion. Then, by executing spatial filtering and clustering calculations, the cumulative point cloud data in the safe area was eliminated. As shown in Figure 18, using the system-designed limit detection function module, the spatial filtering algorithm was used to remove the data in the safe area, and the point cloud of the head-end intrusion of the protruding cable frame on the tunnel wall was obtained to reduce the generation of invalid point clouds while detecting risk obstacles, thus improving detection efficiency.
Finally, we applied the OBB algorithm to the point cloud of the clustered subset to extract features, successfully obtaining the specific location and pose information of the obstacle. Figure 19 shows the pose information of the contact network frame point cloud after the OBB algorithm.
Through the above experiments, we have verified the effectiveness and feasibility of the obstacle risk detection and location method based on the safety limit model in practical applications.

4.2.3. Multi-Modal Data Fusion Technology Experimental Verification

As shown in Figure 20, based on the radar data frame time, the image in the image sequence closest to it was matched to achieve time synchronization, and then through spatial registration, the radar point cloud and image pixel points were matched one by one, obtaining the remapping image of the tunnel contact network frame point cloud and its camera image. Through actual measurement, the maximum error of time fusion using the nearest time matching strategy is about 27 ms, which is far less than the interval between radar data frames (100 ms) and will not cause error accumulation, and the maximum matching error of the two types of data is 1.3 cm. Therefore, the results fully meet the system requirements.

4.2.4. System Overall Risk Warning Function Experimental Verification

The experimental procedure mainly includes the following steps: First, let the vehicle equipped with a mechanical arm drive uniformly over the obstacle area (five times back and forth), and record the actual warning values. Secondly, under the warning trigger condition, send the target information of the mechanical arm posture adjustment. Then, the system refreshes the obstacle warning information in real time during the response adjustment and action execution of the mechanical arm, as well as after the action is completed, to monitor the effectiveness of the obstacle avoidance action. Finally, by comparing the offline measured values with the warning values, the accuracy and effect of the actual warning are evaluated.
The experimental results are shown in Table 2: The table gives the system’s warning and output values before and after the obstacle avoidance of the measured obstacle. From this, it can be seen that the average obstacle avoidance error output by the mechanical arm is between 1 and 2 cm, which meets the design accuracy requirements.
In conclusion, through system development and experimental verification, the obstacle avoidance function of this system has been significantly improved compared to before. It shows that the new generation of high-speed rail tunnel detection vehicles can fully meet the intelligent obstacle avoidance needs during tunnel lining detection.

5. Conclusions and Outlook

To meet the intelligent obstacle avoidance needs of high-speed rail tunnel detection vehicles during lining quality detection, this article, through software and hardware design and development and on-site experimental verification, arrived at the following conclusions:
(1)
The point cloud registration and densification method integrating ORB-SLAM3 and NDT technology can detect small-volume obstacles with a diameter greater than 0.5 cm in high-speed rail tunnels in real time, improving the efficiency and safety of tunnel detection.
(2)
The obstacle risk detection and location method based on the safety limit model has shown effectiveness and feasibility in on-site tests, with obstacle avoidance errors between 1 and 2 cm, meeting design accuracy requirements. This provides higher accuracy and robustness for obstacle identification in complex tunnel environments.
(3)
The multi-modal data fusion scheme based on time synchronization and spatial registration can visually observe obstacles, providing an effective early warning function for the safe operation of high-speed rail.
(4)
In the future, we will improve the accuracy and real-time performance of the intelligent tunnel detection system, provide strong support for building more powerful automated tunnel detection control systems, and digital twin lifecycle analysis technology for railway tunnels.

Author Contributions

Conceptualization, Y.L. and T.T.; methodology, Y.L. and B.J.; software, Y.L.; validation, Y.L. and T.T.; formal analysis, Y.L. and F.J.; investigation, T.T. and Q.Q.; data curation, Y.L. and F.Q.; writing—original draft preparation, Y.L. and T.T.; writing—review and editing, Y.L. and B.J. All authors have read and agreed to the published version of the manuscript.

Funding

This research was funded by the Key Project of Science & Technology Research of Infrastructure Inspection Research Institute, grant number 2021JJXM23, and the Key Project of Science & Technology Research of the China Academy of Railway Sciences, grant number 2021YJ253.

Institutional Review Board Statement

Not applicable.

Informed Consent Statement

Not applicable.

Data Availability Statement

The original data contributions presented in the research are included in the article, further inquiries can be directed to the corresponding authors.

Conflicts of Interest

The authors declare no conflict of interest. The funders did not play a role in the design of the study, the collection or the decision to publish the results.

References

  1. Van Brummelen, J.; O’Brien, M.; Gruyer, D.; Najjaran, H. Autonomous vehicle perception: The technology of today and tomorrow. Transp. Res. Part C Emerg. Technol. 2018, 89, 384–406. [Google Scholar] [CrossRef]
  2. VanDerHorn, E.; Mahadevan, S. Digital Twin: Generalization, characterization and implementation. Decis. Support Syst. 2021, 145, 113524. [Google Scholar] [CrossRef]
  3. Jones, D.; Snider, C.; Nassehi, A.; Yon, J.; Hicks, B. Characterising the Digital Twin: A systematic literature review. CIRP J. Manuf. Sci. Technol. 2020, 29, 36–52. [Google Scholar] [CrossRef]
  4. Botín-Sanabria, D.M.; Mihaita, A.S.; Peimbert-García, R.E.; Ramírez-Moreno, M.A.; Ramírez-Mendoza, R.A.; Lozoya-Santos, J.D.J. Digital twin technology challenges and applications: A comprehensive review. Remote Sens. 2022, 14, 1335. [Google Scholar] [CrossRef]
  5. Fang, X.; Wang, H.; Liu, G.; Tian, X.; Ding, G.; Zhang, H. Industry application of digital twin: From concept to implementation. Int. J. Adv. Manuf. Technol. 2022, 121, 4289–4312. [Google Scholar] [CrossRef]
  6. Zhang, Q.; Yan, F.; Song, W.; Wang, R.; Li, G. Automatic Obstacle Detection Method for the Train Based on Deep Learning. Sustainability 2023, 15, 1184. [Google Scholar] [CrossRef]
  7. Milioto, A.; Vizzo, I.; Behley, J.; Stachniss, C. Rangenet++: Fast and accurate lidar semantic segmentation. In Proceedings of the 2019 IEEE/RSJ International Conference on Intelligent Robots and Systems (IROS), Macau, China, 3–8 November 2019. [Google Scholar]
  8. Hu, J.W.; Zheng, B.Y.; Wang, C.; Zhao, C.H.; Hou, X.L.; Pan, Q.; Xu, Z. A survey on multi-sensor fusion based obstacle detection for intelligent ground vehicles in off-road environments. Front. Inf. Technol. Electron. Eng. 2020, 21, 675–692. [Google Scholar] [CrossRef]
  9. Bouain, M.; Berdjag, D.; Fakhfakh, N.; Atitallah, R.B. Multi-sensor fusion for obstacle detection and recognition: A belief-based approach. In Proceedings of the 2018 21st International Conference on Information Fusion (FUSION), Cambridge, UK, 10–13 July 2018. [Google Scholar]
  10. Yang, B.; Luo, W.; Urtasun, R. Pixor: Real-time 3d object detection from point clouds. In Proceedings of the IEEE conference on Computer Vision and Pattern Recognition, Salt Lake City, UT, USA, 18–22 June 2018. [Google Scholar]
  11. Xie, D.; Xu, Y.; Wang, R. Obstacle detection and tracking method for autonomous vehicle based on three-dimensional LiDAR. Int. J. Adv. Robot. Syst. 2019, 16, 1729881419831587. [Google Scholar] [CrossRef] [Green Version]
  12. Defauw, N.; Malfante, M.; Antoni, O.; Rakotovao, T.; Lesecq, S. Vehicle Detection on Occupancy Grid Maps: Comparison of Five Detectors Regarding Real-Time Performance. Sensors 2023, 23, 1613. [Google Scholar] [CrossRef] [PubMed]
  13. Qi, C.R.; Su, H.; Mo, K.; Guibas, L.J. Pointnet: Deep learning on point sets for 3d classification and segmentation. In Proceedings of the IEEE Conference on Computer Vision and Pattern Recognition, Honolulu, HI, USA, 21–26 July 2017. [Google Scholar]
  14. Chen, X.; Ma, H.; Wan, J.; Li, B.; Xia, T. Multi-view 3d object detection network for autonomous driving. In Proceedings of the IEEE conference on Computer Vision and Pattern Recognition, Honolulu, HI, USA, 21–26 July 2017. [Google Scholar]
  15. Zhou, Y.; Tuzel, O. Voxelnet: End-to-end learning for point cloud based 3d object detection. In Proceedings of the IEEE Conference on Computer Vision and Pattern Recognition, Salt Lake City, UT, USA, 18–22 June 2018. [Google Scholar]
  16. Li, P.; Chen, X.; Shen, S. Stereo r-cnn based 3d object detection for autonomous driving. In Proceedings of the IEEE/CVF Conference on Computer Vision and Pattern Recognition, Long Beach, CA, USA, 15–20 June 2019. [Google Scholar]
  17. Diwan, T.; Anirudh, G.; Tembhurne, J.V. Object detection using YOLO: Challenges, architectural successors, datasets and applications. Multimed. Tools Appl. 2022, 82, 9243–9275. [Google Scholar] [CrossRef] [PubMed]
  18. Feroz, M.A.; Sultana, M.; Hasan, M.R.; Sarker, A.; Chakraborty, P.; Choudhury, T. Object detection and classification from a real-time video using SSD and YOLO models. In Computational Intelligence in Pattern Recognition: Proceedings of CIPR 2021; Springer: Singapore, 2022. [Google Scholar]
  19. Chen, L.C.; Papandreou, G.; Kokkinos, I.; Murphy, K.; Yuille, A.L. Deeplab: Semantic image segmentation with deep convolutional nets, atrous convolution, and fully connected crfs. IEEE Trans. Pattern Anal. Mach. Intell. 2017, 40, 834–848. [Google Scholar] [CrossRef] [PubMed] [Green Version]
  20. Zhao, H.; Shi, J.; Qi, X.; Wang, X.; Jia, J. Pyramid scene parsing network. In Proceedings of the IEEE Conference on Computer Vision and Pattern Recognition, Honolulu, HI, USA, 21–26 July 2017. [Google Scholar]
  21. Ramchandani, M.; Sahu, S.P.; Dewangan, D.K. A Comparative Study in Pedestrian Detection for Autonomous Driving Systems. In Proceedings of the 2022 OPJU International Technology Conference on Emerging Technologies for Sustainable Development (OTCON), Raigarh, India, 8–10 February 2023. [Google Scholar]
  22. Dewangan, D.K.; Sahu, S.P. Lane detection in intelligent vehicle system using optimal 2-tier deep convolutional neural network. Multimed. Tools Appl. 2023, 82, 7293–7317. [Google Scholar] [CrossRef]
  23. Sahu, S.; Sahu, S.P.; Dewangan, D.K. Pedestrian Detection Using MobileNetV2 Based Mask R-CNN. In IoT Based Control Networks and Intelligent Systems: Proceedings of 3rd ICICNIS 2022; Springer Nature Singapore: Singapore, 2022; pp. 299–318. [Google Scholar]
  24. Dewangan, D.K.; Sahu, S.P. Optimized convolutional neural network for road detection with structured contour and spatial information for intelligent vehicle system. Int. J. Pattern Recognit. Artif. Intell. 2022, 36, 2252002. [Google Scholar] [CrossRef]
  25. Dröder, K.; Bobka, P.; Germann, T.; Gabriel, F.; Dietrich, F. A machine learning-enhanced digital twin approach for human-robot-collaboration. Procedia CIRP 2018, 76, 187–192. [Google Scholar] [CrossRef]
  26. Mo, Y.; Ma, S.; Gong, H.; Chen, Z.; Zhang, J.; Tao, D. Terra: A smart and sensible digital twin framework for robust robot deployment in challenging environments. IEEE Internet Things J. 2018, 8, 14039–14050. [Google Scholar] [CrossRef]
  27. Singh, M.; Fuenmayor, E.; Hinchy, E.P.; Qiao, Y.; Murray, N.; Devine, D. Digital twin: Origin to future. Appl. Syst. Innov. 2021, 4, 36. [Google Scholar] [CrossRef]
  28. Sharma, M.; George, J.P. Digital Twin in the Automotive Industry: Driving Physical-Digital Convergence; Tata Consultancy Services White Paper; Tata Consultancy Services Ltd.: Mumbai, India, 2018. [Google Scholar]
  29. Lei, Y.; Tian, T. The vibration characteristic and impact analysis of the tunnel lining detection device based on arc rotating multi-section mechanism. Adv. Mech. Eng. 2020, 12, 1687814020912974. [Google Scholar] [CrossRef]
  30. Lei, Y.; Zou, Y.; Tian, T.; Qi, F.; Jiang, B. Analysis on Vibration Characteristics and Suppression Strategy of Vehicle Mounted GPR Detection Device for Tunnel Lining. Machines 2021, 9, 309. [Google Scholar] [CrossRef]
  31. Lei, Y.; Zou, Y.; Tian, T.; Qi, F.; Jiang, B. 3d scan registration based localization for autonomous vehicles-a comparison of ndt and icp under realistic conditions. In Proceedings of the 2018 IEEE 88th Vehicular Technology Conference (VTC-Fall), Chicago, IL, USA, 27–30 August 2018. [Google Scholar]
  32. Geiger, A.; Lenz, P.; Stiller, C.; Urtasun, R. Vision meets robotics: The kitti dataset. Int. J. Robot. Res. 2013, 32, 1231–1237. [Google Scholar] [CrossRef] [Green Version]
  33. Campos, C.; Elvira, R.; Rodríguez, J.J.G.; Montiel, J.M.; Tardós, J.D. Orb-slam3: An accurate open-source library for visual, visual–inertial, and multimap slam. IEEE Trans. Robot. 2021, 37, 1874–1890. [Google Scholar] [CrossRef]
  34. Zhang, Z. Flexible camera calibration by viewing a plane from unknown orientations. In Proceedings of the Seventh IEEE International Conference on Computer Vision, Kerkyra, Greece, 20–27 September 1999; Volume 1. [Google Scholar]
Figure 1. “Obstacles” in the detection of high-speed railway tunnel. (a) Anchor section of the railway contact network. (b) Surface cables of the lining. (c) Protruding objects.
Applsci 13 07689 g001
Figure 2. System architecture.
Applsci 13 07689 g002
Figure 3. ICP and NDT registration results. (a) ICP registration result. (b) NDT registration result.
Applsci 13 07689 g003
Figure 4. Comparison of ICP and NDT Methods.
Applsci 13 07689 g004
Figure 5. Schematic Diagram of Obstacle Risk Detection.
Applsci 13 07689 g005
Figure 6. KD-tree Partitioning Process (ad).
Applsci 13 07689 g006
Figure 7. Flowchart of Euclidean Clustering Algorithm.
Applsci 13 07689 g007
Figure 8. The triangular frame point cloud before and after the OBB algorithm. (a) Triangular frame point cloud without OBB algorithm. (b) Triangular frame point cloud with OBB algorithm.
Applsci 13 07689 g008
Figure 9. Point cloud remapping images before and after time synchronization and space registration. (a) 3D Point Cloud Image. (b) Camera Image. (c) Fused image.
Applsci 13 07689 g009
Figure 10. Front-end Sensor. (a) Sensor appearance model. (b) Internal sensor layout. (c) Front-end sensor prototype.
Applsci 13 07689 g010
Figure 11. Software Flowchart.
Applsci 13 07689 g011
Figure 12. Human–Machine Interaction Design Interface.
Applsci 13 07689 g012
Figure 13. Test detection equipment and set obstacles. (a) High-speed rail tunnel detection train and obstacle avoidance detection diagram. (b) Tunnel wall protruding cable frame. (c) Contact network frame.
Applsci 13 07689 g013
Figure 14. Point cloud data before and after interference removal. (a) Original point cloud data. (b) Point cloud data after interference removal.
Applsci 13 07689 g014
Figure 15. Tunnel Point Cloud Registration Results. (a) Tunnel point cloud registration image with a score of 21.18. (b) Tunnel point cloud registration image with a score of 0.04.
Applsci 13 07689 g015
Figure 16. Registration accuracy score results of adjacent frames in the experimental tunnel.
Applsci 13 07689 g016
Figure 17. Images before and after tunnel point cloud thickening. (a) Point cloud data before thickening. (b) Point cloud data after thickening.
Applsci 13 07689 g017
Figure 18. The cable rack on the tunnel wall and its head-end encroaching point cloud. (a) Tunnel wall protruding cable frame. (b) Head-end intrusion point cloud.
Applsci 13 07689 g018
Figure 19. Pose information of contact network frame point cloud.
Applsci 13 07689 g019
Figure 20. Remapping results of contact network frame point cloud and camera image.
Applsci 13 07689 g020
Table 1. Obstacle avoidance system required technical indicators.
Parameter TypeRequirement Parameters for
the Design System
Technical Parameters of
Existing System
Raised Object DetectionSize: Width ≥ 5 mm, Height ≥ 60 mm/
Early warning distance: 3~20 m
Detection width range: 5 m (containing 3 GPRs)
Anchor-section DetectionEarly warning infringement amount ≥ 20 mm,Single-line qualitative detection (unable to guide the movement of the manipulator)
Early warning distance: 3~20 m
Special Cable DetectionSize: Width ≥ 5 mm, Height ≥ 60 mm/
Early warning distance: 3~20 m
Detection width range: 5 m (containing 3 GPRs)
Catenary frame detectionEarly warning infringement amount ≥ 20 mm,Qualitative detection, no guidance for mechanical arm
Early warning distance: 3~20 m
Variable Cross-Section DetectionEarly warning infringement amount ≥ 20 mm,Qualitative detection, no guidance for mechanical arm
Early warning distance: 3~20 m
Bi-directional detection requirementBi-directional warning detection supportedUnidirectional detection
Obstacle Positioning and volume estimationPositioning accuracy: ≤5 cmTwo-dimensional plane positioning (unable to estimate volume)
Volume accuracy: ≤5%
Warning VisualizationReal-time video display with Bounding Box, risk distance annotation, and alarm prompt soundSimple two-dimensional plane visualization
Table 2. Mechanical arm obstacle avoidance test results.
ObstacleBase Value
(cm)
Distance from Obstacle to Envelope (cm)Obstacle Avoidance Action
Pre-Avoidance System Alarm ValuePost-Avoidance System Output Value
3-s Average 3-s Standard DeviationAverage Error3-s Average 3-s Standard DeviationAverage Error
tunnel wall pipeline5.05.30.190.326.71.321.7arm shrinks 20 cm
protruding screw on tunnel wall5.05.10.100.116.01.101.0antenna shrinks 10 cm
0.0−0.50.26−0.58.41.28−1.6antenna shrinks 10 cm
−5.0−5.40.23−0.43.91.14−1.1antenna shrinks 10 cm
Disclaimer/Publisher’s Note: The statements, opinions and data contained in all publications are solely those of the individual author(s) and contributor(s) and not of MDPI and/or the editor(s). MDPI and/or the editor(s) disclaim responsibility for any injury to people or property resulting from any ideas, methods, instructions or products referred to in the content.

