Article

Trawl Grid Structure Design and Analysis Using the Finite Element Method

by
Nghia-Danh Nguyen
1,2 and
Shyh-Chour Huang
1,*
1
Department of Mechanical Engineering, National Kaohsiung University of Science and Technology, Kaohsiung 80778, Taiwan
2
Faculty of Engineering and Technology, Nguyen Tat Thanh University, 300a Nguyen Tat Thanh, Ward 13, District 4, Ho Chi Minh City 70000, Vietnam
*
Author to whom correspondence should be addressed.
Appl. Sci. 2023, 13(13), 7536; https://doi.org/10.3390/app13137536
Submission received: 17 May 2023 / Revised: 21 June 2023 / Accepted: 22 June 2023 / Published: 26 June 2023
(This article belongs to the Topic Innovation of Applied System)

Abstract

:
The structure of fishnet knots has been simplified in previous studies to facilitate the construction of numerical equations of the fishnet structure. This leads to errors in the dynamic analysis of the trawl mesh structure with water flow. In this study, the finite element method was used to analyze the interaction of the trawl mesh structure with the solid object in a dynamic explicit environment. At the same time, design variables were optimized through impact assessment and the displacement of grid cells. The results show that the polyamide (PA) material, a 0.4 mm cross-section, and a 25 mm mesh size are the optimal choices. When the displacement speed of the solid body increased, the displacement and collision values of the mesh structure tended to increase gradually along the quadratic curve. Confirmation tests performed on the tensile tester machine showed a good load-carrying capacity of up to 1280 MPa for trawl mesh structures using the PA material. The characteristic curve for the stress of the trawl mesh structure is shown through the higher-order curve.

1. Introduction

In recent years, the fishing model using net cages has gradually become popular in riparian and coastal areas in countries with typical key fisheries, such as Vietnam, Taiwan, and China [1,2,3,4]. This option has many advantages over the method of fishing offshore or keeping fish in ponds; typically, the water source is always renewed inside the cage, reducing the risk of mass disease for fish [5], with a higher ease of exploitation and control of fishery output than that of traditional fishing methods due to their vulnerability to environmental impacts (storms, flash floods). The combination of net cage aquaculture with offshore wind power generation areas is being applied in high wind power producing countries such as Taiwan [6] to increase productivity and production efficiency. Currently, fishermen still select net type, net size, or cage material randomly, based on trial and error, which wastes money and effort. Therefore, it is necessary to optimize the design variables used for mesh making. In recent years, a number of studies have been carried out to numerically simulate the interaction process of water flow with a typical cage mesh structure, such as that by Fabien et al. [7], who developed a numerical method based on the Landweber model modified according to the Richtmyer formula related to the friction between the water flow and the mesh cage structure. The numerical method gave good results and the net cage volume decreased by 25% when the flow rate increased to 1 m/s. Zhijing Xu et al. [8] studied numerical and experimental implementation using Morison’s equation for the interaction of water flow with net cages. According to the results, the Morison equation underestimates the resistance on the mesh, leading to errors compared with the experimental method. To minimize errors, additional conditions, such as the interference of the fluid field and the influence of the Reynolds coefficient, must be considered. Cristian Cifuentes et al. [9] developed a Morison force model using OrcaFlex software for the net cage and water flow interaction. They built a mathematical equation showing the relationship between the drag coefficient with the multiplication of the density ratio of the mesh and the Reynolds coefficient, which helps to correct the error of the Morison equation. Hao Chen et al. [10] built a numerical model based on the aggregate block structure model and the digital porous environment model to analyze the fluid–structure interaction of the flow through and around the aquaculture net cage. The mesh strain gave good results in the middle part, while the bottom part had a large displacement compared to the experimental results. Biao Su et al. [11] integrated acoustic positioning sensor data for real-time monitoring of mesh cage deformations. The proposed method was found to be highly effective, but it is necessary to use additional depth sensors, an inertial measurement unit (IMU), or a 3D interpolation algorithm for higher accuracy. Overall, the studies have digitized the interaction of water flow on the net cage structure, making it more efficient in controlling the capture and aquaculture process. However, in the mesh structure survey, the knots of the grid have been simplified for easier calculation, which more or less leads to errors for previous studies. It is necessary to study the net structure with knots that are not minimized when there is the impact of water currents or fish causing the net to tear [12].
This study focused on the structural analysis of the trawl mesh structure with 3D knots. Here, we optimized three design variables (the plastic material, wire cross-section, and mesh size) used for knitting trawl mesh using the Taguchi method. We also analyzed the interaction process of solid objects on the grid cells of the trawl grid [13] by the finite element method, simulated the process in a semi-static environment, and showed the curve of mechanical work by the least mean squares method when changing the velocity. In addition, the actual mesh structure experiment was performed using a tensile test, and the higher-order curve was used to find out the stress curve at the position of the knots.
The remainder of this paper is organized as follows. Section 2 presents the interaction process of the solid on the trawl mesh structure after the introduction. Section 3 describes the simulation process and simulation experiment carried out in a semi-static environment. Section 4 discusses the obtained results. Finally, Section 5 offers the conclusion.

2. The Interaction of the Fishnet Structure

Cage nets can be of several types, such as the Raschel [14], hexagon [15], square [16], or trawl type, with different advantages and disadvantages. Many countries are now focusing on the reduction of small high-density microplastics [16] in environmental ecosystems and marine life [17]. Unlike the nets already mentioned, trawl nets consist of isotropic braids that do not maintain a fixed shape, the yarns used for netting are usually dense, and the intermediate joints are considered to be rotational links in the grid model. Applying Theret’s assumption [18], when the flexible lattice structure is in equilibrium in a steady stream of water, the knots do not transfer any momentum to the edges of the grid cell. These edges can be categorized into multiple stiffeners with interlocking knots (Figure 1). However, the knots of trawl nets have a more complex three-dimensional (3D) structure than Raschel nets or hexagon nets, so they were modeled in 3D in this study.
The interaction of objects was evaluated by a 3D solid representing fish acts on the structure of the trawl nets. Complex 3D knots were modeled to increase the accuracy of the study compared to previous studies. These knots shape the grid cells but do not directly participate in the contact process between the two objects under consideration. Therefore, we assumed that the contact between the object and the mesh structure is either point or line contact, based on a study by Baranowski et al. [19] for one-dimensional Raschel nets exposed to 3D flying objects in the opposite direction. The contact process of the object on the trawl net structure is non-linear, while the continuum occurs as a linear elastic material. In Figure 1, the contact of the trawl net with the solid is assumed by the  b c  node projected onto the surface  ψ c ( 1 ) . The total relative displacement, according to the linear and tangential methods, is determined as follows:
Q N = ( b c b ¯ ) . n ¯
Q T = t 0 t v ¯ ˙ 1 . v ¯ ˙ 2 . a 12 d t
b c b ¯ ( v ¯ 1 , v ¯ 2 ) b c b ¯ ( v ¯ 1 , v ¯ 2 ) · a ¯ α ( v ¯ 1 , v ¯ 2 ) = 0
a 12 v ¯ ˙ 2 = b ˙ c b ¯ ˙ · a ¯ α
where  n ¯  is the normal vector of the tangent surface,  v ¯ ˙ 1  is the time derivative of (3) and (4),  a ¯ α v ¯ 1 , v ¯ 2  is the tangent covariant base vector, and  a 12 = a 1 · a 2  is the metric tensor of the  b c  point projected onto the surface  ψ c ( 1 ) .
The study hypothesizes that the contact stress tensor needs to be satisfied as follows:
t = t N + t T
where  t N  is the normal stress, and  t T  is the tangential stress.
When two bodies are in contact at time t, applying the finite element method, the contact work of the node  b c  projected onto the surface  ψ c ( 1 )  is determined by the following formula:
W i c = A c δ Q N t N + Q T t T = δ U i Q D i Δ u i
where  A c  is the contact area of the element,  δ U i Q  is the displacement of the element, and  D i  is the contact stiffness matrix of the element. Because the meshes in 3D space are isotropic [20,21], the study determines  D i  by applying Hooke’s law, and at the same time, determines the strain stress of the mesh structure by the following formulas:
D i = E ( 1 + v ) ( 1 2 v ) × 1 v v v 0 0 0 1 v v 0 0 0 1 v 0 0 0 1 2 v 2 0 0 1 2 v 2 0 s y m m e t r y 1 2 v 2
where E is the modulus of elasticity and v is the Poisson’s ratio of materials.

3. Method

To evaluate the interaction of objects, the design variables were designed to affect the mechanical work of the trawl mesh structure. The purpose of this optimization process was also to show the level of impact of the factor so that fishermen have the option to select the type of netting best suited to the specific conditions of their aquaculture operations. The experimental procedure is shown in Figure 2. The study tested the tensile strength of cables from common mesh materials to obtain their stress curve. Together with other material parameters, these are used as input parameters for simulations in semi-static environments. The Taguchi method was used to optimize the design variables affecting the trawl grid structure. After determining the optimal set of parameters, simulations and experiments were conducted at different speed levels to determine the displacement trend and the mechanical work of the mesh structure. Simultaneously, the characteristic stress curve of the trawl mesh structure was built based on the higher-order curve [22].

3.1. Preparation of the Materials

Three types of materials commonly used for fishing nets include: polyamide (PA), polyethylene (PE), and polypropylene (PP) [23,24,25], with each having different structural characteristics. Polyamide, also known as nylon, is a monolithic and transparent PA yarn. PE yarn is combined from 6 to 8 thinner fibers with the addition of polyester yarn, and PP yarn is pure but synthesized from many small fibers, about 40 to 60 fibers or more. Based on the standard ISO-527 [26], in this study, we conducted the tensile test on a tensile tester machine (FT plus, Ametek Inc., East Hampshire, UK) to determine the stress curve of these three wires. The fibers had a length of 1 in, a cross-section of 0.4 mm, and were pulled at a speed of 20 mm/min. The stress curve plots for the three materials are shown in Figure 3. Parameters, such as density, Young’s modulus, Poisson’s ratio, the elastic value  η , plastic value  τ ˙ t , and ductile damage  z ¯ f p l  of the three fibers were also determined to increase the reliability of the simulation input [27] in Equations (8)–(11) and Table 1. The failure criteria for the polymer fibers are described in terms of the yield stress value, tangent modulus, and plastic strain shown by the stress characteristic curves in Figure 3c. The stress characteristic curves of the three materials are almost linear until they break. The elongation at break of PE was 5.7%, while for PA it was 10% and for PP it was 22.5%.
Figure 3. Experiments on the tensile behavior of polymer materials: (a) preparation of polymer materials; (b) experiments of polymer filaments on the tensile tester machine; and (c) the tensile strength of polymer materials, presented as follows:
Applsci 13 07536 g003
ε 1 = l 1 l 0 l 0 × 100 %
η = p q = 1 3 ( σ 11 + σ 22 + σ 33 ) σ m i s e s
τ ˙ t = d τ d t = 1 l 0 d l ( t ) d t = v ( t ) l 0
z f p l = 2 M f σ m a x
In Equation (8),  l 1  is determined as the end length (cm) and  l 0  is the initial length (cm). In Equation (9), q is the von Mises equivalent stress and  σ 11 / σ 22 / σ 33  is the triaxial stress; they are used to determine the failure state during plastic deformation. The tensile test is on only one axis; therefore, the stresses at the horizontal and vertical axes are equal to 0 and p is the hydrostatic pressure stress. In Equation (10),  v ( t )  is the strain rate and is the change in strain of a material with respect to time. In Equation (11),  σ m a x  is the maximum stress value and  M f  is the energy damage evolution.

3.2. Modeling the Objects for Simulations

In most cases, the perimeter of the grid is 0.75 times the size of the fish sample circumference depicted in Figure 4 [32]. The solid referenced from the study by Baranowski [31] represents the exposure of the fish to the net structure and does not represent an average fish size. Here, the circumference of the bottom edge diameter was determined to be 4/3 times the circumference of the grid cell. In this investigation, grid cells having sides of 20, 25, and 30 mm and cross-sections of 0.2, 0.3, and 0.4 mm were employed. Instead of the fish, a frustum made of the frustum of a cone ABS solid was used to simulate the process and the bottom edge radius was calculated using Equation (11) and is presented in Figure 5.
R = 8 a 3 π
where a is the edge of the nets and R is the radius of the base section of the frustum of a cone.

3.3. Using the Finite Element Method (FEM) to Simulate the Grid Cells

The fundamental premise of the finite element approach is that analytical accuracy increases with element size. The simulation model becomes even more perfect if the tiny mesh size gets close to infinity [33]. However, when the meshing technique uses too many elements, the model becomes complex, with a large number of nodes and degrees of freedom. Unlike in an implicit environment, a longer time is needed to perform simulations of mesh structures made of non-linear materials such as polymers in the dynamic problem, or worse, errors are introduced. Therefore, the experiment entailed L9 simulations carried out in the dynamic explicit environment of the Abaqus program, with the three components and three levels, as shown in Table 2. As shown in Figure 6, the correct material model was selected by default as isotropic. Here, the solid was divided into a tetrahedral shape with C3D4 elements and a size of 1.5 mm, and the grid cell in the simulation environment was divided into a hexahedral shape with C3D8R elements and a size of 0.1 mm. In addition to establishing the contact mechanism as sliding, as it is not possible to assign a coefficient of friction to a liquid such as water, the study only considered the interaction between the wires (homopolymer) together at the positions of the wires of the knot, and the contact of the ropes on the solid with 0.2 as a coefficient of friction [33]. The simulation was run at 2 m/s due to the semi-static nature of the setting. In the mesh, the most strained position when subjected to external pressures is also considered because of the non-linear string structures [34], such as the knot of grid cells. These sites are challenging to estimate using conventional calculating techniques. Even though the wire is tubular, meshing the FEM can be relatively simple. However, the string structure is unnaturally altered and isotropic at the location of knots. Consequently, the hexagonal pieces at these places may appear somewhat deformed and rough, but the accuracy of the stress values remains unaffected.
The influence of mesh design variables on the ability to do mechanical work when there are objects acting on the mesh structure was studied. The Taguchi method with an orthogonal design [35] was used to determine the signal-to-noise (S/N) using the larger-the-better (Equation (12)) in this case.
S N = 10 l n 1 x i = 1 x n i 2
where x is the number of observations and n is the observed data.

3.4. Confirmation Experiments

After the optimal set of parameters was determined, the validation experiments were performed in a semi-static environment. For this, the experiments were carried out at four-speed levels of 0.5, 1.0, 1.5, and 2.0 m/s on the tensile tester machine and in a simulated environment to evaluate the mechanical workability when the speed changes. Determination of the stress curve at the position of maximum stress of the mesh structure based on the higher-order curve is shown in Equation (13) and the mechanical work curve prepared by the least squares method [36,37] is shown in Equation (14).
σ t = A H ε t B H
Y i = i = 1 n C x i + D 2
where  σ t  is the stress value (MPa),  ε t  is the strain value, and  A H , B H , C , D  are the constants.

4. Results and Discussion

4.1. The Taguchi Method

The researchers used the Taguchi approach to optimize the design variables of the mesh structure while using finite element method models in the dynamic explicit environment of the Abaqus software. The mechanical work capacity of the grid cells was measured when stretched by the solid at a speed of 2 m/s. The stronger the displacement capacity of the grid cells, the better their load-carrying ability due to the non-linear features and excellent plastic deformation. With the movement of the impediment, the remaining portions are distorted and displaced. Table 3 displays the response table for the S/N ratio based on the larger-the-better quality attributes, demonstrating that: the test specimen made of PA with a cross-section of 0.4 mm and a length of 30 mm rendered the best mechanical work value when the blockage first contacted the mesh. However, the test piece made of PE, with a cross-section of 0.3 mm and a length of 20 mm, yielded the lowest result. These findings demonstrate that the capacity to produce mechanical work is significantly affected by the contact stiffness matrix.
The process control variables impacting S/N ratios are presented in Figure 7. PA has the highest rating of −16.7 when material variables are taken into account. Following that is the PP material, with a value of −25.78, and a small decrease in the value to −39.25 for the PE material. The cross-section factor graph exhibits a strong increasing trend, demonstrating that the influence on signal-to-noise increases with cross-section size. The chart typically peaks at level 2 at −26.77, drops to level 1 at −27.09, and reaches level 3 at −27.89 when the last component (the edge length of the grid cell) is considered. These findings demonstrate that the ideal net length is 25 mm. The rank of the design variables is shown in Table 4, with the best being the material variable; next is the cross-section and the size variable.
As shown in Table 5, the value of ρ was used to determine the significance and relative importance of each factor through the estimated regression coefficient table. For the S/N ratio, the elements of material, cross-section, and size have ρ values of less than 0.05, at 0.003, 0.036, and 0.491, respectively (statistically significant at 0.05). These results indicate that the material has the greatest impact on the mesh structure, with a mean square of 385.9, accounting for 93% of the variance. The next most impactful element assessed was the cross-section, with a mean square of 26.2, contributing to 6% of the total, and the final element was the size, contributing 1%.

4.2. Interactions of the Fishnet Structure

The real mesh structure was assessed for tensile strength using the optimal parameter set of the PA material, 0.4 mm cross-section, and 25 mm length on the tensile tester machine at four speeds of 0.5, 1.0, 1.5, and 2.0 m/s, as shown in Figure 8.
At a speed of 1 m/s, the tensile mesh structure made of the PA material exhibits a good tensile strength of up to 1280 MPa and an elongation of break of 157%, greater than 7.2 and 15.7 times, respectively, the strength of each individual PA fiber. Concurrently, the knots near the impact region of the object are where the trawl net structure is most strained. Figure 9 depicts the process of a state shift. When the speed is set to 1 m/s, the solid takes 1.84 s to breach the mesh in a dynamic explicit environment. The end of the mesh cell closest to the item is where it makes contact with the passive wire part and the greatest amount of stress is focused.
Figure 10a depicts the stress curve of the grid cell structure after using the higher-order curve. Figure 8b shows that the actual mesh structure is not uniform in the shape of the grid cells as in the 3D model (Figure 5); the knots can be slightly loose, resulting in slight distortion in shape. Hence, in the early stages of the experimental process, before the mesh structure is stretched, there is not much increase in the stress value compared to the strain value, and hence the growth curve looks like a metamaterial.
A follow-up investigation assessed how mechanical work is performed at various speeds. Figure 10b displays the mechanical work curve with varied speeds after using the least squares approach.
σ g = 357.134 ε g 3.08081
W i C = 0.1887 0.005209 v + 0.01058 v 2

5. Conclusions

In this study, the finite element method was used to assess the interaction of the object with the trawl mesh structure. The design variables (material, cross-section, and mesh size) were optimized using the Taguchi technique in a dynamic-explicit environment to forecast and improve the process of completing work on the mesh structure. The findings of the study are as follows:
-
The use of the Taguchi approach improved the research on the technological aspects of the trawl grid structure. The findings indicate that the material has a significant impact on the mesh structure of up to 93%. Polyamide (PA) is the suggested material because it has a higher contact stiffness matrix  D i  than the other two materials. The next most impactful element is the cross-section (0.4 mm), which impacts 6% of the trawl mesh structure. This level of influence can be increased if the angler selects a wider cross-section because the graph tends to rise gradually. The size of the grid just depends on the size of the type of fish and has a relatively minimal impact. This study advises fishermen to use Equation (11) to choose the grid size.
-
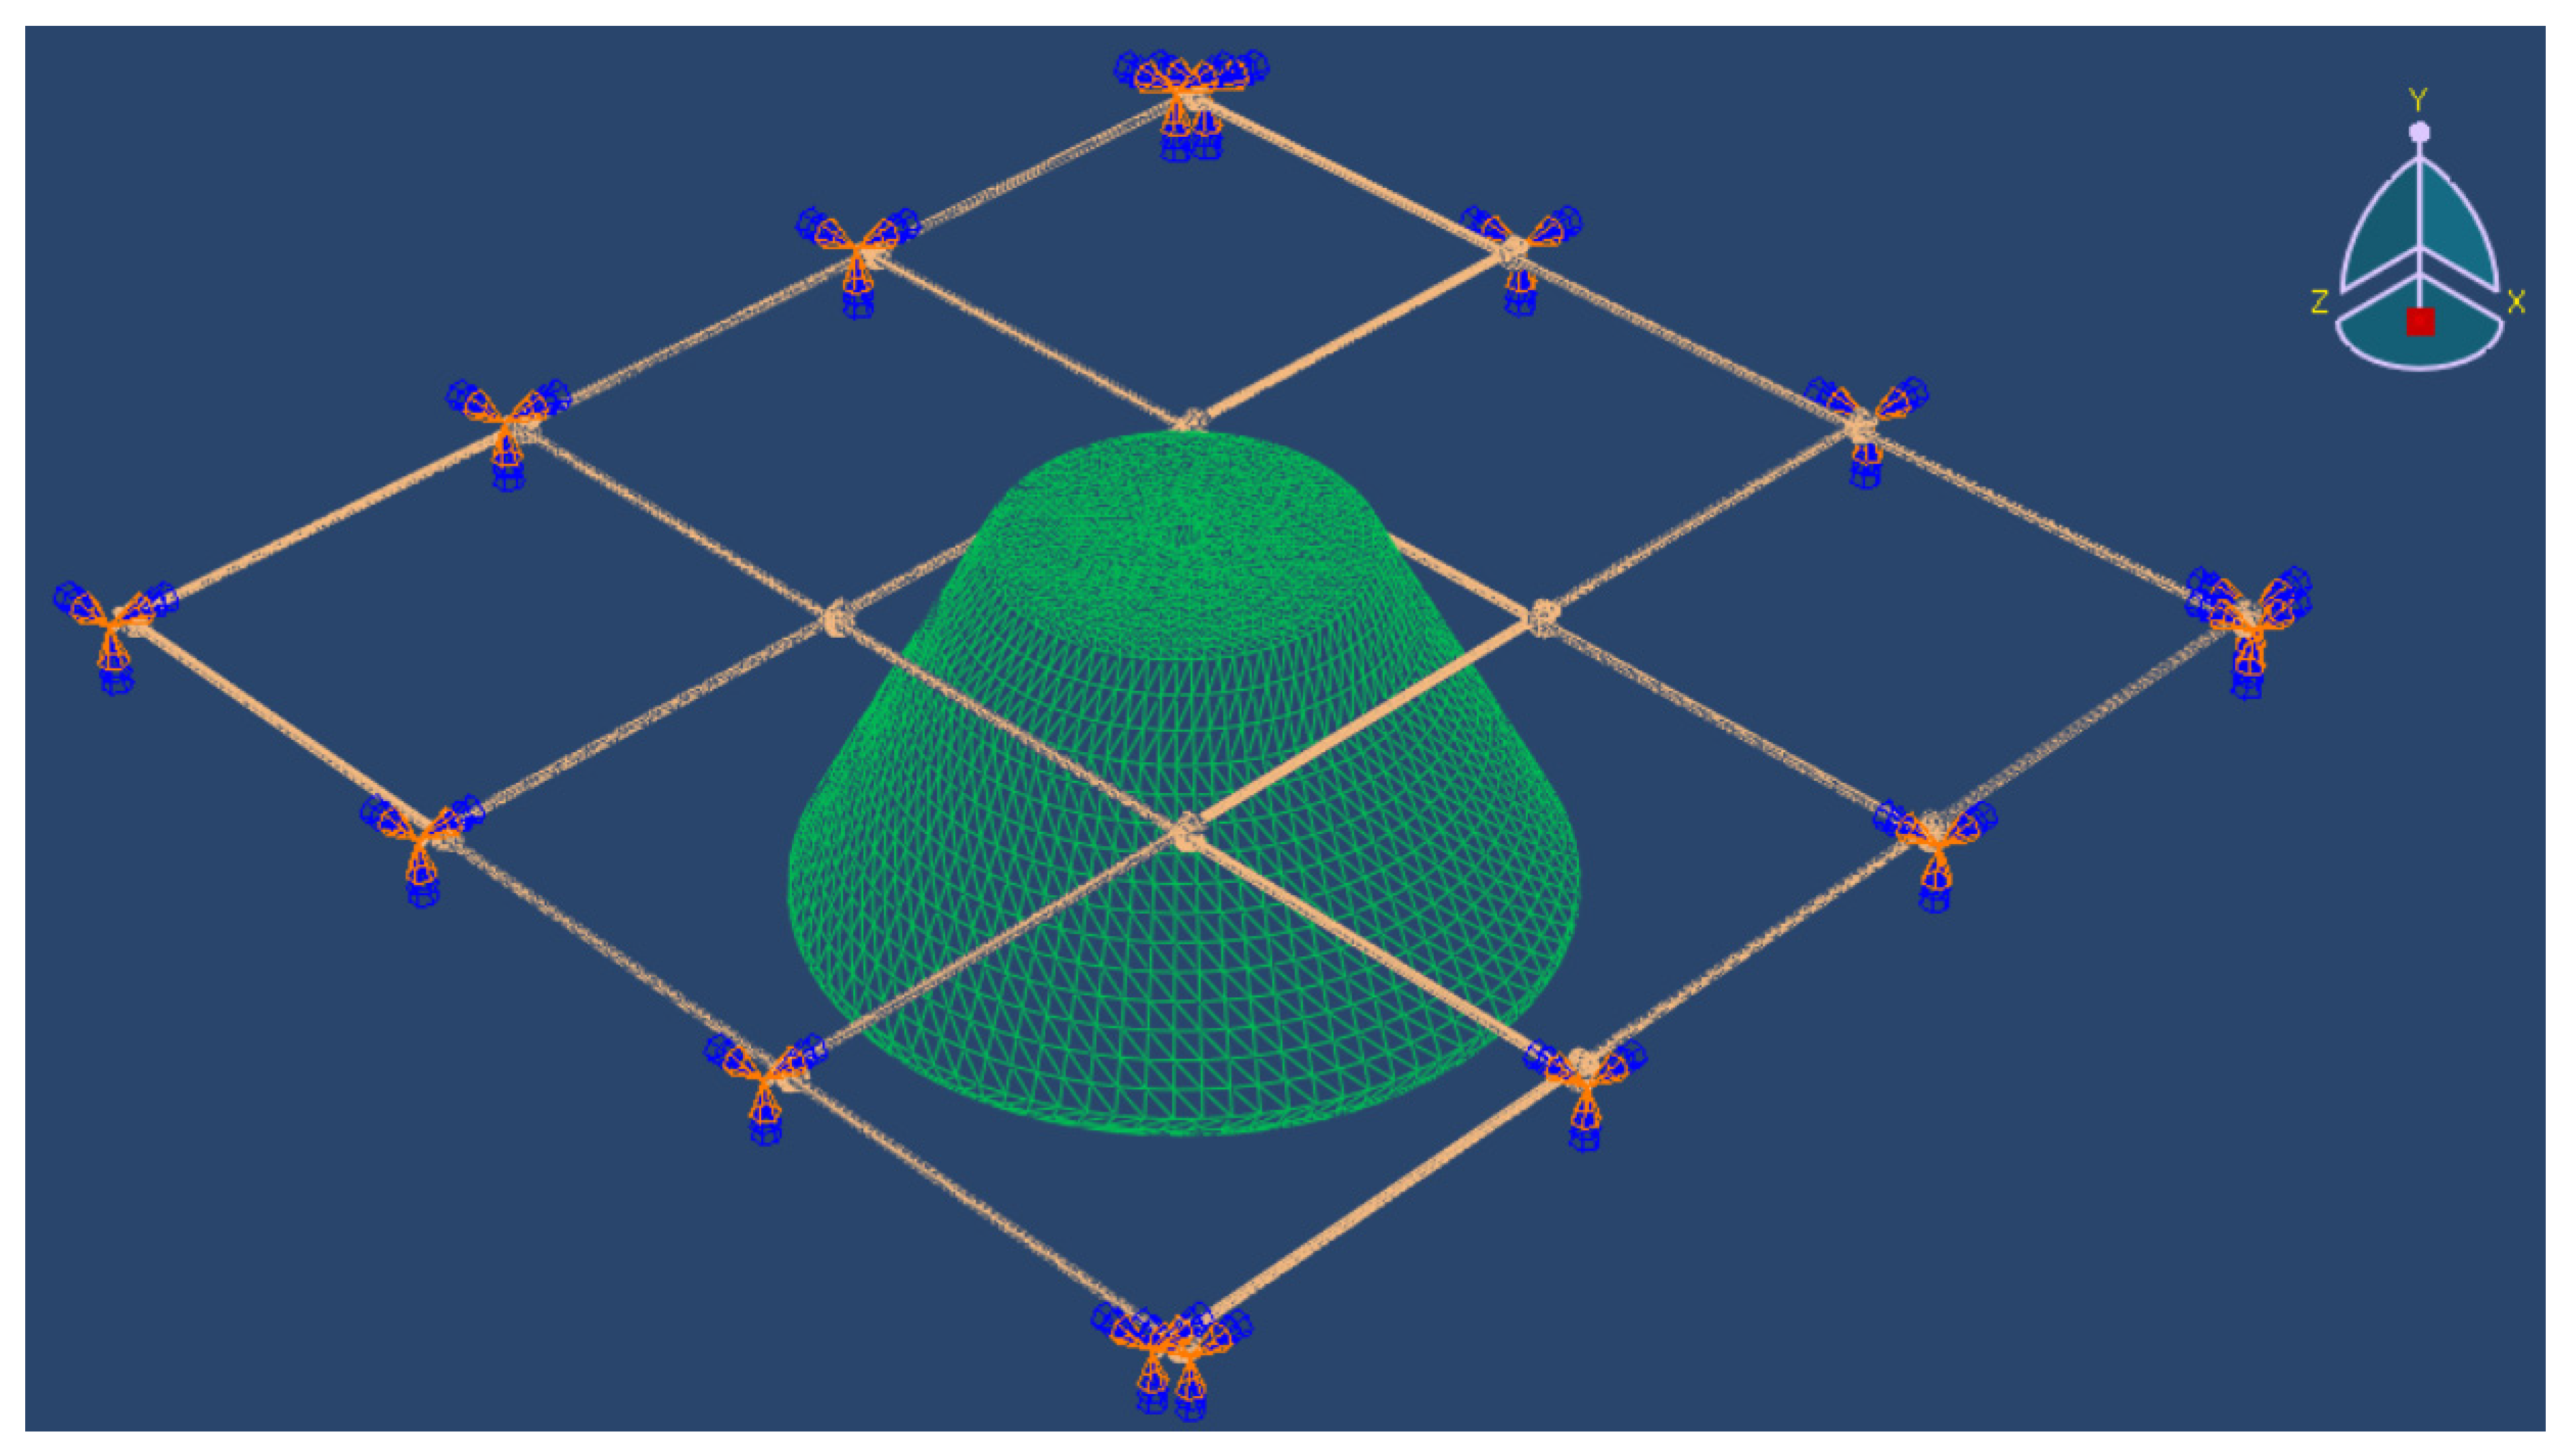
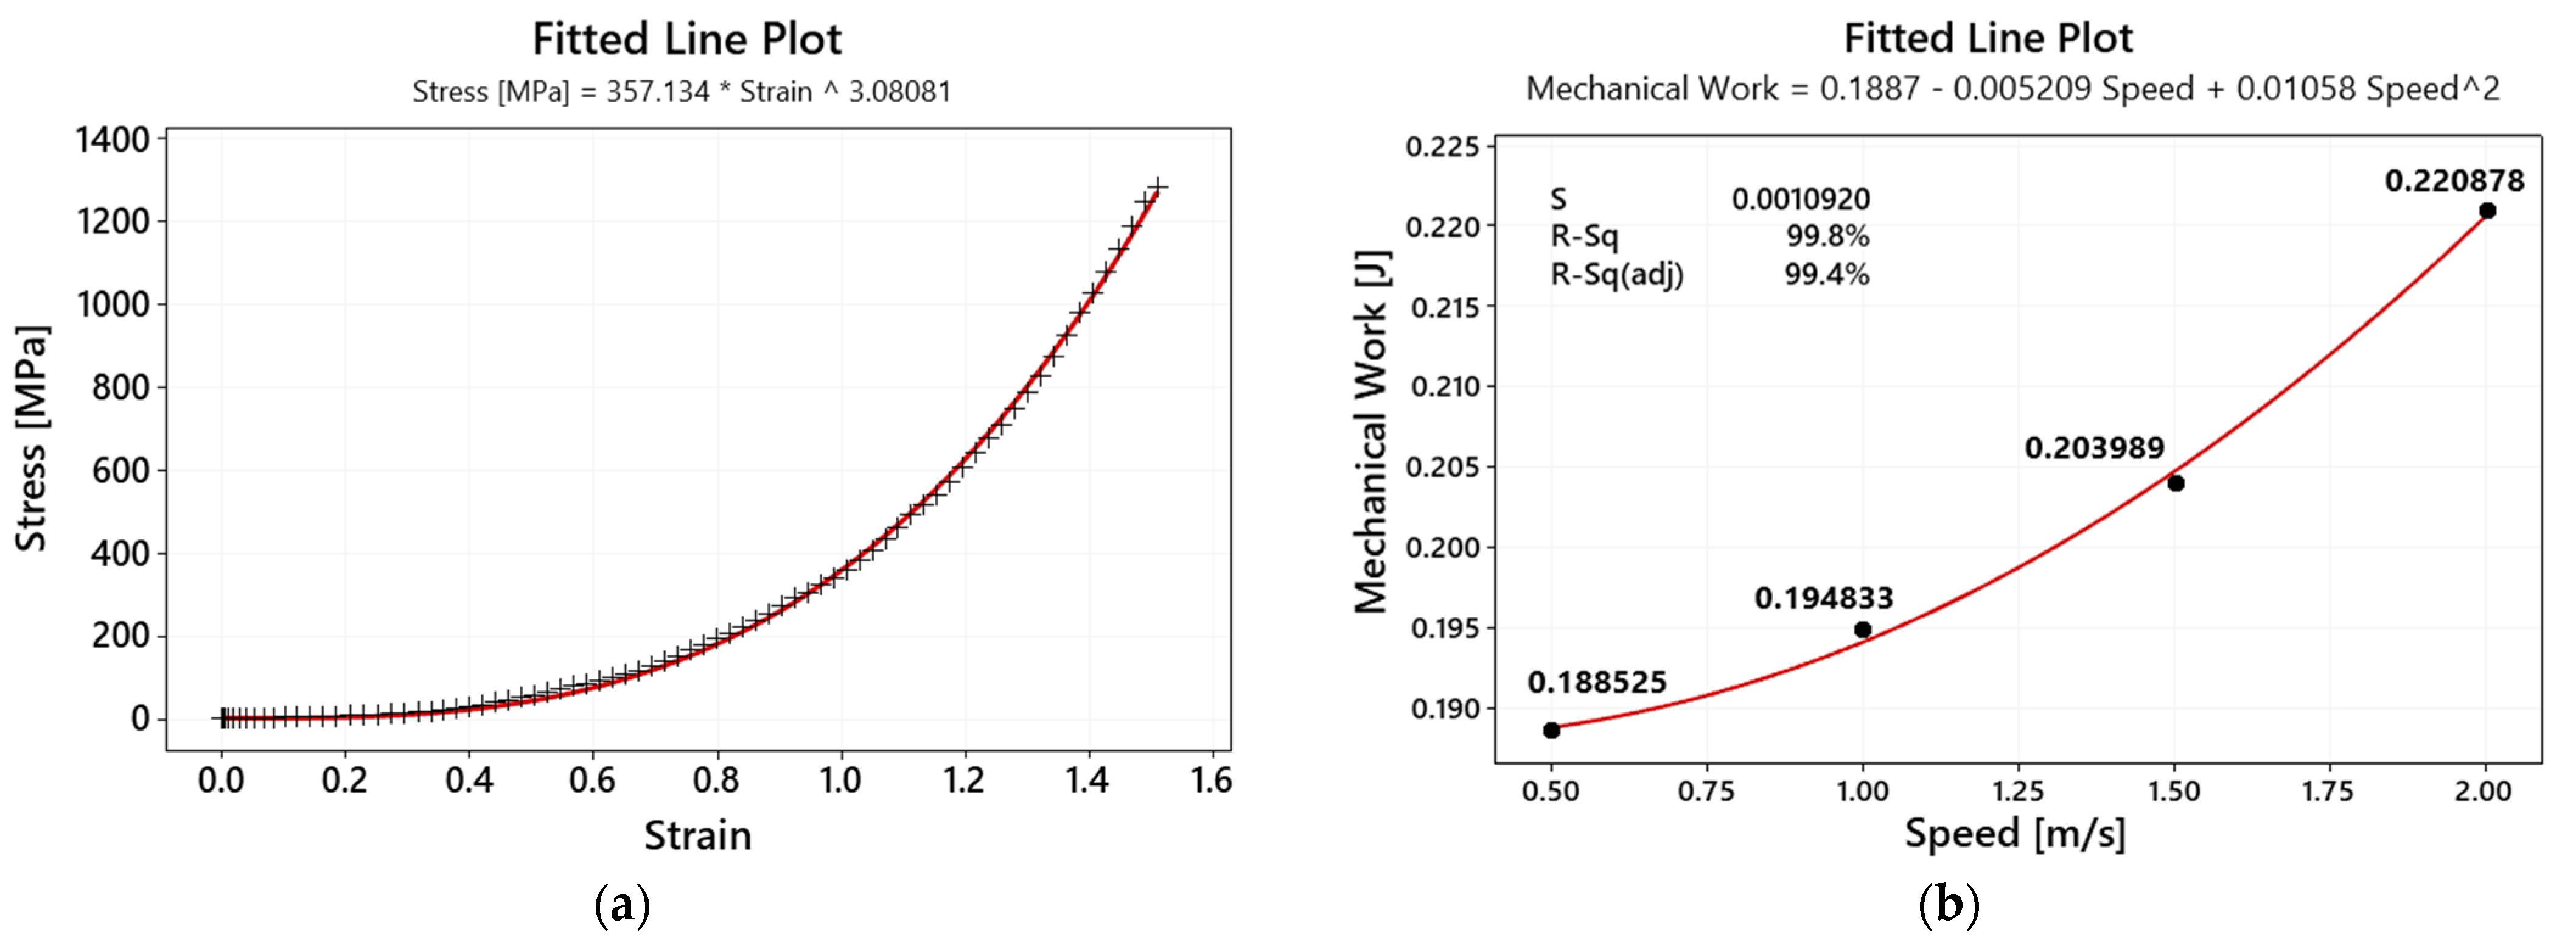
When a trawl mesh structure is struck by an object, the knots immediately surrounding the impact area experience the highest concentration of stress (Figure 9) and the active rope is simultaneously pulled to affect the object. Breakage is brought on by tension on the passive wire when an object is traveling at 1 m/s, since the maximum stress can reach 1280 MPa. As the object moves away, the stress gradually decreases. Application of the higher-order curve reveals that the stress characteristic curve of the mesh structure is highly reliable, as depicted in Figure 10a.
-
In a semi-static environment, the mechanical effort exerted on the mesh structure tends to progressively rise with the increase in the speed of the item exerting the force. Figure 10b depicts the characteristic curve of this factor after the application of the least squares approach, with a confidence level of up to 99.8%.
-
Research has significantly improved the reference data for semi-static trawl mesh structures or other forms of grids with comparable structures and features. In the future, the use of more flow factors, water viscosity, and Reynolds coefficient evaluations may lead to more research development.

Author Contributions

Writing—original draft preparation, N.-D.N.; writing—review and editing, N.-D.N. and S.-C.H. All authors have read and agreed to the published version of the manuscript.

Funding

The authors acknowledge and thank the Ministry of Science and Technology of the Republic of China for their partial financial support of this study under contract number MOST 111-2221-E-992-068.

Institutional Review Board Statement

Not applicable.

Informed Consent Statement

Not applicable.

Data Availability Statement

Data is contained within the article.

Conflicts of Interest

The authors declare no conflict of interest.

References

  1. CSI Research. Report on Vietnam’s Seafood Industry. 2020. Available online: https://finance.vietstock.vn/bao-cao-phan-tich/7566/bao-cao-nganh-thuy-san-viet-nam.html (accessed on 27 August 2020).
  2. Grottum, J.A.; Beveridge, M. A Review of Cage Aquaculture: Northern Europe; FAO Fisheries Technical Paper; FAO: Rome, Italy, 2007; pp. 126–154. [Google Scholar]
  3. Sena, S.D.S.; Michael, J.P. A Review of Cage Aquaculture Asia (Excluding China); FAO Fisheries Technical Paper; FAO: Rome, Italy, 2007; pp. 18–48. [Google Scholar]
  4. Lan, H.Y.; Afero, F.; Huang, C.T.; Chen, B.Y.; Huang, P.L.; Hou, Y.L. Investment Feasibility Analysis of Large Submersible Cage Culture in Taiwan: A Case Study of Snubnose Pompano (Trachinotus anak) and Cobia (Rachycentron canadum). Fishes 2022, 7, 151. [Google Scholar] [CrossRef]
  5. Bertaglia, E.d.A.; Furtado, W.E.; Silva e Souza, Â.T.; Fernandes, M.C.; Pereira, S.A.; Brasil, E.M.; Mouriño, J.L.P.; Jerônimo, G.T.; Martins, M.L. Influence of Seasonality and Culture Stage of Farmed Nile Tilapia (Oreochromis niloticus) with Monogenean Parasitic Infection. Animal 2023, 13, 1525. [Google Scholar] [CrossRef]
  6. Tang, H.J.; Chiang, W.S.; Nan, F.H. Engineering Feasibility Assessment of Cage Aquaculture in Offshore Wind Power Generation Areas in Taiwan. Sustainability 2022, 14, 11705. [Google Scholar] [CrossRef]
  7. Le Bris, F.; Marichal, D. Numerical and experimental study of submerged supple nets: Applications to fish farms. J. Mar. Sci. Technol. 1998, 3, 161–170. [Google Scholar] [CrossRef]
  8. Xu, Z.; Qin, H. Fluid-structure interactions of cage based aquaculture: From structures to organisms. Ocean Eng. 2020, 217, 107961. [Google Scholar] [CrossRef]
  9. Cifuentes, C.; Kim, M.J. Numerical simulation of fish nets in currents using a Morison force model. Ocean. Syst. Eng. 2017, 7, 143. [Google Scholar]
  10. Chen, H.; Christensen, E.D. Development of a numerical model for fluid-structure interaction analysis of flow through and around an aquaculture net cage. Ocean. Eng. 2017, 142, 597–615. [Google Scholar] [CrossRef] [Green Version]
  11. Su, B.; Kelasidi, E.; Frank, K.; Haugen, J.; Føre, M.; Pedersen, M.O. An integrated approach for monitoring structural deformation of aquaculture net cages. Ocean. Eng. 2021, 219, 108424. [Google Scholar] [CrossRef]
  12. Jensen, Ø.; Dempster, T.; Thorstad, E.; Uglem, I.; Fredheim, A. Escapes of fishes from Norwegian sea-cage aquaculture: Causes, consequences and prevention. Aquac. Environ. Interact. 2010, 1, 71–83. [Google Scholar] [CrossRef] [Green Version]
  13. Thierry, B.; Tang, H.; Zhang, J.; Liu, W.; Xu, L.; Hu, F. Experimental Analysis of the Influence of Gear Design and Catch Weight on the Fluid–Structure Interaction of a Flexible Codend Structure Used in Trawl Fisheries. Appl. Sci. 2023, 13, 2505. [Google Scholar] [CrossRef]
  14. Kristiansen, T.; Faltinsen, O.M. Modelling of current loads on aquaculture net cages. J. Fluids Struct. 2012, 34, 218–235. [Google Scholar] [CrossRef]
  15. Fujii, F.; Noguchi, H.; Oda, K. Flexible and Incompressive Goal Nets in Soccer. Comput. Methods 2006, 1, 1903–1909. [Google Scholar] [CrossRef]
  16. Eo, S.; Hong, S.H.; Song, Y.K.; Han, G.M.; Seo, S.; Shim, W.J. Prevalence of small high-density microplastics in the continental shelf and deep sea waters of East Asia. Water Res. 2021, 200, 117238. [Google Scholar] [CrossRef]
  17. Eimontas, J.; Yousef, S.; Striūgas, N.; Abdelnaby, M.A. Catalytic pyrolysis kinetic behaviour and TG-FTIR-GC–MS analysis of waste fishing nets over ZSM-5 zeolite catalyst for caprolactam recovery. Renew. Energy 2021, 179, 1385–1403. [Google Scholar] [CrossRef]
  18. Suzuki, K.; Takagi, T.; Shimizu, T.; Hiraishi, T.; Yamamoto, K.; Nashimoto, K. Validity and visualization of a numerical model used to determine dynamic configurations of fishing nets. Fish. Sci. 2003, 69, 695–705. [Google Scholar] [CrossRef] [Green Version]
  19. Baranowski, P.; Małachowski, J.; Niezgoda, T.; Mazurkewicz, Ł. Dynamic behaviour of Various Fibre Systems During Impact Interaction—Numerical Approach. Fibres Text. East. Eur. 2015, 23, 72–82. [Google Scholar] [CrossRef]
  20. Logan, D.L. A First Course in the Finite Element Method, 6th ed.; Cengage Learning: Boston, MA, USA, 2017. [Google Scholar]
  21. Bessonneau, J.S.; Marichal, D. Study of the dynamics of submerged supple nets (applications to trawls). Ocean Eng. 1998, 25, 563–583. [Google Scholar] [CrossRef]
  22. Crasmareanu, M. Higher-Order Curvatures of Plane and Space Parametrized Curves. Algorithms 2022, 15, 436. [Google Scholar] [CrossRef]
  23. Li, S.; Jiang, T.; Zeng, X.; Zhu, N.; Shen, C.; Gong, W.; Zhang, C.; He, L. The Effect of α-Olefin–Maleic Anhydride Copolymer on the Rheological and Crystalline Properties and Microcellular Foaming Behavior of Polyamide 6. Polymers 2023, 15, 2056. [Google Scholar] [CrossRef]
  24. Zuo, Z.; Hao, X.; Li, H.; Wang, W.; Yang, G.; Liu, Y. Experimental Investigations on the Tensile Mechanical Behavior of HDPE Geocell Strip. Sustainability 2023, 15, 7820. [Google Scholar] [CrossRef]
  25. Qureshi, H.J.; Khurram, N.; Akmal, U.; Arifuzzaman; Habib, M.Q.; Al Fuhaid, A.F. Flexure Performance of Ferrocement Panels Using SBR Latex and Polypropylene Fibers with PVC and Iron Welded Meshes. Polymers 2023, 15, 2340. [Google Scholar] [CrossRef]
  26. ISO 527-1; Plastics—Determination of Tensile Properties—Part 1: General Principles. International Organization for Standardization: Geneva, Switzerland, 2012.
  27. Wagner, R.H.N. ABAQUS Tutorial: Damage for Ductile Metals—Material Model Explained—Ductile Damage. Researchgate. 2021. Available online: https://www.researchgate.net/publication/350124892_ABAQUS_Tutorial_Damage_for_Ductile_Metals_-_Material_Model_Explained_-_Ductile_Damage (accessed on 1 March 2021).
  28. McIntee, O.M.; Welch, B.C.; Greenberg, A.R.; George, S.M.; Bright, V.M. Elastic modulus of polyamide thin films formed by molecular layer deposition. Polymer 2022, 255, 125167. [Google Scholar] [CrossRef]
  29. Wölfel, E.; Brünig, H.; Curosu, I.; Mechtcherine, V.; Scheffler, C. Dynamic Single-Fiber Pull-Out of Polypropylene Fibers Produced with Different Mechanical and Surface Properties for Concrete Reinforcement. Materials 2021, 14, 722. [Google Scholar] [CrossRef]
  30. Fatima, S.; Achraf, W.; Abdelkarim, K.; Hamid, C.; Mohamed, E. Failure Analysis of Acrylonitrile Butadiene Styrene (ABS) Materials and Damage Modeling by Fracture. Int. J. Perform. Eng. 2019, 15, 2285. [Google Scholar] [CrossRef]
  31. De Morais, J.A.; Gadioli, R.; De Paoli, M.-A. Curaua fiber reinforced high-density polyethylene composites: Effect of impact modifier and fiber loading. Polímeros 2016, 26, 115–122. [Google Scholar] [CrossRef] [Green Version]
  32. MacDonald, I.R. Fishing with Bottom Gillnets; Food and Agriculture Organization of the United Nations: Rome, Italy, 1980. [Google Scholar]
  33. Baranowski, P.; Malachowski, J.; Janiszewski, J.; Wekezer, J. Detailed tyre FE modelling with multistage validation for dynamic analysis. Mater. Des. 2016, 96, 68–79. [Google Scholar] [CrossRef]
  34. Fox, M. Polymer Tribology. In The European Lubricants Industry Magazine; Lube: Chesham, UK, 2016. [Google Scholar]
  35. Kieu, D.V.N.; Huang, S.C. Dynamic Creep Phenomenon on Polymer Cable with Non-linear Characteristics for Cable-driven Parallel Robots. In Proceedings of the 2020 IEEE Eurasia Conference on IOT, Communication and Engineering (ECICE), Yunlin, Taiwan, 23–25 October 2020. [Google Scholar] [CrossRef]
  36. Danh, N.N.; Son, T.D. The solution of taking net-wrapper automatically by using principle of suction fan. J. Austrian Soc. Agric. Econ. 2021, 17, 807–816. [Google Scholar]
  37. Xu, J.; Zheng, S.; Sun, K.; Song, P. Research and Application of Contactless Measurement of Transformer Winding Tilt Angle Based on Machine Vision. Sensors 2023, 23, 4755. [Google Scholar] [CrossRef]
Figure 1. Decomposition of rigid elements of diamond mesh nettings.
Applsci 13 07536 g001
Figure 2. An algorithm flowchart of the current study.
Applsci 13 07536 g002
Figure 4. Determine the size of the grid cell.
Applsci 13 07536 g004
Figure 5. The solids and grid cells utilized in the simulation and their form.
Applsci 13 07536 g005
Figure 6. The simulation experiments with the Abaqus program.
Applsci 13 07536 g006
Figure 7. Effects of process control on the signal−to−noise (S/N) ratios.
Applsci 13 07536 g007
Figure 8. Experiments of the optimized grid cell when the tensile tester machine speed rate is changed: (a) experimental set-up; (b) the result of experiments; and (c) the tensile strength graph grid cells when the speed rate changes.
Applsci 13 07536 g008
Figure 9. The process for altering the stress condition at the knot of grid cells.
Applsci 13 07536 g009
Figure 10. The construction of the grid cells’ characteristic curve: (a) tensile strength and (b) mechanical work.
Applsci 13 07536 g010
Table 1. Specification of polymer isotactic materials [28,29,30,31].
PropertiesUnitsPolymer materials
ABSPolyamidePolyethylenePolypropylene
Yarn type-SolidFilamentMultifilamentMultifilament
Densityg/mm310501130960940
Breaking forceN-22.1437.221.6
Tensile strengthMPa43.8177.14296.26178.23
Elongation at break%7.210.05.722.5
Poisson’s ratio-0.300.400.460.42
Young’s modulusMPa1470254010901600
Table 2. Operation control variables and their concentrations.
Design VariablesLevel 1Level 2Level 3
MaterialPolyamidePolyethylenePolypropylene
Section of line (mm)0.20.30.4
Size of grid cell (mm)202530
Table 3. Results of the simulation.
Ex.MaterialCross-SectionSize of Grid Cell   δ U i Q   D i   W i c
1PA0.22010.040.01020.102
2PA0.32514.470.01020.147
3PA0.43020.440.01020.208
4PE0.32011.990.00080.009
5PE0.42511.670.00080.009
6PE0.23021.000.00080.016
7PP0.42011.970.00290.035
8PP0.22518.210.00290.053
9PP0.33025.050.00290.073
Table 4. Response table for signal-to-noise (S/N) ratios with larger-the-better.
LevelMaterialCross-SectionSize
1−16.71−29.95−27.09
2−39.25−27.69−26.77
3−25.79−24.1−27.89
Delta22.545.861.12
Rank123
Table 5. The analysis of variance table.
Design VariablesL1L2L3SSDFMSρ%
AMaterial−16.71−39.25−25.79771.82385.90.00393
BSection−29.95−27.69−24.152.4226.20.0366
CSize−27.09−26.77−27.892.021.00.4911
Disclaimer/Publisher’s Note: The statements, opinions and data contained in all publications are solely those of the individual author(s) and contributor(s) and not of MDPI and/or the editor(s). MDPI and/or the editor(s) disclaim responsibility for any injury to people or property resulting from any ideas, methods, instructions or products referred to in the content.

