Article

Airtightness Sealing Performance and Failure Mechanism of the Circumferential Joint in the Low-to-Vacuum Maglev Segment Tunnel

1
State Key Laboratory of Shield Machine and Boring Technology, Zhengzhou 450001, China
2
School of Civil Engineering, Southwest Jiaotong University, Chengdu 610031, China
3
Key Laboratory of High-Speed Railway Engineering, Ministry of Education, Southwest Jiaotong University, Chengdu 610031, China
*
Author to whom correspondence should be addressed.
Appl. Sci. 2023, 13(13), 7535; https://doi.org/10.3390/app13137535
Submission received: 7 May 2023 / Revised: 16 June 2023 / Accepted: 24 June 2023 / Published: 26 June 2023
(This article belongs to the Special Issue Advances in Tunnel and Underground Construction)

Abstract

:
Segment lining structure is one of the choices to be used for low-to-vacuum maglev tunnels in the future. The airtightness at the joints of the lining structures is one of the critical problems that need to be addressed. However, little attention has been devoted to this problem until now. In this paper, a new apparatus was invented and used to study the mechanical behavior and airtightness sealing capacity of the gasket-in-groove, and a finite element analysis (FEA) model, validated by the test, was developed and used to further investigate thoroughly the sealing performance and sealing failure mechanism of the gasket-in-groove. The results obtained by the above two methods were discussed and compared, and a series of findings were presented. The results showed that the initial pressure distribution on the gasket–gasket contact surface is not uniform due to the presence of the inner holes in the gasket and the grooves between the gasket legs and an approximate “W” shape distribution in this study. The effect of vacuum pressure on the contact pressure distribution is very significant and shows an overall decreasing trend with increasing vacuum pressure. A higher initial maximum contact pressure would provide a better sealing effect but a lower sealing safety factor. Airtightness failure induced by evacuation is a contact surface separation process in which the maximum contact pressure shows a tendency to rise sharply with vacuum pressure increases, followed by a slow drop, and then declines dramatically to zero.

1. Introduction

Using maglev technology and building a low air pressure into a vacuum operating environment to reduce atmospheric friction and noise is regarded as one of the most promising developments for high-speed railway transportation in the future [1]. An underground tube is a preferable alternative to creating a low or vacuum air pressure environment, and the underground tube has the advantages such as safety, high efficiency, and little environmental disturbance [2]. However, using the segmental lining structure for low-to-vacuum tubes is challenging, and how to model the internal forces and how to keep the tube airtightness are two important issues. Based on the research for tunnel linings in conventional atmospheric conditions [3,4,5], our previous work presented an analytical solution for the internal forces in a low-to-vacuum tunnel lining, and the impact of key parameters on the internal forces was discussed [1]. The objective of this paper is to explore the mechanism behavior, sealing performance, and sealing failure mechanisms of the segmental circumferential joint.
A great number of tunnels with segmental lining structures have been built in the past decade for various purposes, while some problems affecting the tunnel’s functions have been observed, which include water leakage in adjacent segments or adjacent rings in a water pressure environment [6,7,8,9]. Since the joint airtightness sealing for low-to-vacuum maglev segment tunnels has not been used before and the mechanism of the airtightness sealing is somewhat similar to the waterproofing of the joints of tunnels, the literature review on the joint sealing performance for segmental tunnels mainly focuses on the waterproofing.
Like other industrial methods of sealing joints [10,11], a common solution for the joint sealing of segmental tunnels is to install elastomeric rubber gaskets circumferentially on the end faces of the segment [12,13]. However, to conveniently assemble the joints and segments during construction and thus avoid damaging the tunnel segment structures, sealing gaskets in tunnel joints actually have much more orifices than solid ones. For a maglev train segment tunnel, the main purpose of the gaskets is to keep the airtightness of the internal tube of the tunnel, which is more challenging than waterproofing. Theoretically, the gasket can prevent the intrusion of pressured water and air into the tunnel interior through the joint that is subjected to contact pressures induced by external forces. Unfortunately, very little research with respect to airtightness techniques and the performance of the gasket applied to the traditional segmental tunnel has been found. On the other hand, water leakage has been found in the waterproofing gasket, and significant research utilizing numerical simulations and model experiments has been conducted to have a comprehensive understanding of the mechanism and sealing performance of the gaskets. Shalabi et al. [14] conducted a leakage test using a steel frame device to explore the sealing performance of two types of gaskets—one is open-base gaskets, and the other is closed-base gaskets—and proposed a theoretical model to describe the gasket leakage mechanism. According to Shalabi et al. [14], the leakage occurs in the case of water pressure being markedly lower than the final gasket contact pressure for the open-base gaskets; meanwhile, for the closed-base gaskets, the leakage occurs as the water pressure approximately equals the gasket contact pressure. They concluded that the closed-base gasket has a better sealing capability than the open-base gasket. Ding et al. [2] developed an innovative apparatus to analyze the coupling leakage and mechanical behaviors of longitudinal/circumferential joints and T-joints subjected to water pressure and found that a gasket with staggered inner holes and legs could provide better sealing performance than one with an aligned layout based on the test results. Shi et al. [15] established a stress–seepage coupling model of the gasket sealing for the segment joints and derived the corresponding coupling equations for the contact interface. Their findings indicate that the joint gap and joint offset can significantly decrease the gasket contact pressure, which would cause a dramatic increase in the seepage rate, and therefore the joint’s sealing capacity is markedly reduced. To evaluate the waterproofing capability of a gasket-in-groove subjected to water pressure, Gong et al. [16] presented an Abaqus-based numerical framework that was validated with experimental data to predict the behaviors of water leakage. Using this numerical framework and incorporating experimental results, Gong et al. [17,18,19] further investigated the effect of key parameters, which included the joint gap, joint offset, positive joint rotation, negative joint rotation, the angle of the sidewall, groove width, and gasket hardness, on gasket sealing behavior through analyzing the contact pressure distribution and the water-leakage pressure in different scenarios. Continuously, Gong et al. [18] presented a theoretical model similar to that of Shalabi et al. [14] to illustrate the gasket leakage mechanism. Moreover, with the aim of better guiding the waterproofing design of segment joints, Gong et al. [20] also proposed a joint waterproofing design framework based on experimental and numerical simulation results.
The research mentioned in the above literature review has contributed greatly to understanding the sealing performance and failure mechanism of single gaskets for waterproofing. In practice, especially in some underwater segment tunnels, double waterproofing gaskets have been used to improve the robustness of the joints and reduce the failure risk, and the sealing performance and mechanism have also been studied. Shalabi et al. [21] investigated the leakage behaviors of double gaskets subjected to static ground loads and earthquake shaking. The results indicated that the waterproofing capacity of the longitudinal joints was enhanced through cycling due to the increased bond between the gasket and the gasket groove. Li et al. [22] estimated the sealing behavior of the double open gasket with joint opening and offset combination using model test results, and no apparent discrepancy was found between single and double EPDM gaskets with the same joint opening and offset. Ding et al. [23] investigated the sealing behavior of double gaskets under four situations using an improved test apparatus that can monitor the water pressure, and the results show that the joint waterproofing capacity depends mainly on one gasket with a higher waterproofing capacity and that only a slight improvement in the waterproofing capacity with the same double gasket is observed.
Although watertight sealing and airtight sealing are somewhat similar from a general point of view, very limited literature was found related to the airtightness sealing of joint gaskets in segmental tunnels. Hence, the airtightness sealing performance and failure mechanisms of the joints for segmental tunnels are worth studying to meet the development need of low-to-vacuum maglev segment tunnels. Aiming at the above purposes, this paper first introduced an apparatus invented to perform experimental studies on the mechanical behavior and airtightness sealing capacity of the gasket-in-groove, followed by the corresponding test methods and test results. Next, a 2D finite element analysis model was validated by the test, and finally, both experimental tests and the numerical models with FEA were performed to further investigate thoroughly the airtightness sealing performance and sealing failure mechanism of the gasket-in-groove.

2. Experimental Model Tests

The model test consists of two parts: (i) a mechanical test, which focuses on the analysis of the load-deformation behavior of the gasket-in-groove, and (ii) an airtightness test, which explores the sealing capability of the gasket-in-groove. For the first part, the test procedure and test cycle are relatively simple and short. Three parallel tests were conducted for each operating condition, and their average value was used as the final test result. For the second part, one test for each operating condition was carried out due to the complexity of the test procedure and the longer test period.

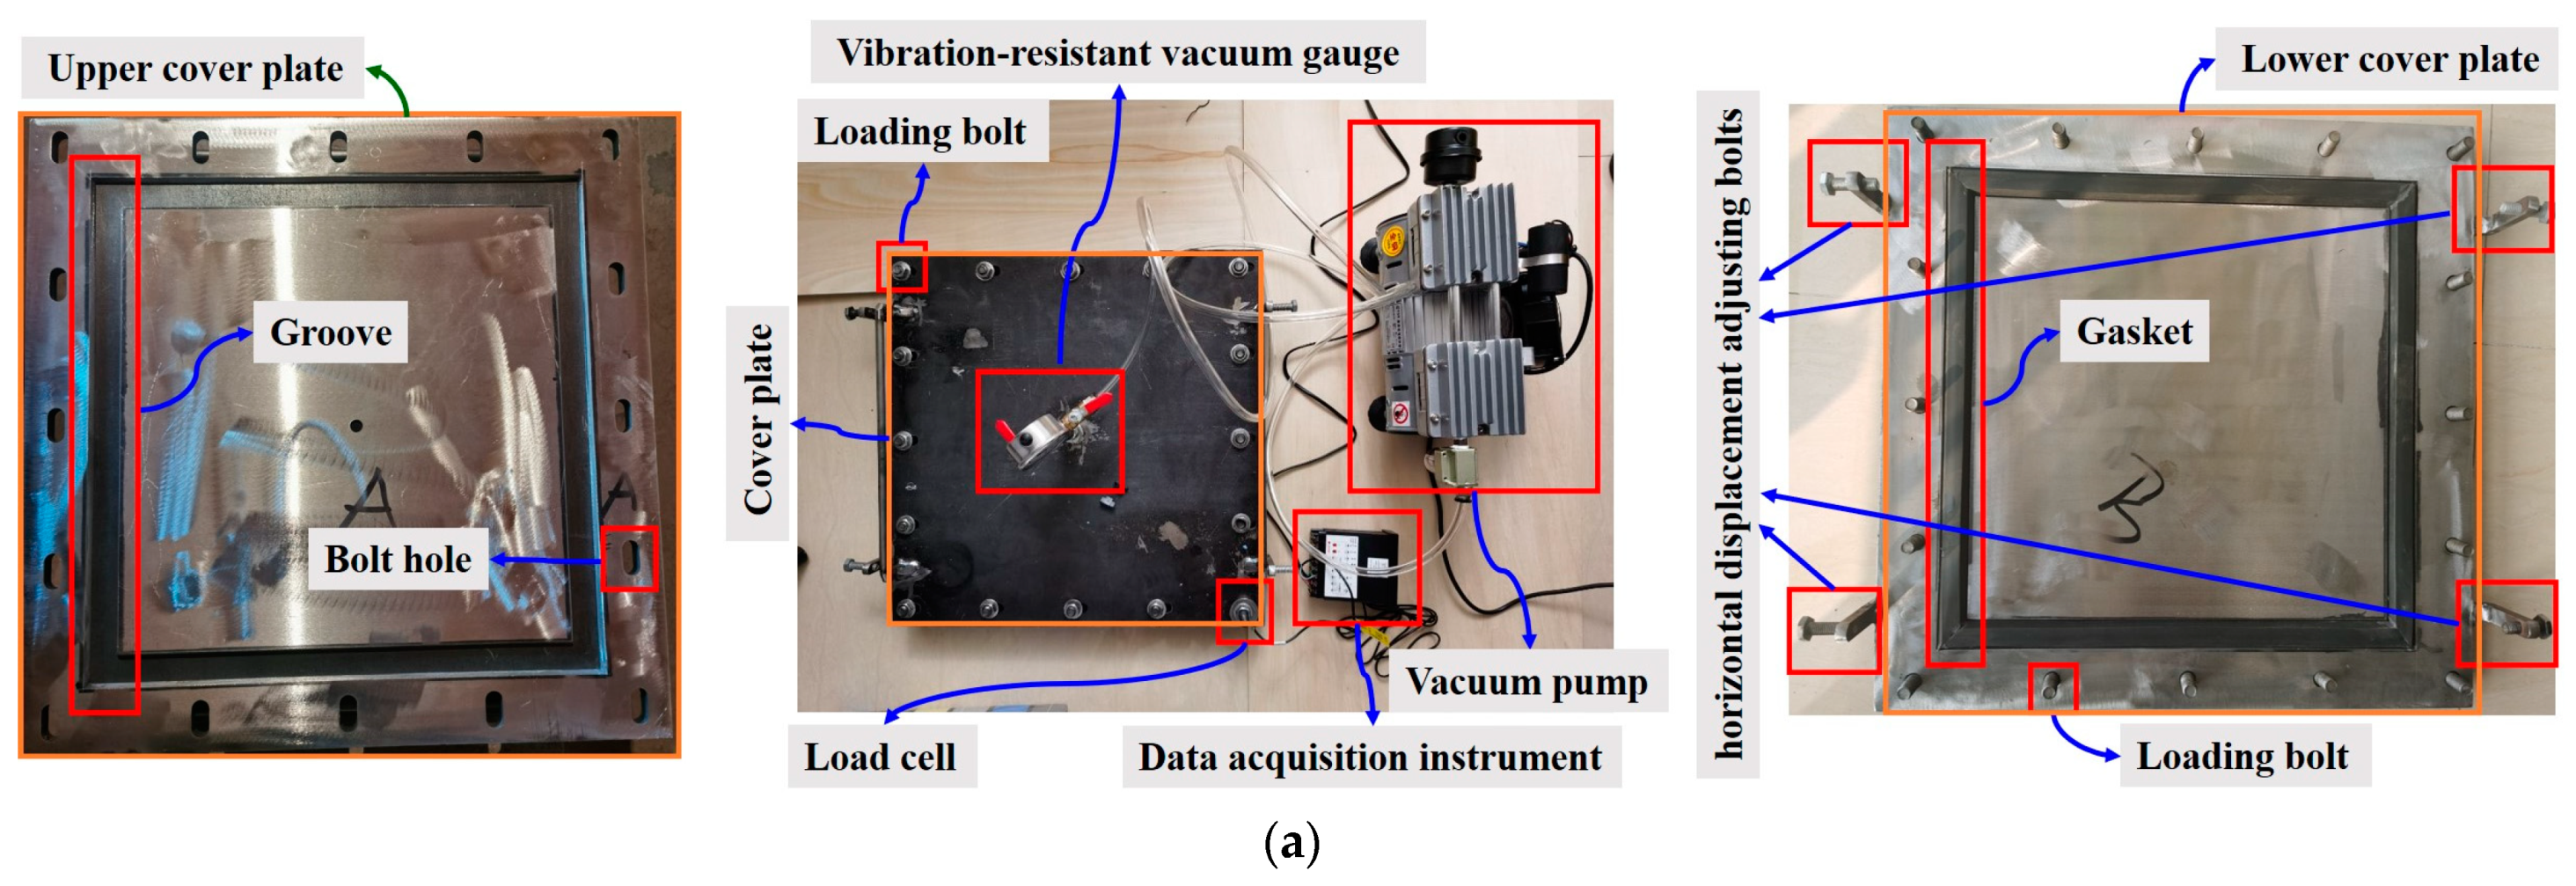
2.1. Test for Load-Deformation Behavior of the Gasket-in-Groove

An apparatus comprising a loading system and a gasket-in-groove mode is used to investigate the load-deformation behavior of the gasket-in-groove aiming to have an in-depth understanding of its nonlinear behavior. The loading system consists of a hydraulic universal testing machine that is capable of collecting real-time load-deformation data. The gasket-in-groove model consists of two gaskets and two gasket grooves, and their cross-section and dimensions are shown in Figure 1. The gaskets were made of Ethylene-Propylene-Diene Monomer (EPDM), and their engineering properties are listed in Table 1. During the test, a hydraulic universal testing machine was used to provide the load and thereby control the joint gap, and the horizontal displacement adjusting bolts were used to control the horizontal displacement of the upper and lower gaskets, i.e., the joint offset.

2.2. Test for Airtightness Sealing Performance of the Gasket-in-Groove

A new apparatus made of a steel frame was used to explore the airtightness sealing performance of the gasket-in-groove under a low-to-vacuum condition and thus to evaluate its sealing capacity with different initial contact pressures. As shown in Figure 2, the test apparatus mainly consists of the cover plates, gaskets, gasket grooves, vibration-resistant vacuum gauge, breaker valve, vacuum valve, connecting hose, vacuum pump, load bolts, load cell, data collector, vertical displacement adjustment nuts, and horizontal displacement adjustment bolts. The vacuum level in the inner chamber enclosed by the gaskets and the covers is provided by the vacuum pump through pumping and is measured by the vibration-resistant vacuum gauge. The magnitude of joint offset can be achieved by horizontal displacement adjusting bolts. Loading bolts are used to provide loads for the cover plate, the load is monitored by a load cell, and the initial joint gap is controlled by the applied load. The section and dimensions of the gasket-in-groove used to test the airtightness sealing performance are consistent with Figure 1b.
The sealing performance test procedures are summarized in Figure 3. In this study, the sealing performance of the circumferential joints with a 0 joint offset is tested and discussed.

3. Numerical Model Tests with FEA

The experimental model tests only provide a handful of discrete data due to the limitations of current testing techniques. For a more detailed and intuitive understanding of the mechanical behavior, sealing performance, and failure mechanism of the gasket-in-groove, further investigations are conducted using numerical model tests based on finite element analysis (FEA).
Currently, two thorny problems are being encountered in how to simulate fluid permeation across the gasket contact surface: (i) non-convergence due to mesh distortion caused by large deformations of the gasket, and (ii) the closure and opening of the contact surface in the process of fluid permeation. The numerical model recommended in this paper uses mesh adaptive techniques to overcome the problem of non-convergence and simulates the fluid permeation state at the gasket contact surface using fluid pressure penetration loading. The numerical simulation methods proposed in this paper may provide a convenience for engineers to analyze the sealing performance of the gasket-in-groove and the selection of gasket configurations at a lower level of engineering cost. The following is the build-up sequence of the numerical model.

3.1. Finite Element Analysis Model and Assumptions

The 2D finite element models were established using the ANSYS19.0 software to further analyze the mechanical and sealing performance of the gasket-in-groove in the circumferential joint. The dimensions of the gasket-in-groove in the finite element model were the same as those used in the model test (Figure 1). As shown in Figure 4, the gasket grooves in FEA were set up as rigid bodies, and the gaskets were discretized by utilizing three-node triangular plane elements. To address non-convergence problems caused by mesh distortions, nonlinear adaptivity for meshing was used in the simulations. More specifically, the grid is subdivided or redivided when the defined distortion criterion (the energy-based criterion used in this paper) is triggered in the solving process, thus avoiding grid distortion as much as possible and achieving the convergence of the solution.
The simulations consist of two steps. In step (i), the gasket is compressed by the rigid body (i.e., the gasket groove), resulting in initial contact pressure on the contact surface; in step (ⅱ), the vacuum pressure (i.e., fluid pressure penetration shown in Figure 4) is applied to one side of the gasket.
To simplify the numerical model and improve computational efficiency, the following assumptions were considered in the simulations:
  • Gasket sealing failure at the joint when the contact surfaces are completely separated from each other; i.e., air leakage occurs at the joint;
  • The gasket grooves are considered to be rigid; i.e., the deformation may be almost negligible, and they would be used as constraints on the gasket boundary;
  • The gaskets are considered to be isotropic and almost incompressible ideal elastic materials with a highly nonlinear stress–strain relationship, i.e., the hyper-elastic materials;
  • The gasket grooves and the gaskets are impermeable to air;
  • A plane strain condition is assumed.

3.2. Gasket Constitutive Model

The constitutive model of hyper-elastic material is usually defined by the strain energy density function. The two-coefficient Mooney–Rivlin model, assuming that the energy storage function per unit volume is a function of the first and second basic invariant of the right Cauchy–Green deformation tensor, is used to simulate the hyper-elastic property of the gaskets, and the corresponding function can be expressed as follows [24,25]:
W = C10(I1 − 3) + C01(I2 − 3)
where W is the strain energy density, and I1 and I2 are the first and second invariants, respectively. C10 and C01 are Mooney–Rivlin coefficients, which can be determined experimentally or by the shear modulus G and Young’s modulus E if no test data are available:
G = E/[2(1 + ν)] = 2(C01 + C10)
where ν is the Poisson’s ratio and taken as 0.5, and E can be estimated by Equation (3).
E = (15.75 + 2.15HA)/(100 − HA)
where HA is the Shore A hardness. According to Gent [26], the relationship between C10 and C01 is as follows:
C10 = 4 C01
Combining Equations (2)–(4), C10 and C01 can be determined, i.e., 0.592 MPa and 0.148 MPa.

3.3. Contact Pairs

The interactions between gasket–gasket contact pairs and gasket–gasket groove contact pairs are simulated by the frictional contact element in ANSYS, which can be either normal separation or tangential sliding. Gasket–gasket contact pairs can be treated as flexible–flexible contact pairs, in which either surface is defined as the target surface or the contact surface. Gasket–gasket groove contact pairs may be considered rigid-flexible contact pairs, where the gasket groove is defined as the target surface, whereas the gasket is defined as the contact surface.
In the ANSYS software, the contact element in the contact pairs only works when the contact surface and the target surface are in contact with each other, and therefore one requires to identify which surfaces may be in contact as the gasket deforms. As shown in Figure 5, trial calculations showed that the following 32 contact pairs can be observed in the gasket compression:
  • Gasket–gasket contact pairs: C1-C1, C2-C2, C3-C3, C4-C4, C5-C5, C6-C6, D1-D1, D2-D2, D3-D3, D4-D4, E1-E2, F2-F3, F6-F7;
  • Gasket–gasket groove contact pairs: A1-B1, A1-B2, A1-B3, A1-B4, A1-C1, A1-C2, A1-C3, A1-F1, A1-F2, A1-F5, A1-F6, A2-B5, A2-B6, A2-B7, A2-B8, A2-F3, A2-F4, A2-F7, A2-F8.
A2-B6 suggests that the face represented by A2 and the face represented by B6 may contact each other during the gasket deformation and similarly for the rest.
Generally, experimental measurements are used to calculate the friction coefficients (FC) of the gasket–gasket groove contact pairs. According to the results of laboratory experiments, Karger-Kocsis [27] suggested that the friction coefficient varies between 0.5 and 2.5 depending on different scenarios. In this study, the friction coefficient is uncertain since experimental data do not include it. To address it, numerous simulations were conducted with different friction coefficients to investigate the impact of the friction coefficient. Figure 6 shows that the simulation results with different friction coefficients were almost overlapped, especially in the first two stages, which indicates that the friction coefficient has a slight effect on the load–displacement behavior. Hence, the friction coefficient between the gasket and gasket groove in the finite element is adopted as 1.0 for the sake of simplicity since it will not impact the result significantly. As for the friction coefficient between the gaskets, it is adopted as 0.57 [19].

4. Comparison and Validation

Figure 7a depicts a comparison of the load–displacement relationships obtained from FEM with different mesh sizes and experimental results. The mesh element sizes are 0.2 mm, 0.3 mm, 0.4 mm, 0.5 mm, and 0.6 mm for FEM-1 to FEM-5, respectively. As can be seen from Figure 7a, the mesh element size has a slight effect on the FEM results, with smaller element sizes closer to the EXP results, i.e., FEM-5 matches up best with EXP. By comparing FEM-1 to FEM-5, it can be observed that the results of FEM-4 and FEM-5 overlap almost exactly, but the time consumed by the latter is about three times that of the former, and therefore, the FEM with a mesh element size of 0.4 mm, i.e., FEA-4, was used in the following investigations in terms of calculation time and computational accuracy.
Additionally, Figure 7a shows that the FEA-4 simulations are in good agreement overall with the experimental results, but deviations in magnitude are also observed within 10%. From the point of view of engineering applications, this level of deviation is acceptable. Hence, it is considered that the FEM proposed in this study is reasonable and capable of accurately simulating the nonlinear behavior of the gaskets. Deviations between the FEA and EXP results probably resulted from the plane strain condition assumed in the FEA, which is incompatible with the real conditions that no displacement constraints are imposed on the ends of the gaskets in experiments.
Figure 7b shows a comparison of the failure pressure (i.e., air-leakage pressure) pf from the experimental test and FEA results with different initial average contact pressure pi. It was found that the variation trend on pi-pf is consistent between the two methods; i.e., pf shows a decreasing trend with increasing pi, which further justifies the reliability of the FEA model of this paper. Moreover, it can also be observed that FEA results are slightly higher than the experimental test results, which implies that the FEA may overestimate the sealing capacity of the gasket-in-groove, which is possibly related to the microscopic rough morphology of the gasket surface. Microscopically, the gasket surface in the FEA is assumed to be completely flat (i.e., 0 roughness), whereas in experiments, the gasket surfaces are not smooth due to the manufacturing workmanship even “undulating”. The “undulating” surfaces of the gasket have the potential to result in a different distribution of the contact pressure from the smooth surfaces and thus affect the failure pressure.
To clarify, the above comparison between the numerical simulations and the experimental results was carried out in static conditions. A comparison of the results obtained from the two methods under cyclic loads or the effect of fatigue is unknown and needs further investigation, which is beyond the scope of this paper.

5. Mechanical Behaviors

As shown in Figure 8, the load–displacement relationship of the gasket-in-groove based on testing with no joint offset has a significant nonlinear behavior. The behavior can roughly be categorized into three stages according to the slopes of the curve:
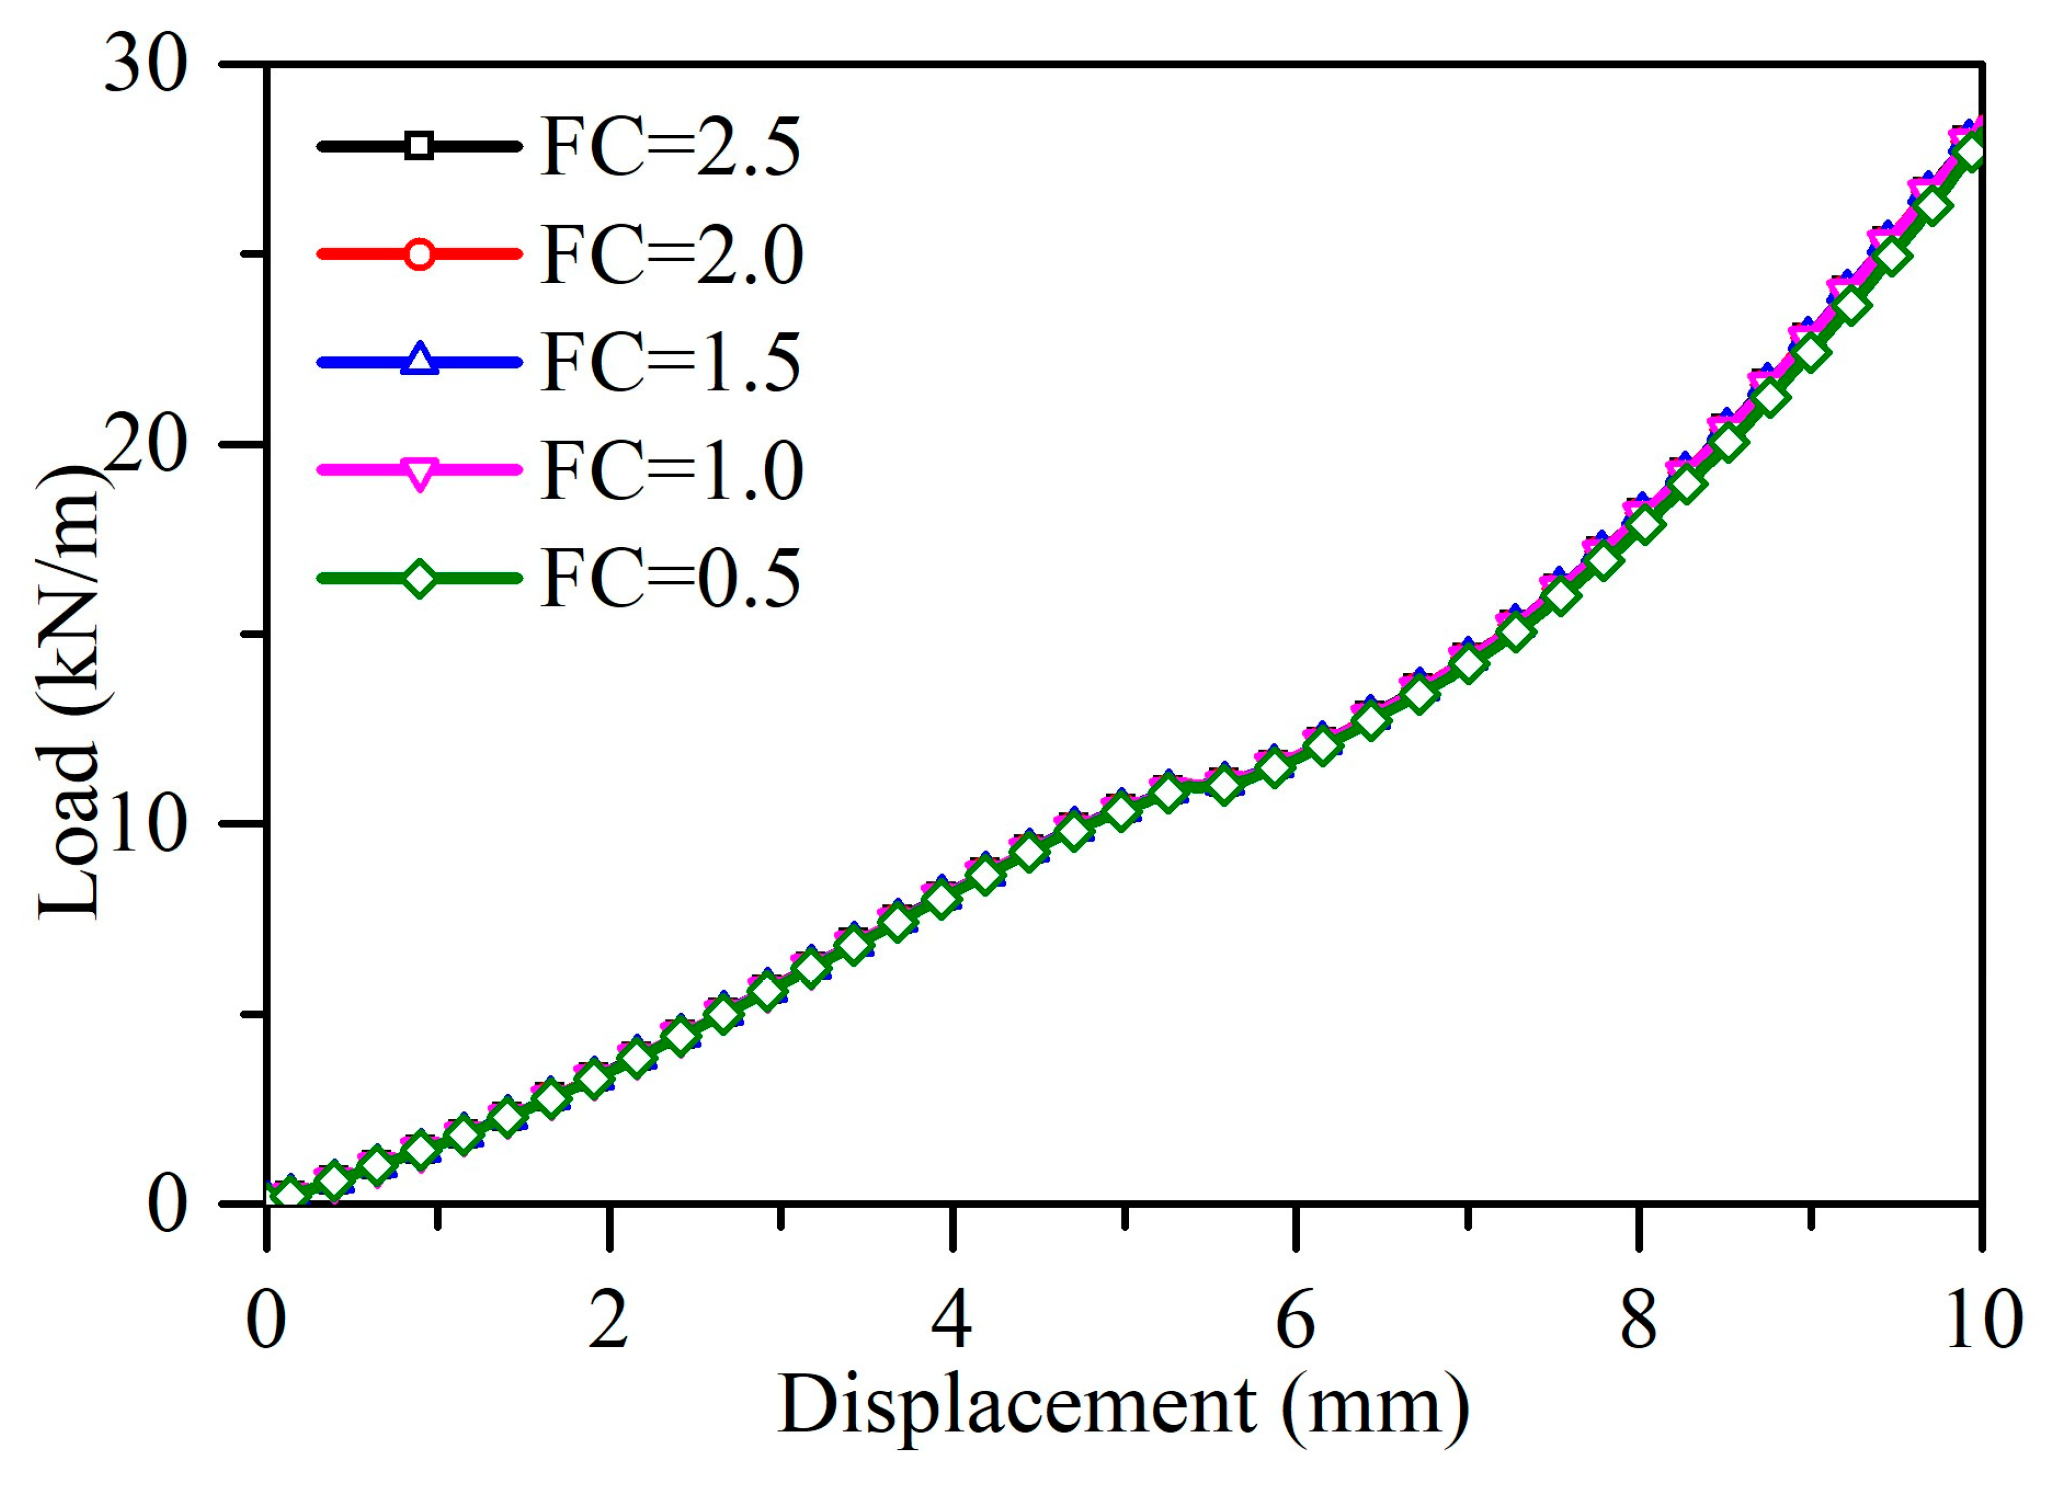
  • Stage Ⅰ: The gasket compression is in the range of 0 to 14.0% of the maximum compression (i.e., the maximum joint gap, equaling 10.0 mm). In this stage, the load has an approximately linear increasing trend with increasing displacement due to the gradual change of the closed inner holes in the gasket from circular to elliptical with the initial compression;
  • Stage Ⅱ: The gasket compression is in the range of 14.0 to 49.0% of the maximum compression. In this stage, the trend in stage I continues, but the slope of the cures decreases with increasing compression, which is primarily related to the fact that the gasket legs are gradually bent and start to enter a collapsed state;
  • Stage Ⅲ: The gasket compression is in the range of 49.0 to 100.0% of the maximum compression. In this stage, the load increases rapidly with increases in displacement. This phenomenon indicates that the gasket’s stiffness increases with the increase in load/displacement, which is consistent with that the groove provides more confining and enhances the gasket’s stiffness when the gasket fills and fits the groove under pressure.

6. Airtightness Sealing Performance and Failure Analysis

6.1. Air-Leakage Paths

Theoretically, there are three possible air-leakage paths when sealing failure occurs at the gasket-in-groove, i.e., the upper gasket–gasket groove contact surface, the gasket–gasket contact surface, and the lower gasket–gasket groove contact surface. The FEA results in this study show that the air-leakage paths for the circumferential joint all are on the gasket–gasket contact surface, as shown in Figure 9. Only one case with an initial maximum contact pressure pimax of 100.0 kPa is presented in Figure 9 due to the other cases having similar leakage paths. Previous studies have shown that fluid leakage occurs once the fluid pressure exceeds the maximum contact pressure of the contact surface [28,29,30]. Table 2 compares pimax on possible air-leakage paths for the gasket-in-groove with different joint gaps. Findings from the study of the data indicate that pimax at the gasket–gasket contact surface is the minimum in the three possible air-leakage paths for all cases, which reasonably explains that the gasket–gasket contact surface is the most vulnerable path for air-leakage when sealing failure occurs at the gasket-in-groove.

6.2. Contact Pressure Distribution

The contact pressure p distribution on the gasket–gasket contact surface was only discussed since FEM results show that the air-leakage path in this study occurred mostly on the gasket–gasket contact surface. Figure 10 shows the distribution of the initial contact pressure p0 along the gasket–gasket contact surface with different joint gaps (i.e., 9.873 mm, 9.647 mm, 9.423 mm, 9.205 mm, and 8.985 mm, corresponding to an initial maximum contact pressure pimax of 20.0, 40.0, 60.0, 80.0, and 100.0 kPa, respectively). Figure 10 indicates that p is symmetrically distributed in a “W” shape along the gasket centerline, and the contact pressure at both ends of the contact surface is significantly higher than that in other locations due to the presence of the inner holes in the gasket and the grooves between the gasket legs. The findings indicate that the contact surfaces at the ends of the gasket have the strongest sealing capacity due to stress concentration, and the contact stress in the ends determines the sealing capacity of the gasket-in-groove. Nevertheless, it is worth noting that the initial contact pressure has an increasing trend with a decreasing joint gap, which implies that the magnitude of initial contact pressure for the same gasket depends mainly on its compression.
Figure 11 shows the contact pressure p distribution on the gasket–gasket contact surface with different vacuum pressure pv (only one case with a pimax of 100.0 kPa is described since other cases have similar trends). It is observed that pv has a significant effect on p distribution, and the specific details are as follows:
  • As pv increases to 17.7 kPa, p distribution is still approximately in a “W” shape, but the variations are slight except for a remarkable decrease in the peak contact pressure on the outside (i.e., the region in the range of S = −7.0–0 mm) and a significant increase in the peak contact pressure on the inside (i.e., the region in the range of S = 0–7.0 mm);
  • As pv increases to 41.5 kPa, p distribution is no longer in a “W” shape, and the peak contact pressure on the outside decreases rapidly. However, it is still higher than pv. Noted that p in some areas of the outside (i.e., the region in the range of S = −5.5–0 mm) shows a significant increasing trend, while p on the inside changes little;
  • As pv increases to 60.2 kPa, the peak contact pressure on the outside drops below pv, but p in this range of S = −5.5–0 mm increases further. Note that p on the outside end decreases to 0, indicating that the sealing in this region begins to fail and the contact surface starts to be separate. However, it is found that the contact pressure variation on the inside remains relatively slight;
  • As the pv increases to 79.8 followed by 101.0 kPa, the contact surface separation gradually expands toward the inside, and accordingly, the contact length rapidly decreases and eventually reduces to 0, which means that the sealing fails and air leakage occurs.
The above analysis reveals that gasket sealing failure is a gradually developing process rather than a transient process from a macroscopical view. More specifically, the air-leakage failure is a gradual separation process of the contact surfaces until vacuum pressure exceeds the contact pressure at each location of the contact surface.

6.3. Separation Pressure and Failure Pressure

The foregoing analysis indicates that the contact pressure at the gasket–gasket contact surface varies with the vacuum pressure. It is understandable that when the vacuum pressure exceeds pimax on the contact surface, which does not mean that the gasket sealing has failed but rather that only sections of the contact surface may be separated. That is, the non-separated sections of the contact surface are still capable of providing sealing. Hence, the entire air-leakage process should be analyzed to determine the failure pressure. The separation pressure ps, defined as the fluid pressure corresponding to the beginning of contact surface separation, will be used in the following subsequent discussions.
Figure 12 illustrates the relationship of pimax versus ps and pf. It can be observed that pf and ps show an increasing trend with increasing pimax, which implies that a higher pimax would provide a better sealing effect. In all cases, ps/pimax is below 1.0, and pf/pimax is over 1.0, indicating the fact that the contact surfaces begin to separate as the vacuum pressure is lower than pimax, while the contact surface sealing begins to fail as the vacuum pressure is higher than pimax. This is due mainly to the redistribution of contact stresses on the contact surfaces induced by the gasket deformation caused by the vacuum pressure. On the one hand, the gasket deformation causes the outside contact pressure to decrease, and the contact surfaces start to separate, thereby reducing the contact length at the contact surface. On the other hand, the gasket deformation causes the inside contact pressure to increase, which means the sealing capacity is increased. Moreover, it is worth noting that a higher pimax would result in a lower ps/pimax and pf/pimax, of which the latter means that a higher pimax would lead to a lower safety factor (pf/pimax).

6.4. Sealing Failure Process

For one point on the contact surface, the contact pressure p during evacuation consists of the initial contact pressure p0 and the additional contact pressure pa induced by the vacuum pressure pv:
p = p0 + pa = p0 + νpv/(1 + ν)
where ν is the gasket Poisson’s ratio. As mentioned before, theoretically, the sealing fails once the contact pressure is lower than the vacuum pressure:
ppv
However, whether the gasket is in the initial state of pre-compression or the squeezed state of evacuation, there are differences in contact pressure at each point on the contact surface. Therefore, it is more reasonable to explain the seal failure on the contact surface using Equation (7).
pmaxpv
where pmax is the maximum contact pressure on the contact surface.
To illustrate the sealing failure process of the gasket-in-groove, Figure 13 plots the pmax path at the gasket–gasket contact surface with different pimax. Overall, the path may be divided into two phases. (ⅰ) Path OA1 (OA2, OA3, OA4, OA5) represents the gasket pre-compression phase before vacuum pressure loading, and pimax mainly depends on the gasket compression. (ⅱ) Path A1D1 (A2D2, A3D3, A4D4, A5D5) represents the vacuum pressure loading phase, in which pmax is determined by a combination of the vacuum pressure and the initial contact pressure. In this stage, as the vacuum pressure increases, pmax on the contact surface shows a tendency to first increase sharply (sub-stage 1), then decrease slowly (sub-stage 2), and then decrease dramatically (sub-stage 3). For sub-stage 1 (A1B1, A2B2, A3B3, A4B4, A5B5), the lateral squeezing of the gasket by the vacuum pressure results in a rapid increase in pmax near the inside contact surface with increasing vacuum pressure and exceeds pimax. For sub-stage 2 (B1C1, B2C2, B3C3, B4C4, B5C5), as the vacuum pressure increases further, pmax near the outside end of the contact surface falls slowly, while pmax near the inside end of the contact surface rarely varies. Overall, pmax exhibits a slow descending at the contact surface. Additionally, in this stage, it is observed that the outside contact surface begins to separate and expand inside gradually; i.e., the contact length of the contact surface gradually decreases. For sub-stage 3 (C1D1, C2D2, C3D3, C4D4, C5D5), the contact surface separation extends near its inside, and the increase in vacuum pressure results in a sharp decrease in pmax in this area. When pmax = 0, the gasket sealing fails.
The above analysis reveals that the sealing failure of the gasket-in-groove may also be considered a gradual variation process in pmax along the contact surface. Before the evacuation, the gasket is compressed by various external forces, which causes the initial contact pressure on the contact surface generated by the gasket rebound force. During the evacuation, the gasket deformation induced by vacuum pressure causes a redistribution of contact pressure on the contact surface, and pmax also changes accordingly; i.e., it shows a trend of increasing, then slowly decreasing, and then sharply decreasing. When pmax = 0, the sealing fails and air leakage occurs.

7. Conclusions

In this study, the mechanical behavior and sealing capacity of the gasket-in-groove were studied using experiments, and the numerical FEA model validated by the test results was used to further investigate thoroughly the sealing behavior and sealing failure mechanism of the gasket-in-groove. The following conclusions can be drawn:
  • The numerical model presented in this paper can model the fluid permeation state at the gasket contact surface and thus predict the airtightness of the gasket-in-groove. Furthermore, the numerical model can provide assistance to engineers in the analysis of gasket sealing performance and the optimization of gasket parameters at a lower time and cost.
  • The experimental and numerical study results show that the load–displacement curve of the gasket-in-groove has a significant nonlinear behavior, and it can be roughly categorized into three stages according to the maximum gasket compression.
  • The FEA results are in good agreement with the experimental results. This implies that the finite element model established in this paper captures the nonlinear behaviors of the gasket well, but the comparisons with experimental tests indicate it may overestimate the sealing capacity of the gasket-in-groove.
  • The FEA results show that the air leakage of the gasket-in-groove occurs on the gasket–gasket contact surface due to a lower maximum contact pressure compared to that on the gasket-groove contact surface.
  • The FEA results show that the initial contact pressure distribution on the gasket–gasket contact surface is symmetrically distributed in a “W” shape, with a layout of higher at the ends and lower in the middle, and a smaller joint gap would result in higher contact pressure.
  • The FEA results show that a higher pimax would provide a better sealing effect. The higher initial maximum contact pressure will lower the ratio of ps/pimax and pf/pimax, and the lower pf/pimax would lead to a lower factor of safety of the sealing for a given initial maximum contact pressure.
  • The FEA results show that the vacuum pressure significantly affects the contact pressure distribution on the contact surface. Specifically, it shows an overall decreasing trend with the increases in vacuum pressure, and the decreasing rate on the side close to the vacuum pressure is significantly higher than the one away from the vacuum pressure.
  • As the vacuum pressure increases, MCP tends to rise sharply, followed by a slow drop, and then decline dramatically to 0, which mechanistically provides a good illustration of the sealing failure process at the contact surface.

Author Contributions

Conceptualization, D.W. and L.S.; methodology, J.Z. and L.S.; software, L.S.; validation, L.S. and K.C.; formal analysis, J.Z. and L.S.; investigation, D.W. and L.S.; resources, L.S. and K.C.; data curation, K.C.; writing—original draft preparation, L.S.; writing—review and editing, D.W. and L.S.; visualization, J.Z. and L.S.; supervision, D.W.; project administration, D.W.; funding acquisition, D.W. and J.Z. All authors have read and agreed to the published version of the manuscript.

Funding

This work was supported by an open research project grant (# SKLST-2019-K04) from the State Key Laboratory of Shield Machine and Boring Technology.

Institutional Review Board Statement

Not applicable.

Informed Consent Statement

Not applicable.

Data Availability Statement

The data are available from the corresponding author on reasonable request.

Conflicts of Interest

The authors declare no conflict of interest.

References

  1. Zhou, J.J.; Shi, L.; Wang, D.Y. Internal Force Distribution and Influencing Factors for Segment Structure of Circular Low Vacuum Tunnel in Clay. China Railw. Sci. 2021, 42, 49–58. [Google Scholar] [CrossRef]
  2. Ding, W.Q.; Gong, C.J.; Mosalam, K.M.; Soga, K. Development and application of the integrated sealant test apparatus for sealing gaskets in tunnel segmental joints. Tunn. Undergr. Space Technol. 2017, 63, 54–68. [Google Scholar] [CrossRef]
  3. Lee, K.M.; Ge, X.W. The equivalence of a jointed shield-driven tunnel lining to a continuous ring structure. Can. Geotech. J. 2001, 38, 461–483. [Google Scholar] [CrossRef]
  4. Lee, K.M.; Hou, X.Y.; Ge, X.W.; Tang, Y. An analytical solution for a jointed shield-driven tunnel lining. Int. J. Numer. Anal. Model. 2001, 25, 365–390. [Google Scholar] [CrossRef]
  5. Vu, M.N.; Broere, W.; Bosch, J.W. Structural analysis for shallow tunnels in soft soils. Int. J. Geomech. 2017, 17, 04017038. [Google Scholar] [CrossRef]
  6. Cao, W. Reliability-based design of lining structures for underground space against water seepage. Undergr. Space 2020, 6, 290–299. [Google Scholar] [CrossRef]
  7. Chen, Y.F.; Hong, J.M.; Zheng, H.K.; Li, Y.; Hu, R.; Zhou, C.B. Evaluation of groundwater leakage into a drainage tunnel in Jinping-I arch dam foundation in southwestern China: A case study. Rock Mech. Rock Eng. 2015, 49, 961–979. [Google Scholar] [CrossRef]
  8. Huang, H.W.; Shao, H.; Zhang, D.M.; Wang, F. Deformational responses of operated shield tunnel to extreme surcharge: A case study. Struct. Infrastruct. Eng. 2016, 13, 345–360. [Google Scholar] [CrossRef]
  9. Wu, H.N.; Huang, R.Q.; Sun, W.J.; Shen, S.L.; Xu, Y.S.; Liu, Y.B.; Du, S.J. Leaking behaviour of shield tunnels under the Huangpu River of Shanghai with induced hazards. Nat. Hazards 2014, 70, 1115–1132. [Google Scholar] [CrossRef]
  10. Aneesh, R.; Andreas, R. Leakage and assembly of gasket in truck exhaust aftertreatment systems. Eng. Fail. Anal. 2021, 126, 105463. [Google Scholar] [CrossRef]
  11. Mahankar, P.S.; Dhoble, A.S. Review of hydraulic seal failures due to effect of medium to high temperature. Eng. Fail. Anal. 2021, 127, 105552. [Google Scholar] [CrossRef]
  12. Shen, S.L.; Wu, H.N.; Cui, Y.J.; Yin, Z.Y. Long-term settlement behaviour of metro tunnels in the soft deposits of Shanghai. Tunn. Undergr. Space Technol. 2014, 40, 309–323. [Google Scholar] [CrossRef]
  13. Zhu, C.W.; Wu, W.; Ying, H.W.; Gong, X.N.; Guo, P.P. Drainage-induced ground response in a twin-tunnel system through analytical prediction over the seepage field. Undergr. Space 2022, 7, 408–418. [Google Scholar] [CrossRef]
  14. Shalabi, F.I.; Cording, E.J.; Paul, S.L. Sealant behaviour of gasketed segmental tunnel lining-Conceptual model. Geomech. Tunn. 2016, 9, 345–355. [Google Scholar] [CrossRef]
  15. Shi, C.H.; Cao, C.Y.; Lei, M.F.; Yang, W.C. Sealant performance test and stress–seepage coupling model for tunnel segment joints. Arab. J. Sci. Eng. 2019, 44, 4201–4212. [Google Scholar] [CrossRef]
  16. Gong, C.J.; Ding, W.Q. A computational framework to predict the water-leakage pressure of segmental joints in underwater shield tunnels using an advanced finite element method. Int. J. Numer. Anal. Methods Geomech. 2018, 42, 1957–1975. [Google Scholar] [CrossRef]
  17. Gong, C.J.; Ding, W.Q.; Soga, K.; Mosalam, K.M.; Tuo, Y.F. Sealant behaviour of gasketed segmental joints in shield tunnels: An experimental and numerical study. Tunn. Undergr. Space Technol. 2018, 77, 127–141. [Google Scholar] [CrossRef]
  18. Gong, C.J.; Ding, W.Q.; Soga, K.; Mosalam, K.M. Failure mechanism of joint waterproofing in precast segmental tunnel linings. Tunn. Undergr. Space Technol. 2019, 84, 334–352. [Google Scholar] [CrossRef]
  19. Gong, C.J.; Ding, W.Q.; Dong, W.X. Parametric investigation on the sealant behaviour of tunnel segmental joints under water pressurization. Tunn. Undergr. Space Technol. 2019, 97, 103231. [Google Scholar] [CrossRef]
  20. Gong, C.J.; Ding, W.Q.; Mosalam, K.M. Performance-based design of joint waterproofing of segmental tunnel linings using hybrid computational/experimental procedures. Tunn. Undergr. Space Technol. 2020, 96, 103172. [Google Scholar] [CrossRef]
  21. Shalabi, F.I.; Cording, E.J.; Paul, S.L. Concrete segment tunnel lining sealant performance under earthquake loading. Tunn. Undergr. Space Technol. 2012, 31, 51–60. [Google Scholar] [CrossRef]
  22. Li, X.; Zhou, S.H.; Ding, H.G.; Wang, P.X. Evaluation and experimental study on the sealant behaviour of double gaskets for shield tunnel lining. Tunn. Undergr. Space Technol. 2018, 75, 81–89. [Google Scholar] [CrossRef]
  23. Ding, W.Q.; Wang, Q.S.; Qiao, Y.F.; Jin, Y.L. Experimental investigation on waterproofing performance of segmental joint with double gaskets for shield tunnel. Undergr. Space 2022, 7, 898–910. [Google Scholar] [CrossRef]
  24. Mooney, M.J. A theory of large elastic deformation. J. Appl. Phys. 1940, 11, 582–592. [Google Scholar] [CrossRef]
  25. Rivlin, R.S. Large elastic deformations of isotropic materials. IV. Further developments of the general theory. Philos. Trans. R. Soc. A Math. Phys. Eng. Sci. 1948, 241, 379–397. [Google Scholar] [CrossRef]
  26. Gent, A.N. Elasticity. In Engineering with Rubber: How to Design Rubber Components; Carl Hanser Verlag GmbH & Co. KG: Munich, Germany, 2012. [Google Scholar] [CrossRef]
  27. Karger-Kocsis, J.; Mousa, A.; Major, Z.; Bekesi, N. Dry friction and sliding wear of EPDM rubbers against steel as a function of carbon black content. Wear 2008, 264, 359–367. [Google Scholar] [CrossRef]
  28. Xin, L.; Gao, L.P.; Zhe, L. Prediction of seal wear with thermal-structural coupled finite element method. Finite Elem. Anal. Des. 2014, 83, 10–21. [Google Scholar] [CrossRef]
  29. Yang, X.L.; Yang, Z.G.; Qun, D. Failure analysis of O-ring gaskets of the electric hydraulic system in the nuclear power plant. Eng. Fail. Anal. 2017, 79, 232–244. [Google Scholar] [CrossRef]
  30. Zhou, C.L.; Zheng, J.Y.; Gu, C.H.; Zhao, Y.Z.; Liu, P.F. Sealing performance analysis of rubber O-ring in high-pressure gaseous hydrogen based on finite element method. Int. J. Hydrogen Energy 2017, 42, 11996–12004. [Google Scholar] [CrossRef]
Figure 1. Load-deformation behavior tests for the gasket-in-groove (unit: mm). (a) Testing devices (gasket compression of about 1mm); (b) diagrammatic sketch of the gasket-in-groove.
Applsci 13 07535 g001aApplsci 13 07535 g001b
Figure 2. Sealing capacity tests for the gasket-in-groove and components. (a) Testing devices; (b) diagrammatic sketch. Numeral designations: 1. upper cover plate; 2. lower cover plate; 3. upper gasket; 4. lower gasket; 5. upper groove; 6. lower groove; 7. vibration-resistant vacuum gauge; 8. broken vacuum valve; 9. vacuum valve; 10. rubber hose; 11. vacuum pump; 12. loading bolt; 13. load cell; 14. data acquisition instrument; 15. vertical displacement adjusting nut; 16. horizontal displacement adjusting bolt.
Applsci 13 07535 g002aApplsci 13 07535 g002b
Figure 3. Sealing performance test procedures.
Applsci 13 07535 g003
Figure 4. Schematic diagram of the 2D FEA models. (a) Compressing; (b) applying vacuum pressure.
Applsci 13 07535 g004
Figure 5. Possible contact pairs in the 2D FEA models.
Applsci 13 07535 g005
Figure 6. Comparison of load–displacement relationships of the gasket-in-groove with different friction coefficients.
Applsci 13 07535 g006
Figure 7. Comparison between FEA and experimental tests. (a) Load–displacement relationship; (b) failure pressure.
Applsci 13 07535 g007
Figure 8. The load–displacement relationship of the gasket-in-groove based on experiments.
Applsci 13 07535 g008
Figure 9. Air-leakage path.
Applsci 13 07535 g009
Figure 10. Initial contact pressure distribution along the gasket–gasket contact surface with different joint gaps. (S represents the distance from the symmetry axis of the gasket, negative values represent one side close to vacuum pressure, and positive values represent one side far from vacuum pressure).
Applsci 13 07535 g010
Figure 11. The contact pressure distribution along the gasket–gasket contact surface with different vacuum pressure.
Applsci 13 07535 g011
Figure 12. Relationship of initial maximum contact pressure versus separation pressure and failure pressure.
Applsci 13 07535 g012
Figure 13. The maximum contact pressure path at the gasket–gasket contact surface with different initial maximum contact pressure.
Applsci 13 07535 g013
Table 1. Engineering properties of the gaskets used in the tests.
ItemHardness
Shore A
Tensile Strength
(MPa)
Properties6710.9
Table 2. Comparison of initial maximum contact pressure for possible air-leakage paths of the gasket-in-groove (unit: kPa).
Possible Air-Leakage PathsJoint Gap (mm)
9.8739.6479.4239.2058.985
Gasket–Gasket surface20.040.060.080.0100.0
Gasket-Groove surface21.643.465.785.1112.3
Disclaimer/Publisher’s Note: The statements, opinions and data contained in all publications are solely those of the individual author(s) and contributor(s) and not of MDPI and/or the editor(s). MDPI and/or the editor(s) disclaim responsibility for any injury to people or property resulting from any ideas, methods, instructions or products referred to in the content.

