Article

Modeling and Performance Analysis of a Pump-Driven Chip-Level Two-Phase Cooling System in Data Centers

1
School of Aeronautical Science and Engineering, Beihang University, Beijing 100191, China
2
Aeronautic Institute of Xiangyang, Xiangyang 441000, China
3
Department of Building Science, School of Architecture, Tsinghua University, Beijing 100084, China
*
Author to whom correspondence should be addressed.
Appl. Sci. 2023, 13(13), 7472; https://doi.org/10.3390/app13137472
Submission received: 1 June 2023 / Revised: 20 June 2023 / Accepted: 22 June 2023 / Published: 24 June 2023
(This article belongs to the Special Issue Feature Papers in Section 'Applied Thermal Engineering')

Abstract

:

Featured Application

This study develops a model for a chip-level two-phase cooling system in data centers and employs simulation to investigate its operational characteristics and performance. These findings offer valuable insights for practical implementation.

Abstract

As a powerful solution for heat dissipation in data centers, chip-level cooling continues to capture escalating attention in research and application domains. To accurately analyze system performance, identify potential avenues for system optimization, and inform future practical applications, we developed a steady-state, one-dimensional mathematical model for a novel pump-driven chip-level two-phase cooling system (PCTCS). This model was constructed based on our previous study and was confirmed against existing experimental data. Our simulations scrutinized PCTCS performance under default conditions and investigated the effects of key parameters, such as refrigerant type, condenser vertical positioning, and cooling water temperature. Results showed that the system could manage an 80 W power output from each CPU while maintaining CPU temperatures around 79 °C at a cooling water temperature of 45 °C. We discovered the choice of refrigerant had a significant impact on performance, with R32 outperforming R134a and R113. While the vertical position of the condenser influenced the PCTCS’s internal parameters, its overall impact on system performance was negligible. Moreover, provided the chip temperature remained within a safe range, our study found that increasing the cooling water temperature improved the energy efficiency ratio of the refrigerant pump and reduced the temperature difference between the chips and the cold source.

1. Introduction

Over recent decades, the swift evolution of information technology (IT) has significantly revolutionized both conventional industries and burgeoning technological sectors. The growth and utilization of IT are inextricably linked to data centers, which serve as the underlying infrastructure supporting IT. Data centers have observed a dramatic surge in their number, scale, and notably, their energy consumption [1,2]. As of 2014, the electrical load generated by global data centers was approximately 194 TWh, accounting for nearly 1% of the worldwide final electricity demand. Predictions indicate that this consumption will double every five years [3,4]. Statistical data indicate that cooling systems constitute around 30–40% of a data center’s total energy usage [5,6]. Hence, curtailing the energy requirements of data center cooling systems has emerged as a crucial method to reduce their total energy consumption, thereby drawing significant attention from engineers and researchers.
Traditional data center cooling relied on computer room air-conditioning (CRAC) systems, which employ air as a direct heat transfer medium to dissipate heat [7,8]. While numerous researchers have introduced various methods to enhance the efficiency of CRAC systems, such as minimizing hot and cold air mixing, integrating novel evaporative condensers, and using magnetic levitation compressors [9,10], the heat transfer capabilities of air are inherently inferior to that of liquid [11,12]. Furthermore, a liquid cooling system can minimize the heat transfer pathway and lessen the temperature disparity between the hot and cold sources. This extends the effective use period of the natural cooling source, resulting in a considerable reduction in the energy demands of the cooling system [13]. Consequently, liquid cooling systems generally demonstrate higher efficiency when compared to CRAC systems [14]. Presently, CRAC systems primarily employ fans for chip cooling [15]. In a bid to augment cooling efficiency, researchers have suggested numerous liquid cooling methods for chips, including immersion liquid cooling, single-phase water cooling, spray liquid cooling, and two-phase cooling [16]. Among these solutions, using micro heat exchangers for two-phase heat transfer stands out. This method can serve as an effective thermal management strategy, offering a compelling alternative to air cooling solutions [17].
The two-phase flow boiling of the R134a refrigerant in a copper multi-microchannel heat sink, typically used for cooling microelectronic central processing units (CPUs), was scrutinized by Madhour et al. [18]. They manipulated the base heat flux in a range of 2.57 to 189 W/cm2 and the mass flux from 205 to 1000 kg/m2s, maintaining a nominal saturation temperature of 63 °C. They found that with a coolant flow rate of 1000 kg/m2s and no inlet subcooling, the heat transfer coefficient could achieve up to 2.7 × 10⁵ W/m2K (with respect to the base area), keeping the chip temperature at 85 °C and attaining a maximum pressure reduction of 94 kPa. Their investigations also indicated an increasing heat transfer coefficient with heat flux, showing no dependency on the mass flow rate. Marcinichen et al. [19,20] proposed two unique on-chip two-phase cooling systems, each powered by a liquid pump and a compressor, respectively. These systems were furnished with dedicated controllers for regulating outlet vapor quality, condensing pressure, and the temperature disparity between outlet water flow and the inlet working fluid flow in the condenser. Experimental results verified that the average temperatures of the pseudo-chips invariably stayed below 85 °C across all testing conditions. Additionally, a thorough performance analysis was conducted, considering factors such as cooling cycle efficiency, energy recovery, and system controllability. The results showed the systems’ extraordinary proficiency in energy utilization, heat recovery, and system management. Nonetheless, room exists for thermodynamic improvements, as the present setup recovers merely about 10% of the supplied exergy in the condenser. Xue et al. [21] introduced the fundamental energy conservation principle of year-round free cooling using a novel loop heat pipe (LHP) chip-level cooling technique. They devised an energy-saving theoretical model rooted in this method to evaluate energy utilization efficiency and energy-saving levels. Their research employed two types of computer servers, each equipped with water-cooling LHPs with a flat evaporator, functioning efficiently with an inlet water temperature of 40 °C and flow rate of 0.027 m3/h. The technique was then implemented in two industrial data centers. The operational data revealed that the energy savings in the cooling system and the overall data center exceeded 82% and 30%, respectively, compared to traditional CRAH cooling technique. These results were consistent with their theoretical model predictions. We also present research advancements in refrigerant pumps, a critical component of the pump flooding two-phase system. Mao et al. [22] proposed a flexible fluidic roller. This novel device employs a simple structure comprised of a pliable, twistable electrohydrodynamic pump combined with a layer of natural latex.
Beyond experimental methodologies, simulation-based studies have emerged as a powerful and efficient means of examining the factors that influence the performance and reliability of two-phase cooling systems. Several researchers have concentrated their efforts on simulation-based explorations.
Zhang et al. [23] proposed a comprehensive model for two-phase thermosyphon loops, employing the simultaneous conservation of momentum, energy, and mass. The findings illustrated that the model could satisfactorily simulate the loop’s behavior under minor temperature differences. Marcinichen et al. [24] proposed and simulated a chip-level two-phase cooling cycle, designed to dissipate heat generated by microprocessors and auxiliary electronics in blade servers. A simulation code was developed and employed to examine five scenarios, considering three different working fluids—HFC134a, HFO1234ze, and water (as utilized in a single-phase cooling cycle)—and variations in the internal diameters of the pipes. The analysis revealed that under conditions with a total pressure drop around 100 kPa, the water-cooling cycle demands an astonishing 16.5 times more pumping power than the two-phase HFC134a cooling cycle. Thome et al. [25] examined the use of passive two-phase thermosyphon technology for cooling data centers at the granularity of individual server racks in their experimental study. They compiled an extensive experimental database of 262 data points to validate the predictive accuracy of their simulation model concerning refrigerant mass flow rate, average chip temperature, and system pressure. Their results indicated a significant level of agreement between the experimental data and predicted values, with the pseudo mean chip temperature prediction demonstrating an approximate error margin of just 1 °C.
The previously mentioned studies suggest that the majority of research on chip-level two-phase cooling has primarily focused on designing effective porous-medium heat sinks [17,26]. Yet, there is a notable lack of studies focusing on a pump-driven chip-level two-phase cooling system (PCTCS). This system emerges as a promising methodology in the field of chip-level cooling systems, fulfilling the heat dissipation requirements of numerous servers. Furthermore, developing a mathematical model allows for convenient and efficient simulation of the thermodynamic system’s performance and characteristics. Through simulations and models, we can rapidly comprehend the influence of various variables on the system, providing powerful insights for future system configuration optimization and operational strategies. Noteworthily, no study to date in the extant literature has offered an integrative model capable of assessing the performance of the whole system.
In our previous research, we introduced a novel PCTCS and conducted an experimental investigation specifically designed for data center cooling [27]. The system’s schematic diagram is illustrated in Figure 1. In the present study, we established a one-dimensional, steady-state mathematical model for the PCTCS, validated scrupulously by comparing it with the outcomes of our past experimental investigation. To enhance our understanding of the PCTCS and provide guidance for its practical application and optimal configuration in the future, we conducted a comprehensive analysis of the PCTCS’s performance characteristics. This examination included simulations under standard configurations and explored the effects of altering key parameters, such as the refrigerant type, the condenser’s location, and the cooling water temperatures. Our findings deliver a detailed overview of the internal parameter distribution within the PCTCS, spanning aspects such as pressure, pressure drop, temperature, thermodynamic quality, void fraction, and heat transfer coefficient. Beyond this, we also introduced a temperature evaluation index and an energy efficiency evaluation index. Utilizing these two indices, we analyzed the system’s performance under varied conditions and propose recommendations for the operational strategy and system configuration.

2. Modeling

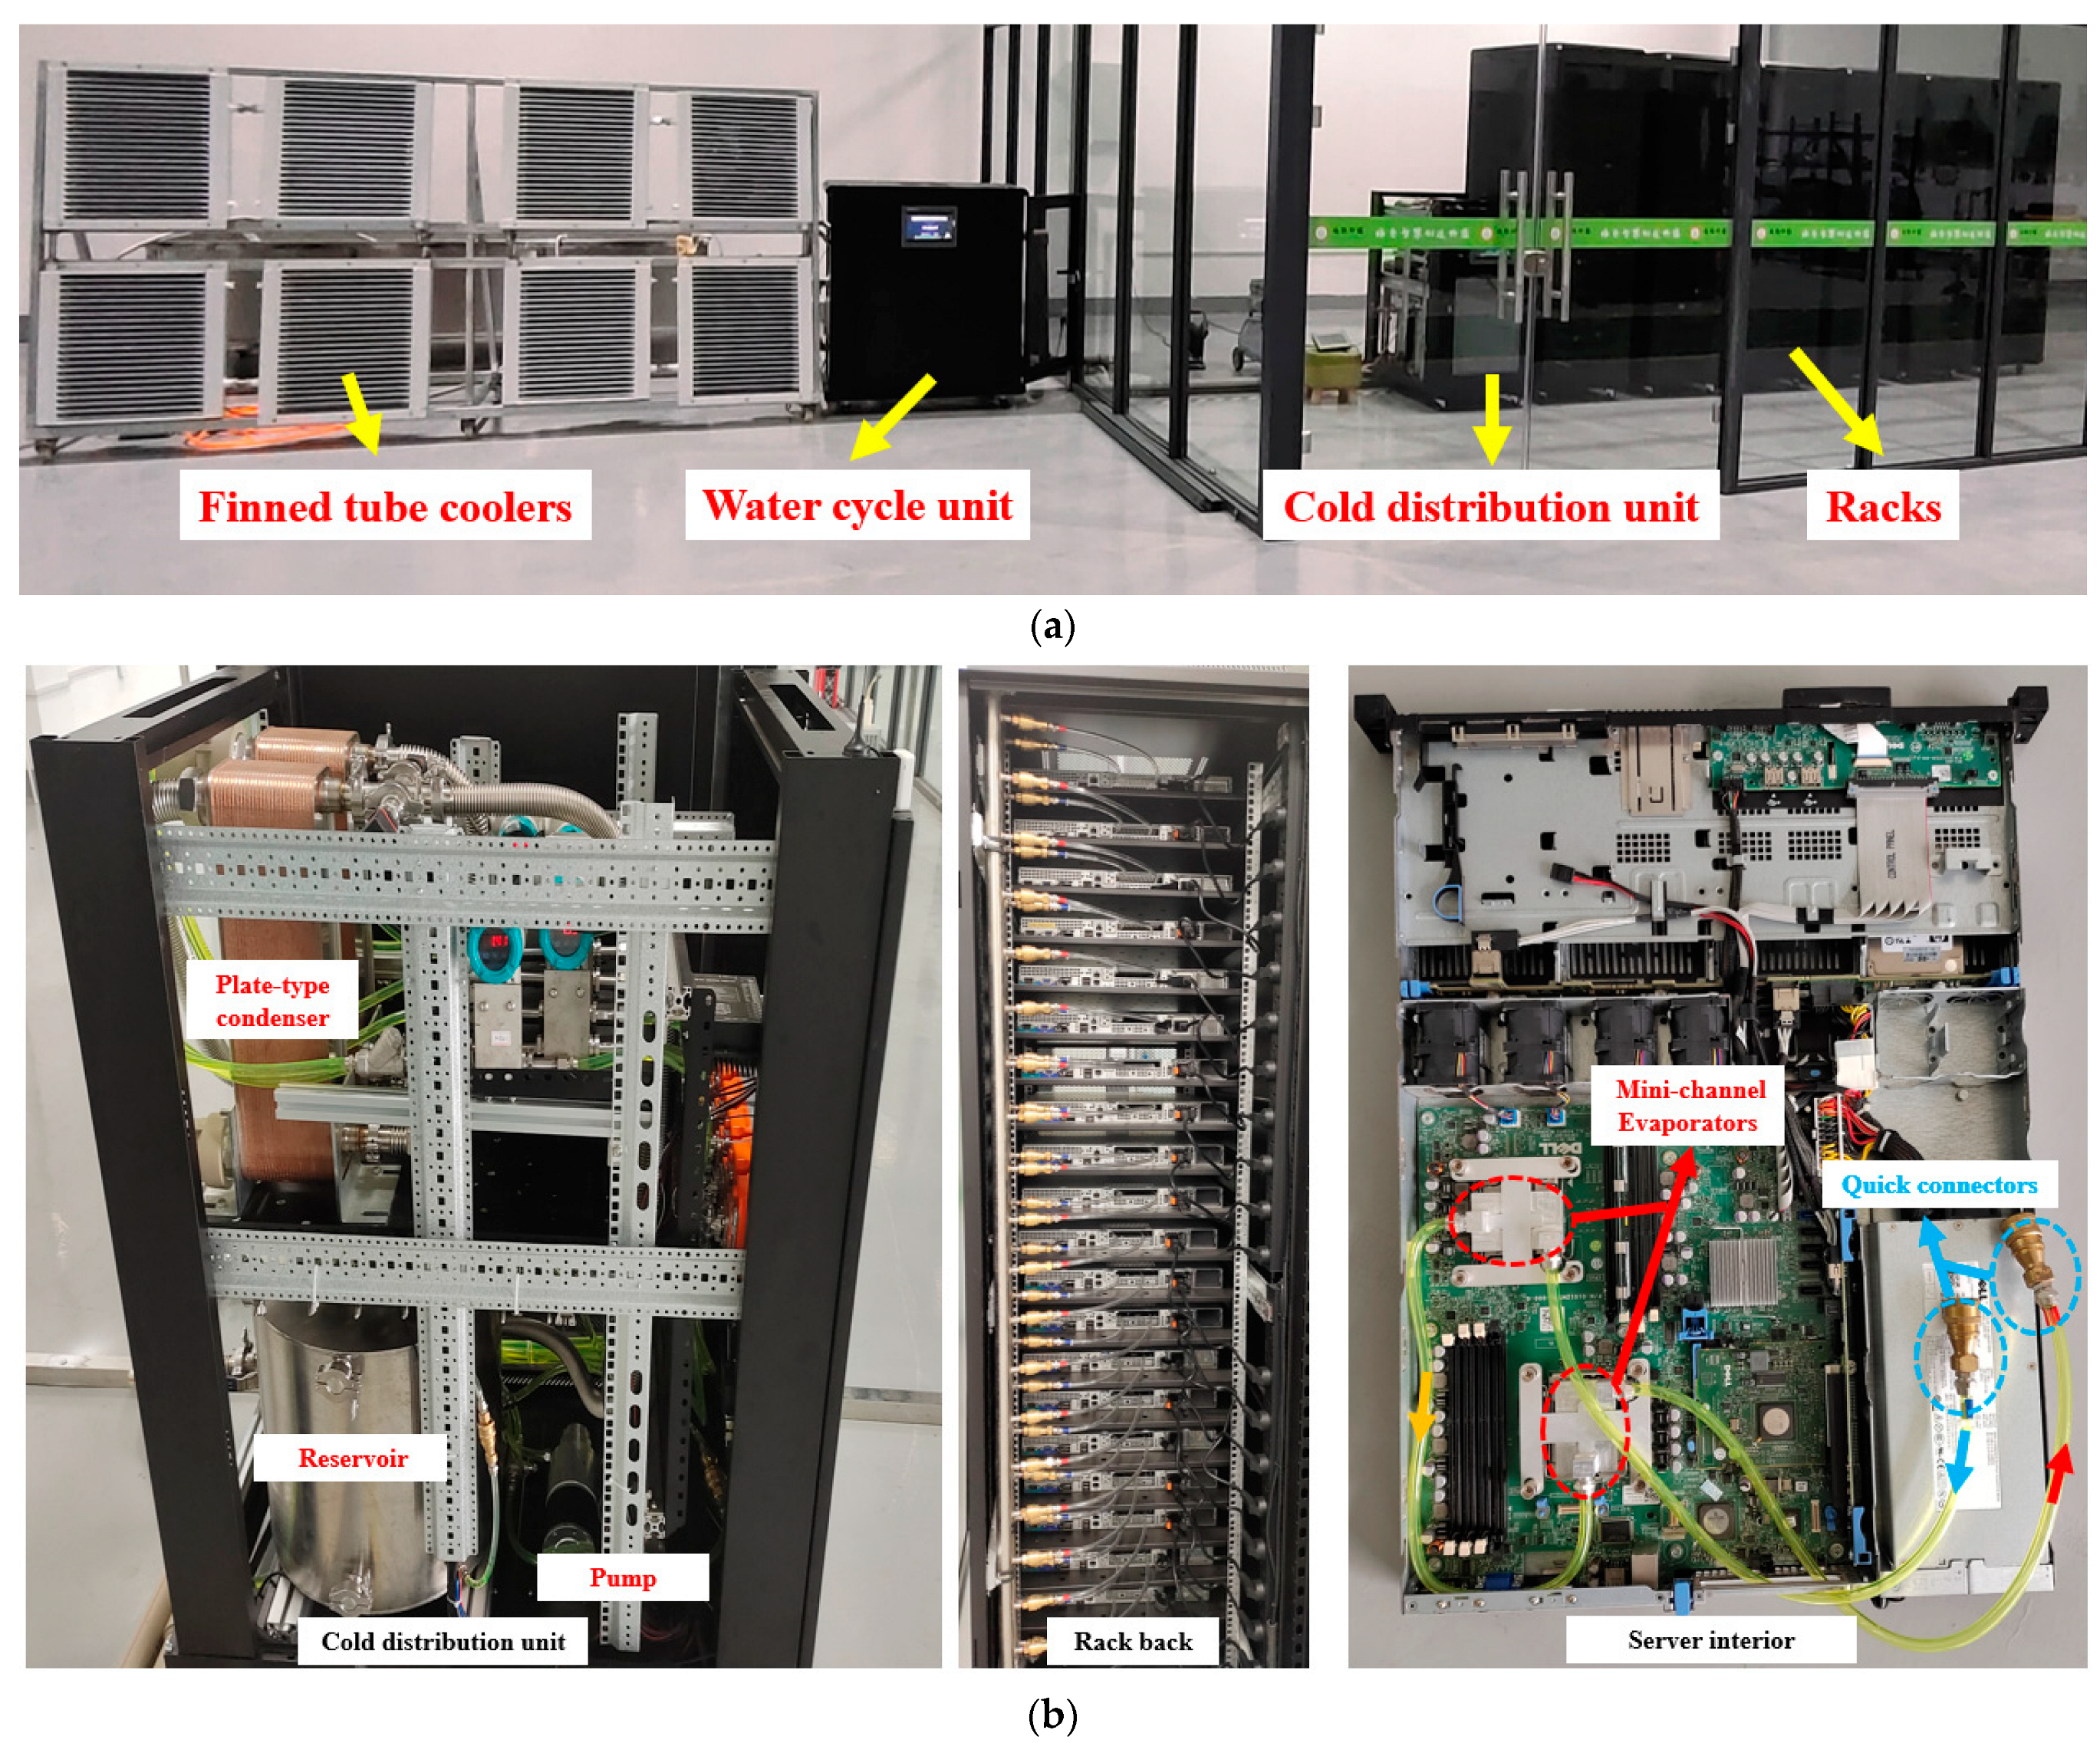
2.1. Introduction of the PCTCS and Assumptions

Figure 1 illustrates the schematic diagram of the PCTCS in our previous study, which consists of components such as a refrigerant pump, mini-channel evaporators, a plate-type condenser, a reservoir, and connecting pipes, along with additional elements such as joints, sensors, and valves. The PCTCS was used to cool 40 CPUs, evenly distributed across 20 servers within a 42U rack. For mathematical modeling convenience, we present a streamlined version of the PCTCS as depicted in Figure 2. This version, while maintaining the system’s fundamental features, is based on certain assumptions and omits some components, such as valves, joints, bends, and sensors, as shown in Figure 1. The influence of these excluded components on the PCTCS is expressed as local pressure drops. These effects are simulated by adjusting the diameter and length of the interconnecting pipes to reflect the resulting alterations in pressure. Figure 3 presents the pressure–enthalpy (P–h) diagram of the system. The modeled PCTCS includes 20 pairs of mini-channel evaporators arranged in series. However, for the sake of simplicity, only one pair is simulated. Figure 2 and Figure 3 utilize numbers 1~8 to identify various positions within the PCTCS system. To provide clarity, their meanings are as follows:
Number 1: Reservoir and the pump inlet;
Number 2: Pump outlet;
Number 3: Inlet of the first evaporator;
Number 4: Outlet of the first evaporator;
Number 5: Inlet of the second evaporator;
Number 6: Outlet of the second evaporator;
Number 7: Inlet of the condenser;
Number 8: Outlet of the condenser.
According to Figure 2, we constructed mathematical models, including a refrigeration pump model (1-2), mini-channel evaporator model (3-4, 5-6), plate condenser model (7-8), and connecting pipe model (2-3, 4-5, 6-7, 8-1). Based on the analysis conducted above, we developed a steady-state distributed-parameter model for the PCTCS, incorporating the following assumptions and explanations:
  • The system’s fluid flow and heat transfer are presumed to be steady-state;
  • The reservoir’s volume is sizable and not fully liquid-filled. Due to its proximity to the pump, variations in the refrigerant state between the reservoir inlet and pump inlet are negligible;
  • All components of the PCTCS, excluding the evaporator and condenser, are assumed to be adiabatic;
  • Power disparities among servers, along with any variations in the refrigerant flow and state upon server entry, are ignored. Consequently, the heat transfer and pressure drop across each server are identical, and the refrigerant state on exiting each server is assumed to be uniform;
  • The fluid is assumed to be in thermodynamic equilibrium;
  • Parameters are averaged across sections, and a one-dimensional model is applied.
Figure 2. Schematic diagram of the simplified PCTCS.
Applsci 13 07472 g002
Figure 3. Pressure-enthalpy (P–h) diagram of the simplified PCTCS.
Applsci 13 07472 g003

2.2. Mathematical Models and Correlations

Precise correlations of momentum and heat transfer are crucial in modeling the PCTCS due to their significant influence on simulation accuracy. Within various sections of the PCTCS, the refrigerant can exist in a single-phase or a two-phase state. For analysis purposes, we define the thermodynamic quality, denoted by x, as a criterion to discern the flow state, as expressed in Equation (1):
x = h h l h g h l
In this equation, h symbolizes the enthalpy of the refrigerant, while hg and hl represent the enthalpies of the refrigerant in the saturated gas and liquid phases, respectively. When the refrigerant is in a two-phase state, the thermodynamic quality x ranges from 0 to 1, whereas in a purely liquid phase, x equals or is less than 0.
The total pressure drop across each section of the PCTCS (Pdt) is computed as the sum of the frictional pressure drop (Pdf), gravitational pressure drop (Pdg), and accelerational pressure drop (Pda), as shown in Equation (2):
P d t = P d f + P d g + P d a
The accelerational pressure drop stems from velocity changes due to alterations in vapor quality and void fraction. Therefore, for refrigerants devoid of phase change, Pda can be disregarded. In the following sections, we present detailed descriptions of the mathematical models of each component, along with the associated equations.

2.2.1. Connecting Pipe Model

The connecting pipe is heat insulated. Consequently, the models solely consider Pdt, and its influence on x is negligible, thereby dismissing Pda.
  • Pressure drop for single-phase flow
  • Frictional pressure drop (Pdfsp)
The Darcy–Weisbach equation is commonly used for determining the frictional pressure drop (Pdf) for single-phase, incompressible fluids, as depicted in Equation (3) [28]:
Pdf sp =   10 3 · f · L   ·   ρ   ·   v 2 2   ·   D
In this equation, L denotes the length of the connecting pipe, ρ represents the density of the single-phase refrigerant, v signifies the refrigerant’s flow velocity, D is the hydraulic diameter, and f is the friction factor. This factor is theoretically calculated for a circular tube and is defined in Equation (4) [29]:
f = 64 Re                                         : L a m i n a r   f l o w         ( R e < 2000 ) f = 0.316 · Re 0.25         : T u r b u l e n t   f l o w       ( R e 2000 )
The Reynolds number, denoted by Re, is significant in these computations and is obtained via Equation (5):
R e = ρ · v · D μ
Here, μ denotes the dynamic viscosity of the refrigerant.
2.
Gravitational pressure drop (Pdgsp)
The gravitational pressure gradient is specified by Equation (6):
Pdg sp = ρ · g · H
In this equation, g stands for the acceleration due to gravity, and H is the vertical height of the connecting pipe.
  • Pressure drop for two-phase flow
  • Frictional pressure drop (Pdfsp)
The calculation of the frictional pressure drop in a two-phase flow within the connecting pipe utilizes the associative model proposed by Müller-Steinhagen and Heck [30], as recommended by Tahery [31] and Ribatski [32]. This model is encapsulated in Equation (7):
  Pdf tp = F · 1 x 1 3   + Pdf g   · x 3 F = Pdf l   + 2 · Pdf g   Pdf l · x
Pdfl and Pdfg denote the pressure drops computed by Equations (3)–(5) when the refrigerant is entirely in the liquid phase and entirely in the gas phase, respectively.
  • Gravitational pressure drop
The calculation of gravitational pressure drop in a two-phase region is depicted in Equation (8), which structurally parallels Equation (6):
Pdg tp = ρ tp · g · H
Here, ρtp represents the density of the two-phase mixture, which depends on the vapor fraction α, computed as per Equation (9):
ρ tp = α · ρ g + ( 1 α ) · ρ l
The Smith model [33] is utilized to determine the void fraction α in two-phase flow, as outlined in Equation (10):
A = 1 + F · 1 x x · ρ g ρ l 1 F = 0.4 + 0.6 · ρ l ρ g + 0.4 · 1 x x 1 + 0.4 · 1 x x

2.2.2. Mini-Channel Evaporator Model

Figure 4 displays both the external photograph and internal structure diagram of the mini-channel evaporator utilized in this study.
The mini-channel evaporator is a pivotal component in the PCTCS. Its internal channel is designed as a straight channel. Fabrication of the evaporator was accomplished using a blend of precision machining techniques. The process was initiated by independently processing the base and cover plates. The base plate underwent a milling procedure, during which mini channels with a width of 1 mm were carefully carved. Following this, both elements were integrated through vacuum brazing, forming the finished structure of the evaporator. After the machining process, we introduced a surface finishing phase aimed at reducing any surface roughness that might have been introduced during the previous stages.
  • Pressure drop for single-phase and two-phase flow
In conventional data center arrangements, servers are typically situated horizontally within their racks, which subsequently dictates the horizontal orientation of the CPUs housed within these servers. Correspondingly, the mini-channel evaporator within these servers also maintains a horizontal orientation. However, it is noteworthy that real-world installation procedures could yield slight deviations in tilt. These deviations, although existent, are typically negligible. Therefore, in the modeling, we disregard their potential influence, presuming the evaporator’s channels to be horizontally aligned. Given this horizontal alignment of the mini-channel evaporator’s flow channels and the fact they undergo phase change, we have chosen to disregard the gravitational pressure drop. However, the accelerated pressure drop is considered. The frictional pressure drop for single-phase and two-phase flow in the mini-channel evaporator is calculated utilizing Equations (3)–(5) and (7), while the accelerational pressure drop is determined using Equation (11):
Pda = G 2 · x 2 α · ρ g + 1 x 2 1 α · ρ l out x 2 α · ρ g + 1 x 2 1 α · ρ l in
In the equation, G symbolizes the mass flux of the refrigerant, and the calculation of α is derived from Equation (10).
  • Heat transfer model
The CPU’s surface and the mini-channel evaporator’s bottom surface were tightly affixed and coated with thermally conductive silicone grease, facilitating the heat transfer from the CPU to the refrigerant in the evaporator. Specifically, we utilized DOWSIL TC-5026 thermal grease, a product of DOW, to ensure efficient thermal conduction. The boundary condition for heat transfer is treated as a constant heat flux.
The heat transfer process is computed using Equation (12):
Q eva = T ¯ r T cpu 1 h α eva · A tol + t co A wall · λ co + t g A wall · λ g
where T ¯ is the arithmetic mean temperature of the refrigerant, Tcpu is the CPU temperature, tco is the bottom plate’s thickness, tg is the thermal grease’s thickness, λco is the bottom plate’s thermal conductivity, λg is the thermal conductivity of the thermal grease, Atol is the effective heat transfer area, and Awall is the area of the evaporator’s bottom surface.
The heat transfer process of the refrigerant within the mini-channel evaporators includes single-phase convection, subcooled flow boiling, and saturated flow boiling.
  • Single-phase convection
Single-phase convection in the mini-channel evaporator is detailed in Equation (13). For the heat transfer correlation of the refrigerant in the single-phase region, the Shah and London model [34] is used in the case of laminar flow. For the turbulent heat transfer correlation of the refrigerant in the two-phase region, the Gnielinski model [35], as suggested by Subramanian [36], is employed.
    h α sp = Nu sp · λ D     Nu sp = 3.6 + 0.44 · Ew Eh 1 + 0.56 · Ew Eh 1 3             : L a m i n a r f l o w   Nu sp = f 2 · ( Re     1000 ) · Pr 1 + 12.7 · Pr 2 3 1 · f 2                 : T u r b u l e n t f l o w
Here, Ew and Eh denote the width and height of the channel, respectively, while λ symbolizes the thermal conductivity of the refrigerant. Furthermore, Pr refers to the Prandtl number.
2.
Saturated flow boiling correlation
The correlation for saturated flow boiling in the mini-channel evaporator is delineated by Equation (14), proposed by Kandlikar [37]:
h α tp = l a r g e   r o f h α tp , nbd h α tp , cbd                                                                                                     Re l > 3000 A   l i n e a r   i n t e r p o l a t i o n   b e t w e e n   Re l   o f   1600   a n d   3000       1600 Re l 3000 h α tp = h α tp , nbd                                                                                                                                           Re l < 1600 h α tp , nbd = 0.6683 · Co 0.2 · 1 x 0.8 · h α l + 1058.0 · Bo 0.7 · 1 x 0.8 · F fl · h α l   h α tp , cbd = 1.136 · Co 0.9 · 1 x 0.8 · h α l + 667.2 · Bo 0.7 · 1 x 0.8 · F fl · h α l   B o = q G · h g h l C o = ρ g ρ l 0.5 · 1 x x 0.8
The calculations of Rel and hαl rely on Equations (5) and (13), respectively, considering the refrigerant in its pure liquid phase. Here, q represents the heat flux, Ffl denotes the fluid-surface parameter, as established by Kandlikar’s studies [38,39].
3.
Subcooling flow boiling correlation
The subcooling flow boiling model, along with the corresponding correlation, builds upon Kandlikar’s research [40,41]. Kandlikar divided subcooling flow boiling into distinct regions: partial boiling, fully developed boiling, and significant void flow regions. Effective modeling of these regions requires careful consideration of the onset points and distinct heat transfer characteristics of each region.
The inception of partial boiling, also known as the onset of nucleate boiling (ONB), signifies the threshold heat flux or the wall superheat at which surface nucleation sites become active, initiating vapor bubble generation. The wall superheat of ONB (dTsat,onb) and heat flux of ONB (qonb) are calculated by Equation (15):
dT sat , onb = 4   ·   σ   ·   T sat   ·   Sv g   Sv l   ·   h α l λ l   ·   h g h l · 1 + 1 + λ l   ·   h g   h l   ·   dT sub 2   ·   σ   ·   T sat   ·   Sv g     Sv l   ·   h α l q onb = λ l · h g h l 8   · σ · T sat · Sv g Sv l · dT sat , onb 2
Following the ONB is the partial boiling region. In this region, heat transfer is a blend of single-phase convective and nucleate boiling modes. As liquid subcooling decreases, the nucleation activity intensifies along the flow. At a distinct point, the nucleate boiling mode assumes the role of the primary heat transfer mode, with a smaller contribution from the single-phase convective mode. This transition signifies the start of fully developed boiling. Equation (16) determines the heat flux at this juncture (qE):
1058 · F fl · Mf · h g h l 0.7 · q F q F 0.3 = 1058 · h α l · F fl · Mf · h g h l 0.7 · dT sub q E = 1.4 · q F
As the degree of supercooling continues to decrease, growing visible bubbles begin to appear in the fluid. The point of net vapor generation denotes the location in the subcooled flow where the net void fraction begins to increase substantially. Saha and Zuber’s correlations [42] are employed to locate the thermodynamic quality (xnvg) at the start of significant void flow regions, calculated using Equation (17):
x nvg = 0.0022 · B o · Re l · Pr l               ( Re l · Pr l < 70 , 000 )   x nvg = 154 · B o                                                       ( Re l · Pr l > 70 , 000 )
The heat transfer rates in the partial boiling and fully developed boiling regions can be solved by Equations (18) and (19), respectively:
h α pb = q pb T wall T q pb = a + b · T wall   T sat m a = q onb b ·   ( dT sat , onb ) m b = q E q onb ( dT sat , E ) m dT sat , onb m m = n + p · q pb n = 1 p · q onb p = 1 0.3 1 q E   q onb
h α fdb = 1058 · Bo 0.7 · F fl · h α l · T wall T sat T wall T
The heat transfer rate calculations in the significant void flow regions utilize the same equation (Equation (13)) as in saturated flow boiling, substituting the apparent quality xα for x in Equation (14). The apparent quality xα is calculated using Equation (20):
x α = x x nvg exp x x nvg 1 1 x nvg exp x x nvg 1

2.2.3. Plate-Type Condenser Model

The fluid on both sides of the plate-type condenser exhibits a countercurrent, single-pass flow.
  • Pressure drop for single-phase and two-phase refrigerant flow
Considering the vertical alignment of the flow channels in the plate-type condenser and the phase change process experienced by the refrigerant, both gravitational and accelerated pressure drops should be accounted for. The frictional pressure drops, both for single-phase and two-phase, in the plate-type condenser are calculated using Equations (3)–(5) and (7), whereas the acceleration and gravitational pressure drops are derived from Equations (6) and (8)–(11).
  • Heat transfer model
The heat transfer process within the plate-type condenser is calculated using Equation (21):
Q con = T ¯ r T ¯ w 1 h α w · A tol + t s A tol · λ s + 1 h α r · A tol
Where T ¯ represents the average temperature of the refrigerant, T ¯ w is the average temperature of the cooling water, ts denotes the thickness of the plate, λs signifies the plate’s thermal conductivity, and Atol refers to the effective heat transfer area. Additionally, hαw and hα denote the heat transfer efficiencies of the cooling water and the refrigerant, respectively.
The heat transfer coefficients are calculated for both the single-phase water and the single-phase refrigerant using Equation (13). The Longo model [43], recommended by Aute et al. [44], is adopted for the condensation correlation of the refrigerant in the plate-type condenser, as detailed in Equation (22):
h α = 0.943 · φ · λ l 3 · ρ l 2 · g · h g h l μ l · L · T sat T wall                                                   Re eq < 1600 h α = h α sat + T T sat T sat T wall · h l + Cp · q h g h l                                 Re eq 1600 h α sat = 1.875 · φ · λ l D · Re eq 0.445 · Pr l 1 3 h α l = 0.2267 · λ g D · Re g 0.631 · Pr g 1 3 Re eq = G eq · D μ l G eq = G · 1 x + x · ρ l ρ g 1 2
Here, φ denotes the enlargement factor, while Reeq and Geq represent the equivalent Reynolds number and equivalent mass flow rate, respectively.

2.2.4. Pump Model

Ideally, the process involving liquid refrigerant in the pump is an adiabatic and isentropic compression process. However, factoring in the efficiency loss of the pump, its power is calculated using Equation (23):
Ppump = Mf · h 2 h 1 η
Here, h2 and h1 denote the enthalpy of the refrigerant at the pump inlet and outlet, respectively, and η represents the pump efficiency.

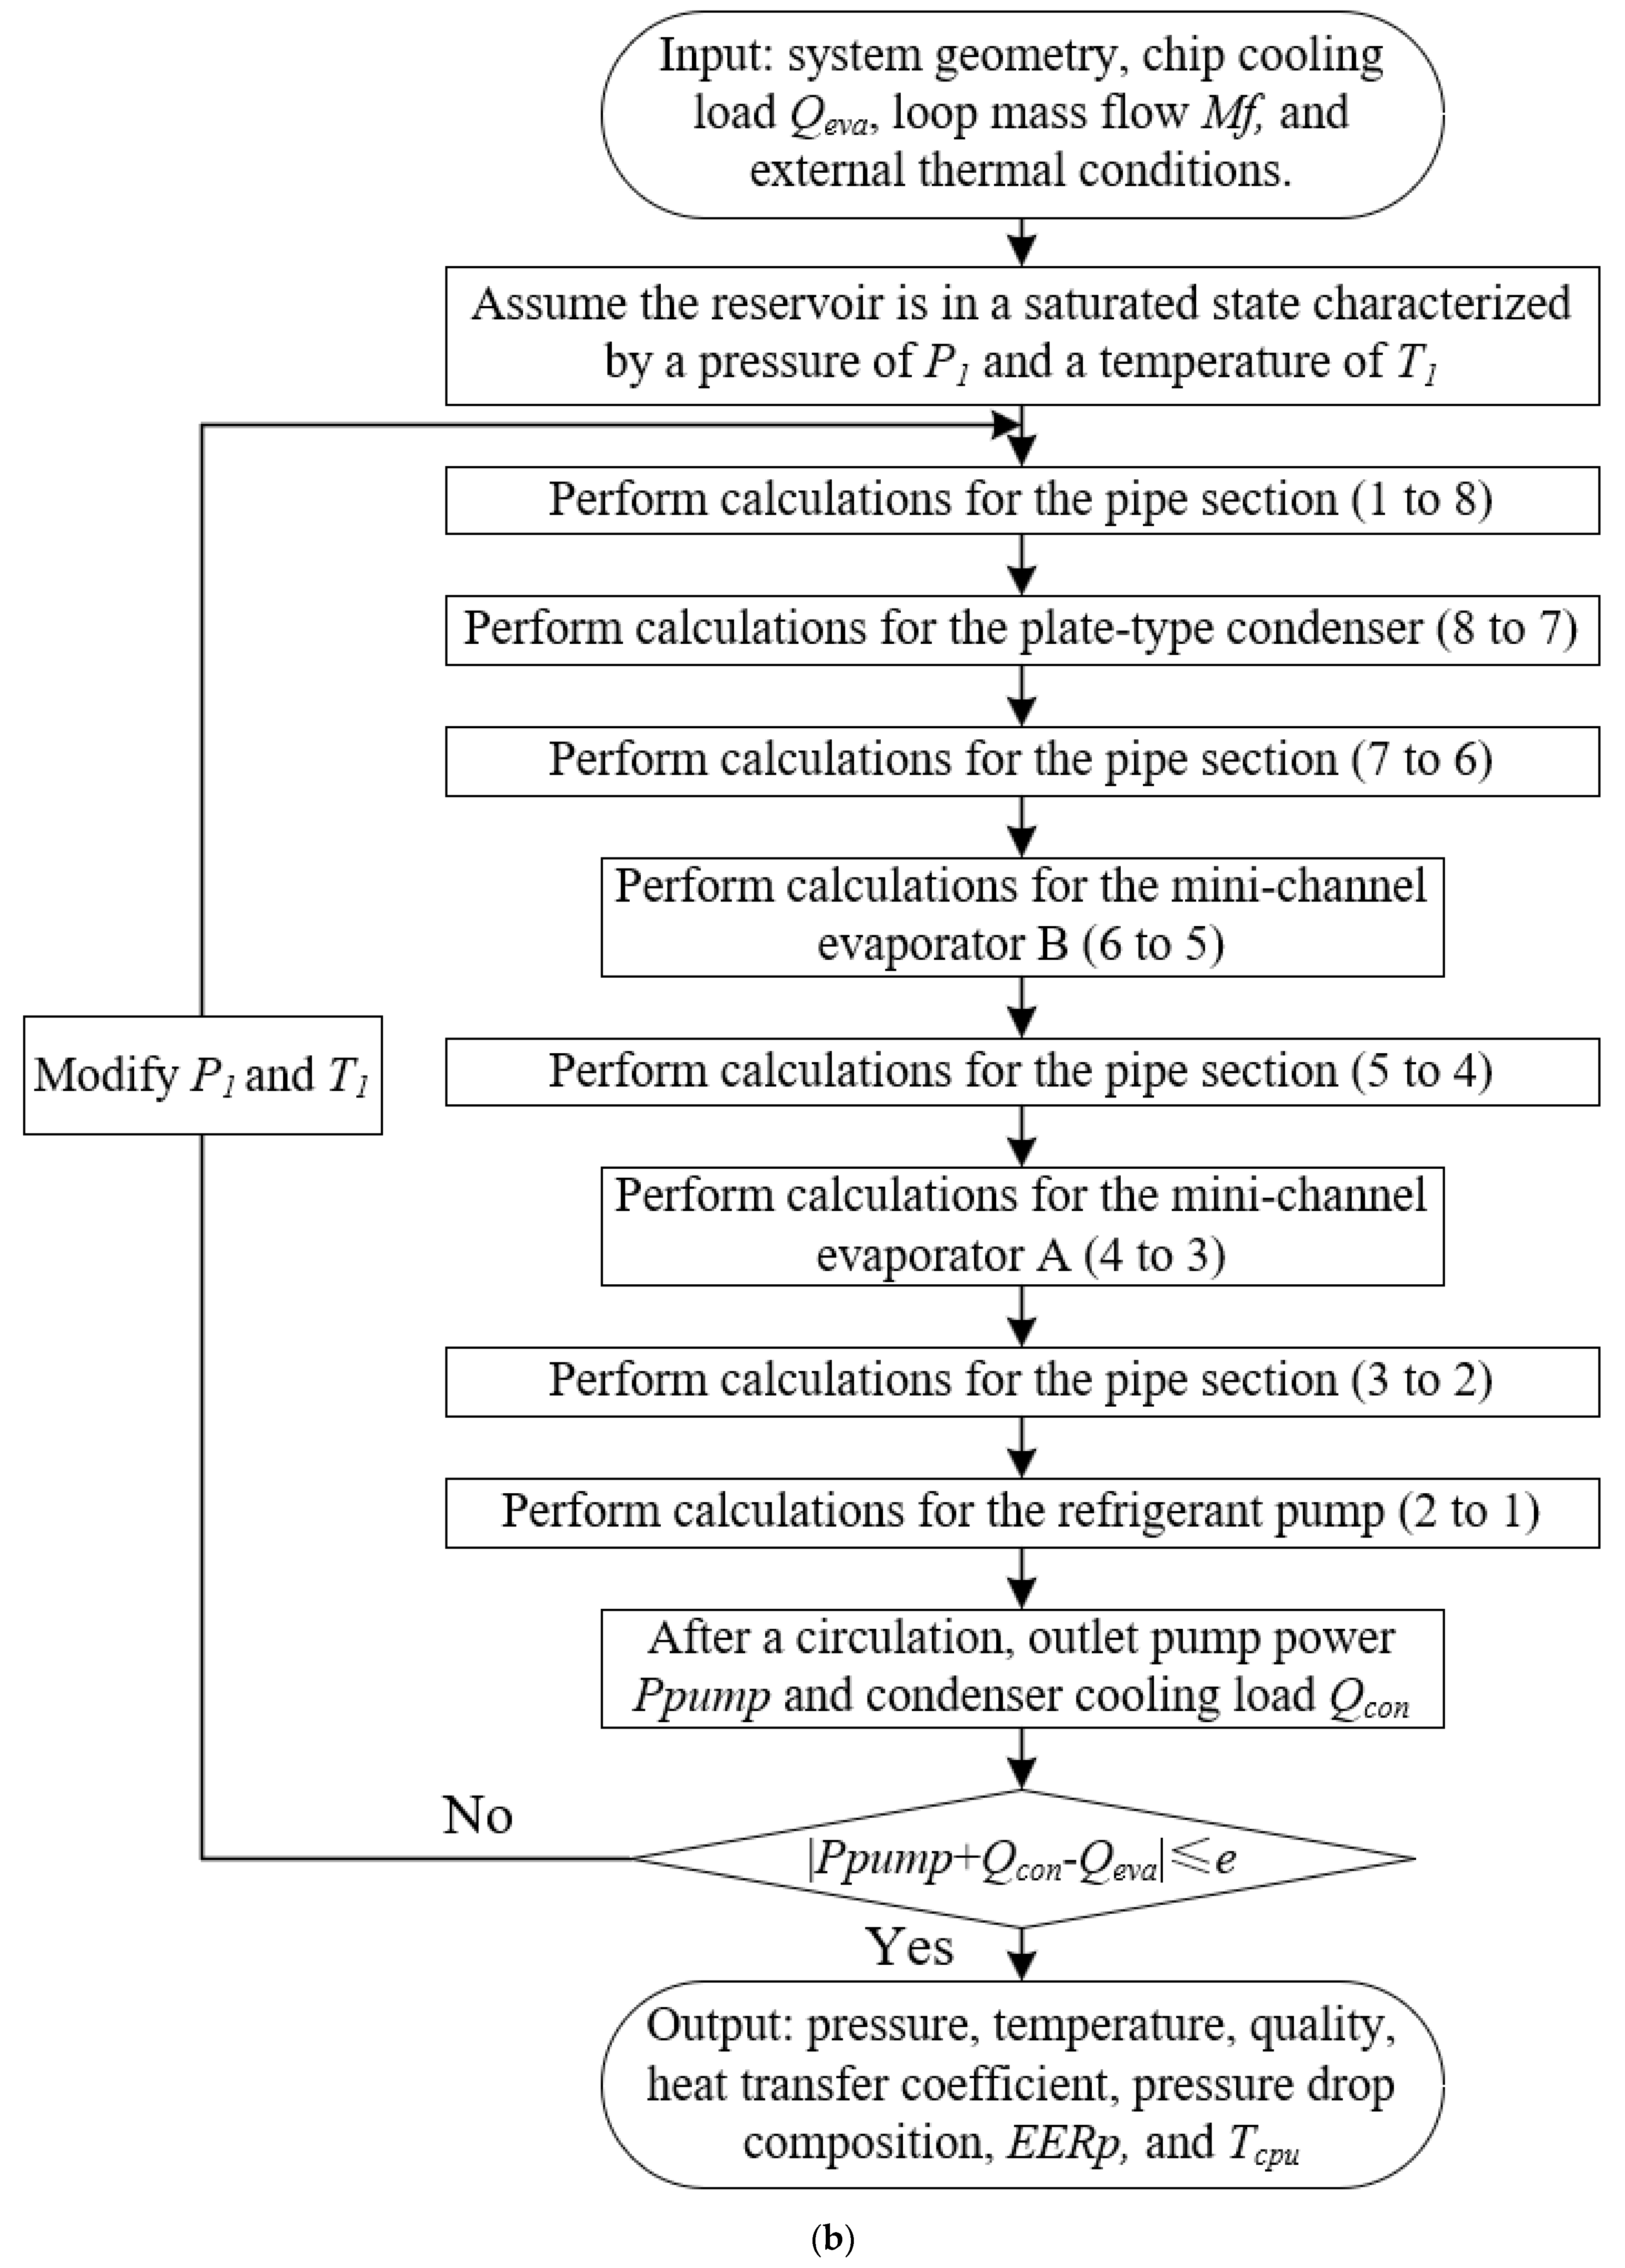
2.3. Solution Procedure

Figure 5 presents detailed flowcharts for solving the PCTCS. The reservoir’s saturated state of the refrigerant is established as the solving starting point. As depicted in Figure 5, two solution strategies are presented: the sequential solution and the reverse sequence solution. Figure 5a shows that the sequential solution follows the same order as the refrigerant flow, whereas the reverse sequence solution, depicted in Figure 5b, proceeds in the order opposite to the refrigerant flow. Both strategies are capable of rendering precise results. However, the sequential solution requires an initial assumption regarding the reservoir’s saturated refrigerant state and the PCTCS’s total pressure drop, thereby necessitating two coupled iterative cycles, while the reverse sequence solution only requires an initial assumption about the reservoir’s refrigerant state, demanding just a single iterative cycle. Moreover, in the condenser, the refrigerant and cooling water undergo countercurrent heat exchange. Adopting the reverse sequence solution can simplify the resolution process of the condenser without necessitating any iterations. Thus, this paper opts for the reverse sequence solution for its potential to reduce computational time.
In the distributed-parameter model of the PCTCS, each component is divided into different nodes according to respective accuracy requirements. In this study, the mini-channel evaporators (3-4, 5-6) and condenser (7-8) are divided into 500 nodes, and connecting pipes (2-3, 4-5, 6-7, 8-1) are divided into 100 nodes. Equations (1)–(23) are used to calculate the thermodynamic state at each node along the loop. REFPROP 9.1 is adopted to calculate the refrigerant thermodynamic properties.

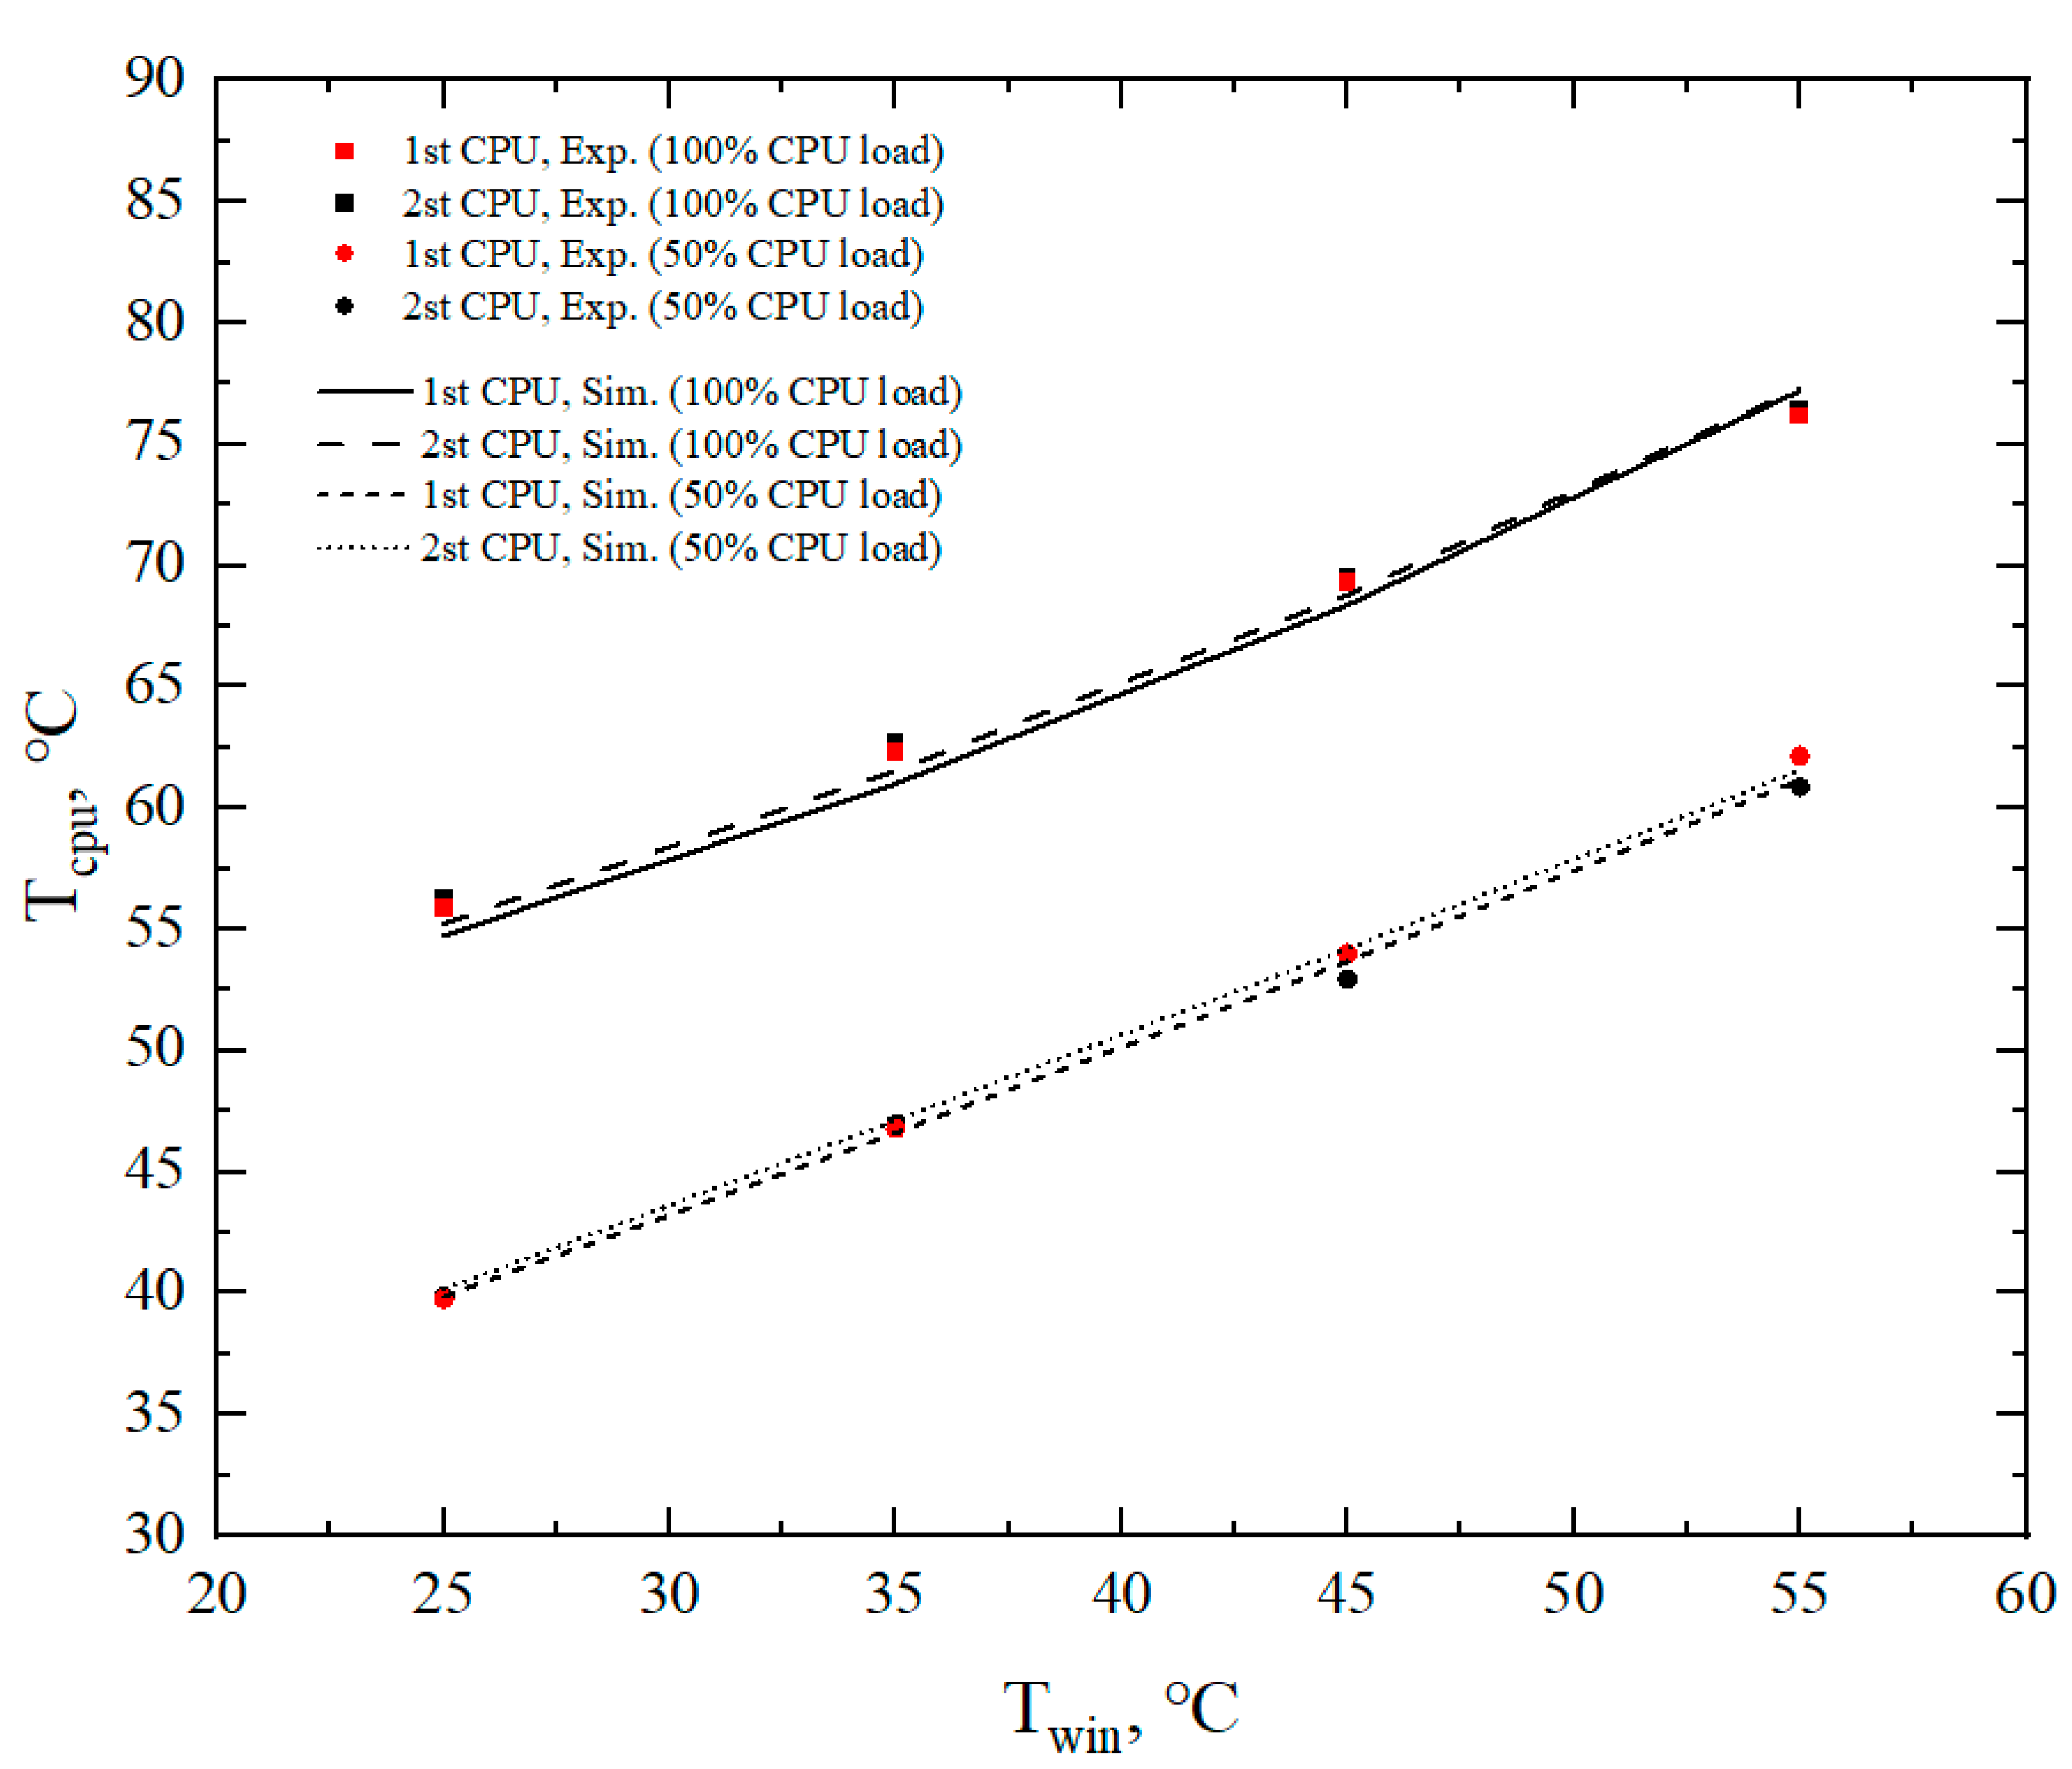
2.4. Model Verification

In order to substantiate the PCTCS model we have established, we conducted a simulation study grounded in our previously undertaken experimental research [27]. Figure 6 displays photographs of the complete experimental system and its constituent parts.
The comparative results under various conditions are delineated in Figure 7 and Table 1. The simulation outcomes, as represented in Figure 7 and Table 1, show a strong correlation with the experimental data, thereby affirming the precision of the developed PCTCS model.

2.5. Performance Evaluation Method

To carry out an efficient analysis and comparison of the PCTCS performance under varying operational conditions, we assessed its function based on several key performance indicators. These included the energy efficiency ratio of the pump (EERp), the total pressure drop (Pdt), the maximum temperature difference between cold and heat sources (Tdt), the average temperature disparity between the first and second CPUs (Tdcpu), the temperature variances of the first and second CPUs (Scpu12, Scpu22), and the heat transfer efficiency of the condenser (ηcon). These indicators are pivotal in evaluating the system’s performance. For instance, Tdt, Tdcpu, and Scpu2 are critical for analyzing the system’s temperature performance, while EERp and Ppump are significant for assessing its energy efficiency. Specifically, EERp is calculated as the total heat dissipation divided by the power utilized by the pump, providing a measure of energy efficiency. In contrast, ηcon represents the heat transfer efficiency of the condenser, determined by the ratio of the actual temperature difference between the cold and hot ends to the maximum possible temperature difference in the heat exchanger. This thorough approach allows for a comprehensive understanding of the PCTCS under different operating conditions.
The parameters were calculated as Equations (24)–(29):
EERp = Q con Ppump = Q eva + Ppump Ppump
Pdt = Pdpump = P 2 P 1
Tdt = max T ¯ cpu 1 ,   T ¯ cpu 2 T win
Td cpu = T ¯ cpu 1 T ¯ cpu 2
η con = max ( T wout T win ) , T 7 T 8 T 7 T win
Both Scpu12 and Scpu12 were computed using Equation (29):
S cpu 2 = i = 1 num T ¯ cpu T cpu , i 2 num
Here, num signifies the number of cells in the condenser, and i refers to the cell’s serial number.

2.6. Simulation Conditions and Scope of Study

Before the simulation, the geometric parameters and operational conditions were established, with Table 2 detailing the basic geometric parameters for each component involved in the simulation.
During the investigation, the refrigerant mass flow was kept at 0.05 kg/s, with the default cooling water inlet temperature and flow rate set at 45 °C and 0.15 kg/s, respectively. The default refrigerant used was R-113, with both the first and second CPUs power set to 80 W, matching the thermal design power of the Intel Xeon E5520 CPU. The study explored the PCTCS’s characteristics on default configuration and the influence of refrigerant type, condenser height position, and varying cooling water temperature on the PCTCS performance as detailed below:
  • Default configuration;
  • Three different types of refrigerants, namely, R-113, R-134a, and R-32, were selected to facilitate an analysis of their impacts on the performance of the PCTCS. These refrigerants have atmospheric boiling points of 47.6 °C, −26.1 °C, and −51.7 °C, respectively, thus representing low-, medium-, and high-pressure refrigerants. Their widespread use in refrigeration and data center heat dissipation, coupled with their distinctly varying physical properties, make them ideal for evaluating the diverse influences they can exert on the performance of the PCTCS;
  • The impact of the condenser height on the PCTCS performance was assessed. The condenser height was altered relative to the reservoir and the evaporator by varying the heights of the connecting pipes in sections 6-7 and 8-1. The configurations included 0 m, 0 m (same height); 1 m, −1 m (condenser is 1 m higher); and −1 m, 1 m (condenser is 1 m lower);
  • The cooling water temperature range was established between 15 and 60 °C, with increments of 5 °C.

3. Results and Discussion

3.1. Simulation Results with the Default Configuration

Figure 8 and Table 3 present the internal parameter distribution and the simulation results for the PCTCS under default parameters. As illustrated in Figure 8a, the major pressure drops in the PCTCS transpired within the connecting pipes (2-3, 4-5, 6-7, and 8-1), whereas they were minor within the mini-channel evaporators (3-4, 5-6) and the plate-type condenser (7-8). This disparity arose from the model’s focus on the heat exchange channels in the mini-channel evaporators and plate-type condenser, which exhibit lower refrigerant mass flux, resulting in smaller pressure drops. Pipe 6-7, despite having the same length as pipe 2-3 but a larger diameter, manifested a markedly higher pressure drop. This difference can be attributed to the high-quality two-phase state of the refrigerant in pipe 6-7 compared to the single-phase state in pipe 2-3. The total pressure drop of the system comprises the frictional pressure drop, the acceleration pressure drop, and the gravitational pressure drop. In the default configuration, all connection pipes are arranged horizontally, thereby the gravitational pressure drop in connecting pipes could be disregarded. Moreover, while the phase change process of the refrigerant in the evaporators and condenser did result in an acceleration pressure drop, its value was minuscule compared to the frictional pressure drop, thus it can be omitted too. Consequently, under the default conditions, the total pressure drop was almost entirely attributed to friction. A marked pressure drop was noted as the refrigerant coursed through pipe 6-7, a finding that aligns with the research conducted by Tahery and Müller [30,31]. Their work indicates that the frictional pressure drop in two-phase flow is notably larger than that observed in single-phase flow. Given the length of pipe 6-7, it stands to reason that the refrigerant encountered the most significant frictional pressure drop there within the entire PCTCS. Interestingly, despite an absence of heat exchange within pipe 6-7, the quality of the refrigerant increased, due to both the pressure drop and the inherent physical properties of refrigerant R-113 [45], as represented in Figure 8b. As also noted in Tahery and Müller’s studies [30,31], the frictional pressure drop of the two-phase flow typically escalates alongside an increase in refrigerant quality within the horizontal pipe. This correlation results in a gradual increase in the frictional pressure drop within pipe 6-7 as the refrigerant flows through it.
Figure 8b presents the distribution of thermodynamic quality and void fraction. The variation trends of both parameters were aligned; as the thermodynamic quality escalated, the void fraction initially increased rapidly and then proceeded at a slower pace. Moreover, within the first mini-channel evaporator, nearly half of the zones displayed a thermodynamic quality of less than zero, indicating subcooling of the refrigerant. Conversely, few zones with a thermodynamic quality of less than zero were observed in the plate-type condenser. Figure 8c presents the distributions of temperature and the heat transfer coefficient. As observed, the subcooled refrigerant, upon initial entry into the first mini-channel evaporator, was situated within the fully developed region of subcooled boiling, accounting for approximately half of the heat transfer area of the first evaporator. In this region, the heat transfer coefficient incrementally increased with a corresponding decrease in the subcooling temperature, while the CPU temperature remained relatively constant. As the thermodynamic quality progressively increases, nearing zero, it transitioned into the void flow region, resulting in a sharp upsurge in the heat transfer coefficient and a slight decline in the CPU temperature. When the thermodynamic dryness exceeded zero, the system transitioned into the saturated boiling zone. Within this zone, despite the refrigerant temperature remaining nearly constant, the heat transfer coefficient showed a slow decline in response to the rising x, thereby leading to a gradual increase in the CPU temperature. Additionally, the refrigerant within the second mini-channel evaporator resided in the saturated boiling region, mirroring the trend observed in the saturated boiling region of the first evaporator. Within the condenser, the heat transfer coefficient gradually reduced as the x in the two-phase region declined. Notably, the single-phase region within the condenser constituted a minimal proportion.
As illustrated in Table 3, even when the pump efficiency was fixed at 0.1, the pump’s power output amounted to a mere 27.9 W. Meanwhile, the EERp reached an impressive figure of 115, signifying the considerable efficiency of the PCTCS. Throughout the heat transfer processes in the PCTCS, two instances of subcooling became evident: the first at the entry point of the initial evaporator and the second at the condenser outlet. The subcooling degree of the refrigerant entering the evaporator was 14.44 °C, markedly higher than the 0.78 °C at the condenser outlet. The system’s maximum temperature differential was 34.5 °C. Simultaneously, the first and second CPUs exhibit temperatures of 78.72 °C and 79.5 °C, respectively. Despite a substantial Tdt, the CPUs’ temperatures were significantly lower than typical CPU overheating protection thresholds, indicating the PCTCS could effectively deal with the CPUs’ heat under the default simulation conditions. Furthermore, the variances in the temperatures of the first and second CPUs—0.08 and 0.34, respectively—indicated a uniform temperature distribution across both CPUs.

3.2. Influence of the Refrigerant Type

Figure 9 and Table 4 delineate the internal parameter distribution and performance characteristics of the PCTCS when using three distinct refrigerants: R-113, R-134a, and R-32. As displayed in Figure 9a and Table 4, the PCTCS with R-32 and R-113 revealed the highest and lowest operating pressures, respectively. Interestingly, these pressures were inversely proportional to the total pressure drop. In connecting pipe 6-7, the total pressure drop of the PCTCS with R-113 demonstrated an upward trend along the direction of the refrigerant flow, an observation not mirrored in the PCTCS with R-134a and R-32. This discrepancy can be traced back to the distinct physical properties of the refrigerants. As highlighted in Figure 9b, within pipe 6-7, both the x and α for the PCTCS with R-113 increased significantly with the decrease in refrigerant pressure, a situation not observed with the R-134a and R-32 refrigerants. The rise in x engenders an increase in the frictional pressure drop within the two-phase region. Consequently, an escalation in the total pressure drop in the PCTCS using R-113 refrigerant occurred within pipe 6-7. Figure 9b demonstrates the alignment of the x and α trends for the R-134a and R-32 systems, while the PCTCS with R-113 diverged slightly. This divergence was particularly evident at the inlet of the first evaporator: the subcooling zone for the PCTCS utilizing R-134a and R-32 was noticeably small but substantially larger for the PCTCS using R-113. Figure 9c and Figure 8d further show that the PCTCS with R-32 had the lowest refrigerant and CPU temperatures and the largest heat transfer coefficients in both the evaporators and condenser. In contrast, the PCTCS with R-113 exhibited the highest refrigerant and CPU temperatures, coupled with the smallest heat transfer coefficients, and the PCTCS with R-134a exhibited intermediate values for these parameters.
As delineated in Table 4, the PCTCSs utilizing R-32 and R-134a exhibited a total pressure drop and pump power of 26.8 kPa and 23.68 kPa and 12.3 W and 14.3 W, respectively. These figures were significantly lower than the 83.21 kPa and 27.9 W associated with the PCTCS employing R-113. In terms of efficiency, the PCTCSs with R-32 and R-134a surpassed that with R-113, boasting EERp and ηcon of 224 and 260 and 0.792 and 0.634, respectively, compared to 115 and 0.513. Moreover, the degree of subcooling in the first mini-channel evaporator and condenser was remarkably minimal when R-32 and R-134a were employed. In terms of maximum temperature difference (Tdt), the PCTCS utilizing R-32 demonstrated the smallest at 11.82 °C, R-134a yielded a moderate Tdt of 17.97 °C, and R-113 showcased the largest at 34.5 °C. The underlying rationale for this observation stems from the properties of R-32, a high-pressure refrigerant. Specifically, R-32 demonstrates the highest saturation pressure among the refrigerants studied and undergoes a less significant change in saturation temperature in response to pressure fluctuations. This characteristic inherently reduces the temperature disparity between the system’s evaporation and condensation. Moreover, high-pressure refrigerants are typically characterized by higher boiling heat transfer coefficients, which further compress the temperature differential between the CPU temperature and the evaporation temperature of the refrigerant. The cumulative effect of these factors leads to a minimal Tdt for R-32. This finding is consistent with Palm’s research [46], underscoring the general principle that refrigerants with higher pressure levels typically yield a decreased temperature differential. Notably, the temperature variance between the two CPUs was marginal across all PCTCS configurations using various refrigerants, signifying excellent CPU temperature uniformity. As is evident in the above analyses, these disparities in the various PCTCSs stemmed from the inherent variations in the physical properties of the refrigerants. In terms of overall PCTCS performance, the R-32 configuration stands out, followed by R-134a, with R-113 lagging. Practical implementation, nevertheless, ushers in distinct challenges. Specifically, the high operating pressure associated with the R-32 system introduces profound considerations for engineering deployment, operational dependability, and construction costs, especially considering the intricate network of piping and joints within the PCTCS. Additionally, crucial factors including toxicity, flammability, and cost necessitate careful evaluation. Therefore, the selection of an apt refrigerant becomes an essential determinant in optimizing the PCTCS’s performance.

3.3. Impact of the Condenser Height

Figure 10 and Table 5 provide insights into the internal parameter distribution and performance characteristics of the PCTCS at different condenser elevations. Figure 10a,b depicts that disparate condenser heights generate similar Pr, Pdt, and Pdf distributions throughout the PCTCS, excluding connection pipe 8-1. Given the marginal impact of Pda, Pdt can be viewed as the summation of Pdf and Pdg. When the condenser was placed 1 m above the reservoir and evaporators, pipe 8-1 manifested a positive Pdf, contrasted by a negative Pdg and Pdt, which suggested an increase in Pr. Conversely, when the condenser was situated 1 m below or at an equivalent level, Pdg was either positive or zero, Pdf remained positive, and Pdt consistently stayed positive, indicating a decrease in Pr. Interestingly, despite the identical 1 m elevation difference in pipes 6-7 and 8-1, the impact of Pdg on Pdt was remarkably less in pipe 6-7. This observation could be ascribed to the two-phase state of the refrigerant in pipe 6-7, in accordance with Equations (8)–(10), where a high α yields a small Pdg. Moreover, when the condenser was elevated by 1 m, the absolute value of the negative Pdg in pipe 8-1 escalated due to a decrement in α. Figure 10c–e implies that alterations in condenser height affect x and α, the dimensions of the subcooling area, and hα of the PCTCS. As the height of the condenser increased, the subcooling area during the evaporation and condensation process contracted, hα diminished, and both x and α of the PCTCS amplified. The impact became particularly pronounced when the condenser’s elevation was increased by 1 m, which led the PCTCS to exhibit a two-phase state at the condenser outlet, signifying an absence of supercooling within the condenser. This phenomenon can be explained by the state of the refrigerant at the condenser outlet, which can be inferred inversely from the conditions within the reservoir and pipe 8-1. Considering that the refrigerant enters the reservoir in a saturated state and that no heat transfer occurs within pipe 8-1, it is evident that the state of the refrigerant at the condenser outlet is primarily influenced by the pressure drop in pipe 8-1. If the total pressure drop across pipe 8-1 is positive—indicating a lower pressure at point 1 than at point 8—the refrigerant at the condenser outlet will present in a subcooled liquid state. Moreover, the degree of subcooling will increase in direct proportion to the total pressure drop across pipe 8-1. On the other hand, if the total pressure drop across pipe 8-1 is negative, such that the pressure at point 1 exceeds that at point 8, the refrigerant at the condenser outlet will be in a two-phase state. Raising the condenser by 1 m introduces the factor of gravitational pressure drop, which results in a negative total pressure drop in pipe 8-1 and consequently leads to the emergence of a two-phase state at the condenser outlet.
Table 5 illustrates that an increase in the condenser’s elevation correlates positively with Pdt and Ppump, while inversely affecting EERp and ηcon. For instance, when the condenser was 1 m above the reservoir and evaporators, Pdt and Ppump registered at 78.14 kPa and 26.27 W, respectively. These parameters were lower than the 83.21 kPa and 27.9 W observed when the condenser was at the same elevation and the 92.53 kPa and 30.86 W when it was situated 1 m below. Simultaneously, the EERp for the PCTCS when the condenser was elevated by 1 m, situated at the same level, and placed 1 m below, was 122, 115, and 104, respectively. These findings indicate that a higher condenser position generally enhances the PCTCS’s energy efficiency. The operational principles of the PCTCS can be understood in the context of a specialized gravity thermosyphon, which is propelled by the dual forces of gravity and the pump. In a gravity thermosyphon, the performance is significantly dictated by the elevation of the condenser. Notably, a higher condenser position leads to an enlarged liquid column in the descending tube, generating a greater gravitational driving force. Similarly, within the PCTCS, elevating the condenser results in a stronger gravitational driving force. This, in turn, decreases the need for an additional driving force from the pump, contributing to the conservation of pump power and subsequently enhancing the PCTCS’s energy efficiency. This finding aligns with the experimental results presented by Yuan [47]. Nevertheless, it is imperative to highlight that the influence of the condenser’s positioning on the PCTCS’s efficiency, while present, is relatively subtle—a detail also emphasized in Yuan’s study [46]. Additionally, with the condenser elevated by 1 m, the degree of subcooling at the first evaporator inlet was recorded at 13.17 °C, lower than the 14.51 °C at the same elevation and the 17.06 °C at 1 m lower. Intriguingly, when the condenser was raised by 1 m, the condenser outlet was a two-phase state, thus eliminating subcooling. In contrast, condensers at the same level and 1 m lower registered subcooling degrees of 0.78 °C and 4.59 °C, respectively. Furthermore, an elevated condenser position correlated with a higher Tdt and Tcpu. Specifically, when the condenser was 1 m higher, the average temperatures of the two CPUs increased by 0.46 °C and 0.90 °C compared to those at the same elevation and 1 m below. Moreover, the CPU temperature distribution remained relatively uniform across varying condenser elevations, implying a minimal impact of condenser height on CPU temperature uniformity. To summarize, while a raised condenser position generally enhances the PCTCS’s efficiency, it slightly compromises the temperature performance, albeit these differences can be negligible in actual applications.

3.4. Influence of the Cooling Water Temperature

Figure 11 presents the performance of the PCTCS under varying Twin. As depicted in Figure 11a, when Twin increased from 15 °C to 60 °C, the average temperature of the two CPUs rose from 61.46 °C to 89.03 °C. Simultaneously, the Tdt of the PCTCS decreased from 56.74 °C to 29.63 °C, suggesting that a higher Twin can enhance the PCTCS’s temperature performance. In Figure 11b, as Twin escalated from 5 °C to 60 °C, Ppump in the PCTCS fell from 32.5 W to 23.9 W, while EERp improved from 98 to 134. This trend signifies that a greater Twin value improves the PCTCS’s energy efficiency. As shown in Figure 11c, as the Twin increased, the PCTCS’s Pdt and dTsub diminished, and a significant reduction in dTsub at the first mini-channel evaporator inlet was observed, dropping from 37.72 °C at a Twin of 5 °C to 8.86 °C at 60 °C. In summary, an increase in Twin significantly enhances both the temperature performance and energy efficiency of the PCTCS. Therefore, it is recommended to maximize the Twin during the operation of the PCTCS, provided the Tcpu does not surpass the threshold. This recommendation is in alignment with the conclusions drawn from several notable studies, including those conducted by Ma [48] and Ong [49]. Importantly, a higher Twin is favorable for natural cooling and waste heat recovery.

4. Conclusions

In this research, we developed a one-dimensional, steady-state mathematical model for a novel PCTCS, a system specifically designed for direct CPU cooling in data centers. We conducted simulations by varying key parameters, such as the refrigerant type, the condenser’s vertical position, and the cooling water temperature. Our comprehensive investigation delivered a meticulous examination of the internal parameter distribution within the PCTCS, encompassing aspects such as pressure, pressure drop, temperature, thermodynamic quality, void fraction, and heat transfer coefficient. In addition, we proposed temperature and energy efficiency evaluation indices for the system, employed these indices to assess the system’s performance under various conditions, and based on these assessments, recommended configuration and operation strategies for potential future applications of the system. The following encapsulates the primary conclusions from our study:
  • The constructed model has been validated in harmony with experimental studies, attesting to its precision in simulating the PCTCS;
  • The results from our simulations suggest that the PCTCS can efficiently manage CPU power as high as 80 W, attaining an EERp of up to 115, while ensuring that the temperatures of the two CPUs remain at 78.72 °C and 79.50 °C—within the CPUs’ thermal tolerance limits—when the inlet cooling water temperature is 45 °C;
  • The choice of refrigerant significantly affects the PCTCS’s performance. Utilizing R-32 and R-134a as refrigerants results in superior energy efficiency and temperature performance compared to R-113, with R-32 showing the best overall performance. However, the choice of refrigerant necessitates the consideration of factors such as safety, maintenance, and cost in actual applications;
  • Increasing the condenser’s height decreases the subcooling in the PCTCS’s evaporators and condenser. While a higher condenser location improves the PCTCS’s energy efficiency, it adversely affects its temperature performance. However, these disparities are marginal, suggesting that the condenser’s height exerts a limited effect on the PCTCS’s comprehensive performance. In practical applications, this effect can generally be ignored;
  • The cooling water temperature significantly influences the PCTCS’s performance. A higher cooling water temperature enhances both the temperature performance and energy efficiency of the PCTCS, in addition to facilitating natural cooling and waste heat recovery. Therefore, it is advisable to maximize the cooling water temperature during PCTCS operation, provided the CPU temperature remains within safe limits.

Author Contributions

Conceptualization, L.W. and W.Y.; methodology, L.W.; software, L.W. and H.C.; validation, L.W., H.C., and T.Y.; formal analysis, L.W.; investigation, T.Y.; resources, W.Y.; data curation, H.C.; writing—original draft preparation, L.W.; writing—review and editing, W.Y. and K.R.; visualization, T.Y.; supervision, W.Y. and K.R.; project administration, K.R.; funding acquisition, W.Y. All authors have read and agreed to the published version of the manuscript.

Funding

This research received no external funding.

Institutional Review Board Statement

Not applicable.

Informed Consent Statement

Not applicable.

Data Availability Statement

The data presented in this study are available on request from the corresponding author.

Conflicts of Interest

The authors declare no conflict of interest.

References

  1. Lu, H.; Zhang, Z.; Yang, L. A review on airflow distribution and management in data center. Energy Build. 2018, 179, 264–277. [Google Scholar] [CrossRef]
  2. Xu, S.; Zhang, H.; Wang, Z. Thermal Management and Energy Consumption in Air, Liquid, and Free Cooling Systems for Data Centers: A Review. Energies 2023, 16, 1279. [Google Scholar] [CrossRef]
  3. Petrović, S.; Colangelo, A.; Balyk, O.; Delmastro, C.; Gargiulo, M.; Simonsen, M.B.; Karlsson, K. The role of data centres in the future Danish energy system. Energy 2020, 194, 116928. [Google Scholar] [CrossRef]
  4. Masanet, E.; Shehabi, A.; Lei, N.; Smith, S.; Koomey, J. Recalibrating global data center energy-use estimates. Science 2020, 367, 984–986. [Google Scholar] [CrossRef]
  5. Zhang, Y.; Shan, K.; Li, X.; Li, H.; Wang, S. Research and Technologies for next-generation high-temperature data centers—State-of-the-arts and future perspectives. Renew. Sustain. Energy Rev. 2023, 171, 112991. [Google Scholar] [CrossRef]
  6. Mitchell-Jackson, J.; Koomey, J.G.; Nordman, B.; Blazek, M. Data center power requirements: Measurements from Silicon Valley. Energy 2003, 28, 837–850. [Google Scholar] [CrossRef]
  7. Moazamigoodarzi, H.; Tsai, P.J.; Pal, S.; Ghosh, S.; Puri, I.K. Influence of cooling architecture on data center power consumption. Energy 2019, 183, 525–535. [Google Scholar] [CrossRef]
  8. Han, Z.; Wei, H.; Sun, X.; Bai, C.; Xue, D.; Li, X. Study on influence of operating parameters of data center air conditioning system based on the concept of on-demand cooling. Renew. Energy 2020, 160, 99–111. [Google Scholar] [CrossRef]
  9. Han, Z.; Ji, Q.; Wei, H.; Xue, D.; Sun, X.; Zhang, X.; Li, X. Simulation study on performance of data center air-conditioning system with novel evaporative condenser. Energy 2020, 210, 118521. [Google Scholar] [CrossRef]
  10. Nadjahi, C.; Louahlia, H.; Lemasson, S. A review of thermal management and innovative cooling strategies for data center. Sustain. Comput. Inform. Syst. 2018, 19, 14–28. [Google Scholar] [CrossRef]
  11. Daraghmeh, H.M.; Wang, C.-C. A review of current status of free cooling in datacenters. Appl. Therm. Eng. 2017, 114, 1224–1239. [Google Scholar] [CrossRef]
  12. Güğül, G.N.; Gökçül, F.; Eicker, U. Sustainability analysis of zero energy consumption data centers with free cooling, waste heat reuse and renewable energy systems: A feasibility study. Energy 2023, 262, 125495. [Google Scholar] [CrossRef]
  13. Nada, S.A.; El-Zoheiry, R.M.; Elsharnoby, M.; Osman, O.S. Experimental investigation of hydrothermal characteristics of data center servers’ liquid cooling system for different flow configurations and geometric conditions. Case Stud. Therm. Eng. 2021, 27, 101276. [Google Scholar] [CrossRef]
  14. Li, L.; Zheng, W.; Wang, X.; Wang, X. Coordinating liquid and free air cooling with workload allocation for data center power minimization. In Proceedings of the 11th International Conference on Autonomic Computing ({ICAC} 14), Philadelphia, PA, USA, 18–20 June 2014; pp. 249–259. [Google Scholar]
  15. Joshi, Y.; Kumar, P. Energy Efficient Thermal Management of Data Centers; Springer Science & Business Media: Berlin/Heidelberg, Germany, 2012. [Google Scholar]
  16. Kheirabadi, A.C.; Groulx, D. Cooling of server electronics: A design review of existing technology. Appl. Therm. Eng. 2016, 105, 622–638. [Google Scholar] [CrossRef]
  17. Habibi Khalaj, A.; Halgamuge, S.K. A Review on efficient thermal management of air- and liquid-cooled data centers: From chip to the cooling system. Appl. Energy 2017, 205, 1165–1188. [Google Scholar] [CrossRef]
  18. Madhour, Y.; Olivier, J.; Costa-Patry, E.; Paredes, S.; Michel, B.; Thome, J.R. Flow Boiling of R134a in a Multi-Microchannel Heat Sink With Hotspot Heaters for Energy-Efficient Microelectronic CPU Cooling Applications. IEEE Trans. Compon. Packag. Manuf. Technol. 2011, 1, 873–883. [Google Scholar] [CrossRef]
  19. Wu, D.; Marcinichen, J.B.; Thome, J.R. Experimental evaluation of a controlled hybrid two-phase multi-microchannel cooling and heat recovery system driven by liquid pump and vapor compressor. Int. J. Refrig. 2013, 36, 375–389. [Google Scholar] [CrossRef]
  20. Marcinichen, J.B.; Olivier, J.A.; Oliveira, V.d.; Thome, J.R. A review of on-chip micro-evaporation: Experimental evaluation of liquid pumping and vapor compression driven cooling systems and control. Appl. Energy 2012, 92, 147–161. [Google Scholar] [CrossRef] [Green Version]
  21. Xue, Z.H.; Ai, B.C.; Qu, W. Data center energy conservation study utilizing loop heat pipes as a chip-level cooling technique and its industrial application. Appl. Therm. Eng. 2023, 220, 119715. [Google Scholar] [CrossRef]
  22. Mao, Z.; Asai, Y.; Yamanoi, A.; Seki, Y.; Wiranata, A.; Minaminosono, A. Fluidic rolling robot using voltage-driven oscillating liquid. Smart Mater. Struct. 2022, 31, 105006. [Google Scholar] [CrossRef]
  23. Zhang, P.; Wang, B.; Shi, W.; Han, L.; Li, X. Modeling and performance analysis of a two-phase thermosyphon loop with partially/fully liquid-filled downcomer. Int. J. Refrig. 2015, 58, 172–185. [Google Scholar] [CrossRef]
  24. Marcinichen, J.B.; Thome, J.R. New novel green computer two-phase cooling cycle: A model for its steady-state simulation. In Proceedings of the Proceedings of the 23rd International Conference on Efficiency, Cost, Optimization, Simulation and Environmental Impact of Energy Systems-ECOS2010, Lausanne, Switzerland, 14–17 June 2010. [Google Scholar]
  25. Ong, C.L.; Amalfi, R.L.; Marcinichen, J.B.; Lamaison, N.; Thome, J.R. Two-phase mini-thermosyphon for cooling of datacenters: Experiments, modeling and simulations. In Proceedings of the International Electronic Packaging Technical Conference and Exhibition, San Francisco, CA, USA, 29 August–1 September 2017; American Society of Mechanical Engineers: New York, NY, USA, 2017; p. V001T002A003. [Google Scholar]
  26. Zhang, P.; Wei, X.; Yan, L.; Xu, H.; Yang, T. Review of recent developments on pump-assisted two-phase flow cooling technology. Appl. Therm. Eng. 2019, 150, 811–823. [Google Scholar] [CrossRef]
  27. Wang, L.; Yang, T.; Yuana, W.; Ren, K. Experimental study of pump-driven chip-level two-phase cooling system for data centres. Indoor Built Environ. 2023. accepted. [Google Scholar]
  28. Brown, G.O. The history of the Darcy-Weisbach equation for pipe flow resistance. In Environmental and Water Resources History; American Society of Civil Engineers: Washington, DC, USA, 2003; pp. 34–43. [Google Scholar]
  29. Asadi, M.; Xie, G.; Sunden, B. A review of heat transfer and pressure drop characteristics of single and two-phase microchannels. Int. J. Heat Mass Transf. 2014, 79, 34–53. [Google Scholar] [CrossRef]
  30. Müller-Steinhagen, H.; Heck, K. A simple friction pressure drop correlation for two-phase flow in pipes. Chem. Eng. Process. Process Intensif. 1986, 20, 297–308. [Google Scholar] [CrossRef]
  31. Tahery, R.; Ehterami, S. Two-phase Frictional Pressure Drop in Horizontal Channels. In Proceedings of the 7th International Chemical Engineering Congress & Exhibition (IChEC 2011), Kish, Iran, 21–24 November 2011. [Google Scholar]
  32. Ribatski, G.; Wojtan, L.; Thome, J.R. An analysis of experimental data and prediction methods for two-phase frictional pressure drop and flow boiling heat transfer in micro-scale channels. Exp. Therm. Fluid Sci. 2006, 31, 1–19. [Google Scholar] [CrossRef]
  33. Smith, S. Void fractions in two-phase flow: A correlation based upon an equal velocity head model. Proc. Inst. Mech. Eng. 1969, 184, 647–664. [Google Scholar] [CrossRef]
  34. Shah, R.; London, A.L. Laminar Flow Forced Convection in Ducts, Supplement 1 to Advances in Heat Transfer; Academic Press: New York, NY, USA, 1978. [Google Scholar]
  35. Gnielinski, V. New equations for heat and mass transfer in turbulent pipe and channel flow. Int. Chem. Eng. 1976, 16, 359–368. [Google Scholar]
  36. Subramanian, R.S. Heat Transfer in Flow through Conduits; Department of Chemical and Biomolecular Engineering, Clarkson University Project: Potsdam, NY, USA, 2015. [Google Scholar]
  37. Kandlikar, S.G.; Balasubramanian, P. An Extension of the Flow Boiling Correlation to Transition, Laminar, and Deep Laminar Flows in Minichannels and Microchannels. Heat Transf. Eng. 2004, 25, 86–93. [Google Scholar] [CrossRef]
  38. Kandlikar, S.G. A general correlation for saturated two-phase flow boiling heat transfer inside horizontal and vertical tubes. J. Heat Transfer. 1990, 112, 219–228. [Google Scholar] [CrossRef] [Green Version]
  39. Kandlikar, S. A model for predicting the two-phase flow boiling heat transfer coefficient in augmented tube and compact heat exchanger geometries. ASME J. Heat Transf. 1991, 113, 966–972. [Google Scholar] [CrossRef] [Green Version]
  40. Kandlikar, S.G. Heat transfer characteristics in partial boiling, fully developed boiling, and significant void flow regions of subcooled flow boiling. J. Heat Transfer. 1998, 120, 395–401. [Google Scholar] [CrossRef]
  41. Kandlikar, S.G. Development of a flow boiling map for subcooled and saturated flow boiling of different fluids inside circular tubes. J. Heat Transfer. 1991, 113, 190–200. [Google Scholar] [CrossRef]
  42. Saha, P.; Zuber, N. Point of net vapor generation and vapor void fraction in subcooled boiling. In Proceedings of the International Heat Transfer Conference Digital Library, Tokyo, Japan, 3–7 September 1974. [Google Scholar]
  43. Longo, G.A.; Righetti, G.; Zilio, C. A new computational procedure for refrigerant condensation inside herringbone-type Brazed Plate Heat Exchangers. Int. J. Heat Mass Transf. 2015, 82, 530–536. [Google Scholar] [CrossRef]
  44. Eldeeb, R.; Aute, V.; Radermacher, R. A survey of correlations for heat transfer and pressure drop for evaporation and condensation in plate heat exchangers. Int. J. Refrig. 2016, 65, 12–26. [Google Scholar] [CrossRef]
  45. Lemmon, E.; Huber, M.L.; McLinden, M.O. NIST Standard Reference Database 23: Reference Fluid Thermodynamic and Transport Properties-REFPROP, Version 8.0; Natl Std. Ref. Data Series (NIST NSRDS); National Institute of Standards and Technology: Gaithersburg, MD, USA, 2007.
  46. Palm, B.R.; Khodabandeh, R. Choosing working fluid for two-phase thermosyphon systems for cooling of electronics. J. Electron. Packag. 2003, 125, 276–281. [Google Scholar] [CrossRef]
  47. Yuan, L.; Joshi, Y.; Nakayama, W. Effect of condenser location and imposed circulation on the performance of a compact two-phase thermosyphon. Microscale Thermophys. Eng. 2003, 7, 163–179. [Google Scholar] [CrossRef]
  48. Ma, Y.; Ma, G.; Zhang, S.; Zhou, F. Cooling performance of a pump-driven two phase cooling system for free cooling in data centers. Appl. Therm. Eng. 2016, 95, 143–149. [Google Scholar] [CrossRef]
  49. Ong, K.; Haider-E-Alahi, M. Performance of a R-134a-filled thermosyphon. Appl. Therm. Eng. 2003, 23, 2373–2381. [Google Scholar] [CrossRef]
Figure 1. Schematic diagram of the PCTCS in our previous study [27].
Applsci 13 07472 g001
Figure 4. The exterior photo and internal structure diagram of the mini-channel evaporator.
Applsci 13 07472 g004
Figure 5. System-solving flowchart for the PCTCS: (a) sequential solution; (b) reverse sequence solution.
Applsci 13 07472 g005aApplsci 13 07472 g005b
Figure 6. Photos of the experimental setup of the PCTCS: (a) general photo of the PCTCS; (b) photos of the cold distribution, rack back, and server interior.
Applsci 13 07472 g006
Figure 7. Comparison of the results between the simulation and experiment of different CPU load and cooling water temperatures.
Applsci 13 07472 g007
Figure 8. Internal parameter distribution in the PCTCS with default configuration: (a) pressure and pressure drop distribution; (b) thermodynamic quality and void fraction distribution; (c) temperature and heat transfer coefficient distribution.
Applsci 13 07472 g008
Figure 9. Internal parameter distribution in the PCTCS using different refrigerants (R-113, R-134a, and R-32): (a) pressure and total pressure drop distribution; (b) thermodynamic quality and void fraction distribution; (c) temperature distribution; (d) heat transfer coefficient distribution.
Applsci 13 07472 g009
Figure 10. Internal parameter distribution of the PCTCS with different condenser heights: (a) pressure and total pressure drop distribution; (b) frictional and gravity pressure drop distribution; (c) thermodynamic quality and void fraction distribution; (d) temperature distribution; (e) heat transfer coefficient distribution.
Applsci 13 07472 g010
Figure 11. PCTCS parameters in different cooling water temperatures: (a) CPUs’ temperature and the maximum temperature difference between cold and heat sources; (b) pump power and EERp; (c) total pressure drop and subcooling.
Applsci 13 07472 g011
Table 1. Comparison of the results between the simulation and experiment of different refrigerant flows.
Refrigerant Flow (m3/h)Pump Power (W)Total Pressure Drop (kPa)Average CPU Temperature (°C)
Exp.Sim.Exp.Sim.Exp.Sim.
0.12363357.854.762.360.3
0.15424075.075.662.561.1
0.185148101.599.162.662.3
Table 2. Basic geometric parameters of simulation components.
CategoriesConnecting PipesMini-Channel EvaporatorPlate-Type Condenser
Label2-34-56-78-13-4, 5-67-8
Length (m)100.51030.0350.25
Width/Diameter (m)0.0080.0030.0120.0080.0350.111
Height (m)00Variable
(default 0)
Variable
(default 0)
0.0020.25
Heat transfer area (m2)----0.003030.48
Table 3. Simulation results of the PCTCS with default parameters.
ParameterValueParameterValue
Pdt (kPa)83.21Tdt (°C)34.50
Ppump (W)27.9 T ¯ cpu1 (°C)78.72
EERp115 T ¯ cpu2 (°C)79.50
ηcon0.513Tdcpu (°C)0.78
dTsub of the first evaporator inlet (°C)14.44Scpu120.08
dTsub of the condenser outlet (°C)0.78Scpu220.34
Table 4. Simulation results of the PCTCS using different refrigerants: R-113, R-134a, and R-32.
ParameterRefrigerant TypeParameterRefrigerant Type
R-113R-134aR-32R-113R-134aR-32
Pdt (kPa)83.2126.8023.68Tdt (°C)34.5017.9711.82
Ppump (W)27.912.314.3 T ¯ cpu1 (°C)78.7261.6656.48
EERp115260224 T ¯ cpu2 (°C)79.5062.9756.82
ηcon0.5130.6340.792Tdcpu (°C)0.781.310.34
dTsub of the first evaporator inlet (°C)14.510.300.02Scpu120.080.340.02
dTsub of the condenser outlet (°C)0.780.060.02Scpu220.340.260.01
Table 5. Simulation results of the PCTCS with different condenser heights.
ParameterCondenser PositionParameterCondenser Position
Same Height1 m Higher1 m LowerSame Height1 m Higher1 m Lower
Pdt (kPa)83.2178.1492.53Tdt (°C)34.5034.9734.05
Ppump (W)27.926.2730.86 T ¯ cpu1 (°C)78.7279.1678.28
EERp115122104 T ¯ cpu2 (°C)79.5079.9779.05
ηcon0.5130.5180.479Tdcpu (°C)0.780.810.77
dTsub of the first evaporator inlet (°C)14.5113.1717.06Scpu120.080.090.07
dTsub of the condenser outlet (°C)0.78-4.59Scpu220.340.370.31
Disclaimer/Publisher’s Note: The statements, opinions and data contained in all publications are solely those of the individual author(s) and contributor(s) and not of MDPI and/or the editor(s). MDPI and/or the editor(s) disclaim responsibility for any injury to people or property resulting from any ideas, methods, instructions or products referred to in the content.

