Article

Kinetic and Kinematic Analysis of Gait Termination: A Comparison between Planned and Unplanned Conditions

1
Department of Public Health Sciences, Graduate School, Dankook University, Cheonan 31116, Republic of Korea
2
Department of Physical Therapy, College of Health and Welfare Sciences, Dankook University, Cheonan 31116, Republic of Korea
*
Author to whom correspondence should be addressed.
These authors contributed equally to this work.
Appl. Sci. 2023, 13(12), 7323; https://doi.org/10.3390/app13127323
Submission received: 14 May 2023 / Revised: 15 June 2023 / Accepted: 19 June 2023 / Published: 20 June 2023

Abstract

:
Purpose: Gait termination (GT) is the transition from steady-state walking to a complete stop, occurring under planned gait termination (PGT) or unplanned gait termination (UGT) conditions. This study aimed to investigate the biomechanical differences between PGT and UGT, which could help develop therapeutic interventions for individuals experiencing difficulty with GT. Methods: Twenty healthy adults performed three walking trials, followed by PGT and UGT trials. Gait termination was analyzed in three phases as follows: Phase 1 (pre-stopping), Phase 2 (initial stopping phase), and Phase 3 (terminal stopping phase). Spatiotemporal, kinematic, and kinetic data during each phase were compared between conditions. Results: The GT time and GT step length were significantly different between the PGT and UGT trials. Ankle range of motion (ROM) demonstrated significant differences in Phase 1, with the PGT having a slightly lower ankle ROM than the UGT. In Phase 2, the hip, knee, and ankle ROM exhibited significant differences between the conditions. Finally, in Phase 3, UGT showed reduced hip ROM but increased knee ROM and kinetic parameters compared to PGT. Conclusion: Our results indicate that the ankle joint primarily contributes to deceleration during the initial preparation for generating braking force during PGT. Conversely, UGT reveals disrupted kinesthetic control due to instability, leading to a preference for a hip and knee strategy to absorb force and control the center of mass for a safe and rapid GT in response to unexpected stimuli. These findings provide valuable insights into the biomechanical mechanisms underlying body stability during GT and may contribute to the development of effective rehabilitation strategies for individuals with gait impairment.

1. Introduction

Gait termination (GT) corresponds to the transition from steady-state walking to complete stopping [1]. It requires braking forces and postural control, which are necessary to stop the forward momentum, demanding interaction between the biomechanical and neuromuscular systems [2]. GT can be divided into planned gait termination (PGT) and unplanned gait termination (UGT) according to the environmental conditions. PGT refers to the movement reaching or approaching the expected location determined by the interaction between an individual and environmental constraints [3]. In contrast, UGT (i.e., sudden stopping) is a response to unexpected external stimuli that requires the urgency of spontaneous activation of dynamic stability for a complete stop [4]. Gait termination ability is essential for an individual’s safety, to decrease the risk of falling or prevent collision with another person or object under both conditions [5].
Previous studies have reported differences in the mechanisms between these two conditions. PGT relies on a feedforward system to stop at the desired target, whereas UGT relies on a feedback system to control the body’s center of mass in response to unexpected external stimulation [6]. The differences in the feedback systems between PGT and UGT could affect biomechanical and neuromuscular responses [7]. In PGT, anticipation is possible, leading to increased stopping time, decreased force development rate, and peak posterior braking force compared to UGT [4,8]. In contrast, UGT requires the body to increase the braking force and decrease propulsion for a short period to generate a sufficient net braking impulse compared with PGT [4,8]. Therefore, different joint kinematics are required for PGT and UGT.
Many studies have reported on the mechanisms of PGT and UGT using various analyses, including joint kinematics, and kinetics [9,10,11,12]. However, in these studies comparing the two conditions, only the main braking force that occurred during the stopping phase was analyzed. The mechanism of GT has been well-studied; however, studies analyzing biomechanical data by dividing the phases of gait termination, including the pre-stopping phase, are poorly understood. In addition, a previous study on PGT found that gait termination requires an increase in braking impulse and a concomitant decrease in propulsion with a double stance before the stopping phase [2,13]. Therefore, the pre-stopping phase may play a major role in the braking control process.
Our study aimed to investigate biomechanical data during the pre-stopping, initial stopping, and terminal stopping phases of the leading limb to understand the mechanism that prepares and generates braking force in UGT and PGT. We hypothesized that there would be differences in the gait parameters and braking force for stopping strategies depending on the stopping phase. Understanding the biomechanical characteristics of the stopping process may provide information that will be helpful in designing therapeutic interventions for individuals with difficulties with GT.

2. Methods

2.1. Subjects

Twenty healthy adults (ten males and ten females; mean age: 23.95 ± 2.56 years; mean height: 168.90 ± 8.44 cm; mean weight: 64.55 ± 12.95 kg; mean leg length: 86.55 ± 4.54 cm) were recruited for the study. The sample size was calculated using G-power software (G*power 3.1.9.7, Heinrich-Heine-Universität, Düsseldorf, Germany). With an effect size of 0.3, a significance level of 0.05, and a power of 0.80, a minimum of 20 participants was adequate to power the study. None of the participants had a history of musculoskeletal, neurological, or psychiatric diseases that could have affected their gait termination. All subjects completed the self-selected walking trial and two stopping trials: UGT and PGT conditions. All participants provided written informed consent, in accordance with the Declaration of Helsinki. This study was approved by the Institutional Review Board of Dankook University (DKU 2021-03-062).

2.2. Measurements

2.2.1. Motion Analysis System

A six-infrared-camera motion analysis system (Qualisys AB, Goteborg, Sweden) was used to analyze three-dimensional motion, with a sampling rate of 100 Hz [14]. Reflective markers were attached to anatomical landmarks to create a lower extremity model. The Anatomical markers were placed on the anterior superior iliac spine, posterior superior iliac spine, thigh, lateral epicondyle of the femur, medial epicondyle of the femur, shank, lateral malleolus, medial malleolus, calcaneus, and 1st, 2nd, and 5th metatarsal joints according to the CAST model [15]. Static trials were used to define the transformation between the marker arrays and the segment coordinate system.
Visual 3D (C-motion, Inc., Germantown, MD, USA) was used to analyze the spatiotemporal (gait velocity, stride length, normalized stride length, GT time, and GT step length) and kinematic (range of motion (ROM) of the hip, knee, and ankle joints) parameters [16]. The trajectories of the reflective markers were filtered using a second-order low-pass Butterworth filter with a cut-off frequency of 6 Hz.

2.2.2. Force Plates

Kinetic data during the stopping process were collected from two 400 mm × 600 mm force plates (Bertec Corp., Worthington, ON, USA) embedded in the floor at a sampling rate of 1000 Hz. The two force plates were synchronized using a motion analysis system. We mainly analyzed the data of the anterior–posterior ground reaction force because it is associated with propulsive and braking forces in the stopping process. Data on the peak anterior–posterior ground reaction force (GRF-y) and braking force (GRF-y impulse) were collected when gait termination was completed. The braking force was calculated as the area under the negative GRF-y component, and absolute values were used. The GRF data were normalized to the body mass of each individual [17,18].

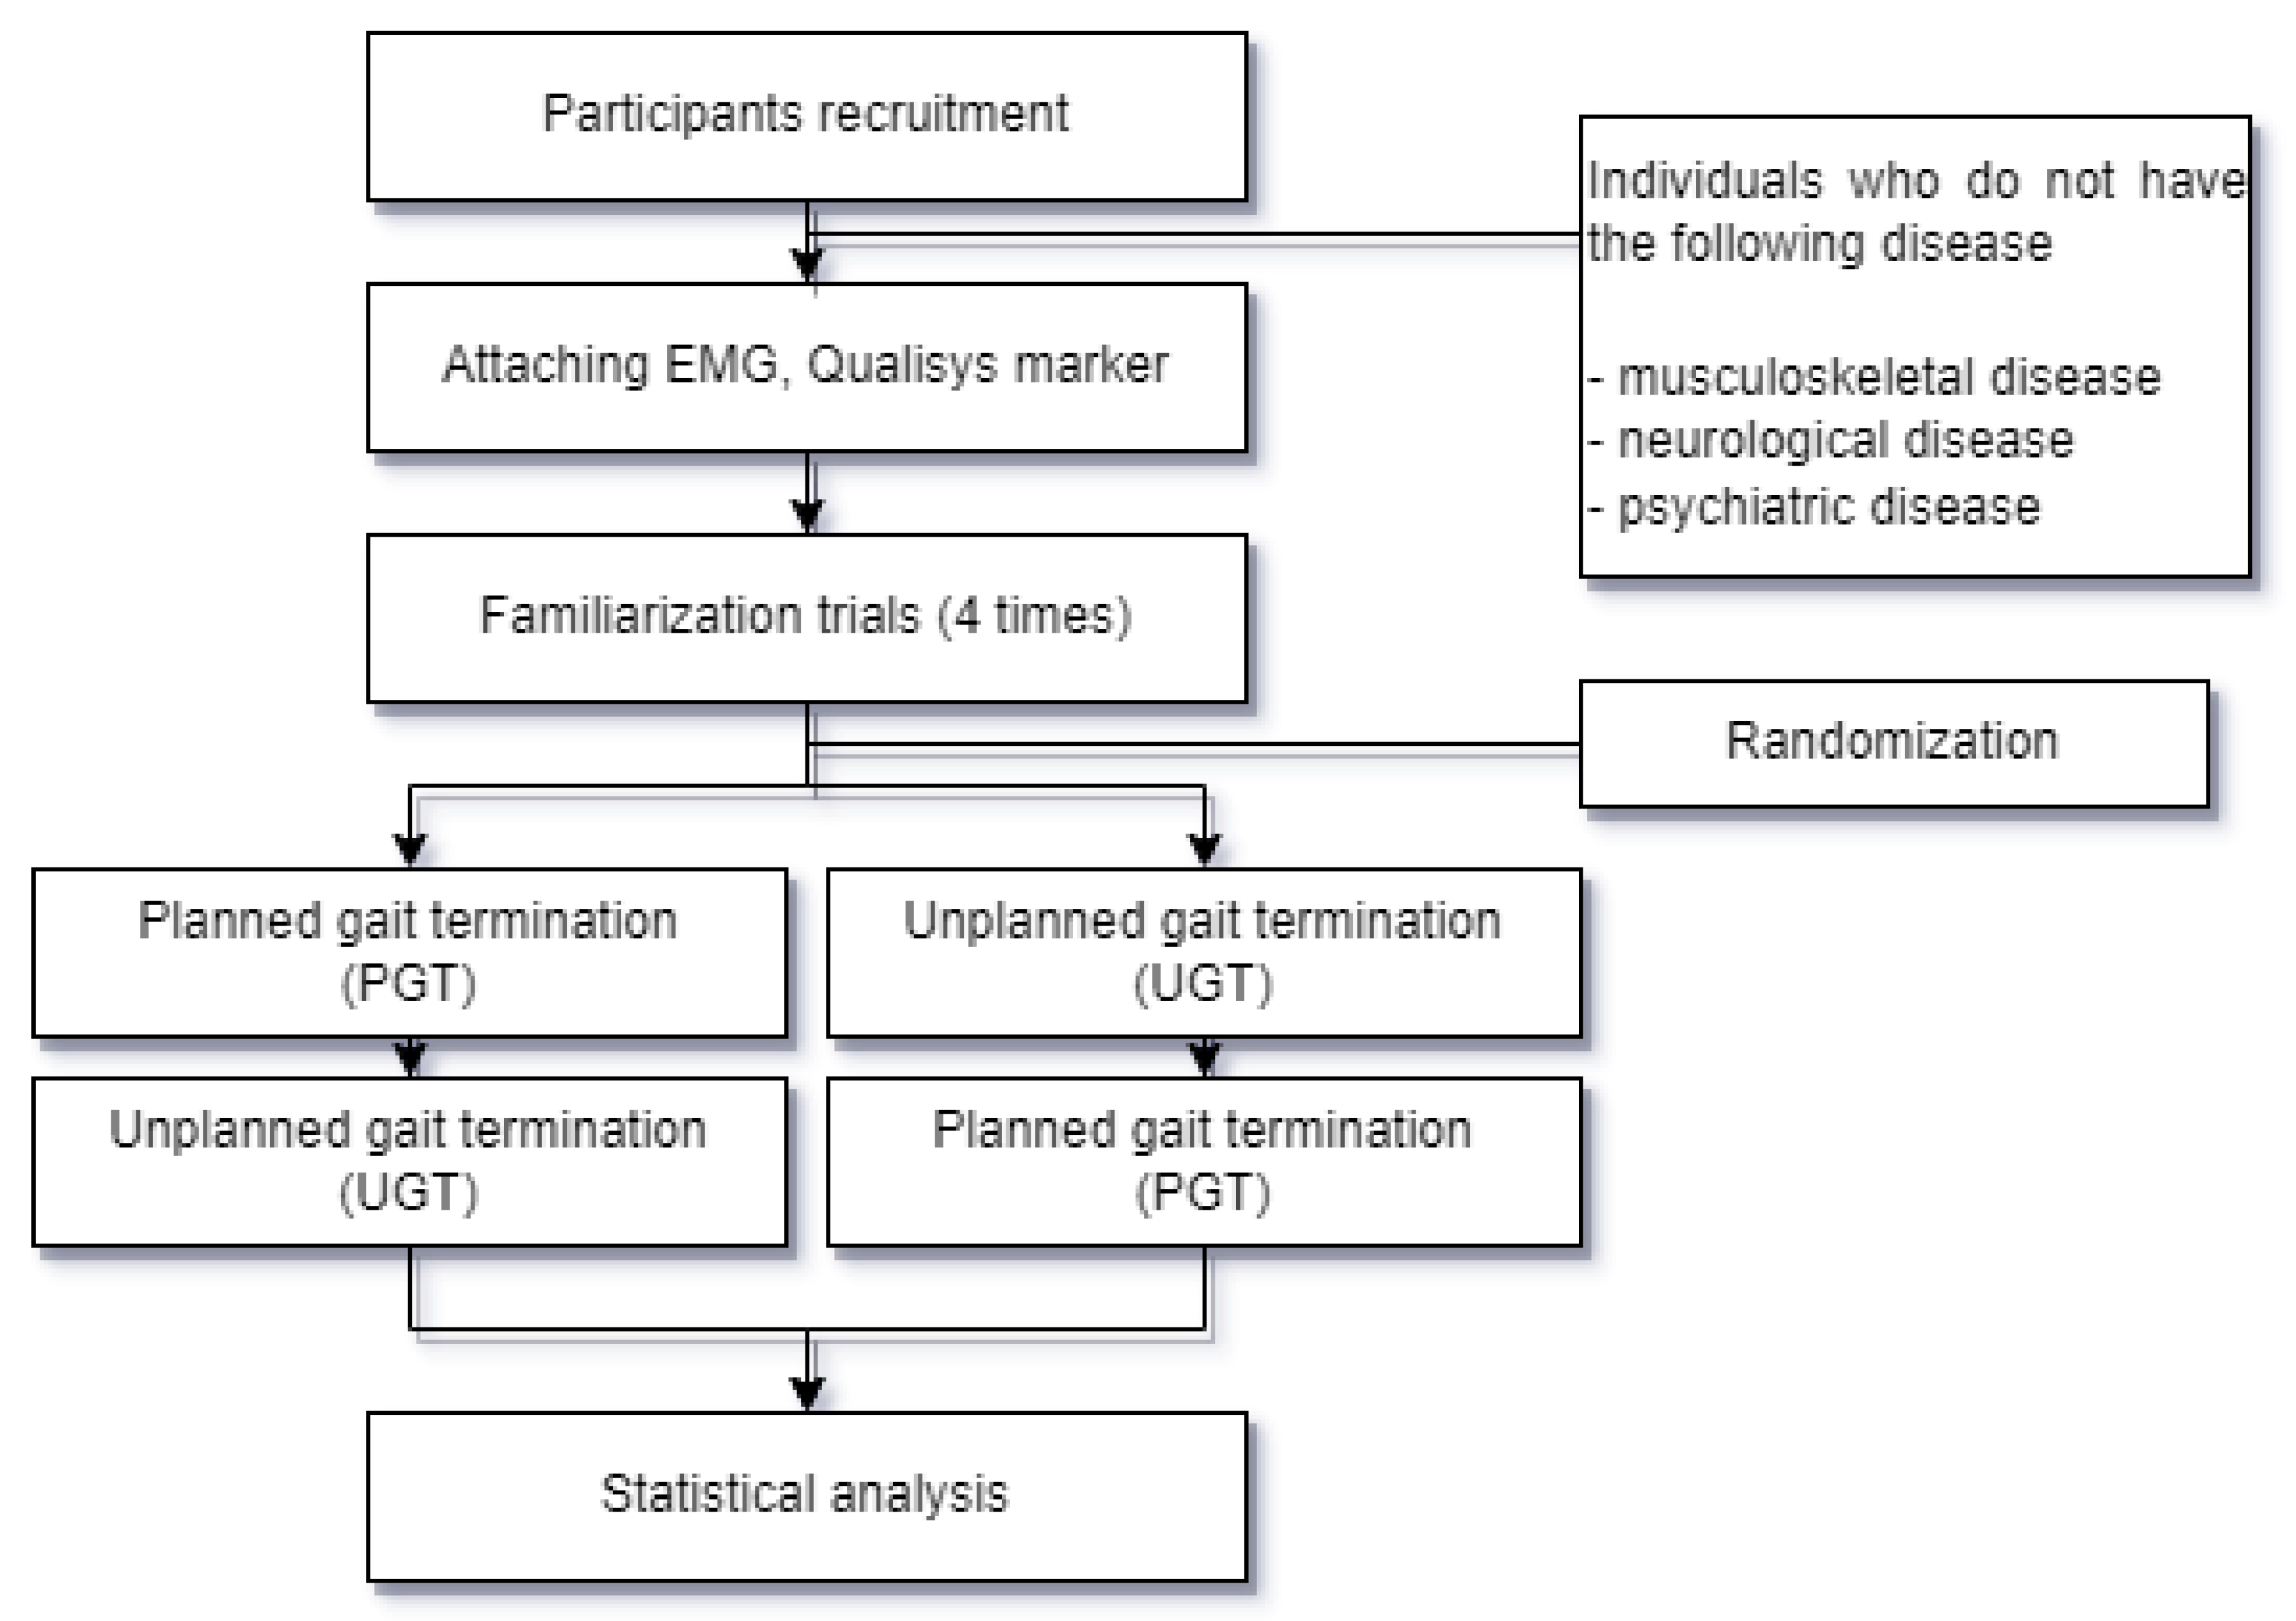
2.2.3. Experimental Procedure

Demographic data, including height, weight, and leg length, were collected before data collection. The researchers attached reflective markers to the subjects for biomechanical measurements. Four familiarization trials were conducted to adjust the starting position before beginning each stopping trial. This enhanced the probability of the foot of the dominant limb being in contact with the first force plate correctly. The starting position was at least four steps away from the first force plate to ensure a self-selected speed. First, each subject performed three walking trials at their self-selected speed along a 10 m walkway without providing a stop signal. The subjects then performed stopping trials in a random order under two different conditions, PGT and UGT, both at their preferred speed [19,20]. The stopping trials were performed similarly to the walking trials, but the subjects were asked to stop upon reaching the force plates [19,20]. That is, their leading limb finished on the second force plate and their trailing limb finished on the ground beside the force plate (PGT condition) or on the first force plate (UGT condition), after which they were required to bring their trailing limbs parallel and maintain an upright standing posture for at least 3 s. In addition, they were asked not to slow down their gait before reaching the force plate [11]. If the participants appeared to have reduced their gait velocity before reaching the force plate, the trial was not analyzed. The trials were repeated until three valid trials were completed.
In the UGT condition, the participants were asked to stop immediately within one step using an auditory signal, without being told beforehand which force plate to stop on. The subjects were asked to “freeze” with their leading limb as soon as they heard the stop signal and then remain in that position for at least 3 s. The auditory stop signal was randomly triggered when the trailing limb contacted the first force plate, that is, GRF-z exceeded 50 N. To prevent the participants from predicting when to stop walking and to eliminate the learning effect, 25% of the UGT trials included the stop signal, whereas the remaining 75% did not contain a stop signal [4]. At least three trials were conducted when the leading limb landed on the second force plate without excessive steps and deceleration. Data were analyzed only when both feet were successfully placed on their respective force plates [19]. There was a 10-min rest interval between the PGT and UGT conditions to reduce the effects of fatigue on the experimental results. The PGT and UGT conditions were counterbalanced across the participants to minimize potential order effects (Figure 1).

2.2.4. Data Analysis

Gait termination was defined as when the center of mass (COM) progression velocity was less than 0.05 m/s in the anteroposterior (AP) direction [18]. In this study, gait termination was divided into three phases based on the identifiable vertical ground reaction force (GRF-z) landmarks [21]. Phase 1 was set from the time when the heel of the trailing limb made contact with the first force plate until the GRF-z of the trailing limb reached the mid-stance valley. Phase 2 was set from when the GRF-z of the trailing limb reached the mid-stance valley until the heel of the leading limb reached the second force plate. Phase 3 was set from when the heel of the leading limb made contact with the second force plate until the COM progression velocity falls below 0.05 m/s in the AP direction. Therefore, Phase 1 corresponds to the pre-stopping phase, in which gait deceleration occurs, and Phases 2 and 3, where the main braking occurs, correspond to the initial and terminal stopping phases, respectively (Figure 2). We mainly analyzed the data of the leading limb in each phase because the leading limb plays a more important role in gait termination than the trailing limb. The gait termination time was defined as the time interval between Phases 1 and 3. The gait termination step length was calculated as the AP distance between the trailing and leading limb heel contacts. The gait termination step length was normalized to an individual’s leg length. Gait velocity was calculated by referring to a marker placed on the sacrum [22]. In addition, the kinetic and kinematic parameters of the leading limb were analyzed during each phase. For the walking trial data, only Phases 1 and 2 were analyzed because data from Phase 3 could not be obtained.

2.2.5. Statistical Analysis

Statistical analysis was performed using SPSS software (version 21.0; SPSS Inc., Chicago, IL, USA). The Shapiro–Wilk test was used to assess the normality of the outcome measures. Descriptive statistics were computed for all the demographic and outcome measures. The independent variables were the gait conditions (walking, PGT, and UGT). The dependent variables were the spatiotemporal (gait velocity, stride length, normalized stride length, GT time, and GT step length), kinematic (ROM of the hip, knee, and ankle joints), and kinetic (peak GRF-y and GRF-y impulses) data. The non-parametric Friedman test was used to analyze differences in kinematic and spatiotemporal data, excluding GT time and GT step length between conditions. Bonferroni-adjusted post hoc Wilcoxon signed-rank tests were used to compare individual pairs of conditions, and a p-value of less than 0.017 was considered statistically significant [23]. The Wilcoxon signed-rank test was used to analyze the differences in kinematic, kinetic, and spatiotemporal data (GT time and GT step length) between the PGT and UGT conditions. Statistical significance was set at p < 0.05.

3. Results

Table 1 shows the spatiotemporal data according to the walking, PGT, and UGT conditions. There were no significant differences in the gait velocity, stride length, and normalized stride length between the conditions (p > 0.05). The GT time and GT step length were significantly different between PGT and UGT (p < 0.05).
In Phase 1, there were no significant differences in the hip and knee ROM between the conditions (p > 0.05), but there was a significant difference in the ankle ROM (p < 0.05) (Table 2). The results of the post hoc analysis showed that the ankle ROM of the PGT was slightly lower than that of the UGT (p < 0.017). As shown in Table 2, there were significant differences in the hip, knee, and ankle ROM between the conditions in Phase 2 (p < 0.05). The hip ROM was slightly greater during walking than during PGT. The knee ROM in the UGT was slightly greater than that in PGT. The ankle ROM in walking was slightly lower than in PGT and UGT (p < 0.017). Table 2 shows the kinematic and kinetic parameters in Phase 3 during the PGT and UGT. Compared to PGT, hip ROM was significantly lower, but knee ROM was significantly greater in UGT (p < 0.05) (Figure 3). In addition, all kinetic parameters in UGT were significantly greater than those in PGT (p < 0.05). However, there was no significant difference in the ankle angle between PGT and UGT (p > 0.05).

4. Discussion

The purpose of this study was to investigate the spatiotemporal, kinematic, and kinetic parameters of the leading limb during walking, PGT, and UGT to comprehend the mechanism that prepares and generates the braking force during the pre-stopping, initial stopping, and terminal stopping phases. Our results showed that both planned and unplanned stopping were similar to usual walking in terms of the spatiotemporal parameters. An exception to this occurred between PGT and UGT. In our results, the GT time during the PGT trial was greater than that during the UGT trial, which may be due to the pre-informed foot positioning of where to stop in the PGT trial [10,24]. The subjects were asked to stop with their feet parallel to a designated force plate during the PGT trial. However, it was rare to keep the feet parallel in the UGT trial. A previous study has shown that planned stopping takes approximately 0.5s longer than unplanned stopping because of the additional time required to place the feet parallel [24]. However, in our study, the GT step length during UGT was greater than that during PGT. This difference may be attributed to the effective control of the COM to acquire dynamic stability during the PGT and UGT trials. In a previous study, when gait was terminated due to an unexpected stimulus, the body absorbed the sudden increase in the GRF and showed gait termination with a long stride length as a reaction to control the movement of the COM [25]. Therefore, it is thought that the braking force was applied by increasing the stride length to stop while maintaining stability in response to the unexpected stop signal because of the lack of a pre-informed stopping point in the UGT condition in our study.
In this study, we subdivided gait termination into three phases based on previous studies to compare the differences in kinematic and kinetic parameters between gait conditions [2,26,27]. Phase 1 consisted of the last stride prior to stopping, from heel contact of the trailing limb to maximal advancement of the mid-stance, where propulsive force occurs in stance phases. In this phase, the leading limb enters the pre-swing, initial swing, and mid-swing phases, which involve lifting the foot off the ground, moving forward, and accelerating the swing [28]. The swing limb is not only rapidly accelerated forward by ankle plantar flexion during the pre-swing to generate propulsive force but also rapidly accelerated forward by ankle dorsiflexion during the initial swing, increasing the angular velocity to advance [28,29]. During Phase 1, there were no significant differences in the hip and knee ROM between the gait conditions, except for the ankle ROM. In addition, the ankle ROM was significantly lower in the PGT trial than in the UGT trial. These results can be explained by the decrease in propulsive force at gait termination in response to a stop signal [18,30]. According to the reported literature, for this time, a 10% reduction in gait velocity was observed in the PGT trial, and the period of generating propulsive force was reduced compared with walking. In the PGT condition, participants exhibited lower peak plantar flexion during pre-swing and less dorsiflexion after toe-off, compared to the UGT condition [31]. This strategy decelerates advancement by decreasing dorsiflexion during the swing phase [32,33]. Therefore, in the PGT condition, the ankle joint is considered to predominantly contribute to deceleration in the initial preparation for generating the braking force [32,33]. In contrast, in the UGT condition, the subjects had to respond to an unexpected stop signal during Phase 1. When unexpected stimulation forces the body to stop walking suddenly, dynamic stability is disrupted because it does not have enough response processes [34,35]. Subsequently, the ankle joint during this period would not be successful in generating braking forces owing to instability and disturbing kinesthetic control [19,34,35].
Phase 2 is a major braking phase that reduces gait velocity by 60–70% and includes the terminal swing of the leading limb [36]. Previous studies have emphasized the importance of rapid variability in ankle joints and control of plantar flexion moment for generating braking force [37,38]. Our results were consistent with those of a previous study, which showed greater ankle ROM during both PGT and UGT, compared to walking [4,39]. In addition, greater knee ROM was observed in UGT than in the PGT [4]. Previous studies have reported that the hip and knee strategy that absorbs forces and controls the movement of the COM is preferred to complete gait termination safely and quickly in response to an unexpected stimulus. Greater hip and knee flexion allow subjects to increase the braking force faster to reach a COM stop [25,32,40]. Previous findings suggest that hip and knee kinematic information is the primary variable of interest in gait termination [4,25]. However, in our results, a lower hip ROM was observed during PGT than during walking, which is thought to be associated with a shorter step length in PGT because the gait velocity was similar between the three conditions. In addition, step length positively correlated with hip ROM [41]. For example, during the PGT trial, most subjects landed posteriorly in both walking and UGT foot positions, resulting in shorter step lengths. Perhaps subjects in the PGT trial prepared for deceleration by relying on the ankle joint rather than the hip and knee joints to absorb force and control the COM motion in the terminal swing.
In Phase 3, differences in joint motion between PGT and UGT were investigated to elucidate the mechanisms underlying body stability during gait termination. The results showed that the UGT trial exhibited a significantly lower hip ROM and significantly greater knee ROM than the PGT trial. The COM during UGT is moved backward to stretch the hip joint, and knee flexion is increased to stably convert forward inertia [8]. However, ankle ROM did not show a statistically significant difference between the PGT and UGT trials. This may be because the body primarily focuses on stabilization and the ankle joint is not actively involved in generating the braking force. These findings suggest that during PGT, gait can be terminated while gradually maintaining the stability of the whole body through external rotation of the hip joint and slight flexion of the knee joint [32,42,43].
From the perspective of ground reaction forces (GRF) occurring in Phase 3, when an individual suddenly stops their gait (i.e., during UGT), both vertical and anteroposterior (A-P) GRF increase abruptly. This is because of the need to counter the body’s forward momentum, which generates significant rearward stimuli [40,44]. In addition, the vertical impulse increases to provide support to the body during deceleration [45]. The magnitude of the GRF varies according to an individual’s velocity, mass, deceleration duration, and extent [45]. In this study, we observed no significant differences in the velocity and mass of the subjects, implying that the differences in the GRF magnitude arise from the characteristics of the push-off and unloading phases of gait. Our findings suggest that the unloading phase can rapidly adjust the GRF to counteract forward momentum and maintain equilibrium.
This study has several limitations. First, the study was conducted on healthy young adults; therefore, the findings may not be generalizable to other populations with gait impairment. Second, the study only focused on spatiotemporal, kinematic, and kinetic parameters and did not consider other factors that may affect gait termination, such as cognitive and neurological factors. In addition, the study only investigated gait termination on level ground and did not consider gait termination on inclines or declines. Finally, this study only investigated gait termination at one designated force plate during PGT, which may limit the generalizability of the findings to other stopping locations.

5. Conclusions

In conclusion, this study found that, in the context of gait termination, the ankle joint plays a predominant role in decelerating the body during the initial preparation for generating braking force in the PGT condition. Conversely, in the UGT condition, instability of the ankle joint disrupts kinesthetic control and hinders the generation of braking forces. Consequently, a strategy that involves the hip and knee, focusing on force absorption and control of the center of mass, is preferred for safe and rapid gait termination in response to unexpected stimuli. These findings provide valuable insights into the biomechanical mechanisms underlying body stability during walking cessation and may facilitate the development of more effective rehabilitation strategies for individuals with walking impairments.

Author Contributions

Methodology, S.-H.Y. and D.-K.K.; Formal analysis, C.-W.K. and S.-H.Y.; Investigation, C.-W.K. and S.-H.Y.; Data curation, C.-W.K. and D.-K.K.; Writing—original draft, C.-W.K., D.-K.K. and J.-W.K.; Writing—review & editing, D.-K.K. and J.-W.K.; Visualization, D.-K.K.; Supervision, S.-H.Y. and J.-W.K.; Project administration, S.-H.Y. and J.-W.K.; Funding acquisition, J.-W.K. All authors have read and agreed to the published version of the manuscript.

Funding

This research was supported by the Basic Science Research Program through the National Research Foundation of Korea (NRF), funded by the Ministry of Education, Science and Technology (NRF-2021R1F1A1052236).

Institutional Review Board Statement

The study was conducted according to the guidelines of the Declaration of Helsinki and approved by the Institutional Review Board of Dankook University (DKU 2021-03-062).

Informed Consent Statement

Informed consent was obtained from all subjects involved in the study.

Data Availability Statement

The data presented in this study are available from the corresponding author upon request.

Conflicts of Interest

The authors declare no conflict of interest.

References

  1. Cimolin, V.; Cau, N.; Galli, M.; Santovito, C.; Grugni, G.; Capodaglio, P. Gait initiation and termination strategies in patients with Prader-Willi syndrome. J. Neuroeng. Rehabil. 2017, 14, 44. [Google Scholar] [CrossRef] [PubMed] [Green Version]
  2. Ryckewaert, G.; Delval, A.; Bleuse, S.; Blatt, J.-L.; Defebvre, L. Biomechanical mechanisms and centre of pressure trajectory during planned gait termination. Neurophysiol. Clin./Clin. Neurophysiol. 2014, 44, 227–233. [Google Scholar] [CrossRef]
  3. Lynch, J.; Robertson, D. Biomechanics of planned gait termination. J. Biomech. 2007, 40, S500. [Google Scholar] [CrossRef]
  4. Cen, X.; Lu, Z.; Baker, J.S.; István, B.; Gu, Y. A comparative biomechanical analysis during planned and unplanned gait termination in individuals with different arch Stiffnesses. Appl. Sci. 2021, 11, 1871. [Google Scholar] [CrossRef]
  5. Jung, S.; Yi, J.; Song, C. Biomechanical alterations of gait termination in middle-aged and elderly women. J. Phys. Ther. Sci. 2016, 28, 861–867. [Google Scholar] [CrossRef] [Green Version]
  6. Cen, X.; Yu, P.; Song, Y.; Sárosi, J.; Mao, Z.; Bíró, I.; Gu, Y. The Effect of Arch Stiffness on the Foot–Ankle Temporal Kinematics during Gait Termination: A Statistical Nonparametric Mapping Study. Bioengineering 2022, 9, 703. [Google Scholar] [CrossRef]
  7. Zhang, S.; Li, L. Feedforward and feedback control for gait and balance. Gait Biom. 2014, 191–205. [Google Scholar]
  8. Ridge, S.T.; Henley, J.; Manal, K.; Miller, F.; Richards, J.G. Kinematic and kinetic analysis of planned and unplanned gait termination in children. Gait Posture 2013, 37, 178–182. [Google Scholar] [CrossRef] [Green Version]
  9. Roeing, K.L.; Moon, Y.; Sosnoff, J.J. Unplanned gait termination in individuals with multiple sclerosis. Gait Posture 2017, 53, 168–172. [Google Scholar] [CrossRef]
  10. Sparrow, W.; Tirosh, O. Gait termination: A review of experimental methods and the effects of ageing and gait pathologies. Gait Posture 2005, 22, 362–371. [Google Scholar] [CrossRef]
  11. Koo, D.-K.; Kwon, J.-W. Biomechanical Analysis of Unplanned Gait Termination According to a Stop-Signal Task Performance: A Preliminary Study. Brain Sci. 2023, 13, 304. [Google Scholar] [CrossRef]
  12. Zhou, H.; Cen, X.; Song, Y.; Ugbolue, U.C.; Gu, Y. Lower-limb biomechanical characteristics associated with unplanned gait termination under different walking speeds. JoVE (J. Vis. Exp.) 2020, 162, e61558. [Google Scholar]
  13. Cen, X.; Xu, D.; Baker, J.S.; Gu, Y. Association of arch stiffness with plantar impulse distribution during walking, running, and gait termination. Int. J. Environ. Res. Public Health 2020, 17, 2090. [Google Scholar] [CrossRef] [PubMed] [Green Version]
  14. Bautmans, I.; Jansen, B.; Van Keymolen, B.; Mets, T. Reliability and clinical correlates of 3D-accelerometry based gait analysis outcomes according to age and fall-risk. Gait Posture 2011, 33, 366–372. [Google Scholar] [CrossRef]
  15. Cappozzo, A.; Catani, F.; Della Croce, U.; Leardini, A. Position and orientation in space of bones during movement: Anatomical frame definition and determination. Clin. Biomech. 1995, 10, 171–178. [Google Scholar] [CrossRef]
  16. Buczek, F.L.; Rainbow, M.J.; Cooney, K.M.; Walker, M.R.; Sanders, J.O. Implications of using hierarchical and six degree-of-freedom models for normal gait analyses. Gait Posture 2010, 31, 57–63. [Google Scholar] [CrossRef] [PubMed]
  17. Fournier, B. Model and Characterization of a Passive Biomimetic Ankle for Lower Extremity Powered Exoskeleton. Ph.D. Thesis, Université d’Ottawa/University of Ottawa, Ottawa, ON, Canada, 2018. [Google Scholar]
  18. Rum, L.; Brasiliano, P.; Vannozzi, G.; Laudani, L.; Macaluso, A. Non-specific chronic low back pain elicits kinematic and neuromuscular changes in walking and gait termination. Gait Posture 2021, 84, 238–244. [Google Scholar] [CrossRef]
  19. Wikstrom, E.A.; Bishop, M.D.; Inamdar, A.D.; Hass, C.J. Gait termination control strategies are altered in chronic ankle instability subjects. Med. Sci. Sport. Exerc. 2010, 42, 197–205. [Google Scholar] [CrossRef] [Green Version]
  20. Wikstrom, E.A.; Hass, C.J. Gait termination strategies differ between those with and without ankle instability. Clin. Biomech. 2012, 27, 619–624. [Google Scholar] [CrossRef]
  21. Svoboda, Z.; Bizovska, L.; Janura, M.; Kubonova, E.; Janurova, K.; Vuillerme, N. Variability of spatial temporal gait parameters and center of pressure displacements during gait in elderly fallers and nonfallers: A 6-month prospective study. PLoS ONE 2017, 12, e0171997. [Google Scholar] [CrossRef] [Green Version]
  22. Pirker, W.; Katzenschlager, R. Gait disorders in adults and the elderly: A clinical guide. Wien. Klin. Wochenschr. 2017, 129, 81–95. [Google Scholar] [CrossRef] [Green Version]
  23. Wong, D.W.-C.; Lam, W.-K.; Lee, W.C.-C. Gait asymmetry and variability in older adults during long-distance walking: Implications for gait instability. Clin. Biomech. 2020, 72, 37–43. [Google Scholar] [CrossRef]
  24. Jaeger, R.; Vanitchatchavan, P. Ground reaction forces during termination of human gait. J. Biomech. 1992, 25, 1233–1236. [Google Scholar] [CrossRef]
  25. Ridge, S.T.; Henley, J.; Manal, K.; Miller, F.; Richards, J.G. Biomechanical analysis of gait termination in 11–17 year old youth at preferred and fast walking speeds. Hum. Mov. Sci. 2016, 49, 178–185. [Google Scholar] [CrossRef]
  26. Conte, C.; Serrao, M.; Casali, C.; Ranavolo, A.; Silvia, M.; Draicchio, F.; Di Fabio, R.; Monami, S.; Padua, L.; Iavicoli, S. Planned gait termination in cerebellar ataxias. Cerebellum 2012, 11, 896–904. [Google Scholar] [CrossRef]
  27. Vaverka, F.; Elfmark, M.; Svoboda, Z.; Janura, M. System of gait analysis based on ground reaction force assessment. Acta Gymnica 2015, 45, 187–193. [Google Scholar] [CrossRef] [Green Version]
  28. Whittle, M.W. Gait Analysis: An Introduction; Butterworth-Heinemann: Oxford, UK, 2014. [Google Scholar]
  29. Kharb, A.; Saini, V.; Jain, Y.; Dhiman, S. A review of gait cycle and its parameters. Int. J. Comput. Eng. Manag. 2011, 13, 78–83. [Google Scholar]
  30. Tirosh, O.; Sparrow, W. Gait termination in young and older adults: Effects of stopping stimulus probability and stimulus delay. Int. J. Comput. Eng. Manag. 2004, 19, 243–251. [Google Scholar] [CrossRef] [PubMed]
  31. Webster, J.; Darter, B. Principles of Normal and Pathologic Gait; Atlas of orthoses and Assistive Devices; Elsevier: Amsterdam, The Netherlands, 2019; pp. 46–62. [Google Scholar]
  32. Shen, X.-A.; Cen, X.; Song, Y. Investigating Temporal Kinematic Differences Caused by Unexpected Stimulation during Gait Termination through the Waveform-Level Variance Equality Test. BioMed Res. Int. 2022, 2022, 4043426. [Google Scholar] [CrossRef]
  33. Cen, X.; Gao, L.; Yang, M.; Liang, M.; Bíró, I.; Gu, Y. Arch-support induced changes in foot-ankle coordination in young males with flatfoot during unplanned gait termination. J. Clin. Med. 2021, 10, 5539. [Google Scholar] [CrossRef]
  34. Oates, A.R.; Patla, A.E.; Frank, J.S.; Greig, M.A. Control of dynamic stability during gait termination on a slippery surface. J. Neurophysiol. 2005, 93, 64–70. [Google Scholar] [CrossRef] [PubMed] [Green Version]
  35. Oates, A.R.; Frank, J.S.; Patla, A.E. Control of dynamic stability during adaptation to gait termination on a slippery surface. Exp. Brain Res. 2010, 201, 47–57. [Google Scholar] [CrossRef] [PubMed]
  36. Arnold, A.S.; Thelen, D.G.; Schwartz, M.H.; Anderson, F.C.; Delp, S.L. Muscular coordination of knee motion during the terminal-swing phase of normal gait. J. Biomech. 2007, 40, 3314–3324. [Google Scholar] [CrossRef] [PubMed] [Green Version]
  37. Kobayashi, T.; Singer, M.L.; Orendurff, M.S.; Gao, F.; Daly, W.K.; Foreman, K.B. The effect of changing plantarflexion resistive moment of an articulated ankle–foot orthosis on ankle and knee joint angles and moments while walking in patients post stroke. Clin. Biomech. 2015, 30, 775–780. [Google Scholar] [CrossRef] [Green Version]
  38. Ugbolue, U.C.; Robson, C.; Donald, E.; Speirs, K.L.; Dutheil, F.; Baker, J.S.; Dias, T.; Gu, Y. Joint angle, range of motion, force, and moment assessment: Responses of the lower limb to ankle plantarflexion and dorsiflexion. Appl. Bionics Biomech. 2021, 2021, 1–13. [Google Scholar] [CrossRef]
  39. Brockett, C.L.; Chapman, G.J. Biomechanics of the ankle. Orthop. Trauma 2016, 30, 232–238. [Google Scholar] [CrossRef] [Green Version]
  40. Bishop, M.; Brunt, D.; Pathare, N.; Patel, B. The effect of velocity on the strategies used during gait termination. Gait Posture 2004, 20, 134–139. [Google Scholar] [CrossRef]
  41. JudgeRoy, J.O.; Davis, B., III; Õunpuu, S.J. Step length reductions in advanced age: The role of ankle and hip kinetics. J. Gerontol. Ser. A Biol. Sci. Med. Sci. 1996, 51, M303–M312. [Google Scholar] [CrossRef]
  42. Cen, X.; Biro, I.; Gu, Y. Impacts of Different Arch Stiffness on Lower Extremity Joint Kinematics during Unexpected Gait Termination. In Proceedings of the 2022 International Conference on Intelligent Medicine and Health, Xiamen, China, 19–21 August 2022; pp. 14–18. [Google Scholar]
  43. Dugan, S.A.; Bhat, K.P. Biomechanics and analysis of running gait. Phys. Med. Rehabil. Clin. 2005, 16, 603–621. [Google Scholar] [CrossRef]
  44. Jian, Y.; Winter, D.A.; Ishac, M.G.; Gilchrist, L. Trajectory of the body COG and COP during initiation and termination of gait. Gait Posture 1993, 1, 9–22. [Google Scholar] [CrossRef]
  45. Peterson, C.L.; Kautz, S.A.; Neptune, R.R. Braking and propulsive impulses increase with speed during accelerated and decelerated walking. Gait Posture 2011, 33, 562–567. [Google Scholar] [CrossRef] [PubMed] [Green Version]
Figure 1. Flowchart of the experimental procedure.
Applsci 13 07323 g001
Figure 2. Phase of planned and unplanned gait terminations.
Applsci 13 07323 g002
Figure 3. Comparison of joint range of motion between the walking and gait termination trials across phases. Walking, walking trial; PGT, planned gait termination; UGT, unplanned gait termination. * Significant difference in range of motion between conditions (p < 0.05).
Applsci 13 07323 g003
Table 1. Comparison of spatiotemporal data between gait conditions.
WalkingPGTUGTp-Value
Stride length (m)1.27 ± 0.121.25 ± 0.091.28 ± 0.120.350
Normalized stride length (ratio)1.47 ± 0.101.45 ± 0.111.48 ± 0.100.350
Gait velocity (m/s)1.16 ± 0.121.11 ± 0.101.14 ± 0.120.076
GT time (s)-0.86 ± 0.100.58 ± 0.14<0.001 *
GT step length (m)-0.59 ± 0.050.66 ± 0.070.002 *
GT, gait termination; alking, walking trial; PGT, planned gait termination trial; UGT, unplanned gait termination trial; GRF, ground reaction force; * p < 0.05.
Table 2. Comparison of kinematic and kinetic parameters across different gait conditions.
WalkingPGTUGTp-ValuePost Hoc
ROM
(°)
Phase 1Hip joint36.23 ± 4.2236.64 ± 2.5736.21 ± 4.010.638
Knee joint48.86 ± 4.9948.62 ± 5.6149.90 ± 4.590.387
Ankle joint29.41 ± 5.4127.35 ± 4.9629.71 ± 4.120.032 *b < c
Phase 2Hip joint5.48 ± 0.914.15 ± 1.364.73 ± 1.370.006 *a > b
Knee joint52.77 ± 5.5148.57 ± 7.6254.50 ± 4.630.004 *b < c
Ankle joint7.05 ± 4.828.44 ± 5.408.80 ± 4.380.001 *a < b, c
Phase 3Hip joint-23.30 ± 3.3310.07 ± 3.97<0.001 *
Knee joint-10.66 ± 6.5514.28 ± 6.780.010 *
Ankle joint-14.09 ± 4.6214.38 ± 2.800.217
GRF
(N/kg)
Peak GRF-0.21 ± 0.050.34 ± 0.08<0.001 *
GRF impulse-0.08 ± 0.020.09 ± 0.02<0.001 *
ROM, range of motion; GRF, ground reaction force; walking, walking trial; PGT, planned gait termination trial; UGT, unplanned gait termination trial; * p < 0.05.
Disclaimer/Publisher’s Note: The statements, opinions and data contained in all publications are solely those of the individual author(s) and contributor(s) and not of MDPI and/or the editor(s). MDPI and/or the editor(s) disclaim responsibility for any injury to people or property resulting from any ideas, methods, instructions or products referred to in the content.

