
Application of Sonic, Hygrometric Tests and Infrared Thermography for Diagnostic Investigations of Wall Paintings in St. Panfilo’s Church

 , ,
, ,  , , and
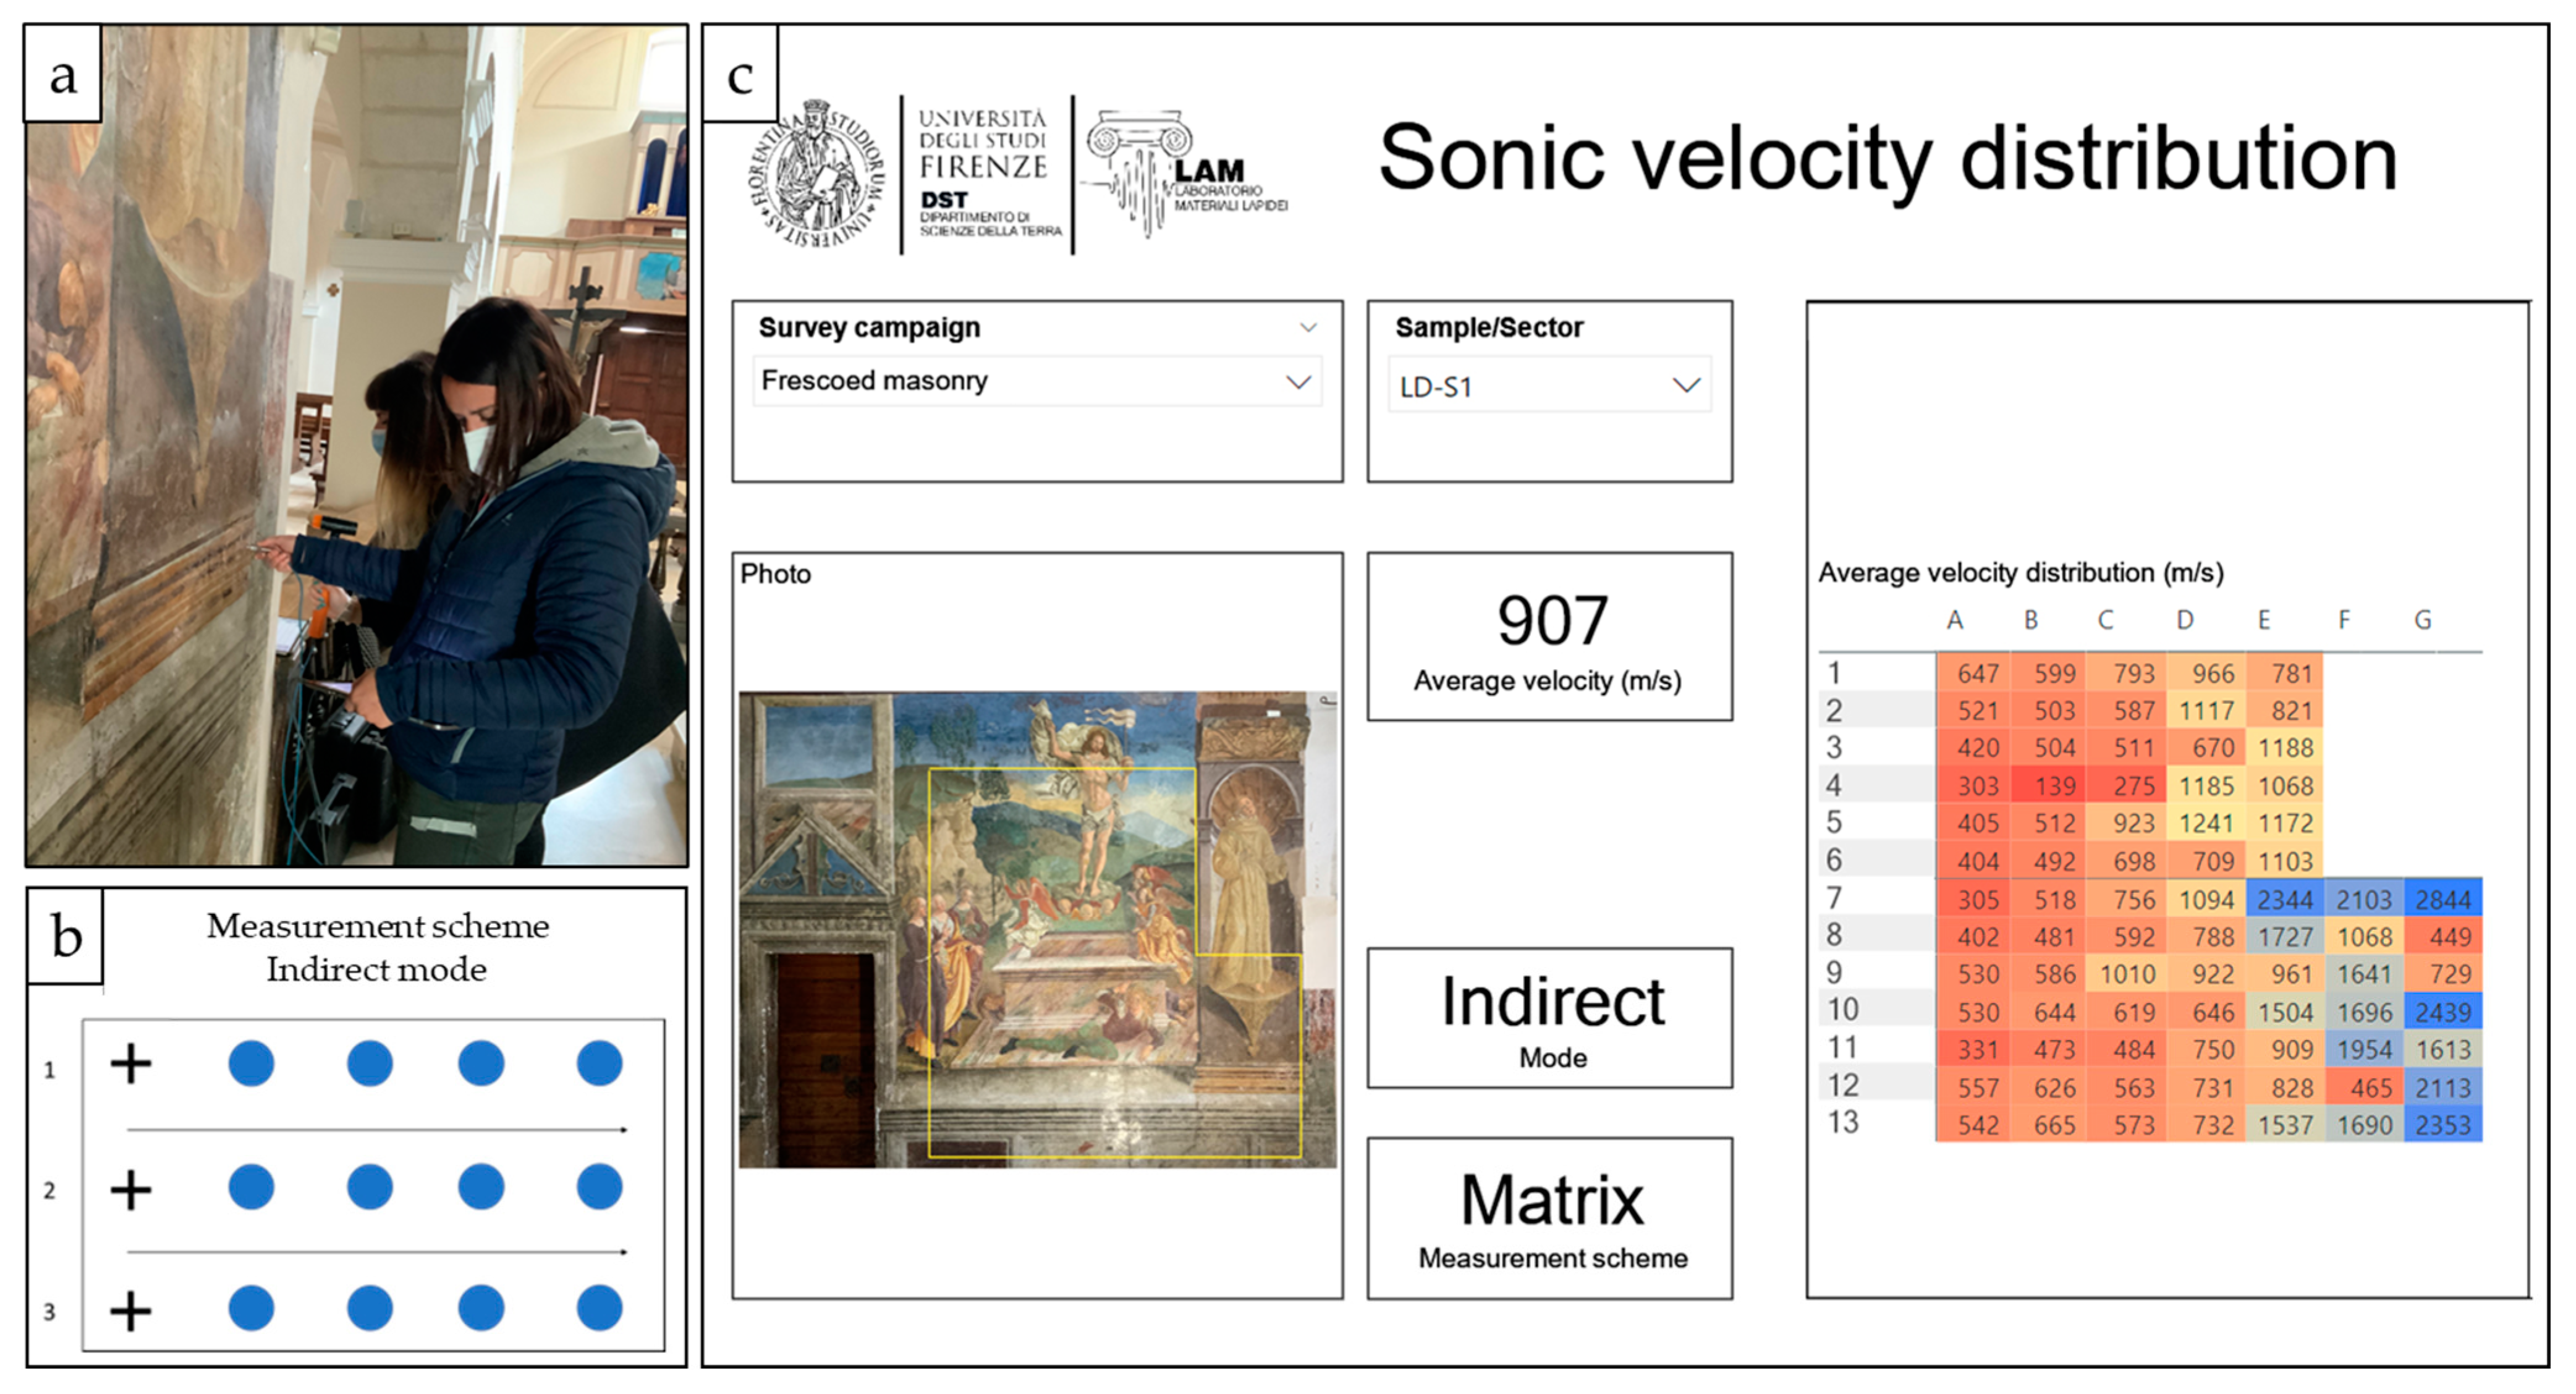
Abstract
:Featured Application
Abstract
1. Introduction
2. Methods
2.1. SPV and HT Data Collection and Imaging Procedure
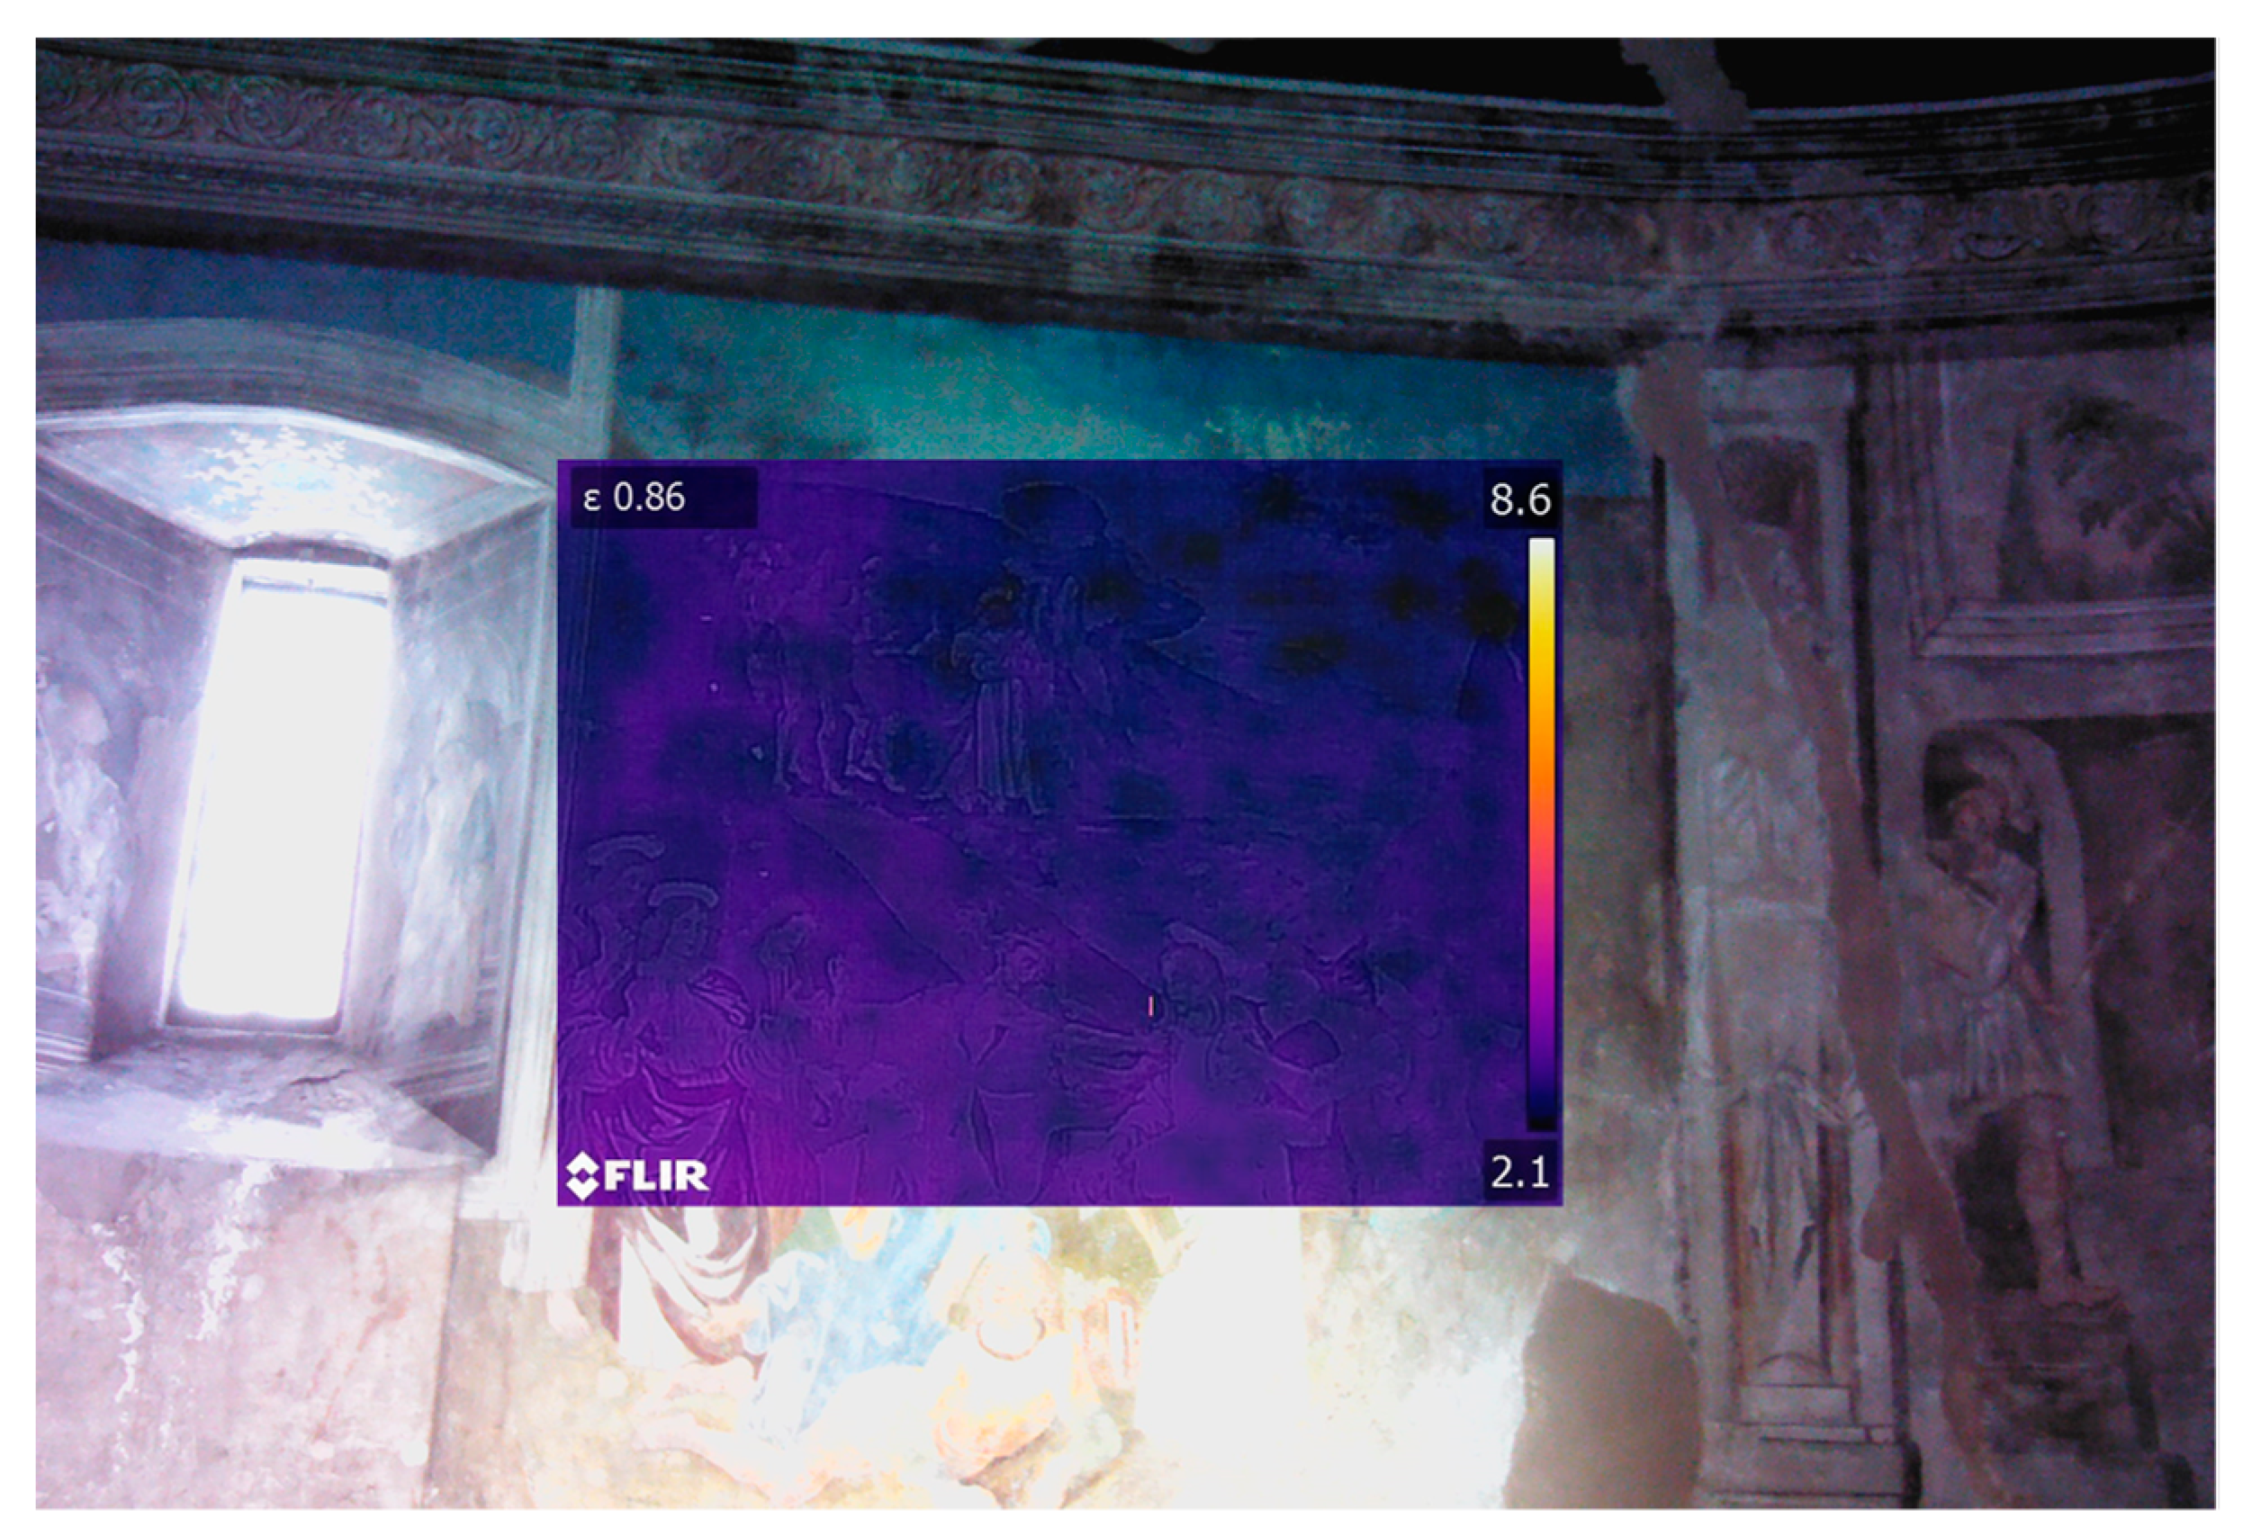
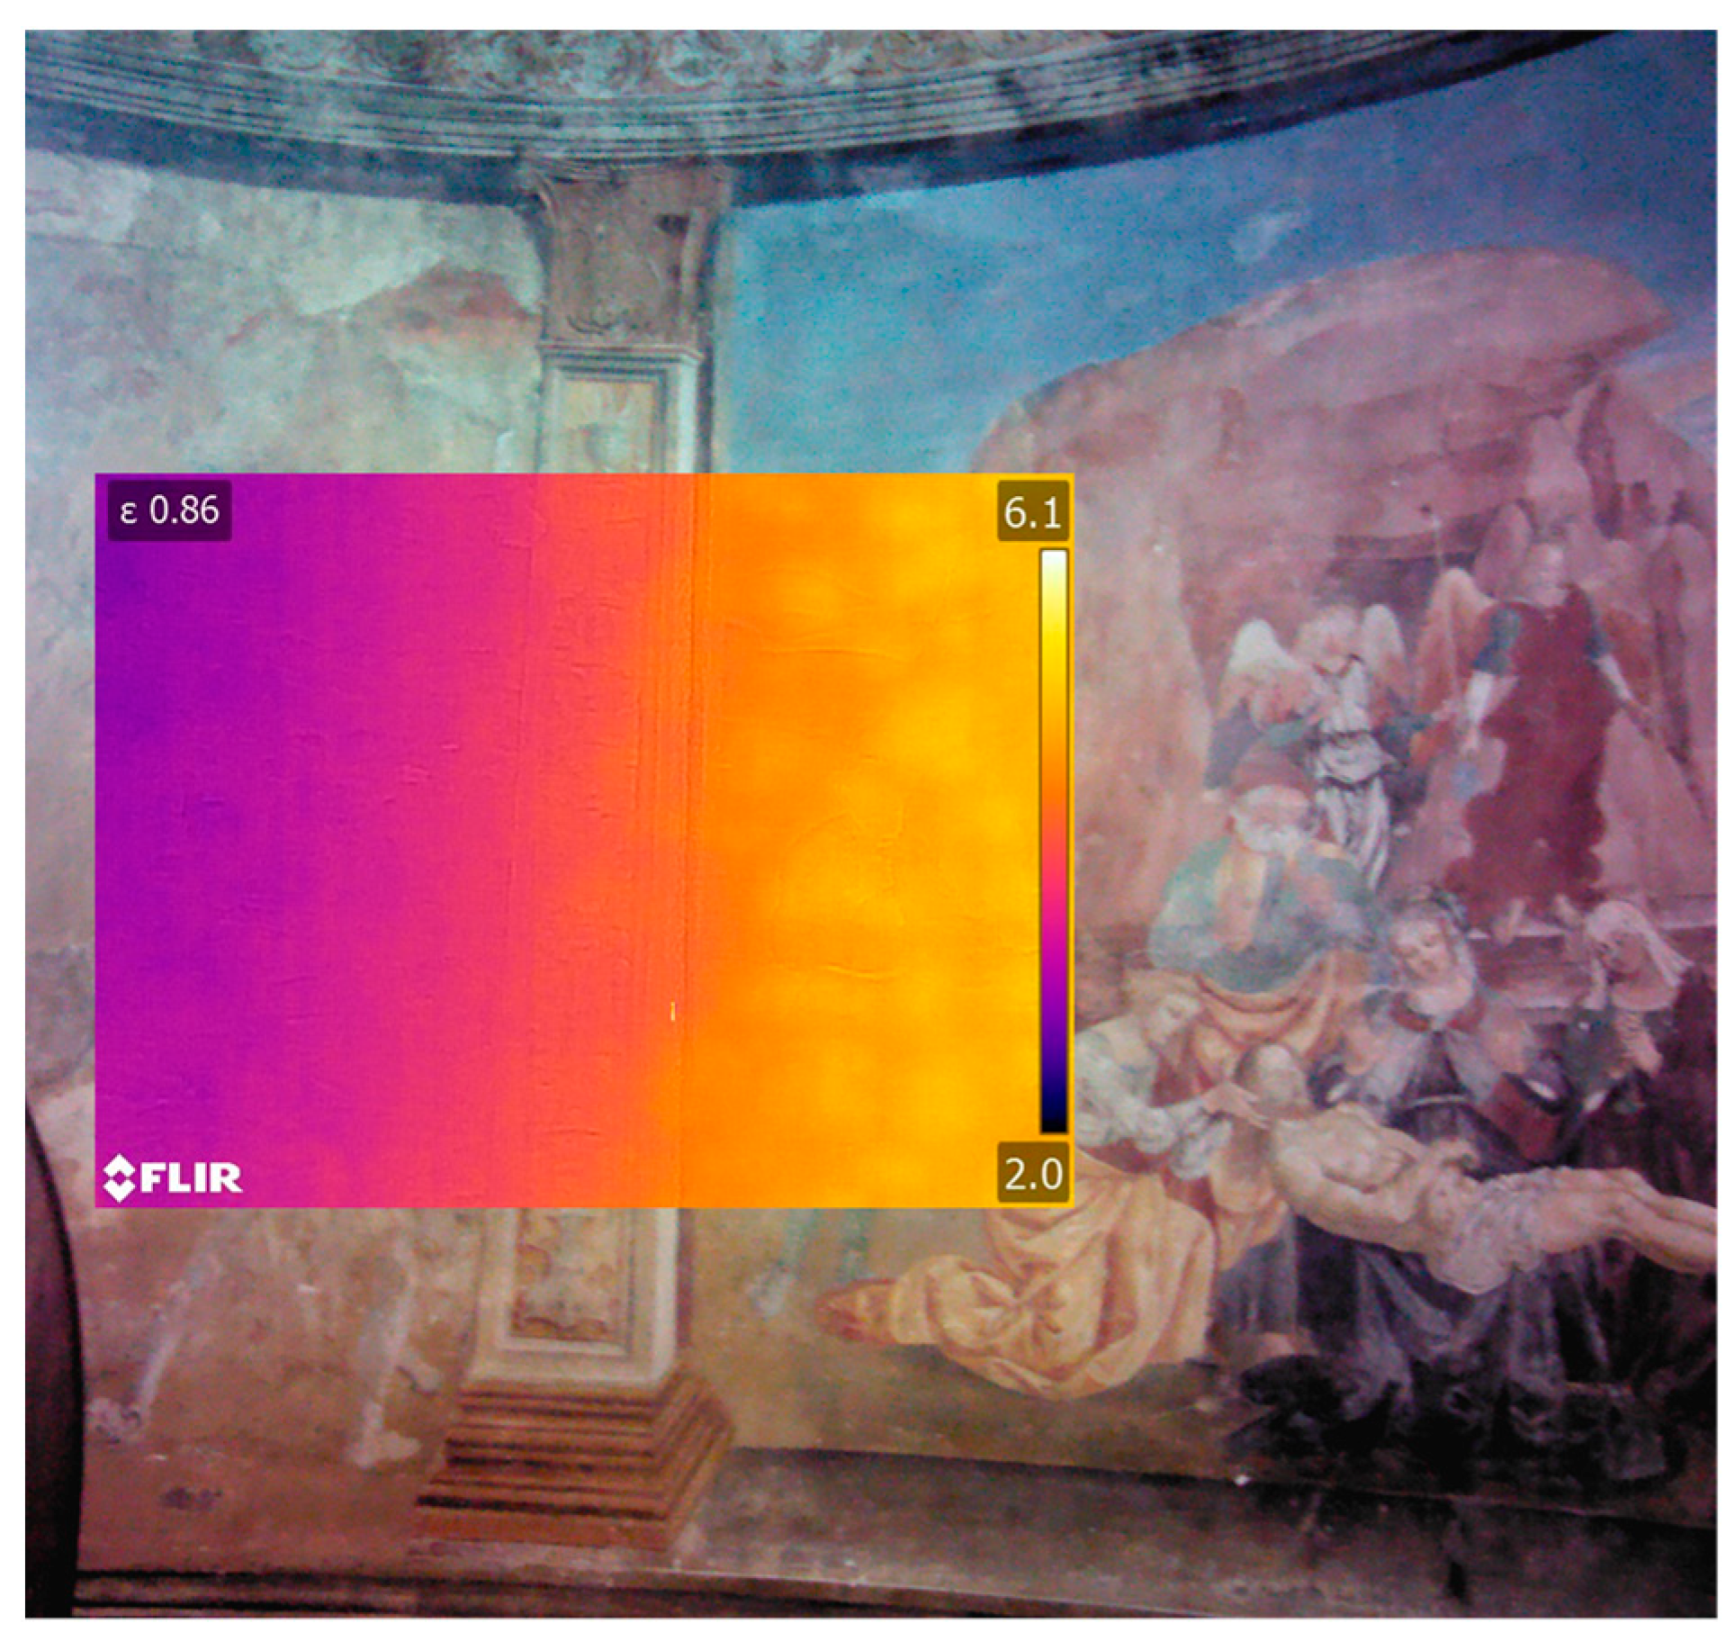
2.2. IRT Data Collection and Imaging Procedure
3. Results
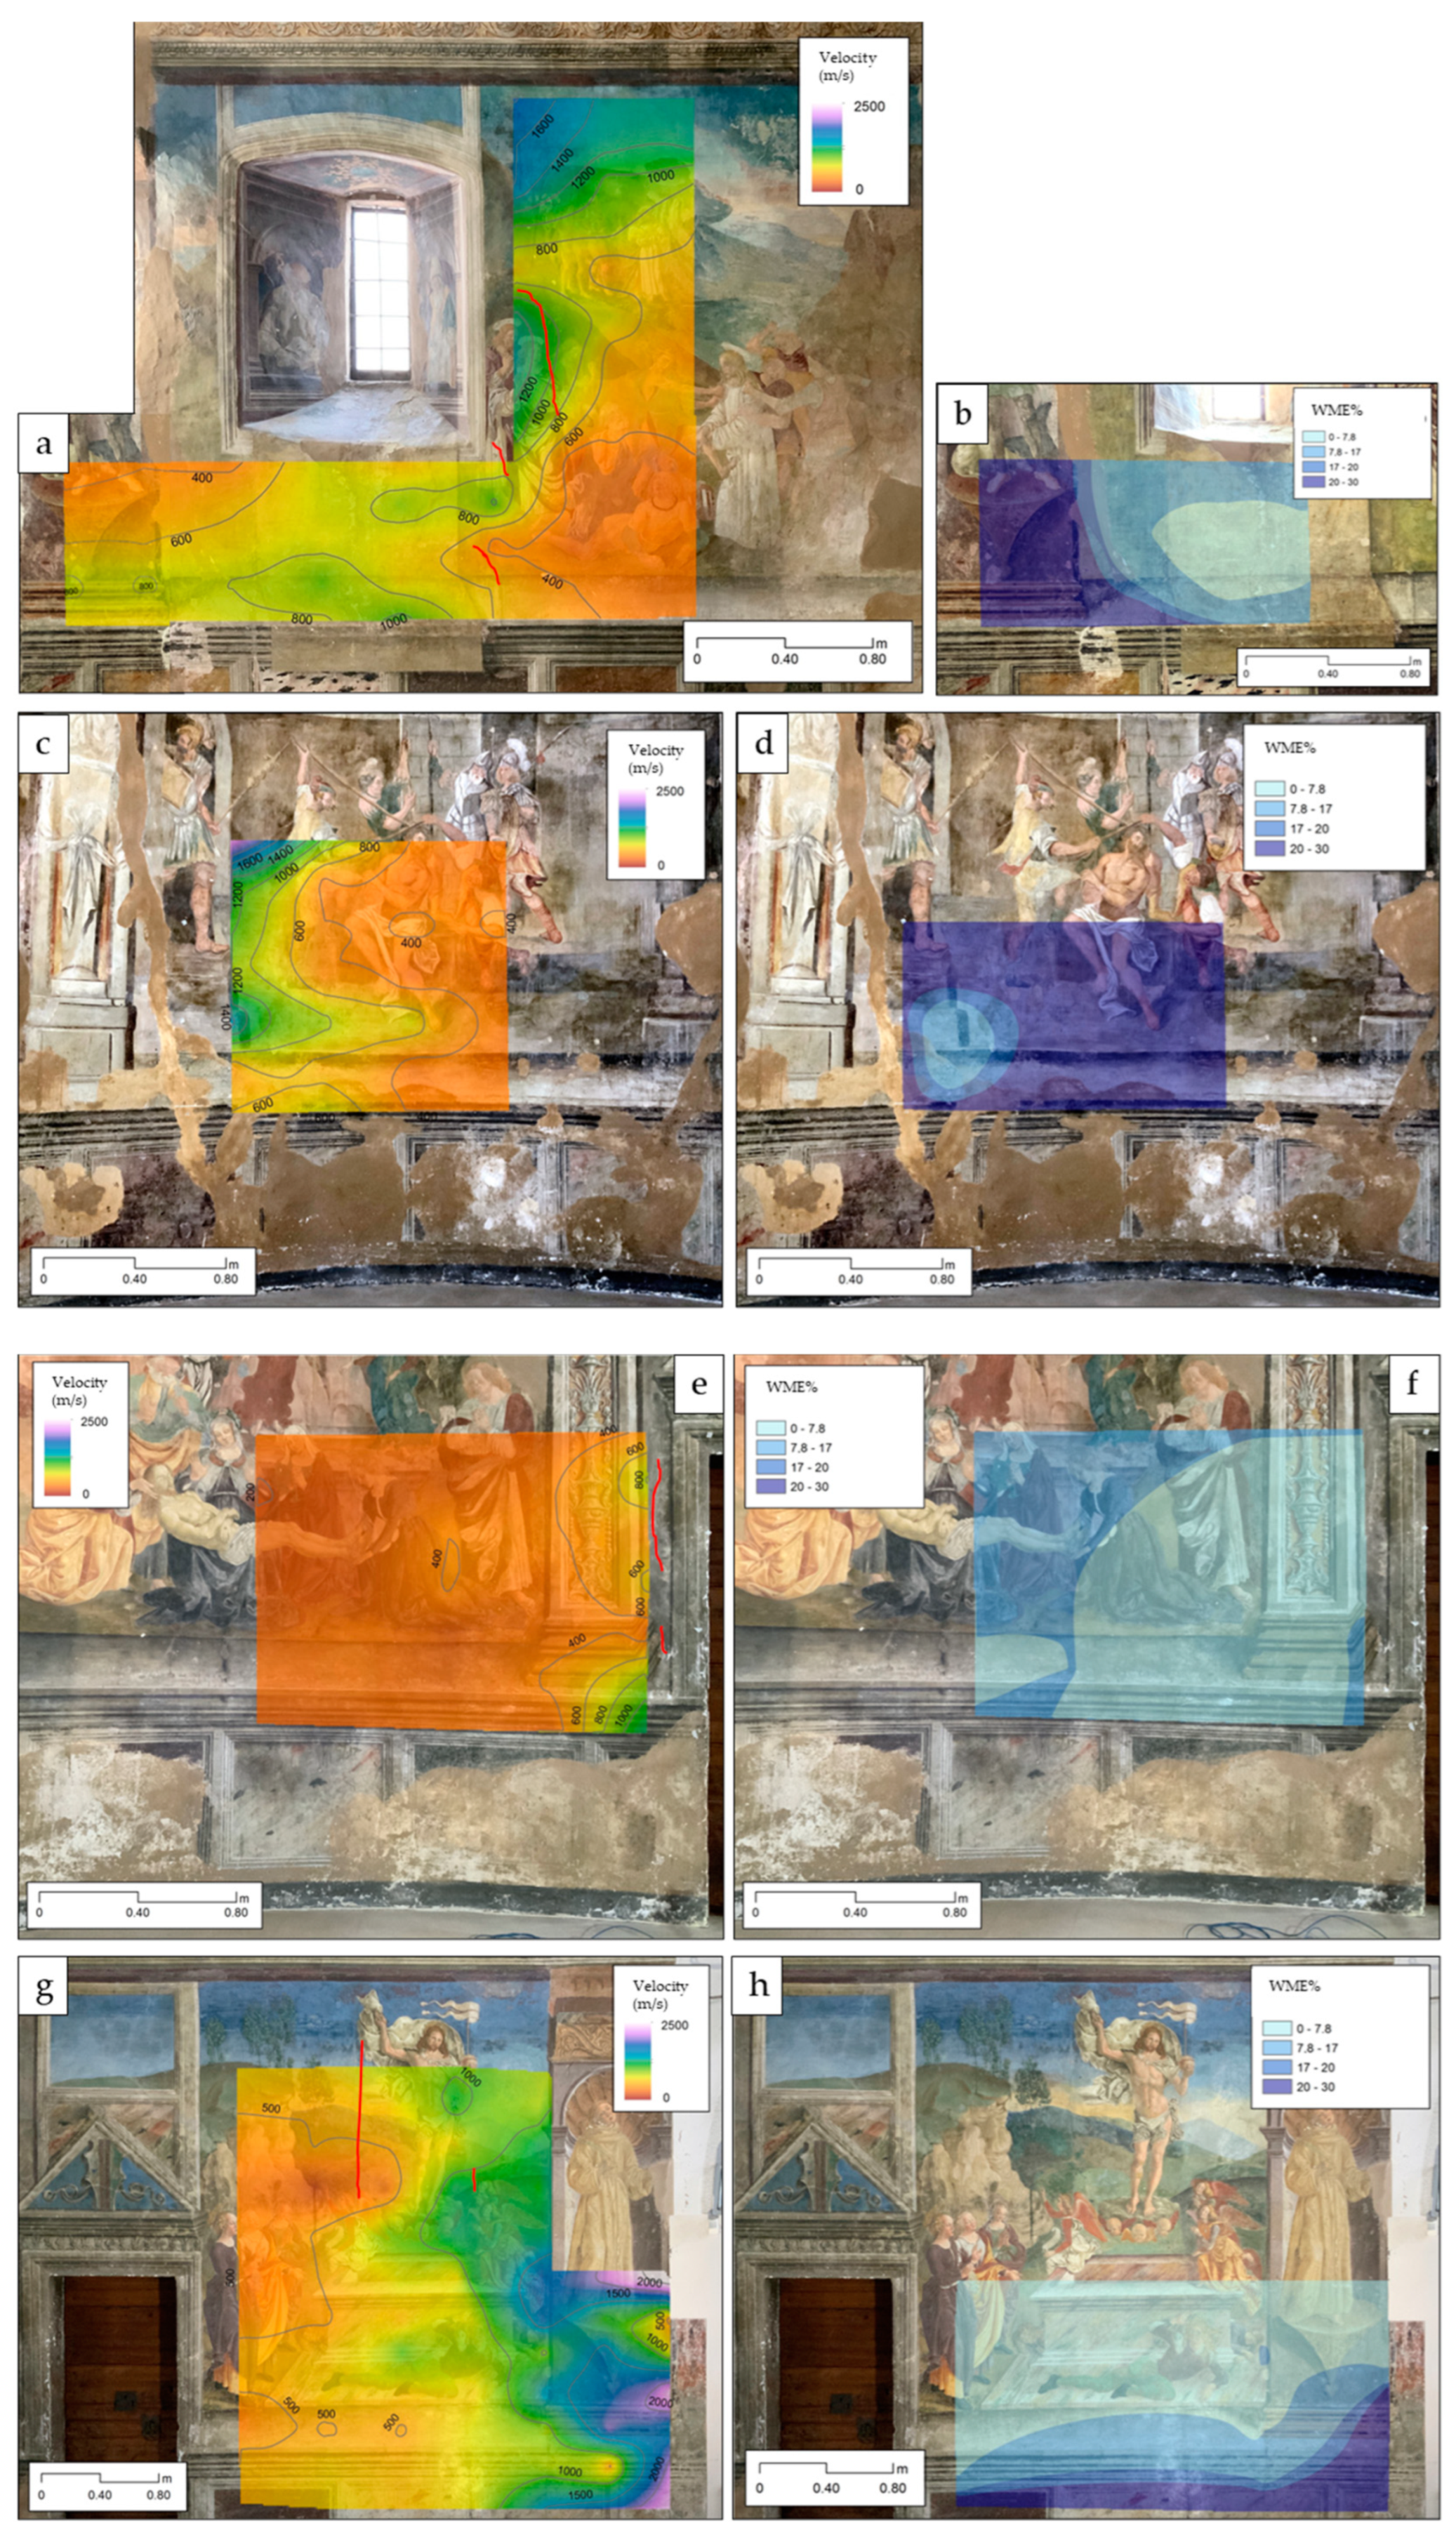
3.1. SPV and HT Results
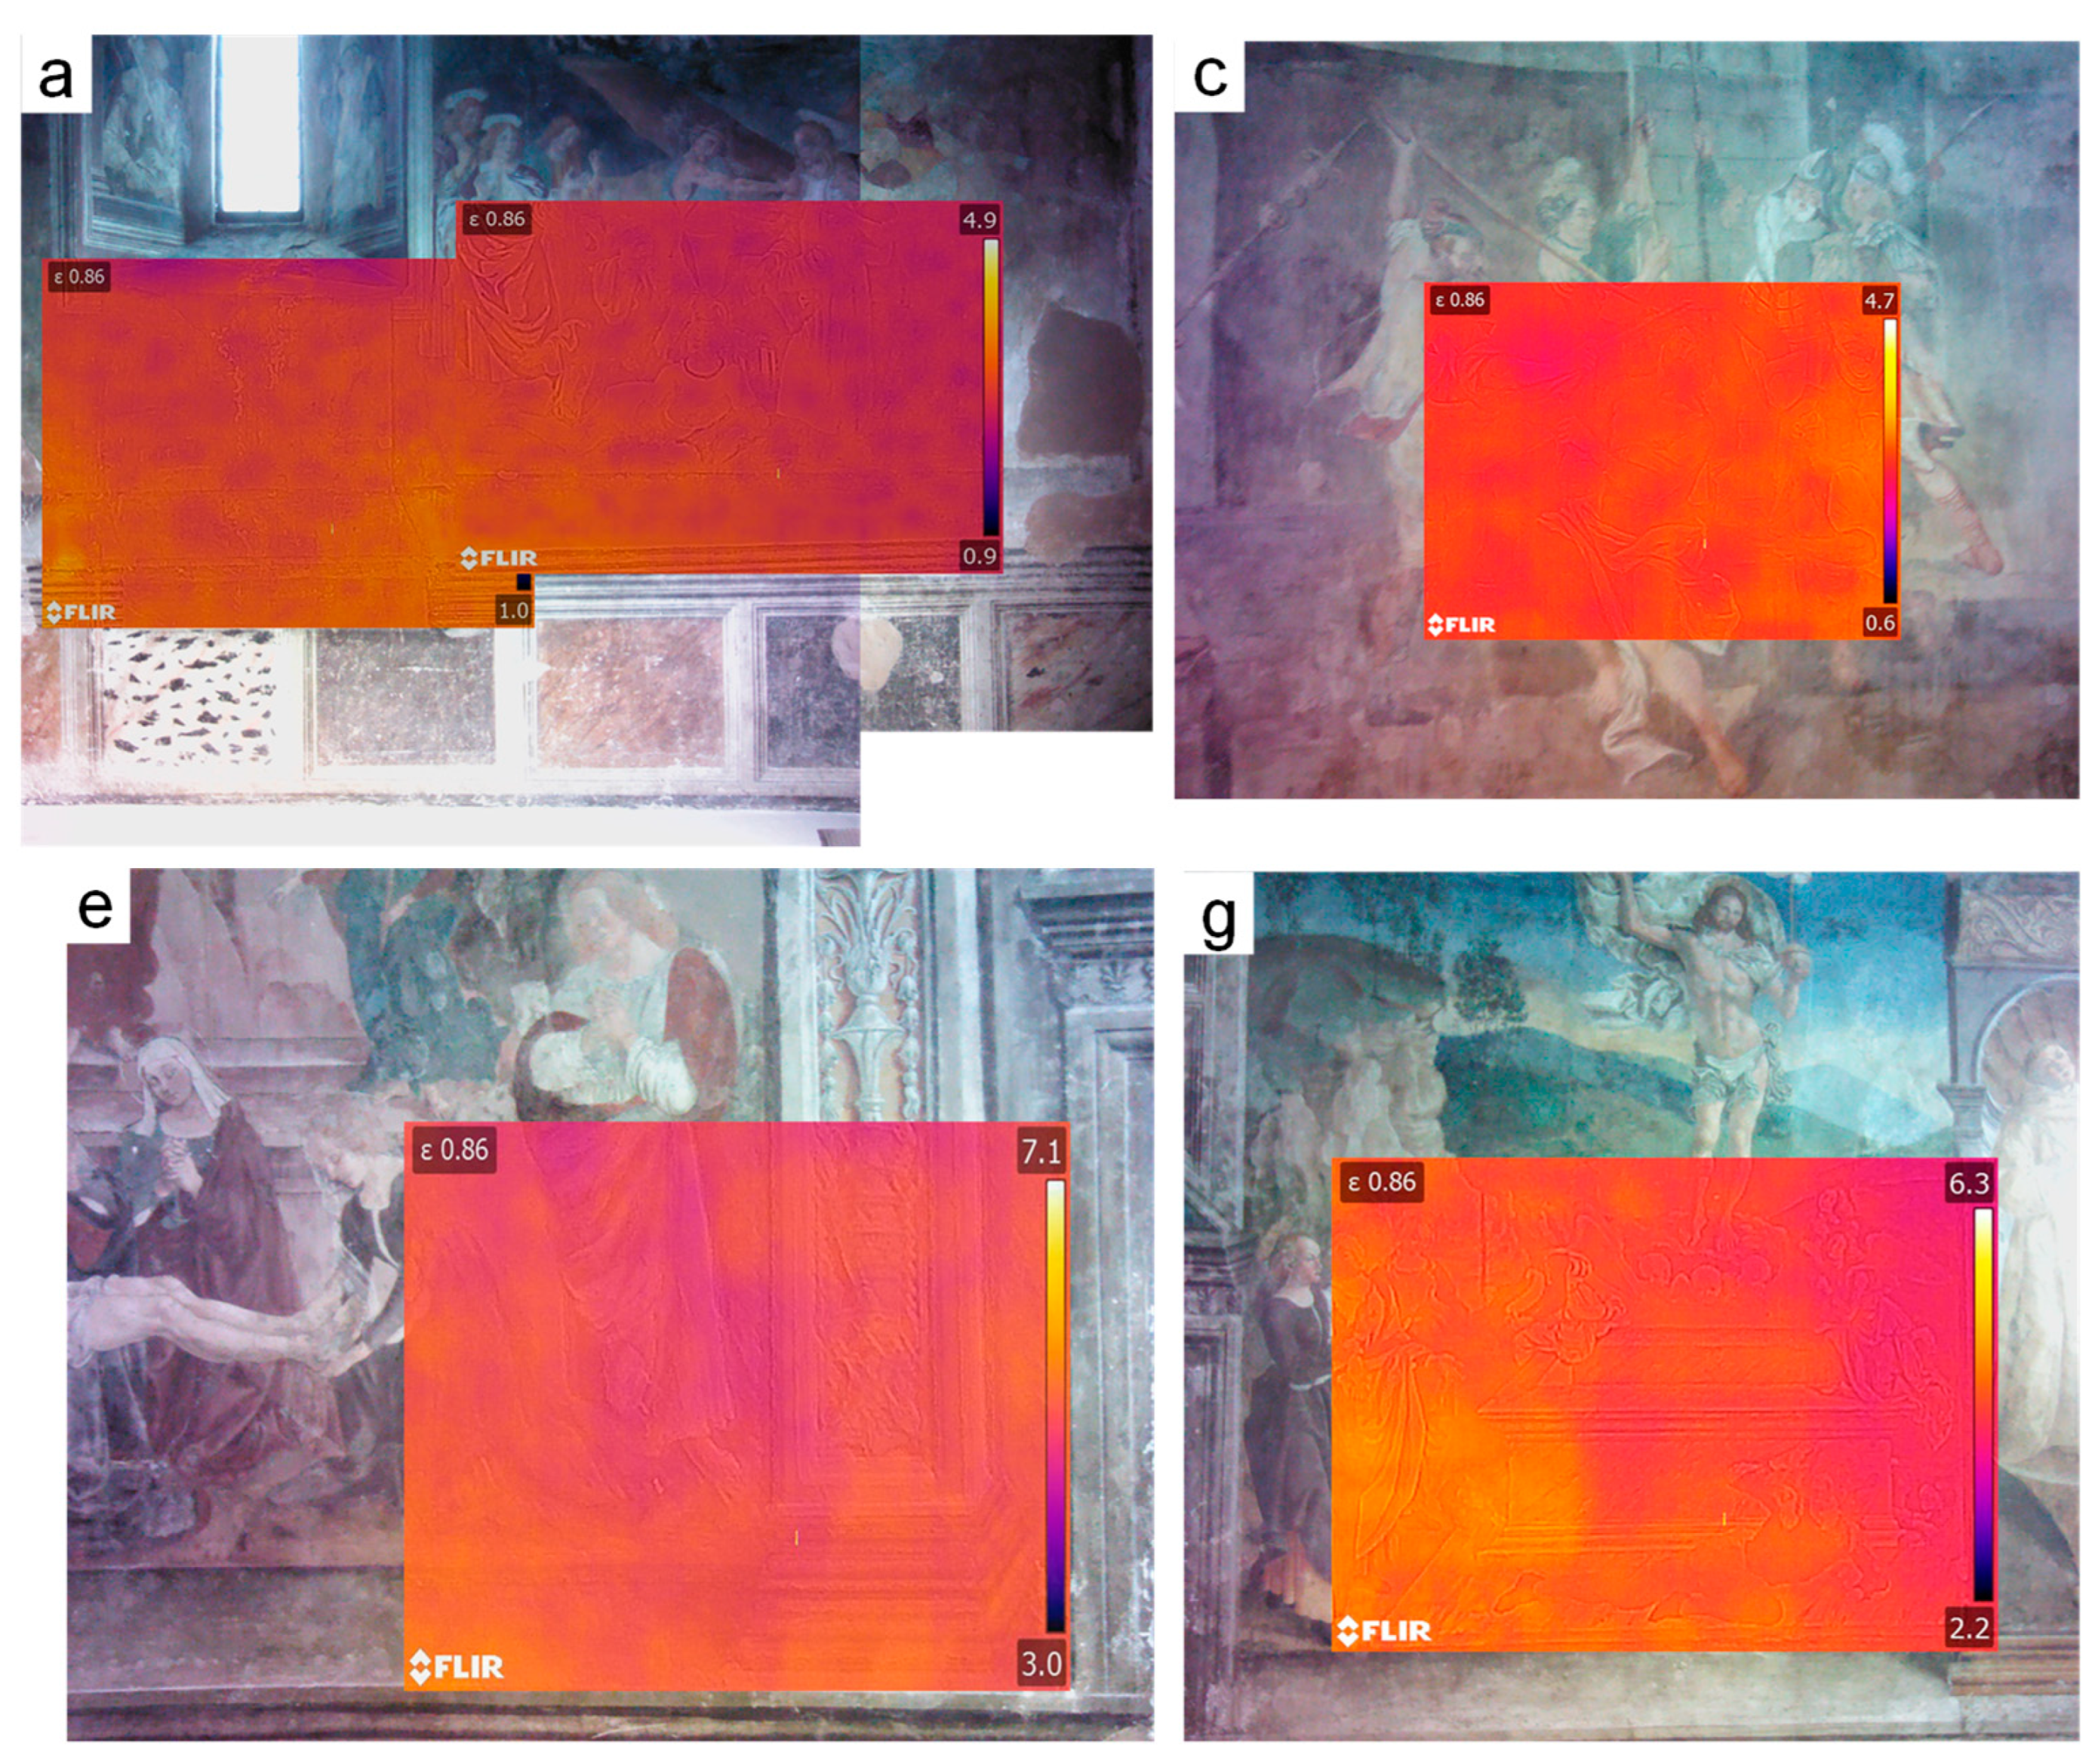
3.2. Passive and Active IRT Results
4. Discussion and Conclusions
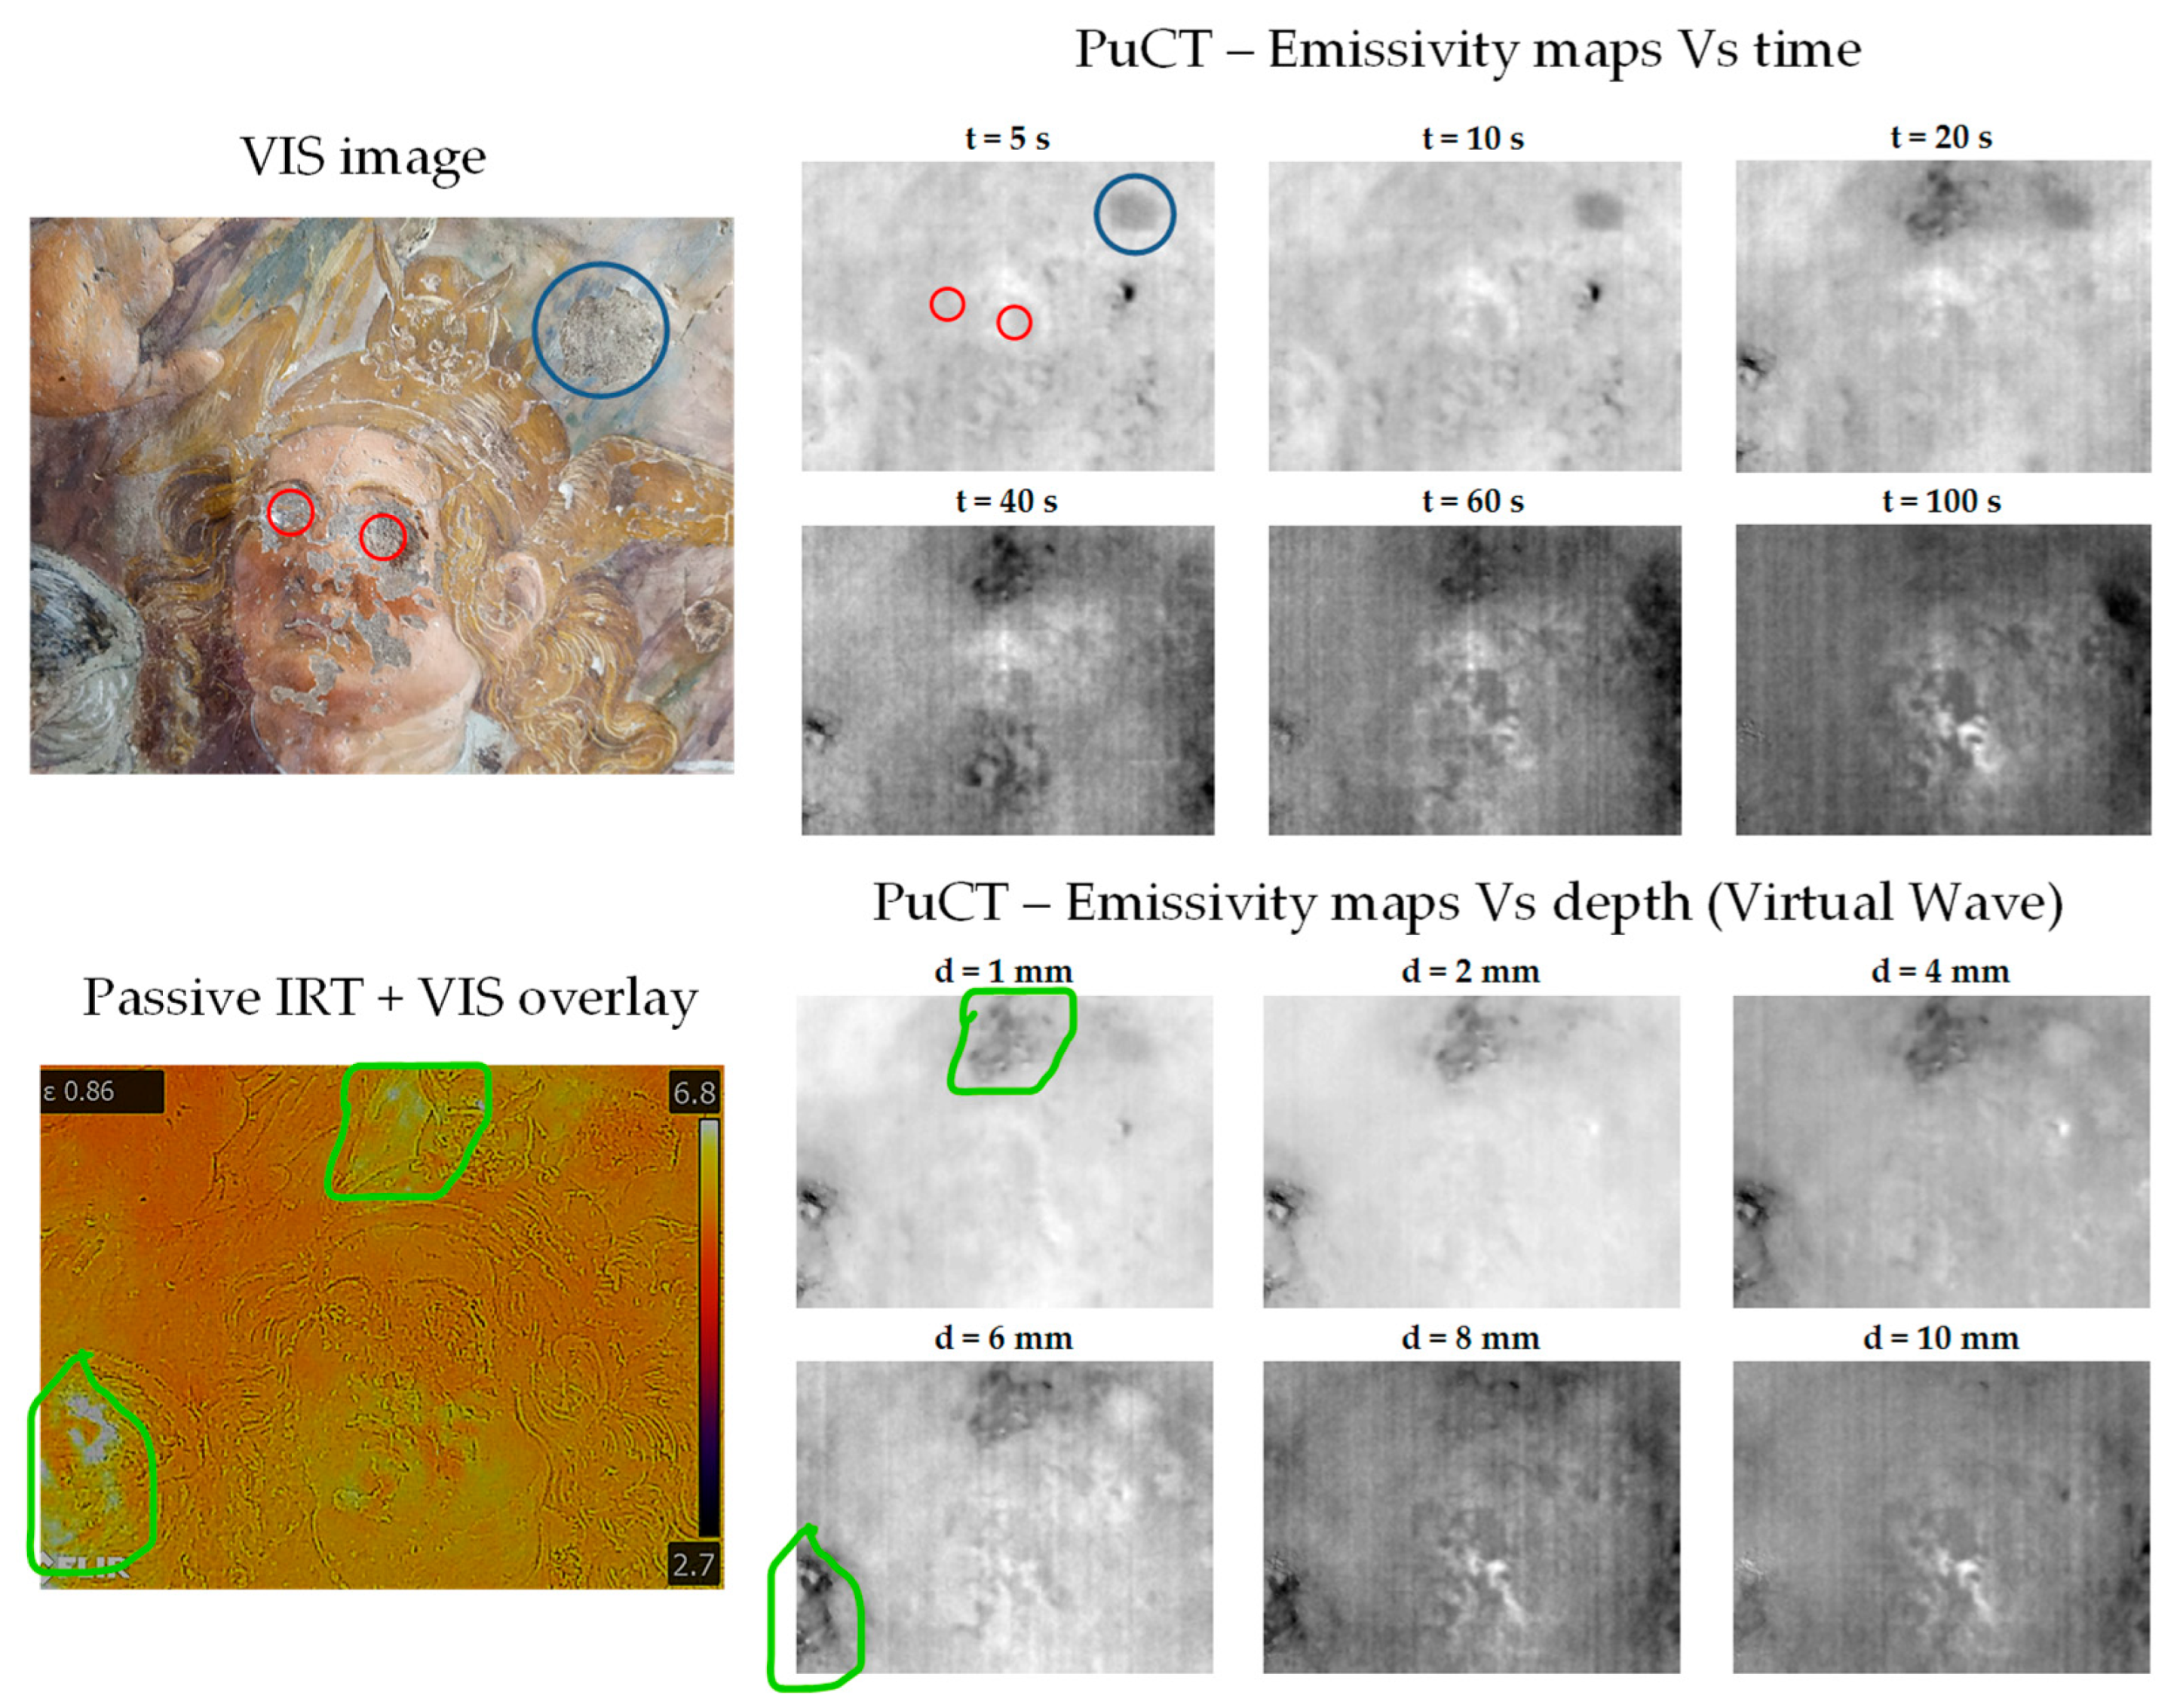
- plaster cohesion: several detached areas or damaged plaster resulting from fractures were evidenced;
- moisture distribution: the HT tests reveal variations in humidity levels across different areas. The moisture values are generally higher and more homogeneous in those regions potentially influenced by the position of the area relative to the sun exposure. Detached portions of plaster exhibit lower moisture values;
- temperature variations: the passive IRT analysis shows temperature discontinuities between different sections of the apse, indicating potential variations in wall texture and masonry structure. These differences may be attributed to factors such as materials, construction techniques, or later interventions;
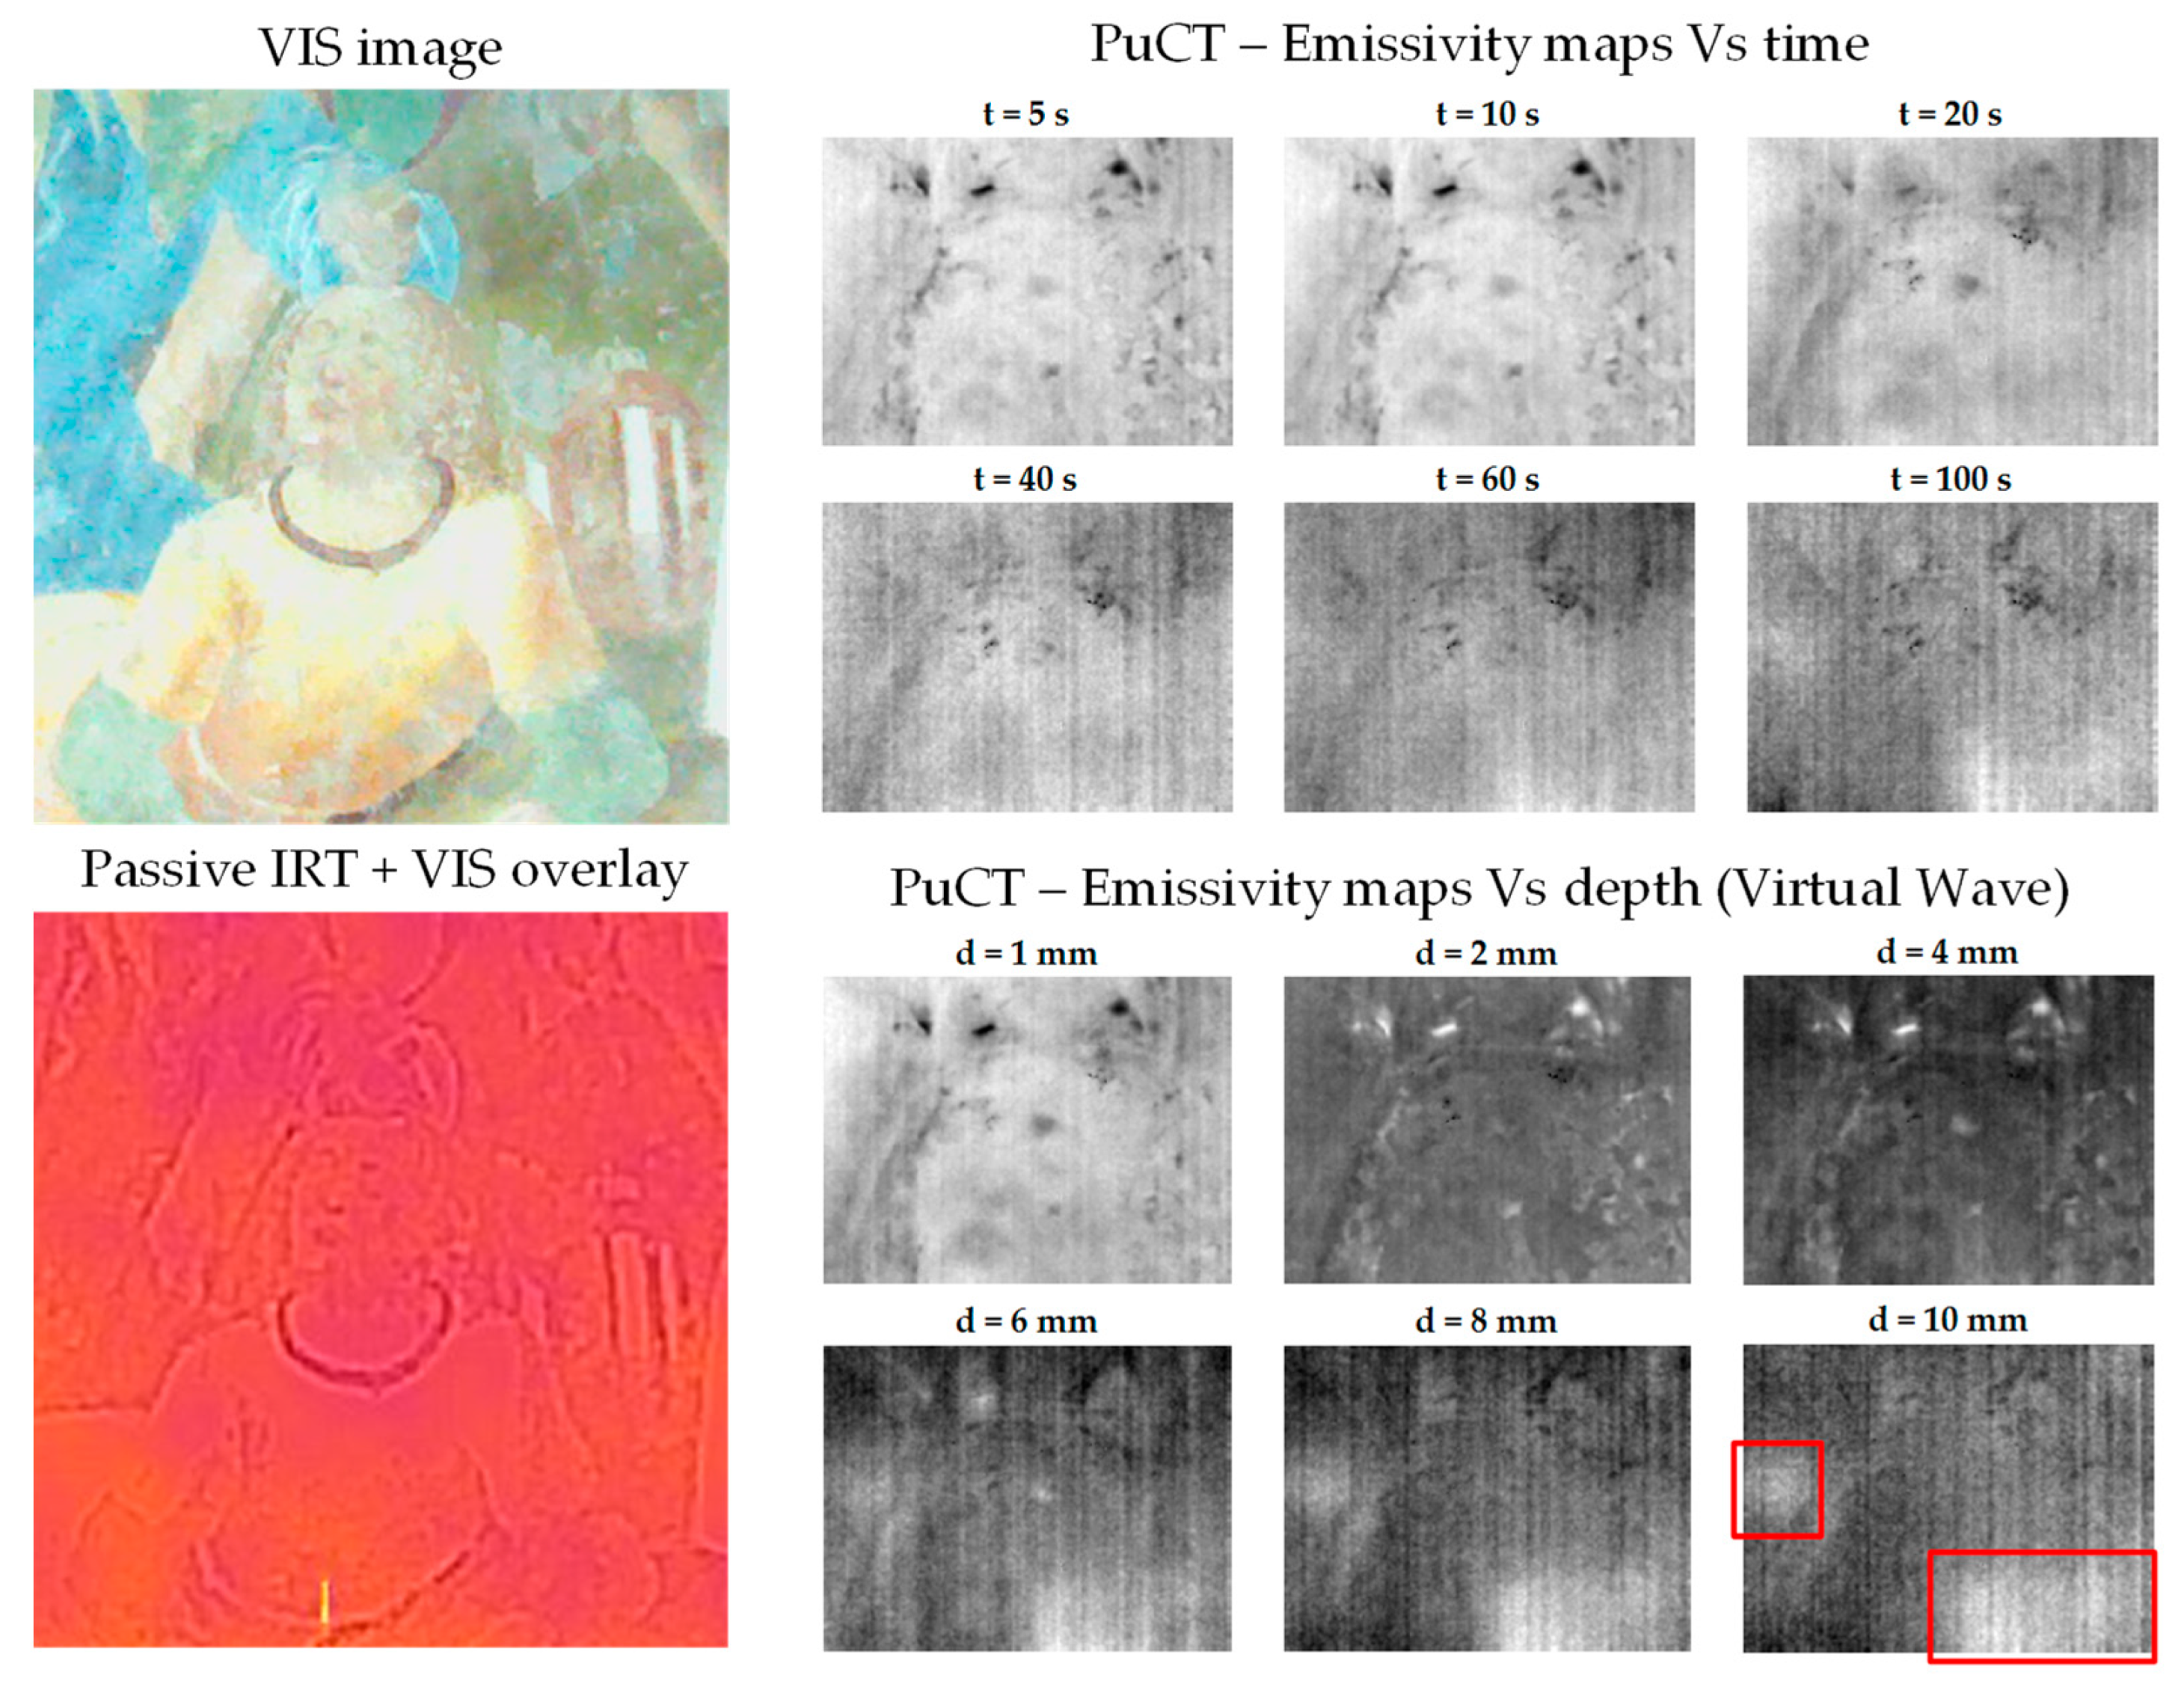
- structural integrity of frescoes: the presence of fractures, discontinuities, and infill of the underlying masonry is evident from the SPV and PuCT results. These structural elements can affect the overall stability and conservation of the frescoes.
Author Contributions
Funding
Institutional Review Board Statement
Informed Consent Statement
Acknowledgments
Conflicts of Interest
References
- Zuena, M.; Baroni, L.; Graziani, V.; Iorio, M.; Lins, S.; Ricci, M.A.; Ridolfi, S.; Ruggiero, L.; Tortora, L.; Valbonetti, L.; et al. The techniques and materials of a 16th century drawing by Giorgio Vasari: A multi-analytical investigation. Microchem. J. 2021, 170, 106757. [Google Scholar] [CrossRef]
- Sandu, I.; Dima, A.; Sandu, I.G.; Luca, C.; Anca Sandu, I.C.; Sandu, A.V. Survey on behaviour of interventions for probota monastery indoor frescoes conservation under environmental factors influence. III. Correlations between thermal, hygroscopic and sonic parameters. Environ. Eng. Manag. J. (EEMJ) 2004, 3, 561–567. [Google Scholar] [CrossRef]
- Centauro, I.; Calandra, S.; Salvatici, T.; Garzonio, C.A. System integration for masonry quality assessment: A complete solution applied to Sonic Velocity Test on historic buildings. In The Future of Heritage Science and Technologies: Materials Science; Springer International Publishing: Cham, Switzerland, 2022; pp. 213–226. [Google Scholar]
- Coli, M.; Ciuffreda, A.L.; Donigaglia, T. Technical analysis of the masonry of the Bargello’Palace, Florence (Italy). Appl. Sci. 2022, 12, 2615. [Google Scholar] [CrossRef]
- Luchin, G.; Ramos, L.F.; D’Amato, M. Sonic tomography for masonry walls characterization. Int. J. Archit. Herit. 2020, 14, 589–604. [Google Scholar] [CrossRef]
- Binda, L.; Saisi, A.; Tiraboschi, C. Investigation procedures for the diagnosis of historic masonries. Constr. Build. Mater. 2000, 14, 199–233. [Google Scholar] [CrossRef]
- Calandra, S.; Cardinali, V.; Centauro, I.; Ciuffreda, A.; Donigaglia, T.; Salvatici, T.; Tanganelli, M. Integration of historical studies and ND techniques for the structural characterization of the masonry walls in Palazzo Vecchio, Florence, In Diagnosis of Heritage Buildings by Non-Destructive Techniques; Tejedor, B., Bienvenido-Huertas, D., Eds.; Elsevier: Amsterdam, The Netherlands, 2023. [Google Scholar]
- Solla, M.; Gonçalves, L.M.; Gonçalves, G.; Francisco, C.; Puente, I.; Providência, P.; Gaspar, F.; Rodrigues, H. A building information modeling approach to integrate geomatic data for the documentation and preservation of cultural heritage. Remote Sens. 2020, 12, 4028. [Google Scholar] [CrossRef]
- Besharatinezhad, A.; Khodabandeh, M.A.; Rozgonyi-Boissinot, N.; Török, Á. The Effect of Water Saturation on the Ultrasonic Pulse Velocities of Different Stones. Period. Polytech. Civ. Eng. 2022, 66, 532–540. [Google Scholar] [CrossRef]
- Miranda, L.; Cantini, L.; Guedes, J.; Binda, L.; Costa, A. Applications of sonic tests to masonry elements: Influence of joints on the propagation velocity of elastic waves. J. Mater. Civ. Eng. 2013, 25, 667–682. [Google Scholar] [CrossRef]
- Garrido, I.; Lagüela, S.; Fang, Q.; Arias, P. Introduction of the combination of thermal fundamentals and Deep Learning for the automatic thermographic inspection of thermal bridges and water-related problems in infrastructures. Quant. InfraRed Thermogr. J. 2022, 1–25. [Google Scholar] [CrossRef]
- Rocha, J.H.A.; Santos, C.F.; Póvoas, V. Evaluation of the infrared thermography technique for capillarity moisture detection in buildings. Procedia Struct. Integr. 2018, 11, 107–113. [Google Scholar] [CrossRef]
- Kim, C.; Park, G.; Jang, H.; Kim, E.J. Automated classification of thermal defects in the building envelope using thermal and visible images. Quant. InfraRed Thermogr. J. 2022, 1–17. [Google Scholar] [CrossRef]
- Larbi Youcef, M.H.A.; Feuillet, V.; Ibos, L.; Candau, Y. In situ quantitative diagnosis of insulated building walls using passive infrared thermography. Quant. InfraRed Thermogr. J. 2022, 19, 41–69. [Google Scholar] [CrossRef]
- Davin, T.; Serio, B.; Guida, G.; Pina, V. Spatial resolution optimization of a cooling-down thermal imaging method to reveal hidden academic frescoes. Int. J. Therm. Sci. 2017, 112, 188–198. [Google Scholar] [CrossRef]
- Cadelano, G.; Bison, P.; Bortolin, A.; Ferrarini, G.; Peron, F.; Girotto, M.; Volinia, M. Monitoring of historical frescoes by timed infrared imaging analysis. Opto-Electron. Rev. 2015, 23, 102–108. [Google Scholar] [CrossRef]
- Galli, A.; Alberghina, M.F.; Re, A.; Magrini, D.; Grifa, C.; Ponterio, R.C.; La Russa, M.F. Special Issue: Results of the II National Research project of AIAr: Archaeometric study of the frescoes by Saturnino Gatti and workshop at the church of San Panfilo in Tornimparte (AQ, Italy). Appl. Sci. 2023. to be submitted. [Google Scholar]
- Valluzzi, M.R.; Cescatti, E.; Cardani, G.; Cantini, L.; Zanzi, L.; Colla, C.; Casarin, F. Calibration of sonic pulse velocity tests for detection of variable conditions in masonry walls. Constr. Build. Mater. 2018, 192, 272–286. [Google Scholar] [CrossRef]
- Santo, A.P.; Agostini, B.; Garzonio, C.A.; Pecchioni, E.; Salvatici, T. Decay Process of Serpentinite: The Case of the San Giovanni Baptistery (Florence, Italy) Pavement. Appl. Sci. 2022, 12, 861. [Google Scholar] [CrossRef]
- Lanteri, L.; Calandra, S.; Briani, F.; Germinario, C.; Izzo, F.; Pagano, S.; Pelosi, C.; Santo, A.P. 3D Photogrammetric Survey, Raking Light Photography and Mapping of Degradation Phenomena of the Early Renaissance Wall Paintings by Saturnino Gatti—Case Study of the St. Panfilo Church in Tornimparte (L’Aquila, Italy). Appl. Sci. 2023, 13, 5689. [Google Scholar] [CrossRef]
- Laureti, S.; Colantonio, C.; Burrascano, P.; Melis, M.; Calabrò, G.; Malekmohammadi, H.; Sfarra, S.; Ricci, M.; Pelosi, C. Development of integrated innovative techniques for paintings examination: The case studies of The Resurrection of Christ attributed to Andrea Mantegna and the Crucifixion of Viterbo attributed to Michelangelo’s workshop. J. Cult. Herit. 2019, 40, 1–16. [Google Scholar] [CrossRef]
- Sfarra, S.; Laureti, S.; Gargiulo, G.; Malekmohammadi, H.; Sangiovanni, M.A.; La Russa, M.; Burrascano, P.; Ricci, M. Low Thermal Conductivity Materials and Very Low Heat Power: A Demanding Challenge in the Detection of Flaws in Multi-Layer Wooden Cultural Heritage Objects Solved by Pulse-Compression Thermography Technique. Appl. Sci. 2020, 10, 4233. [Google Scholar] [CrossRef]
- Ricci, M.; Laureti, S.; Malekmohammadi, H.; Sfarra, S.; Lanteri, L.; Colantonio, C.; Calabrò, G.; Pelosi, C. Surface and interface investigation of a 15th century wall painting using multispectral imaging and pulse-compression infrared thermography. Coatings 2021, 11, 546. [Google Scholar] [CrossRef]
- Burgholzer, P.; Thor, M.; Gruber, J.; Mayr, G. Three-dimensional thermographic imaging using a virtual wave concept. J. Appl. Phys. 2017, 121, 105102. [Google Scholar] [CrossRef] [Green Version]


Disclaimer/Publisher’s Note: The statements, opinions and data contained in all publications are solely those of the individual author(s) and contributor(s) and not of MDPI and/or the editor(s). MDPI and/or the editor(s) disclaim responsibility for any injury to people or property resulting from any ideas, methods, instructions or products referred to in the content. |
© 2023 by the authors. Licensee MDPI, Basel, Switzerland. This article is an open access article distributed under the terms and conditions of the Creative Commons Attribution (CC BY) license (https://creativecommons.org/licenses/by/4.0/).
Share and Cite
Calandra, S.; Centauro, I.; Laureti, S.; Ricci, M.; Salvatici, T.; Sfarra, S. Application of Sonic, Hygrometric Tests and Infrared Thermography for Diagnostic Investigations of Wall Paintings in St. Panfilo’s Church. Appl. Sci. 2023, 13, 7026. https://doi.org/10.3390/app13127026
Calandra S, Centauro I, Laureti S, Ricci M, Salvatici T, Sfarra S. Application of Sonic, Hygrometric Tests and Infrared Thermography for Diagnostic Investigations of Wall Paintings in St. Panfilo’s Church. Applied Sciences. 2023; 13(12):7026. https://doi.org/10.3390/app13127026
Chicago/Turabian StyleCalandra, Sara, Irene Centauro, Stefano Laureti, Marco Ricci, Teresa Salvatici, and Stefano Sfarra. 2023. "Application of Sonic, Hygrometric Tests and Infrared Thermography for Diagnostic Investigations of Wall Paintings in St. Panfilo’s Church" Applied Sciences 13, no. 12: 7026. https://doi.org/10.3390/app13127026