Article

A DEM Study on Bearing Behavior of Floating Geosynthetic-Encased Stone Column in Deep Soft Clays

1
Research Center of Coastal and Urban Geotechnical Engineering, Zhejiang University, Hangzhou 310058, China
2
Power China Huadong Engineering Corporation Limited, Hangzhou 311122, China
*
Authors to whom correspondence should be addressed.
Appl. Sci. 2023, 13(11), 6838; https://doi.org/10.3390/app13116838
Submission received: 27 April 2023 / Revised: 30 May 2023 / Accepted: 2 June 2023 / Published: 5 June 2023

Abstract

:
The use of geosynthetic-encased stone columns has been proven to be an economical and effective method for soft soil foundation treatment. This method is widely used in civil engineering projects at home and abroad. When the geosynthetic-encased stone columns are applied to deep soft clays, they are in a floating state. The load-bearing deformation mechanism of geosynthetic-encased stone columns has changed. The interaction between the aggregates, geogrid, and soil is worth studying, especially at the bottom of the column. In this paper, the discrete element method is used to simulate a floating geosynthetic-encased stone column with a 280 mm encasement depth in deep soft clays. The load-bearing deformation characteristics and mesoscopic mechanism of the floating geosynthetic-encased stone column are studied. The results show that there are large vertical and radial stresses in the top region. Moreover, the porosity and sliding fraction of aggregates in this region increase with settlement, and the coordination number decreases with settlement. The vertical and radial stresses of the soil near the column body are not affected much by the column body. When the encasement depth exceeds 280 mm, the bearing capacity of the FGESC does not increase much. The encasement depth controls the failure mode of the floating geosynthetic-encased stone column. As the encasement depth increases, the failure mode of the floating geosynthetic-encased stone column gradually transitions from swelling deformation to penetration failure.

1. Introduction

Stone columns, which are composed of granular material, have been widely used to improve the bearing capacity, reduce settlement, and enhance the stability of foundation in soft clay [1,2,3,4]. As the granular material is cohesionless, it may lead to lateral expansion failure of stone columns. The strength and stiffness of stone columns is mainly provided by the confining stresses of the surrounding soil. However, in extremely weak soil (cu < 15 kPa), the confining stresses may not be enough [5,6,7,8].
In order to provide the required confining stresses, Van Impe proposed the concept of encasing stone columns in 1989 [9,10,11,12]. The stone columns are encased by high-strength, creep-resistant geosynthetics. The geosynthetic encasement can provide sufficient confining stresses, prevent lateral deformation of granular material, and maintain the drainage capacity of stone columns [13,14,15,16,17,18]. The geosynthetic-encased stone columns (GESCs) have the advantages of low pollution, low cost, and easy construction [19,20], and the GESCs are widely used in foundation treatment. Due to the encasement, the bearing and deformation characteristics of geosynthetic-encased stone columns (GESCs) and ordinary stone columns (OSCs) are different. Many researchers have studied the GESCs through the finite element method, laboratory tests, and field monitoring [21,22,23,24,25,26,27]. Murugesan and Rajagopal [28,29,30] investigated the GESC through laboratory model tests and the finite element method. They pointed out that the GESC had a much higher stress concentration compared with the OSC. Ghazavi and Afshar [31] investigated the effective encasement depth of GESCs in the same conditions for various diameters. Lateef and Mohammad [32] used 3D finite element program to simulate the GESC under vertical stresses and pointed out the effect of geosynthetics stiffness on the lateral bulging. Hosseinpour et al. [33] found that the 3D numerical analysis had more advantages than the 2D analysis to study the GESCs under the embankment and could obtain more required information. Chen et al. [34] investigated the behavior of GESCs and OSCs through uniaxial compression tests. They reported that the bearing capacity of GESCs was larger than that of OSCs. Joel and Abdelmalek [35] conducted a series of small-scale model tests to observe that the bugling of the column occurred directly beneath the encasement. Liu et al. [36] studied the floating deep mixed columns through laboratory model tests and finite element analysis. They found that the settlement of the floating column composite foundation was mainly affected by the depth improvement ratio. Wang et al. [37,38,39] carried out a series of field tests and finite element numerical simulations to study the bearing characteristic of the GESC. They found that the GESC could effectively reduce the lateral displacement of the soil mass. Anita et al. [40] used the construction and demolition waste to construct the GESC. Their study indicated that the construction and demolition waste could be considered as a sustainable and valuable resource for GESC.
The studies mentioned above did not consider the discreteness of the aggregates that make up the column, especially the finite element method. In actual engineering, it is sometimes uneconomical for GESCs to penetrate soft clay; therefore, the GESCs are in a floating state. Almeida et al. [41] presented the application of an FGESC in an embankment project in São Paulo, Brazil. The columns were 80 cm in diameter, 11 m in length, and implemented on 2 m center-to-center spacing on a square pattern. The bearing capacity of the treated foundation was 150 kPa, which is significantly greater than the shear strength of the soil of 15 kPa. The load-bearing deformation mechanism of the floating geosynthetic-encased stone column (FGESC) is different from those of GESC. There are still relatively few studies on FGESCs in the available literature. Debnath and Dey [42] established a finite element model of the FGESC. Both the improvement factor and stress concentration ratio of the FGESC are analyzed, and the optimum depth of the encasement of the FGESC is three times the diameter of the column. Chen et al. [43] used a centrifuge model to study the deformation characteristics of the FGESC under an embankment. They found that the FGESCs at the edge of the embankment are prone to bending failure. The existing studies mainly focus on the macroscopic level of the FGESC and do not consider the possible large deformation of the FGESC under load. The discrete element method (DEM) can effectively solve the large deformation problem. The DEM is widely used in geotechnical engineering [44,45,46,47], which has advantages in simulating the gravels of the column. Liu [48] and Gu [49] used the discrete element method to simulate the stone columns in soft clay. The aggregates that make up the column are simulated by balls with different characteristics and sizes. However, according to the authors’ knowledge, there is no discrete element method to study the FGESC in the deep soft clay.
This study built a three-dimensional DEM model for an FGESC in soft clay. The aggregates, geogrid encasement, and surrounding soil were simulated by the DEM. The deformation and bearing capacity of the FGESC in deep soft clay are studied. Moreover, the influence of different lengths of geogrid encasement is analyzed. Meanwhile, a small-scale laboratory test is conducted to verify the reliability of the numerical model.

2. Numerical Simulation: Discrete Element Modeling

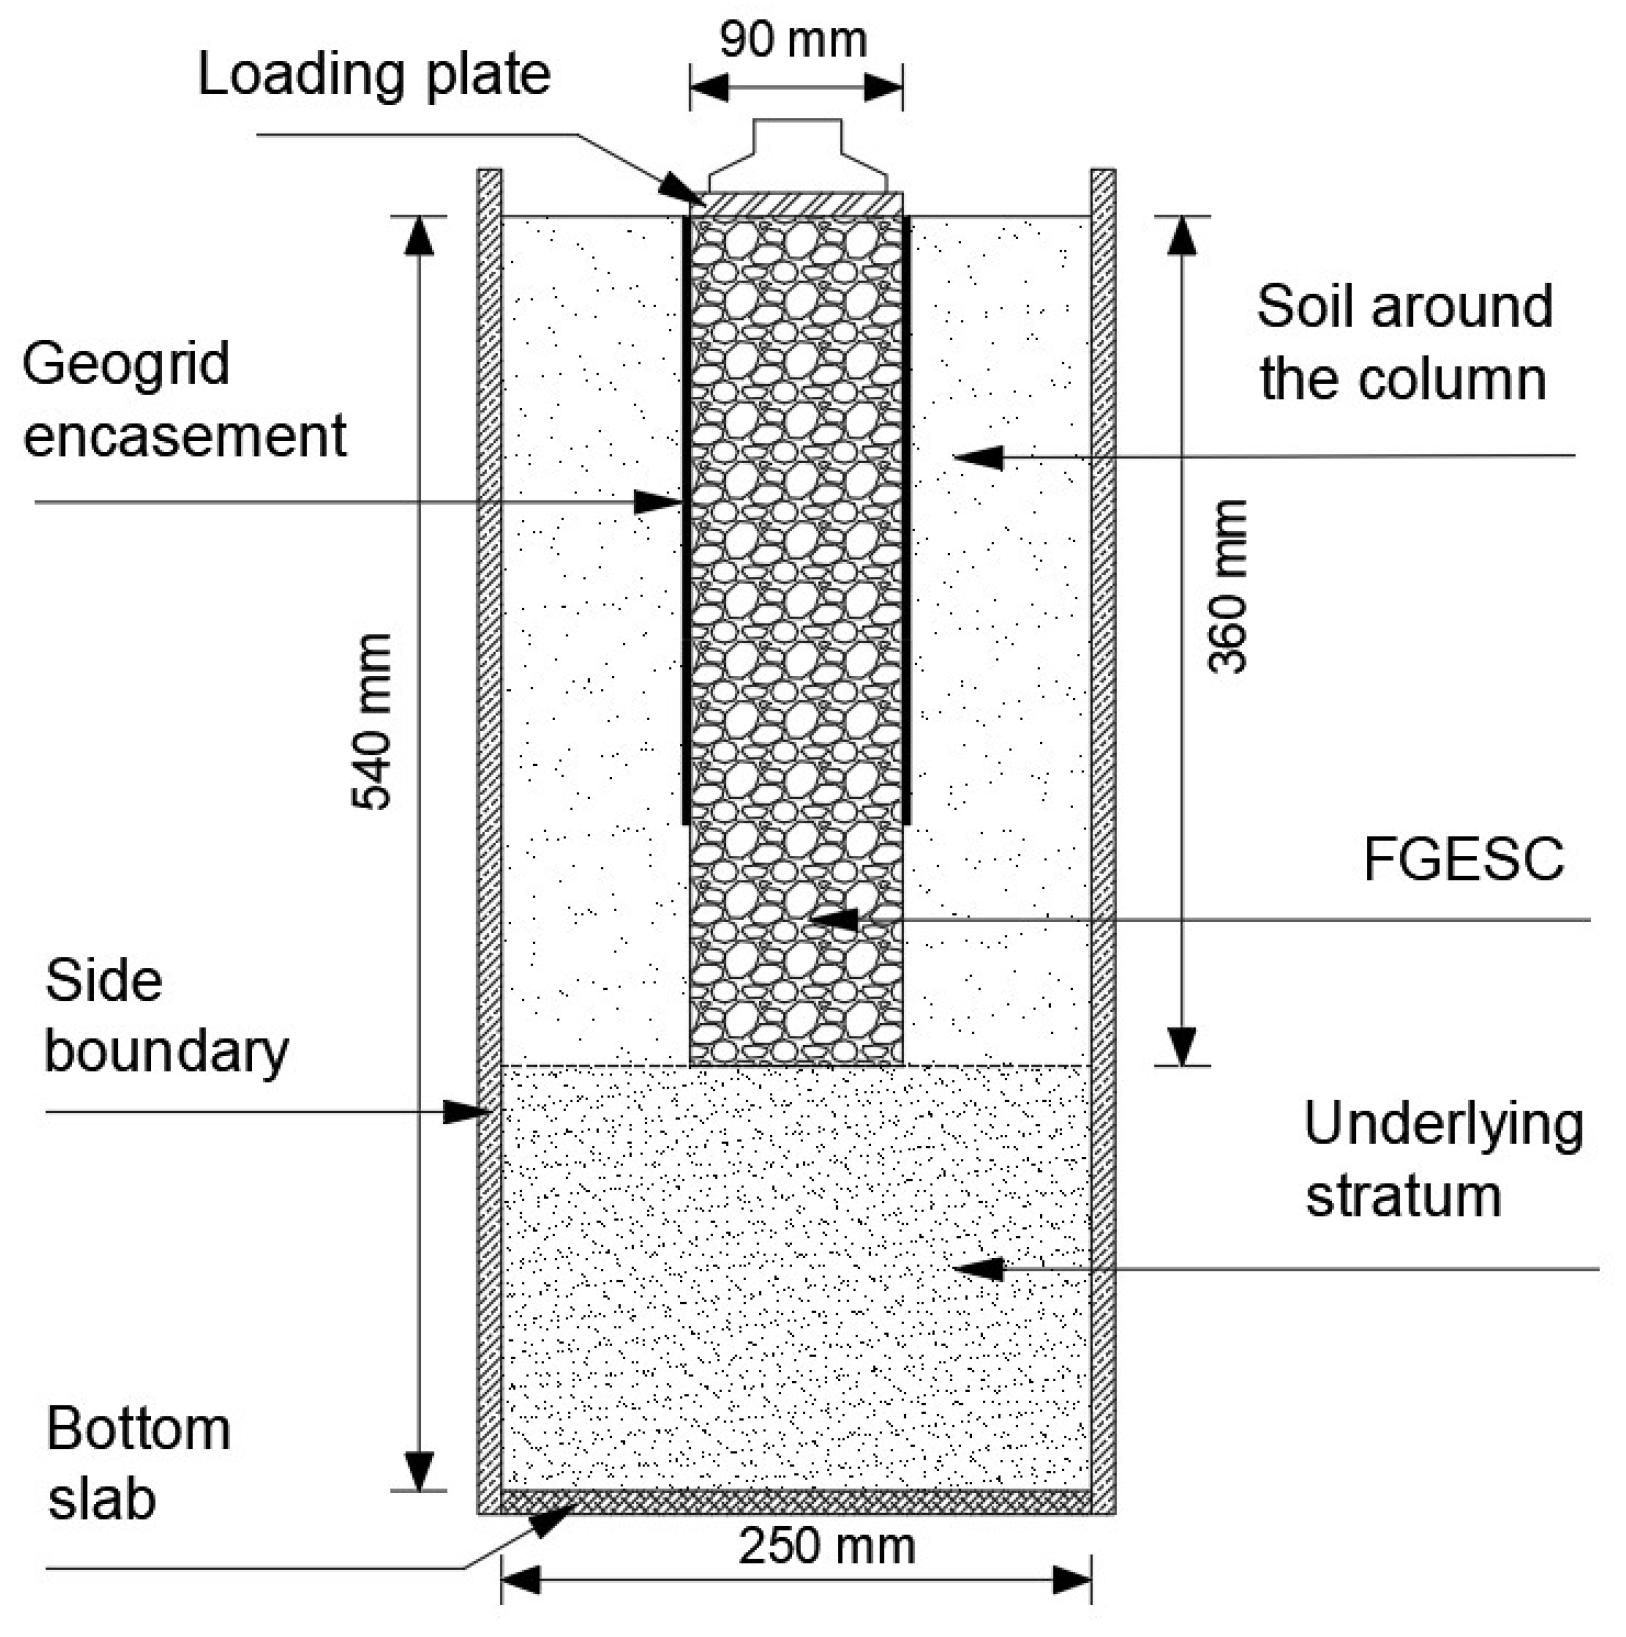
2.1. PFC Modeling of a FGESC in Soft Clay

The three-dimensional particle flow code (PFC3D, version 5.00.40) is a DEM software developed by Itasca, which was used to simulate the behavior of an FGESC installed in soft clay. The aggregates, the geogrid encasement, and the soft soil were simulated by spherical particles with different sizes and contact properties, and the mechanical behavior of spherical particles were updated according to Newton’s law at each calculation cycle.
The behavior of a group of FGESCs in deep soft clay was simplified to a single FGESC installed in the center of a cylinder of clay, as shown in Figure 1. In the unit cell idealization of FGESC, only vertical deformation was allowed, and the side and bottom boundaries were rigid and fixed. For PFC, the concept of unit cell idealization could control the number of particles within a certain range, which was helpful to improve the computational efficiency.
Figure 2 shows the 3D DEM model for an FGESC in soft clay. The diameter of the FGESC was 90 mm, and the length was 360 mm. The diameter and height of the model were 250 mm and 540 mm, respectively. Therefore, the area replacement ratio was 12.96%. The linear model was applied to simulate the aggregates of the FGESC. The diameters of the aggregates ranged from 16 mm to 26 mm, of which 16 mm–20 mm accounted for 25%, and 20 mm–26 mm accounted for 75%. The aggregates were rigid. Due to the high tensile stiffness of geogrid, the linear parallel contact model was used to simulate the geogrid. The geogrid was composed of two rows of particles with a diameter of 2 mm, and the spacing between the two rows was 20 mm. The geogrid completely wrapped the stone column, with a length of 280 mm. The mechanical property of the soil particles was complicated in nature. The soil around the FGESC and the soil in the underlying layer were mainly subjected to vertical deformation. Therefore, this study focused on the compression characteristics of soil particles. The soil particles were simulated by the linear contact bond model. The soil particles were 6.8 to 7.2 mm in diameter and had an initial porosity of 0.4. For clear display, the soil particles were divided into two groups with different colors, and the height of the underlying stratum was 180 mm.
A circular plate with a diameter of 90 mm was generated. It acted as a loading plate while moving down. When the particles of the model were generated, the loading plate moved downward to apply vertical load. The side boundary was a cylinder, and its friction coefficient was 0 to reduce the impact of the boundary on the soil. The bottom slab of the model was a rigid disk, which was fixed.
In order to monitor the deformation and mechanical properties of aggregates and soil particles during loading, 37 measurement spheres were created. Figure 3 shows the positions of the measurement spheres in the model. The measurement spheres (No. 1 to 11) with a diameter of 88 mm were used to monitor the stress and deformation characteristics of the underlying soil and column body. The measurement spheres (No. 12 to 37) with a diameter of 40 mm were used to monitor the stress of the soil around the column and the soil of the underlying stratum.

2.2. Material Properties

The simulated aggregates were consistent with the particle size distribution test in the laboratory. The properties of the aggregates were determined by a triaxial test and are listed in Table 1. The geogrid with a length of 200 mm and a width of 40 mm was used for the tensile test to determine the strength of the geogrid particles. After various attempts, the parameters of the geogrid are listed in Table 2. The unconfined compression test was used to obtain the properties of soft soil. These parameters mainly focused on the compressibility of soil particles and are listed in Table 3.

2.3. Validation of the DEM Model

A laboratory test was conducted to validate the numerical model. Figure 4 shows the schematic diagram of the laboratory test. Figure 5 shows the FGESC laboratory test. The dimensions of the model test were the same as those of the DEM simulation. The vertical load was applied to the top of the FGESC. The applied load was measured by an electronic servo pressure testing machine. The vertical pressure–settlement behavior of the FGESC during the loading process is shown in Figure 6. At the early stage of loading, the DEM simulation results were basically consistent with the experimental results. At the late loading stage, the DEM simulation results were slightly smaller than the experimental results. Overall, the results showed that the DEM simulation was in good agreement with the laboratory test. The reasonableness of the mesoscopic parameters of each material was also demonstrated.

3. Results and Discussion

3.1. Stresses and Deformation of the FGESC

Eleven measurement spheres (IDs from 1 to 11) were created to monitor the stress and deformation of the FGESC and the underlying stratum during the loading process. The average stress of the measurement sphere was calculated from the interaction force between particles whose centroids were in the measurement sphere. The change of the porosity and coordination number could reflect the deformation of FGESC.

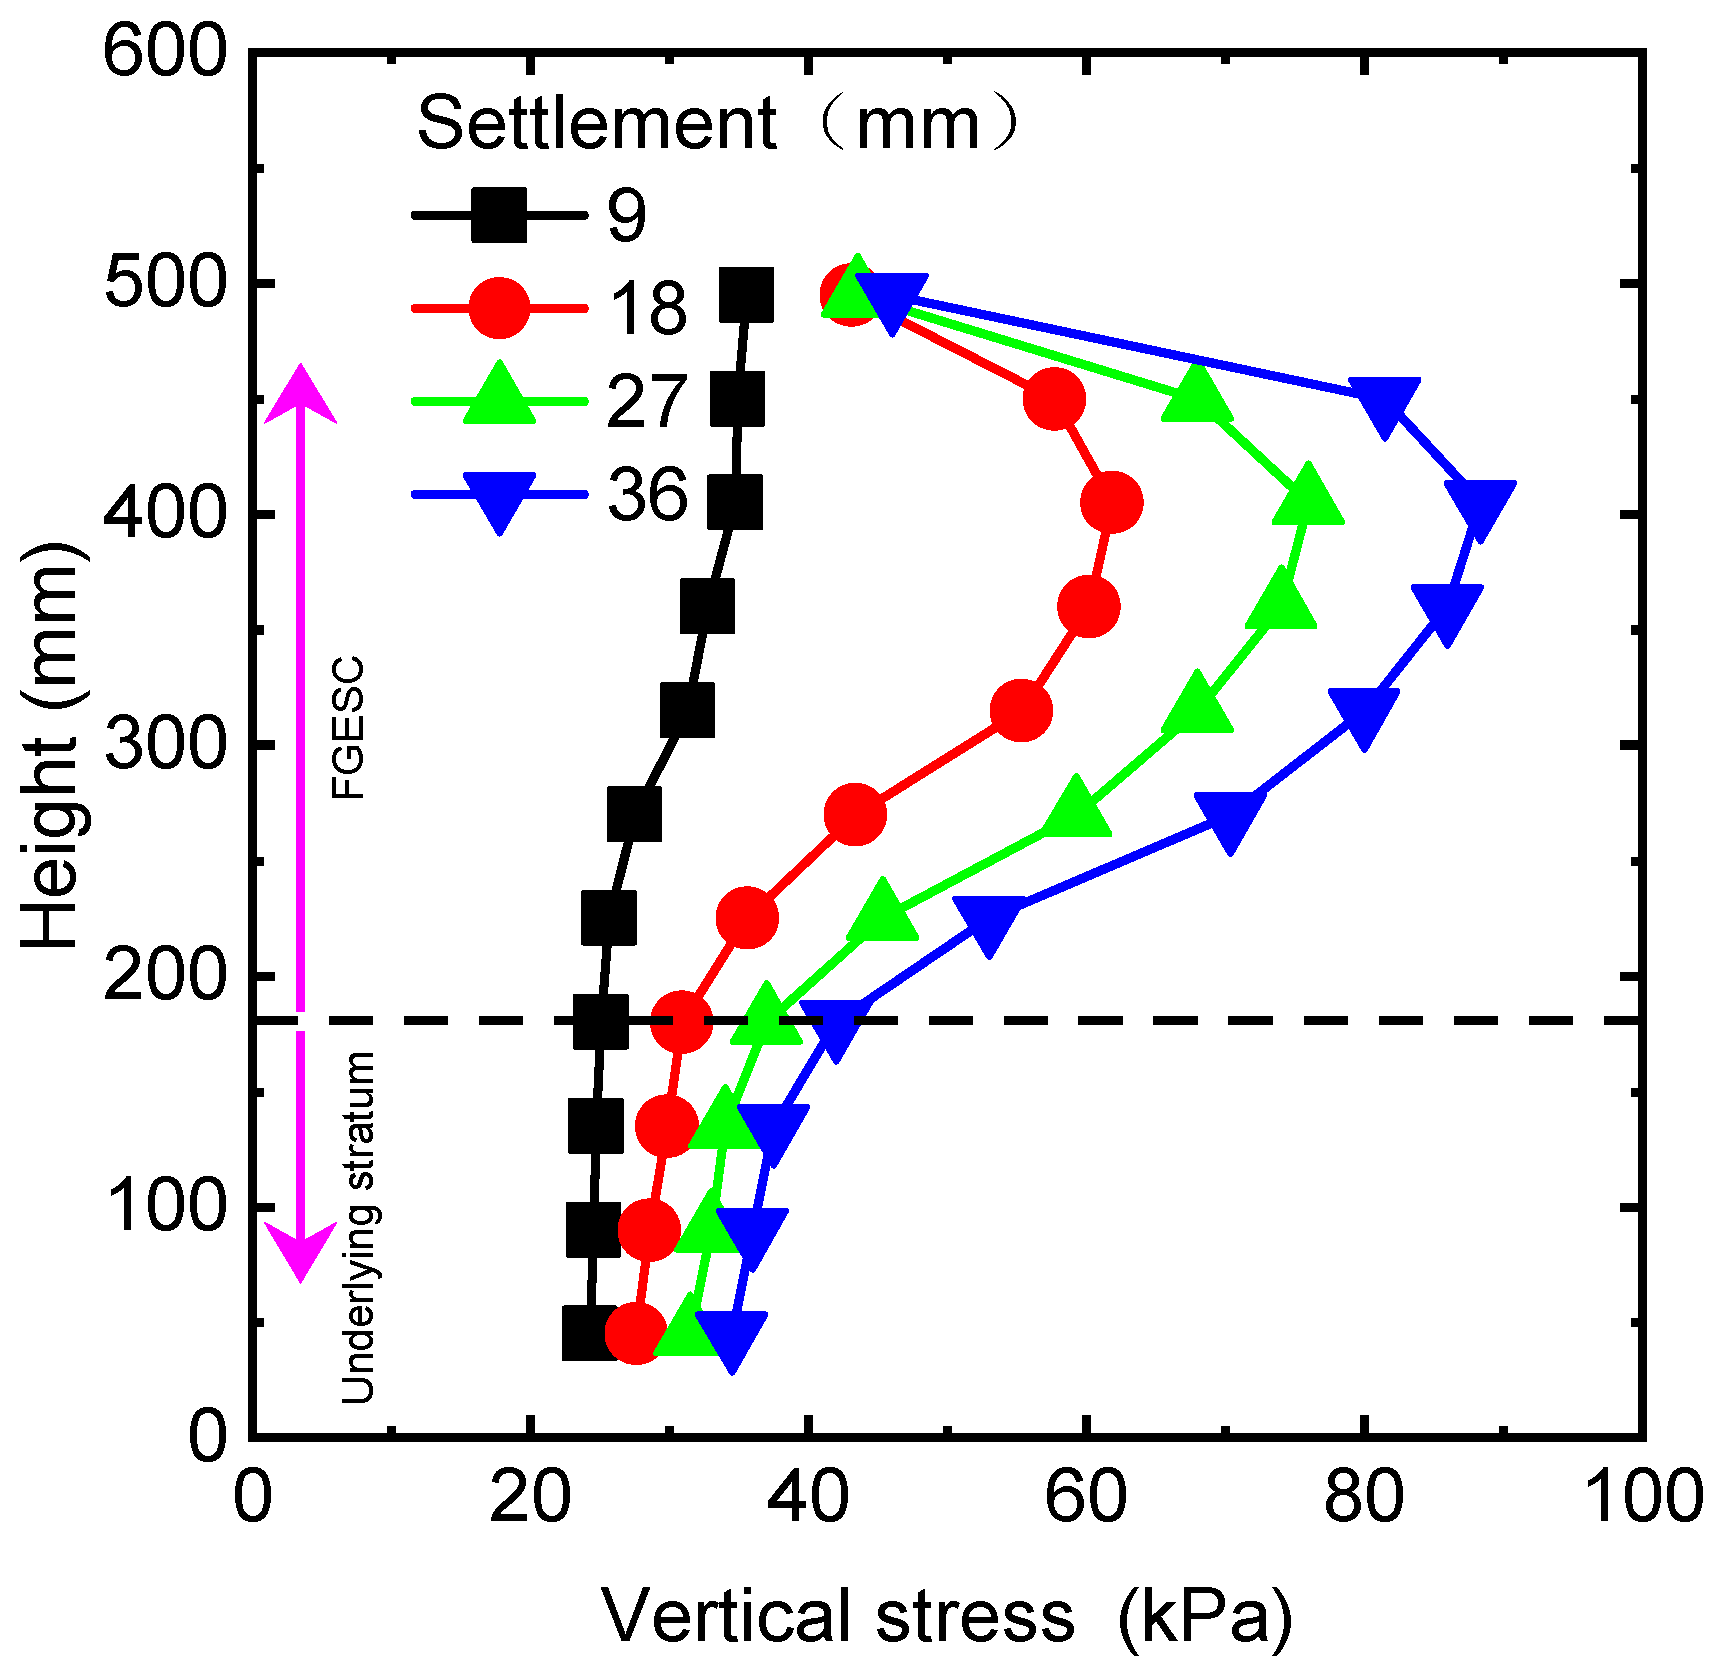
3.1.1. Vertical and Radial Stresses of FGESC and Underlying Soil

Figure 7 shows the vertical stress distribution along the column and the underlying soil at different settlements. When the settlement was 9 mm, the vertical stress distribution of the column was relatively uniform. With the increase in the settlement, the vertical stress in the column top area gradually increased. When the settlement reached 36 mm, the vertical stress in the column was maximum. The maximum value was 88.3 kPa, which occurred at a height of approximately 400 mm. There was a significant reduction in the vertical stress in the unreinforced section of the column. The vertical stress in the underlying soil increased slightly with settlement. This meant that the column could transfer the upper load to the underlying stratum.
Figure 8 shows the radial stress distribution along the column and the underlying soil at different settlements. When the settlement was 9 mm, the radial stress in the encased section at the top of the column was high. As the settlement increased, the radial stress in the encased section of the column top gradually increased. When the settlement reached 36 mm, the radial stress in the column was maximum. The maximum value was 44.8 kPa. The radial stress in the unreinforced section of the column was reduced significantly. The radial stress in the underlying soil increased slightly with settlement.
From the above, it can be seen that the vertical and radial stresses of the column are mainly concentrated in the encased section at the top of the column. The vertical and radial stresses in the unreinforced section at the bottom of the column and in the underlying soil increased slightly with the increase in the settlement.

3.1.2. Force Chain of FGESC

The transmission of contact force in the FGESC can be reflected through force chains. Figure 9 shows the contact force of the FGESC in soft clay. The lines in the figure represent the force chain, with thicker lines representing greater contact forces. It can be seen that the force chain in the encased section of the column was relatively complete. The contact force in the unreinforced section at the bottom of the FGESC was relatively small, and the force chain was thin. When the settlement was 18 mm, the maximum contact force occurred at the top of the column, which was 2075 KN, as shown in Figure 9a. When the settlement reached 36 mm, the force chain extended downward and became denser at the bottom of the column, as shown in Figure 9b. The maximum contact force reached 2098 KN. The geogrid played a confining role, and there was a clear contact force between the geogrid particles.

3.1.3. Porosity of the FGESC

Figure 10 shows the porosity changes of the FGESC with the settlement. Four representative locations were selected. They corresponded to column body heights of 45 mm, 135 mm, 225 mm, and 315 mm. The initial porosity of the column was 0.37. When the settlement was small, there was a slight volume expansion of the pile body under the load. The porosity of the FGESC increased slightly. With the increase in the settlement, the porosities at different column locations showed different change patterns. The porosity in the column top region (with heights of 225 mm and 315 mm) gradually increased with the increase in the settlement. The final porosity was about 0.41. The porosity of the aggregates located at the height of 135 mm gradually decreased under load. It indicated that the aggregates were in a compacted state. At the later stage of loading, the porosity of the aggregates located in the unreinforced section gradually increased. Eventually, it was about 0.37. Overall, there was volume expansion in the column top area and unreinforced section under load. There was a slight volume shrinkage in the lower part of the encased section.

3.1.4. Particle Movement of the FGESC

The movement of aggregates of the FGESC can be reflected by the coordination number and the sliding fraction. The coordination number indicates the number of effective contacts between particles. The larger the coordination number, the more effective the contacts between particles, and the denser the particles in the measurement sphere. The sliding fraction represents the ratio of the number of contacts where sliding occurs to the total contact in the measurement sphere. The larger the sliding fraction, the greater the rotation of the particles. The coordination number and the sliding fraction showed an inverse relationship.
Figure 11 shows the coordination number changes in the FGESC with the settlement. When the model was statically balanced, the coordination numbers of aggregates at different heights were different. With the increase in load, the coordination numbers of aggregates at different heights presented different trends. The coordination numbers of aggregates at the column top area fluctuated slightly with the settlement. At the end of loading, the coordination numbers of the aggregates at heights 315 mm and 225 mm were 4.0 and 4.5, respectively. The coordination number of the aggregates at the bottom of the encased section gradually increased with the settlement. At the end of loading, the coordination number reached 6.0. The coordination number of the aggregates in the unreinforced section increased first and then decreased with the settlement. Overall, at the end of loading, only the lower part of the encased section increased in coordination number, and the aggregates became dense. The coordination numbers in other parts decreased, and the aggregates became loose.
Figure 12 shows the sliding fraction changes of the FGESC with the settlement. The sliding fraction of the aggregates at the top of the column changed the most with the settlement. About one-third of the aggregates slid during the loading process. About 20% of the aggregates slid at the height of 225 mm. Only 10% of the aggregates located at the bottom of the encased section and the unreinforced section slid. It indicated that the aggregates in this region were in a relatively stable state.
The coordination number and the sliding fraction showed that the aggregates’ movement in the column top region was intense and became loose under the load. The aggregates at the column bottom were relatively stable.

3.2. Stresses of the Soil around the Column and the Underlying Stratum

The measurement spheres No. 12–37 were used to measure the stresses of the soil around the column and the underlying stratum. Figure 13 shows the vertical stresses of the soil around the column and the underlying stratum at various distances from the column center. The vertical stress of the soil near the column slightly increased with the settlement, as shown in Figure 13a. The increase in the vertical stress in the encased section was more obvious than that in the unreinforced section. However, the increase was still much smaller than that of the column body. The vertical stress of the soil near the side boundary was basically unchanged with the settlement, as shown in Figure 13b. The vertical stress was distributed by gravity and increased linearly along the depth.
Figure 14 shows the radial stresses of the soil around the column and the underlying stratum at various distances from the column center. The radial stress of the soil near the column slightly increased with the settlement, as shown in Figure 14a. When the settlement reached 27 mm and 36 mm, there was a certain increase in the radial stress in the soil near the unreinforced section. The radial stress of the soil near the side boundary was basically unchanged with the settlement, as shown in Figure 14b. The radial stresses in the underlying stratum were largely unaffected by the settlement.
The above analysis shows that the stresses of the soil near the column were affected by settlement, and the stresses of the soil near the side boundary were largely unaffected by settlement. Due to the presence of the geogrid, the movement of the aggregates was restricted. It prevented the transfer of significant stress from the column to the soil around the column.

3.3. Failure Mode

Previous studies [10,23] have shown that when the end bearing GESC was not fully encased, the failure mode of the GESC was swelling deformation below the encased section. Due to the fact that the FGESC was located in deep soft soil, its failure mode changed. The failure mode of the FGESC was analyzed by hiding the pre-grouped soil. Figure 15 shows the changes of the column body with the settlement. The red and blue balls represent aggregates of different sizes. The small purple balls represent geogrids. When the FGESC model was first generated, the column body was a regular cylinder. When the settlement reached 18 mm, the column body maintained good integrity except for local irregular deformation. When the settlement reached 36 mm, the deformation of the encased section of the column was not significant, and there was slight swelling deformation in the unreinforced section of the column.
Figure 16 shows the changes of the column bottom with settlement. The soil around the column is represented by green balls. Before loading, the bottom of the column was in the same plane with the soil around the column. When the settlement reached 18 mm, the column bottom slightly intruded into the underlying stratum. When the settlement reached 36 mm, the column bottom was mixed with soil around the column and penetrated into the underlying stratum.
According to Figure 15 and Figure 16, it can be concluded that the failure mode of the FGESC was mainly penetration failure, accompanied by slight swelling deformation. This was significantly different from the failure mode of end bearing GESC.

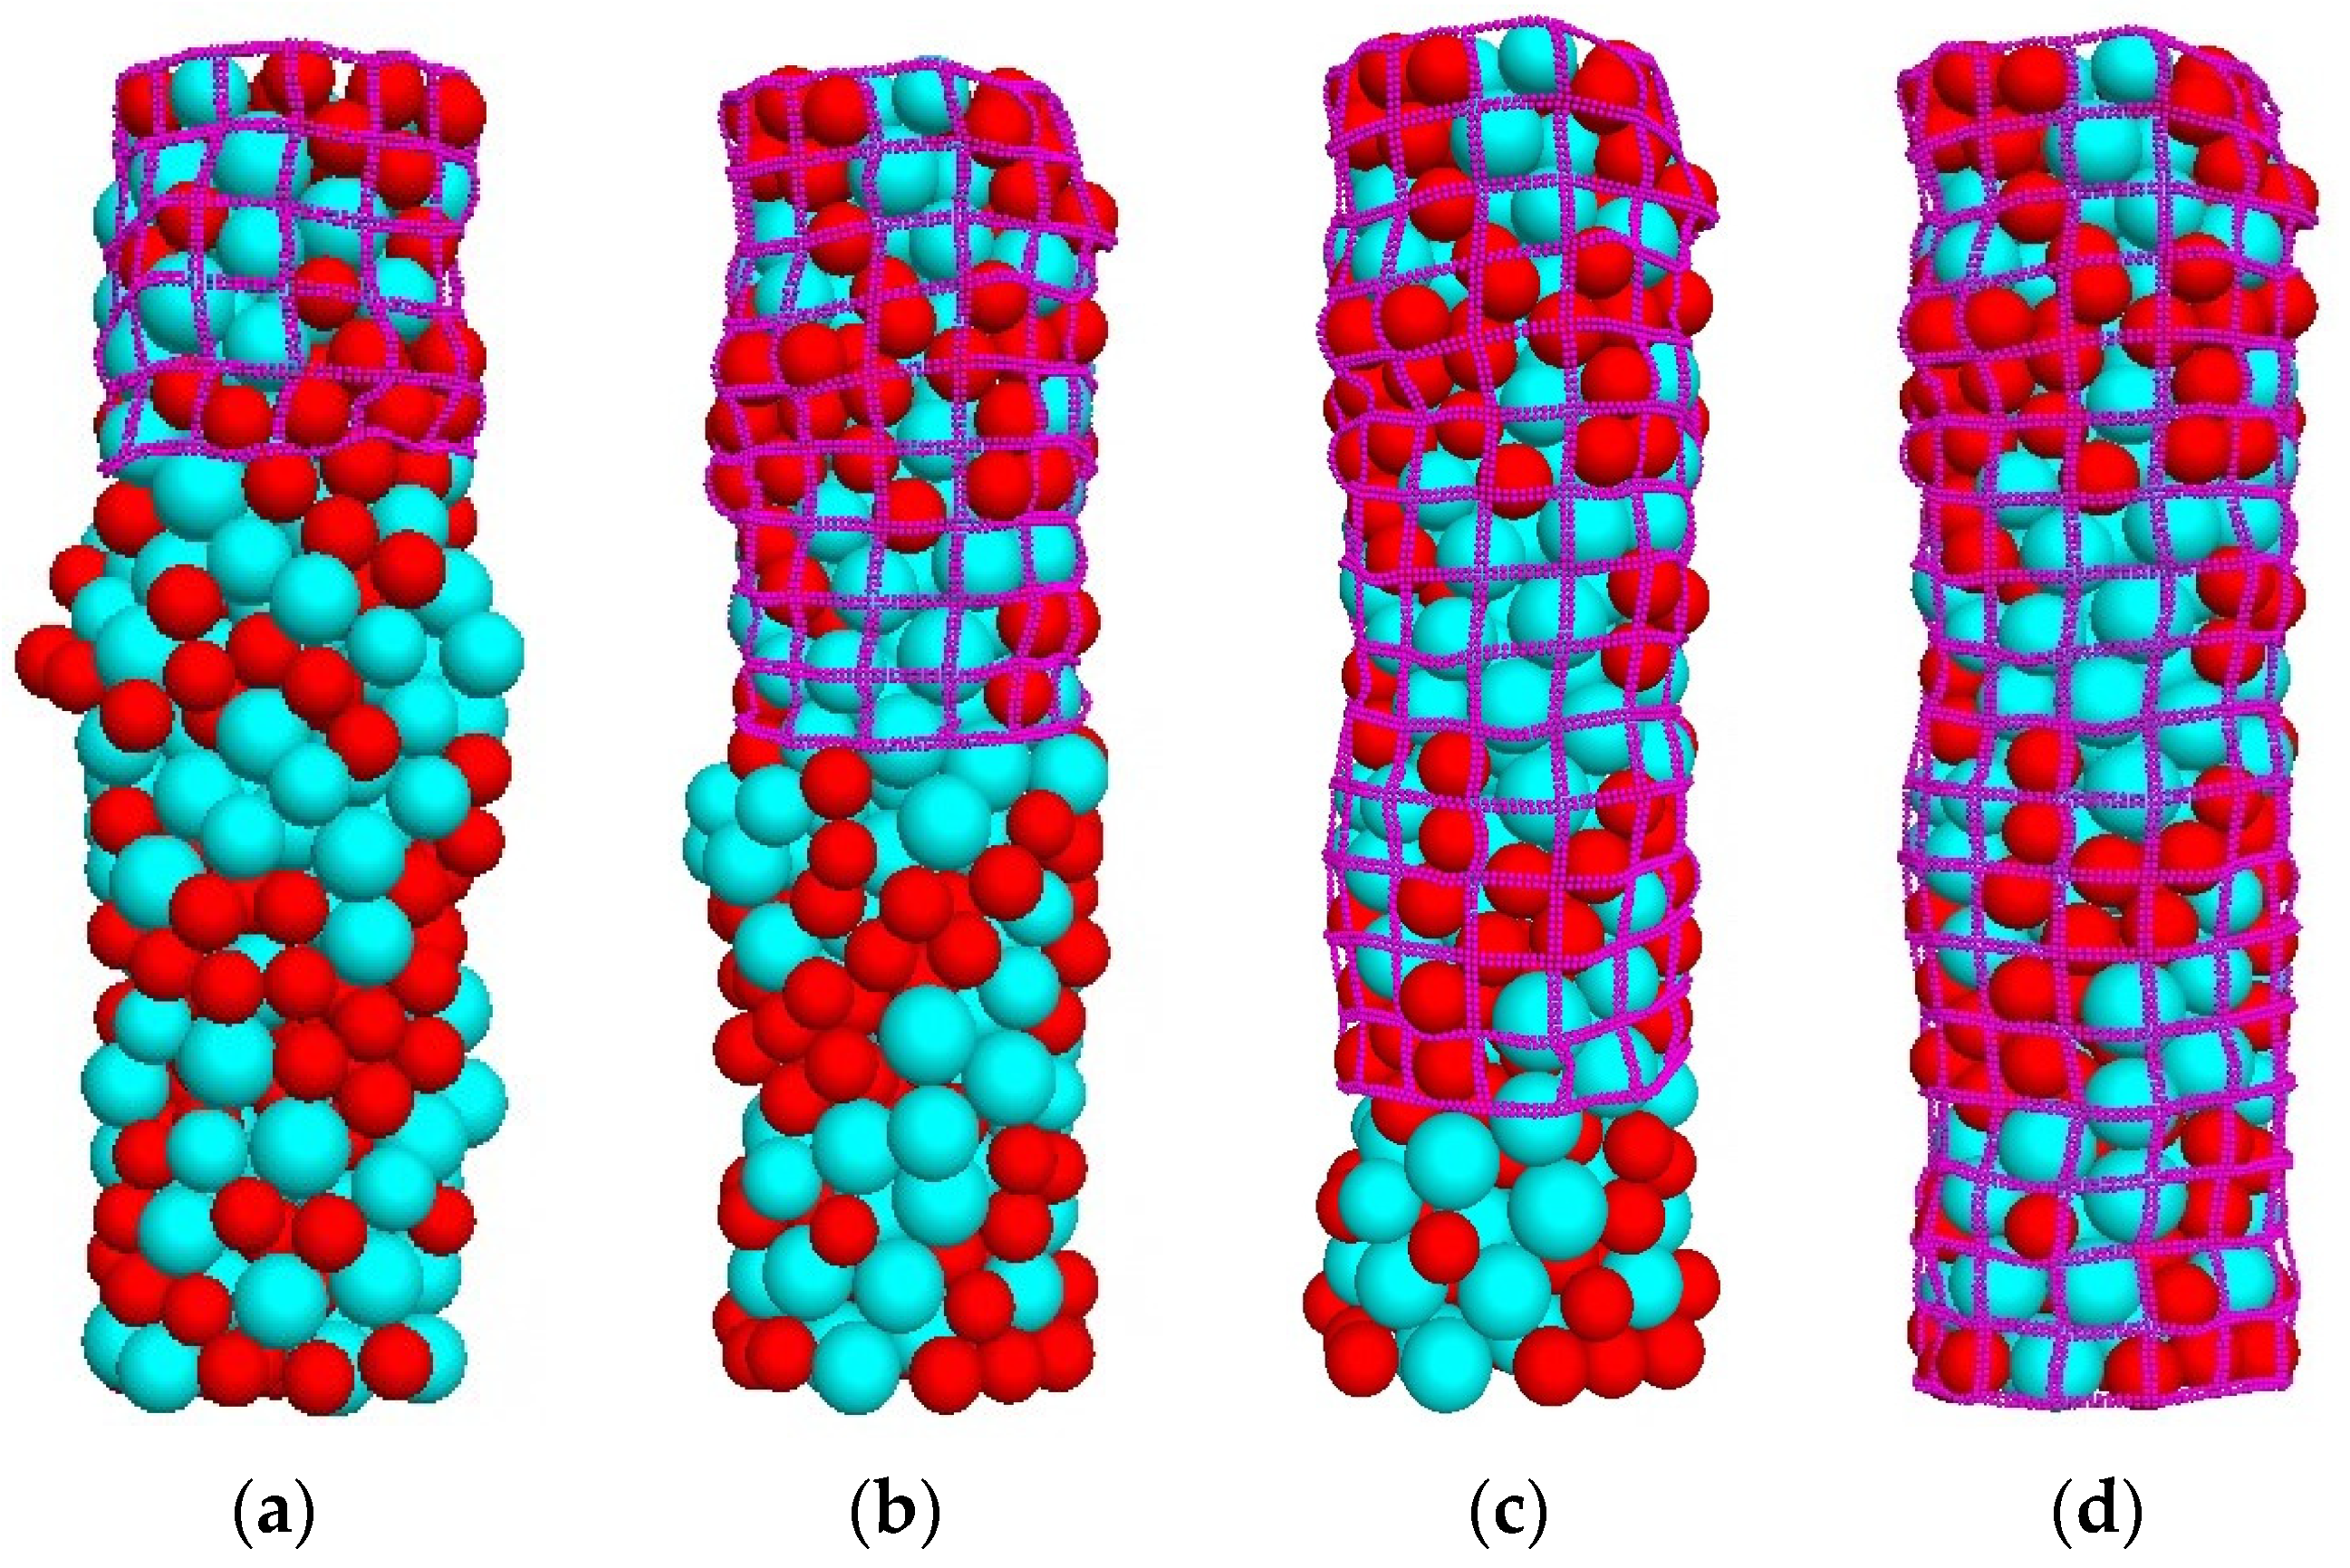
3.4. Effect of Encasement Length

The encasement length had a significant impact on the load-bearing deformation characteristics of the GESC. As the encasement depth increased, the bearing capacity of the GESC increased. When the full length of the column was encased, the bearing capacity of the GESC mainly depended on the strength of the geogrid, and its failure mode was tensile failure of the geogrid. In order to investigate the effect of encasement length on the load-bearing deformation of the FGESC, three other DEM models were established. Their encasement depths were 100 mm, 180 mm, and 360 mm. The other parameters of the three models were the same as those of the model with an encasement depth of 280 mm.

3.4.1. Effect on Load-Bearing Capacity of FGESC

Figure 17 shows the load-bearing capacity of the FGESC with different encasement depths. It can be seen that with the increase in the encasement depth, the bearing capacity of the FGESC increased. When the settlement was 18 mm, the bearing capacities of the FGESC with encasement depths of 100 mm, 180 mm, 280 mm, and 360 mm were 58.0 kPa, 64.5 kPa, 73.0 kPa, and 77.4 kPa, respectively. When the encasement depth increased from 280 mm to 360 mm, the bearing capacity increased by 4.4 kPa, which was a small increase.

3.4.2. Effect on Contact Force of the FGESC

Figure 18 shows the contact force of the FGESC with different encasement depths when the settlement was 36 mm. The red and thick lines represent large contact force. It can be seen that when the encasement depth was 100 mm, the contact force was mainly concentrated in the column top region. The force chain in the unreinforced section had a clear state of divergence, and the force chain did not extend to the bottom of the column. When the encasement depth was 180 mm, the encased section had a large contact force. The force chain could extend to the bottom of the column, but it was relatively sparse. When the encasement depth was 280 mm, the force chain was relatively complete and could extend to the bottom of the column. When the encasement depth was 360 mm, there was a relatively large contact force throughout the column. The force chain effectively extended to the bottom of the column, with a clear force chain near the bottom of the column. Overall, as the encasement depth increased, the force chain of the FGESC was more complete, and the ability to transfer the upper loads also increased.

3.4.3. Effect on Failure Mode of the FGESC

Figure 19 shows the changes of the column body with different encasement depths when the settlement was 36 mm. When the encasement depth was 100 mm, there was obvious swelling deformation below the encased section of the column body. When the encasement depth was 180 mm, swelling deformation occurred below the encased section of the column body. When the encasement depth was 280 mm, there was no obvious deformation in the encased section of the column, and there was slight swelling deformation in the unreinforced section. When the encasement depth was 360 mm, the whole column body maintained a relatively regular cylindrical shape under the load.
Figure 20 shows the changes of the column bottom with different encasement depths when the settlement was 36 mm. When the encasement depth was 100 mm, the column bottom did not change with settlement and was always in the same plane as the soil around the column. When the encasement depth was 180 mm, the column bottom slightly intruded into the underlying stratum. When the encasement depths were 280 mm and 360 mm, the column bottom was clearly penetrated into the underlying stratum.
According to Figure 19 and Figure 20, as the encasement depth increased, the failure mode of the FGESC gradually transitioned from swelling deformation to penetration failure. The encasement depth to a certain extent controlled the failure mode of the FGESC.

4. Conclusions

A discrete element model of an FGESC in soft soil foundation was established. The stresses, particle movement, and failure mode of the FGESC with an encasement depth of 280 mm were analyzed. The stresses of the soil around the column and the soil in the underlying stratum were also analyzed. Meanwhile, the effect of the encasement depth on the bearing capacity, contact force, and failure mode of the FGESC was studied. The following conclusions can be drawn:
(1)
The FGESC with encasement depth of 280 mm has large vertical and radial stresses at the top region of the column under load. The aggregates in the column top region become loose under load as the porosity increases, the coordination number decreases, and the sliding ratio increases. The force chain of the column is relatively complete and can effectively transfer the upper load downward. When the encasement depth is 280 mm, the failure mode of the FGESC is mainly in the form of penetration failure.
(2)
When the encasement depth is 280 mm, the vertical and radial stresses of the soil near the column body are not affected much by the column body. It indicates that the presence of geogrids limits the movement of the aggregates in the column. Therefore, the large stresses of the column cannot be effectively transferred to the soil around the column.
(3)
As the encasement depth increases, the bearing capacity of the FGESC increases, the force chain of the column body becomes more complete, and the column can transfer the load downward more effectively. However, when the encasement depth exceeds 280 mm, the bearing capacity of FGESC does not increase much.
(4)
The encasement depth to a certain extent controls the failure mode of the FGESC. As the encasement depth increases, the failure mode of the FGESC gradually transitions from swelling deformation to penetration failure.
In this study, the load-bearing deformation characteristics and microscopic mechanism of the FGESC were mainly studied. The deformation of the aggregates under load and the influence of pore water were ignored. In future work, the Clump function of PFC will be used to simulate the aggregates; it is more realistic to reflect the irregular shape of the aggregates. The pore water will be taken into account to study the dissipation of pore water in the column and soft clay.

Author Contributions

Conceptualization, F.L., P.G. and X.G.; methodology, F.L. and B.L.; software, F.L. and X.H.; validation, P.G. and H.H.; investigation, F.L., H.H. and X.H. All authors have read and agreed to the published version of the manuscript.

Funding

This research work was funded by the National Natural Science Foundation of China (51278438).

Institutional Review Board Statement

Not applicable.

Informed Consent Statement

Not applicable.

Data Availability Statement

The data supporting the findings of this study are not publicly available due to privacy.

Conflicts of Interest

The authors declare no conflict of interest.

References

  1. Ali, G.; Iman, H.; Mehdi, S. Deformation and stability analysis of embankment over stone column-strengthened soft ground. KSCE J. Civ. Eng. 2021, 25, 404–416. [Google Scholar]
  2. Kousik, D.; Narendra, K.S.; Jagtap, B.N. Laboratory model studies on unreinforced and geogrid-reinforced sand bed over stone column-improved soft clay. Geotext. Geomembr. 2011, 29, 190–196. [Google Scholar]
  3. Lajevardi, S.H.; Shamsi, H.R.; Hamidi, M.; Enami, S. Numerical and experimental studies on single stone columns. Soil Mech. Found. Eng. 2018, 55, 340–345. [Google Scholar] [CrossRef]
  4. McCabe, B.A.; Nimmons, G.J.; Egan, D. A review of field performance of stone columns in soft soils. Geotech. Eng. 2009, 162, 323–334. [Google Scholar] [CrossRef] [Green Version]
  5. Gu, M.X.; Han, J.; Zhao, M.H. Three-dimensional DEM analysis of axially loaded geogrid-encased stone column in clay bed. Int. J. Geomech. 2020, 20, 11. [Google Scholar] [CrossRef]
  6. Almeida, M.S.S.; Hosseinpour, I.; Riccio, M. Performance of a geosynthetic-encased column (GEC) in soft ground: Numerical and analytical studies. Geosynth. Int. 2013, 20, 251–262. [Google Scholar] [CrossRef]
  7. Ali, K.; Shahu, J.T.; Sharma, K.G. Model tests on single and groups of stone columns with different geosynthetic reinforcement arrangement. Geosynth. Int. 2014, 21, 103–118. [Google Scholar] [CrossRef]
  8. Xu, Z.Y.; Zhang, L.; Zhou, S. Influence of encasement length and geosynthetic stiffness on the performance of stone column: 3D DEM-FDM coupled numerical investigation. Comput. Geotech. 2021, 132, 15. [Google Scholar] [CrossRef]
  9. Nagula, S.S.; Nguyen, D.M.; Grabe, J. Numerical modelling and validation of geosynthetic encased columns in soft soils with installation effect. Geotext. Geomembr. 2018, 46, 790–800. [Google Scholar] [CrossRef]
  10. Dash, S.K.; Bora, M.C. Influence of geosynthetic encasement on the performance of stone columns floating in soft clay. Can. Geotech. J. 2013, 50, 744–765. [Google Scholar] [CrossRef]
  11. Zhang, L.; Xu, Z.Y.; Zhou, S. Vertical cyclic loading response of geosynthetic-encased stone column in soft clay. Geotextile. Geomembr. 2020, 48, 897–911. [Google Scholar] [CrossRef]
  12. Yang, F.O.; Fan, G.; Wang, K.F.; Yang, C.; Lyu, W.Q.; Zhang, J.J. A large-scale shaking table model test for acceleration and deformation response of geosynthetic encased stone column composite ground. Geotextile. Geomembr. 2021, 49, 1407–1418. [Google Scholar] [CrossRef]
  13. Alexiew, D.; Raithel, M.; Küster, V.; Detert, O. 15 years of experience with geotextile encased granular columns as foundation system. In Proceedings of the ISSMGE Technical Committee TC 211 International Symposium on Ground Improvement (IS-GI BRUSSELS 2012), Brussels, Belgium, 31 May–1 June 2012. [Google Scholar]
  14. Hosseinpour, I.; Almeida, M.S.S.; Riccio, M. Ground improvement of soft soil by geotextile-encased columns. Ground Improv. 2016, 169, 297–305. [Google Scholar] [CrossRef] [Green Version]
  15. Xu, F.; Moayedi, H.; Foong, L.K.; Moghadam, M.J.; Zangeneh, M. Laboratory and numerical analysis of geogrid encased stone columns. Measurement 2021, 169, 14. [Google Scholar] [CrossRef]
  16. Deshpande, T.D.; Kumar, S.; Begum, G.; Basha, S.A.K.; Rao, B.H. Analysis of railway embankment supported with geosynthetic-encased stone columns in soft clays: A case study. Int. J. Geosynth. Ground Eng. 2021, 43, 16. [Google Scholar] [CrossRef]
  17. Farah, R.E.; Nalbantoglu, Z. Behavior of geotextile-encased single stone column in soft soils. Arab. J. Sci. Eng. 2020, 45, 3877–3890. [Google Scholar] [CrossRef]
  18. Wang, Q.D.; Michal, S.; Gu, X.F.; Miao, Z.P.; Du, W.C.; Zhang, J.; Gang, C. Lubricity and rheological properties of highly dispersed graphite in clay-water-based drilling fluids. Materials 2022, 15, 1083. [Google Scholar] [CrossRef]
  19. Gao, J.L.; Zhang, Y.P.; Wang, C.H.; Yuan, C. Behavior of characteristics of geosynthetic-encased stone column under cyclic loading. Transp. Geotech. 2021, 28, 100554. [Google Scholar] [CrossRef]
  20. Zhou, Y.; Kong, G.Q.; Yang, Q.; Li, H. Deformation analysis of geosynthetic-encased stone column using cavity expansion models with emphasis on boundary condition. Geotext. Geomembr. 2019, 47, 831–842. [Google Scholar] [CrossRef]
  21. Hong, Y.S.; Wu, C.S.; Kou, C.M.; Chang, C.H. A numerical analysis of a fully penetrated encased granular column. Geotext. Geomembr. 2017, 45, 391–405. [Google Scholar] [CrossRef]
  22. Hataf, N.; Nabipour, N.; Sadr, A. Experimental and numerical study on the bearing capacity of encased stone columns. Int. J. Geo-Eng. 2020, 11, 11. [Google Scholar] [CrossRef] [Green Version]
  23. Alexiew, D.; Moormann, C.; Jud, H. Foundation of a coal/coke stockyard on soft soil with geotextile encased columns and horizontal reinforcement. In Proceedings of the 17th International Conference on Soil Mechanics and Geotechnical Engineering, Alexandria, Egypt, 5–9 October 2009; pp. 2236–2239. [Google Scholar]
  24. Cimentada, A.; Costa, A.D.; Jorge, C.; Sagaseta, C. Laboratory study on radial consolidation and deformation in clay reinforced with stone columns. Can. Geotech. J. 2011, 48, 36–52. [Google Scholar] [CrossRef]
  25. Hasan, M.; Samadhiya, N.K. Experimental and numerical analysis of geosynthetic-reinforced floating granular piles in soft clays. Int. J. Geosynth. Ground Eng. 2016, 22, 13. [Google Scholar] [CrossRef] [Green Version]
  26. Hasan, M.; Samadhiya, N.K. Performance of geosynthetic-reinforced granular piles in soft clays: Model tests and numerical analysis. Comput. Geotech. 2017, 87, 178–187. [Google Scholar] [CrossRef]
  27. Najjar, S.S.; Sadek, S.; Lattouf, H.B.; Maalouf, Y. Drained triaxial response of clay reinforced with sand columns. Ground Improv. 2018, 173, 170–186. [Google Scholar] [CrossRef]
  28. Murugesan, S.; Rajagopal, K. Geosynthetic-encased stone columns: Numerical evaluation. Geotext. Geomembr. 2006, 24, 349–358. [Google Scholar] [CrossRef]
  29. Murugesan, S.; Rajagopal, K. Model tests on geosynthetic-encased stone columns. Geosynth. Int. 2007, 14, 346–354. [Google Scholar] [CrossRef]
  30. Murugesan, S.; Rajagopal, K. Studies on the Behavior of Single and Group of Geosynthetic Encased Stone Columns. J. Geotech. Geoenvironmental Eng. 2009, 136, 129–139. [Google Scholar] [CrossRef]
  31. Ghazavi, M.; Afshar, J.N. Bearing capacity of geosynthetic encased stone columns. Geotext. Geomembr. 2013, 38, 26–36. [Google Scholar] [CrossRef]
  32. Lateef, A.D.; Mohammad, Y.S. Three-dimensional numerical study on behavior of geosynthetic encased stone column placed in soft soil. Geotech. Geol. Eng. 2021, 39, 1901–1922. [Google Scholar]
  33. Hosseinpour, I.; Soriano, C.; Almeida, M.S.S. A comparative study for the performance of encased granular columns. J. Rock Mech. Geotech. Eng. 2019, 11, 379–388. [Google Scholar] [CrossRef]
  34. Chen, J.F.; Wang, X.T.; Xue, J.F.; Zeng, Y.; Feng, S.Z. Uniaxial compression behavior of geotextile encased stone columns. Geotext. Geomembr. 2018, 46, 277–283. [Google Scholar] [CrossRef]
  35. Gniel, J.; Bouazza, A. Improvement of soft soils using geogrid encased stone columns. Geotext. Geomembr. 2009, 27, 167–175. [Google Scholar] [CrossRef]
  36. Liu, S.C.; Zhang, D.W.; Song, T.; Zhang, G.L.; Fan, L.B. A method of settlement calculation of ground improved by floating deep mixed columns based on laboratory model tests and finite element analysis. Int. J. Civ. Eng. 2021, 16, 207–222. [Google Scholar] [CrossRef]
  37. Wang, K.F.; Liu, M.J.; Cao, J.; Niu, J.Y.; Zhuang, Y.X. Bearing characteristics of composite foundation reinforced by geosynthetic-encased stone column: Field tests and numerical analyses. Sustainability 2023, 15, 25. [Google Scholar] [CrossRef]
  38. Kang, B.; Wang, J.Q.; Zhou, Y.W.; Huang, S.B. Study on bearing capacity and failure mode of multi-layer-encased geosynthetic-encased stone column under dynamic and static loading. Sustainability 2023, 15, 18. [Google Scholar] [CrossRef]
  39. Liu, M.J.; Wang, K.F.; Niu, J.Y.; Ouyang, F. Static and dynamic load transfer behaviors of the composite foundation reinforced by the geosynthetic-encased stone column. Sustainability 2023, 15, 19. [Google Scholar] [CrossRef]
  40. Anita, A.; Karthika, S.; Divya, P.V. Construction and demolition waste as valuable resources for geosynthetic-encased stone columns. J. Hazard. Toxic Radioact. Waste 2023, 27, 13. [Google Scholar] [CrossRef]
  41. Almeida, M.S.S.; Hosseinpour, I.; Riccio, M.; Alexiew, D. Behavior of geotextile-encased granular columns supporting test embankment on soft deposit. J. Geotech. Geoenviron. Eng. 2015, 141, 9. [Google Scholar] [CrossRef]
  42. Debnath, P.; Dey, A.K. Bearing capacity of geogrid reinforced sand over encased stone columns in soft clay. Geotext. Geomembr. 2017, 45, 653–664. [Google Scholar] [CrossRef]
  43. Chen, J.F.; Zhang, X.; Yoo, C.; Gu, Z.A. Effect of basal reinforcement on performance of floating geosynthetic encased stone column-supported embankment. Geotext. Geomembr. 2022, 50, 566–580. [Google Scholar] [CrossRef]
  44. Hu, X.J.; Hu, H.B.; Xie, N.; Huang, Y.J.; Guo, P.P.; Gong, X.N. The effect of grain size heterogeneity on mechanical and microcracking behavior of pre-heated Lac du Bonnet granite using a grain-based model. Rock Mech. Rock Eng. 2023, 1–32. [Google Scholar] [CrossRef]
  45. Hu, X.J.; Guo, P.P.; Xie, N.; Hu, H.B.; Lei, G.; Ma, J.J.; Gong, X.N. Creep behavior and associated acoustic characteristics of heterogeneous granite containing a single pre-existing flaw using a grain-based parallel-bonded stress corrosion model. Rock Mech. Rock Eng. 2023, 1–34. [Google Scholar] [CrossRef]
  46. Hu, X.J.; Xie, N.; Zhu, Q.; Chen, L.; Li, P. Modeling damage evolution in heterogeneous granite using digital image-based grain-based model. Rock Mech. Rock Eng. 2020, 53, 4925–4945. [Google Scholar] [CrossRef]
  47. Hu, X.J.; Gong, X.N.; Hu, H.B.; Guo, P.P.; Ma, J.J. Cracking behavior and acoustic emission characteristics of heterogeneous granite with double pre-existing filled flaws and a circular hole under uniaxial compression: Insights from grain-based discrete element method modeling. Bull. Eng. Geol. Environ. 2022, 81, 162. [Google Scholar] [CrossRef]
  48. Liu, F.; Guo, P.P.; Hu, H.B.; Zhu, C.W.; Gong, X.N. Loading behavior and soil-structure interaction for a floating stone column under rigid foundation: A DEM study. Geofluids 2021, 13, 9508367. [Google Scholar] [CrossRef]
  49. Gu, M.X.; Cui, J.; Yuan, J.; Wu, Y.; Li, Y.D.; Mo, H.Z. The stress and deformation of stone column-improved soft clay by discrete element modelling. Eur. J. Environ. Civ. Eng. 2020, 18, 1544–1560. [Google Scholar] [CrossRef]
Figure 1. Unit cell idealization: (a) Group of FGESCs. (b) Influence zone of FGESC. (c) Unit cell.
Applsci 13 06838 g001
Figure 2. A unit cell of an FGESC in soft clay: (a) Components and dimensions of the DEM model for the FGESC. (b) Sectional view of the DEM model for FGESC.
Applsci 13 06838 g002
Figure 3. Measurement sphere in the model.
Applsci 13 06838 g003
Figure 4. Schematic diagram of the laboratory test.
Applsci 13 06838 g004
Figure 5. The FGESC laboratory test.
Applsci 13 06838 g005
Figure 6. Load–settlement curves from DEM model and laboratory test.
Applsci 13 06838 g006
Figure 7. Vertical stresses of the FGESC and underlying soil.
Applsci 13 06838 g007
Figure 8. Radial stresses of the FGESC and underlying soil.
Applsci 13 06838 g008
Figure 9. Contact force of FGESC in soft clay: (a) When the settlement is 18 mm, the maximum contact force is 2075 KN. (b) When the settlement is 36 mm, the maximum contact force is 2098 KN.
Applsci 13 06838 g009
Figure 10. Porosity changes of the FGESC with the settlement.
Applsci 13 06838 g010
Figure 11. Coordination number changes of the FGESC with the settlement.
Applsci 13 06838 g011
Figure 12. Sliding fraction changes of the FGESC with the settlement.
Applsci 13 06838 g012
Figure 13. Vertical stresses of the soil around the column and the underlying stratum at various distances from the column center: (a) 65 mm and (b) 105 mm.
Applsci 13 06838 g013
Figure 14. Radial stresses of the soil around the column and the underlying stratum at various distances from the column center: (a) 65 mm and (b) 105 mm.
Applsci 13 06838 g014
Figure 15. Changes of column body with settlement: (a) 0 mm, (b) 18 mm, and (c) 36 mm.
Applsci 13 06838 g015
Figure 16. Changes of column bottom with settlement: (a) 0 mm, (b) 18 mm, and (c) 36 mm.
Applsci 13 06838 g016
Figure 17. Load-bearing capacity of FGESC with different encasement depths.
Applsci 13 06838 g017
Figure 18. Contact force of the FGESC with different encasement depths: (a) 100 mm, (b) 180 mm, (c) 280 mm, and (d) 360 mm.
Applsci 13 06838 g018
Figure 19. Changes of column body with different encasement depths: (a) 100 mm, (b) 180 mm, (c) 280 mm, and (d) 360 mm.
Applsci 13 06838 g019
Figure 20. Changes of column bottom with different encasement depths: (a) 100 mm, (b) 180 mm, (c) 280 mm, and (d) 360 mm.
Applsci 13 06838 g020
Table 1. Mesoscopic properties of aggregates.
ParameterValue
Particle density (g/cm3)2.68
Coefficient of particle friction0.80
Particle normal stiffness (N/m)5.80 × 107
Particle shear stiffness (N/m)1.00 × 107
Table 2. Mesoscopic properties of geogrid.
ParameterValue
Particle density (g/cm3)0.96
Particle normal stiffness (N/m)1.85 × 106
Particle shear stiffness (N/m)1.85 × 106
Parallel bond normal stiffness (N/m3)2.80 × 1011
Parallel bond shear stiffness (N/m3)2.50 × 107
Parallel bond normal strength (N/m2)3.00 × 108
Parallel bond shear strength (N/m2)3.00 × 108
Table 3. Mesoscopic properties of soil particles.
ParameterValue
Particle density (g/cm3)2.68
Coefficient of particle friction0.30
Particle normal stiffness (N/m)3.80 × 104
Particle shear stiffness (N/m)3.80 × 104
Contact bond normal strength (N)3.60
Contact bond shear strength (N)3.60
Disclaimer/Publisher’s Note: The statements, opinions and data contained in all publications are solely those of the individual author(s) and contributor(s) and not of MDPI and/or the editor(s). MDPI and/or the editor(s) disclaim responsibility for any injury to people or property resulting from any ideas, methods, instructions or products referred to in the content.

