1. Introduction
Liquefaction under seismic loads has caused severe damage to various structures due to the loss of strength and stiffness of the liquefied ground [
1,
2]. In particular, liquefaction of sloping ground induces more dangerous conditions, resulting in the lateral spreading of soil in the downslope direction [
3,
4,
5]. Pile foundations in waterfront structures are typically installed on slopes, and the liquefaction potential is high in recently formed reclaimed or sedimentary grounds near the coast or river [
6,
7,
8,
9]. Therefore, the liquefaction of slopes can cause significant damage to pile structures and should be properly simulated by considering the soil–pile interaction on liquefied slopes.
In order to predict liquefaction-induced damage, studies were conducted based on the statistical analysis of reported liquefaction damage data. Bartlett and Youd [
10] and Youd et al. [
11] proposed empirical formulas for the lateral spread displacement under free-face and gentle slope conditions based on a multilinear regression method. JRA [
12] proposed an empirical formula for the lateral load on piles during liquefaction based on back-analyses of pile damage during the 1995 Kobe earthquake.
Experimental approaches have been carried out to simulate piles in liquefied ground. Dobry et al. [
13] proposed a uniform lateral load on piles for a liquefied layer based on centrifuge model experiments with piles embedded in a liquefied ground with a 2-degree inclination. He et al. [
14] suggested a linearly distributed lateral load on piles for a liquefied layer, which was identical to the total stress of the ground based on shaking table tests.
A method for applying lateral design load along a pile length was found to predict the maximum bending moment of the pile due to liquefaction [
15,
16]. However, using this method, it is difficult to consider displacement variations within liquefiable soil layers, and it tends to overestimate the pile head displacement [
17]. To address this limitation, the
p-y spring method was proposed, which varies the soil reaction according to the relative displacement between the pile and soil.
The
p-y curve, which is the most widely adopted nonlinear spring representing the horizontal interaction between a pile and the ground [
18,
19,
20], was proposed to capture the nonlinear horizontal resistance behavior of the ground when a pile head is subjected to a horizontal load. These curves are independently connected for each element of the pile. When considering the liquefied soil conditions, reducing the ultimate resistance [
21,
22] or changing the shape of the
p-y curve [
23,
24] were proposed.
The p-y method assumes independent nonlinear springs for each sub-layer of the ground, which requires a separate estimation of the final deformation shape for each liquefied ground layer. However, the ground responses of a finite slope, including excess pore pressure and deformation, are significantly influenced by the horizontal and vertical interactions within the liquefied ground. For a rigorous analysis, it is necessary to model the entire ground behavior and define the interaction between the liquefied soil and pile elements.
Some researchers conducted numerical studies on piles in liquefied ground. Considering the effect of liquefaction on soil–pile interaction, a method of simply reducing the friction angle of the interface spring was adopted. However, the level of reduction in friction angle is somewhat arbitrary. Kraft Jr [
25] and Reddy et al. [
26] proposed 70% and 60% of the friction angle of non-liquefied ground, respectively. Beringen et al. [
27] and Randolph et al. [
28] proposed a reduction of 5 degrees less than the maximum friction angle. However, it is crucial to recognize that these methods have limitations in accurately capturing a significant phenomenon: the rapid weakening of soil strength resulting from slope liquefaction.
In general, the weakening of soil strength due to liquefaction occurs as a consequence of reduced confining pressure caused by the generation of excess pore pressure. Nevertheless, it is worth noting that rapid weakening can also manifest due to soil instability, depending on the initial stress state [
29]. Noteworthy studies by Vaid and Chern [
30] and Alarcon-Guzman et al. [
31] reported instances of such rapid weakening observed in liquefaction tests under dynamic loading.
However, the employment of interface springs incorporating a constant friction angle merely accounts for the effect of confining pressure reduction and does not adequately address the rapid decline in strength associated with soil instability. Furthermore, while the determination of the constant friction angle through additional static pile pushing analysis was recommended [
32], its compatibility with the advanced soil model for liquefaction remains unverified.
Therefore, a modified pile–soil interface model was developed to consider the interaction between piles and a liquefiable finite slope. The model linearly decreases the friction angle of the interface normal spring according to the excess pore pressure ratio of the corresponding ground element. The proposed model was validated by comparing it with centrifuge model test results conducted by Yoo et al. [
33] on piles installed in liquefied slopes. To accurately simulate the centrifuge tests, a rigorous numerical model was applied, including soil modeling, structural modeling of the deck and piles, and modeling of liquefied ground. Based on the constructed analysis model, parametric studies were performed by varying the slope inclinations and the amplitude of input motions.
2. Numerical Simulation
2.1. Centrifuge Tests on Piles in a Liquefied Slope
The applicability of numerical modeling was verified by comparing the results with the centrifuge tests conducted by Yoo et al. [
33], which involved a series of centrifuge model tests that simulated a pile-supported wharf in a finite slope susceptible to liquefaction.
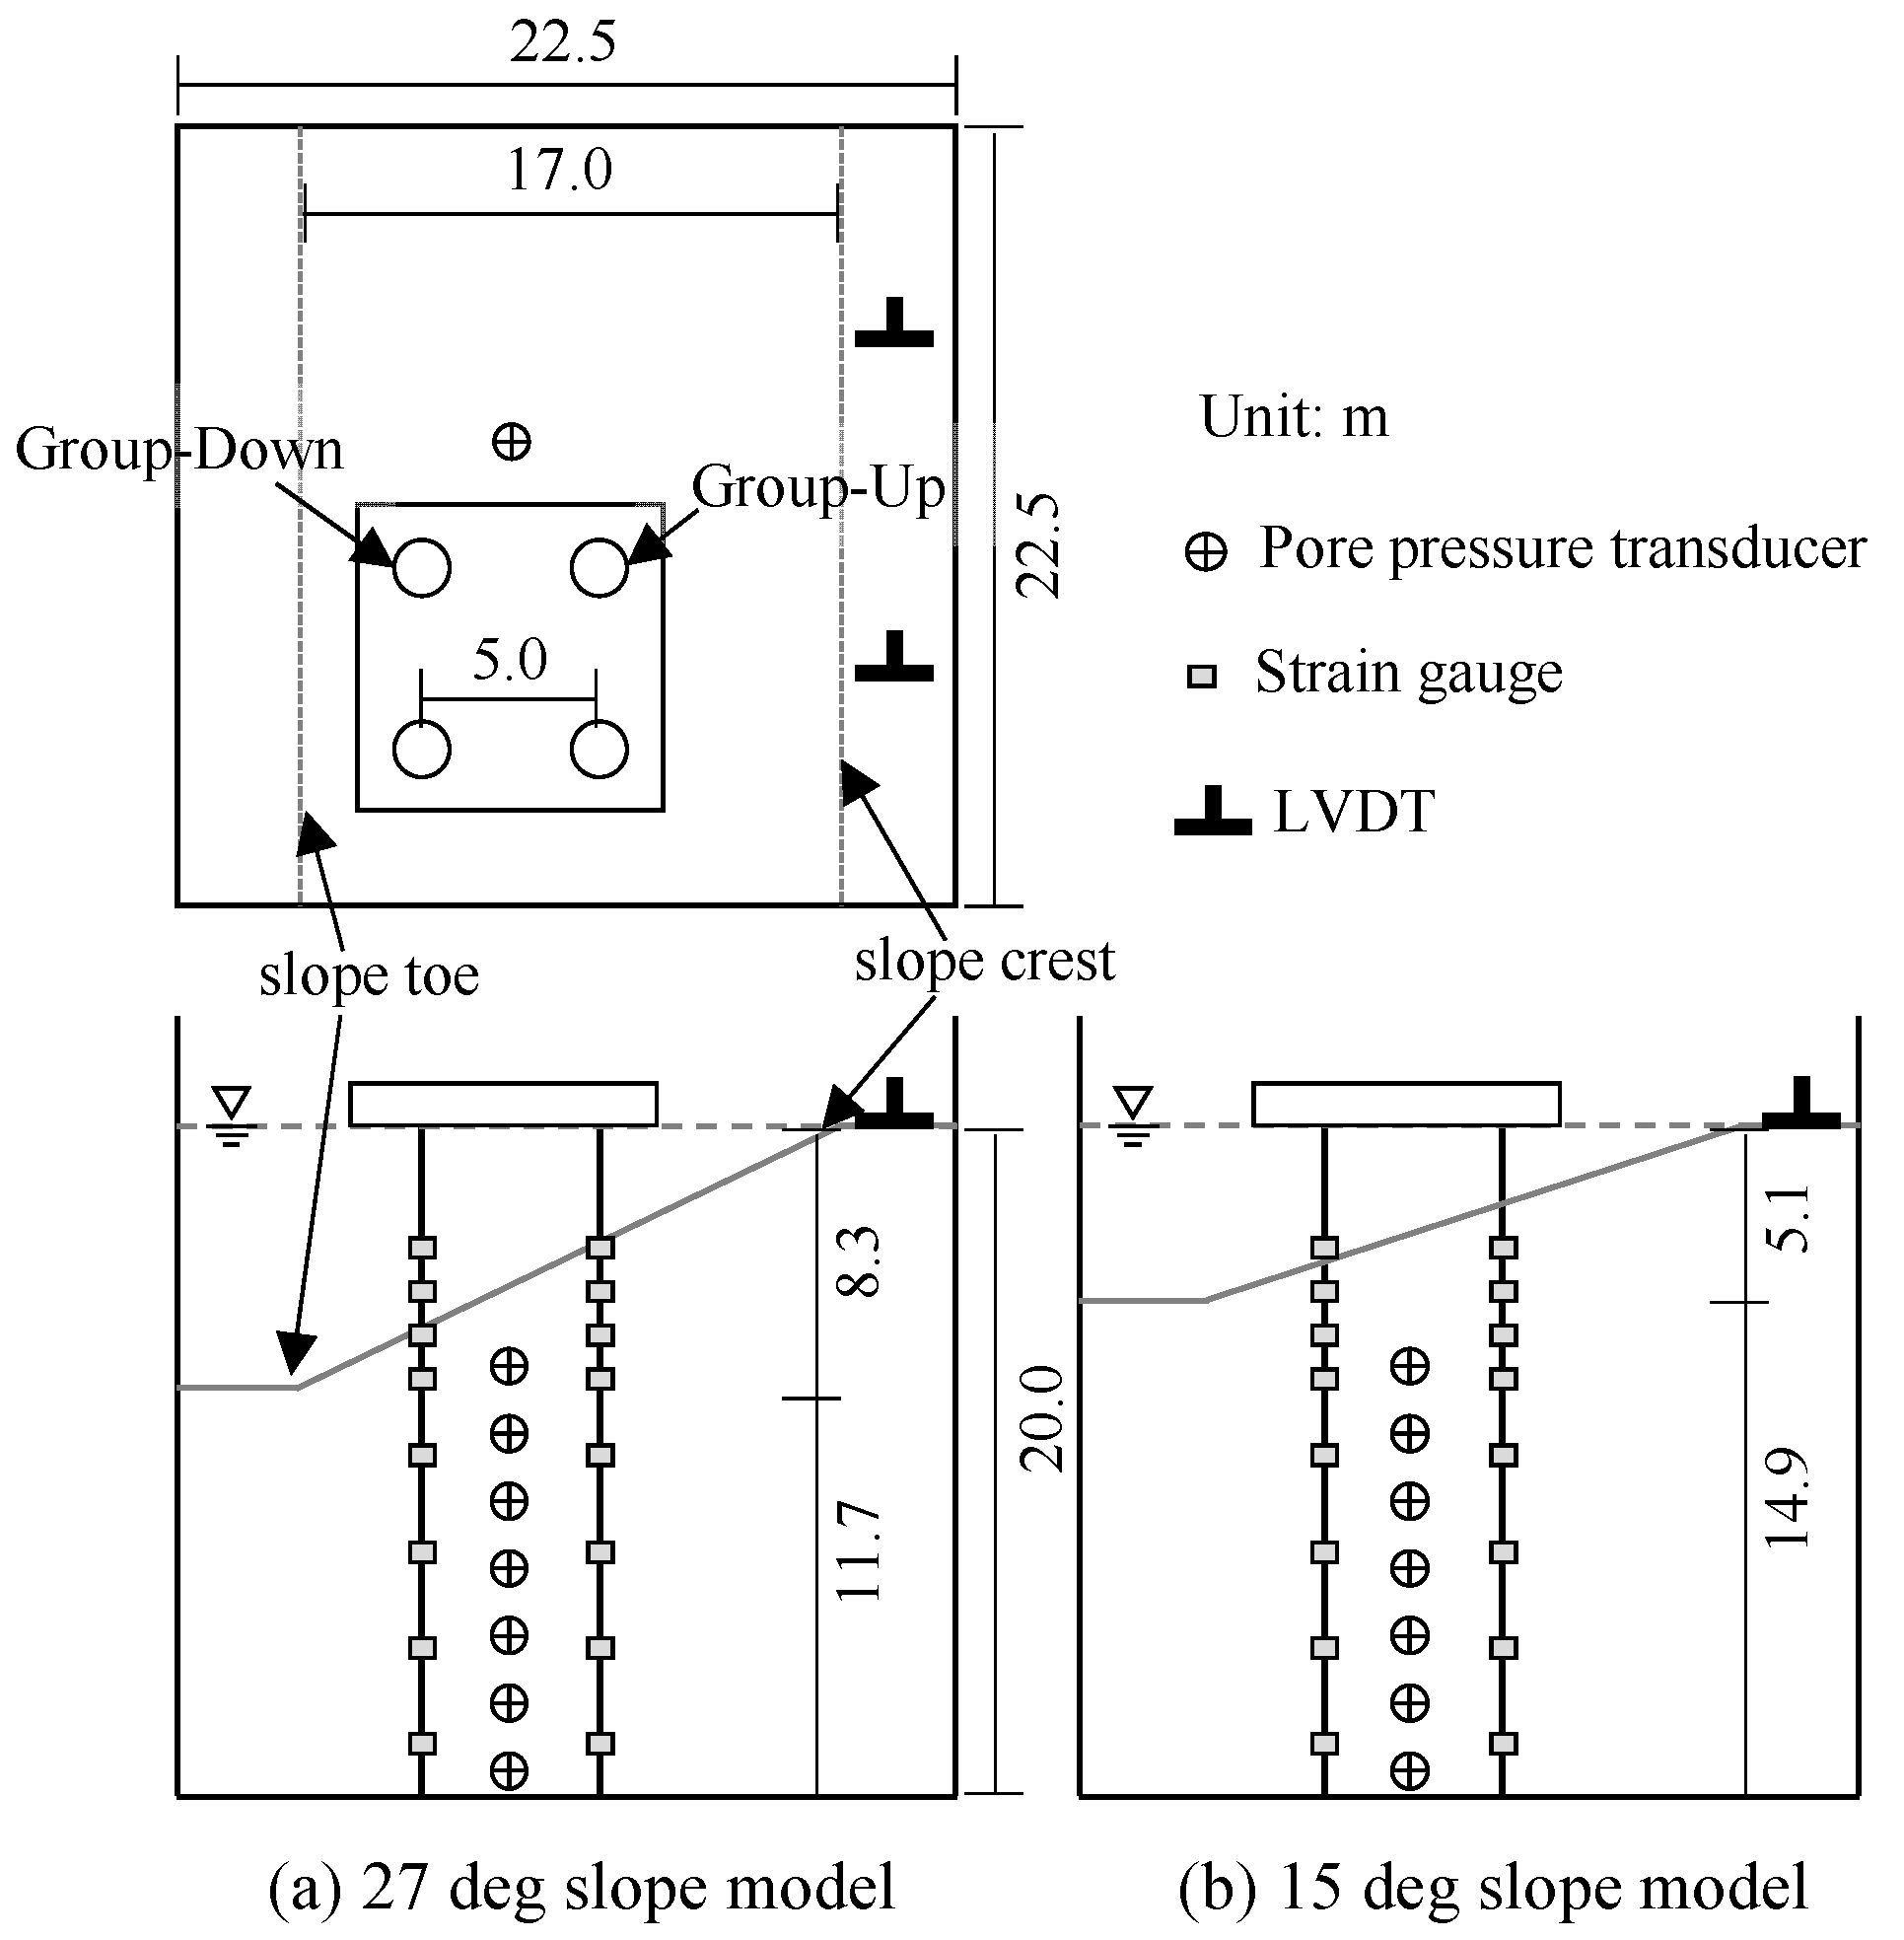
Figure 1 shows the layout of the centrifuge test models. The prototype structure was a pile-supported wharf in Pohang New Port, Republic of Korea. The model deck, which was simulated by a mass block, was supported by 2 × 2 group piles with a spacing of 5 m. The model ground and structures were constructed within a soil container covered with cork to minimize the boundary effect. The model ground was a finite slope of 17 m in length with varying heights according to the slope inclinations. A clearance space of 2.5 m was provided behind the toe and crest at both ends of the slope.
The model ground was prepared using poorly graded silica sand, and the properties of the sand are summarized in
Table 1 [
34]. The relative density and saturated unit weight of the model ground were 26% and 17.2 kN/m
3, respectively. The ground was saturated using a viscous fluid, and the viscosity of the pore fluid was increased using hydroxypropyl methylcellulose (HPMC) solution while considering the scaling law for consolidation [
35].
The model deck and piles were constructed with aluminum, applying the similitude law for centrifuge experiments following Madabhushi [
36]. The dimensions and engineering properties of the model piles and deck are summarized in
Table 2. Detailed information on the experiment is given in Yoo et al. [
33].
Three test cases involved different combinations of slope inclinations and the amplitude of the input motions. Case 1 had a slope inclination of 27 degrees and an amplitude of 0.2 g, case 2 had 27 degrees and 0.1 g, and case 3 had 15 degrees and 0.2 g. The input motions were 1.5 Hz ramped and constant amplitude with maximum amplitudes of 0.2 g and 0.1 g, respectively, as shown in
Figure 2.
2.2. Numerical Modeling and Input Parameters
A numerical simulation of the model structure and ground under seismic loading was performed using Fast Lagrangian Analysis of Continua in 2 Dimensions (FLAC2D). This software has the advantage of dealing with the analysis of dynamic and large deformation problems because it uses explicit, finite difference, and Lagrangian analysis methods to solve the differential equations of a continuum.
Figure 3 shows the geometry of the numerical model and the mesh on the centrifuge model. The soil container was modeled as an elastic material with high stiffness, and an interface using beam elements was inserted between the container and soil to simulate the separation due to liquefaction. The beam interface had different interaction springs at two sides, with the spring between the beam and the container set as an elastic spring with a sufficient modulus to prevent the soil from penetrating the container. On the other hand, the spring between the beam and the soil was given a friction angle to allow for separation between the soil and the container [
37]. The input properties of the interface beam and spring between the container and soil are summarized in
Table 3 and
Table 4.
The boundary conditions of the model consisted of the ground surface, the horizontal boundary of the container, and the bottom boundary of the container. Normal stress was applied to the ground surface to simulate the hydrostatic pressure caused by the reservoir. In order to prevent the reflection of seismic waves, the horizontal and bottom boundaries of the container were set as a free field boundary and a quiet boundary, respectively.
To prevent mesh distortion near the ground surface, which had a weak strength due to the low confining stress, 1 kPa of cohesion was applied. The initial pore pressure level and the saturation status of the ground surface were fixed so that the dissipation of the excess pore pressure was not disturbed. Additionally, Rayleigh damping was set on the foundation and soil to control high-frequency noise.
The PM4Sand model was adopted as the liquefiable soil model. This model is a plasticity soil model that determines soil behavior based on the stress ratio and is developed specifically for simulating the liquefaction behavior of sand soil in dynamic analysis conditions [
38].
The primary input parameters of the PM4Sand model are the relative density, shear modulus coefficient, and contraction rate parameters. The relative density was directly applied with the value obtained from experiments (26%). The shear modulus coefficient was determined based on Equations (1)–(4) from Tran et al. [
39] for silica sand. The secondary input parameters of permeability, maximum and minimum void ratio, and critical friction angle were determined based on the laboratory tests of Kim et al. [
34] for silica sand. The values of input parameters for PM4Sand are summarized in
Table 5.
where
: shear modulus coefficient,
: density of the soil,
: shear wave velocity of the soil,
: confining pressure,
: reference pressure (1 atm), and
: relative density.
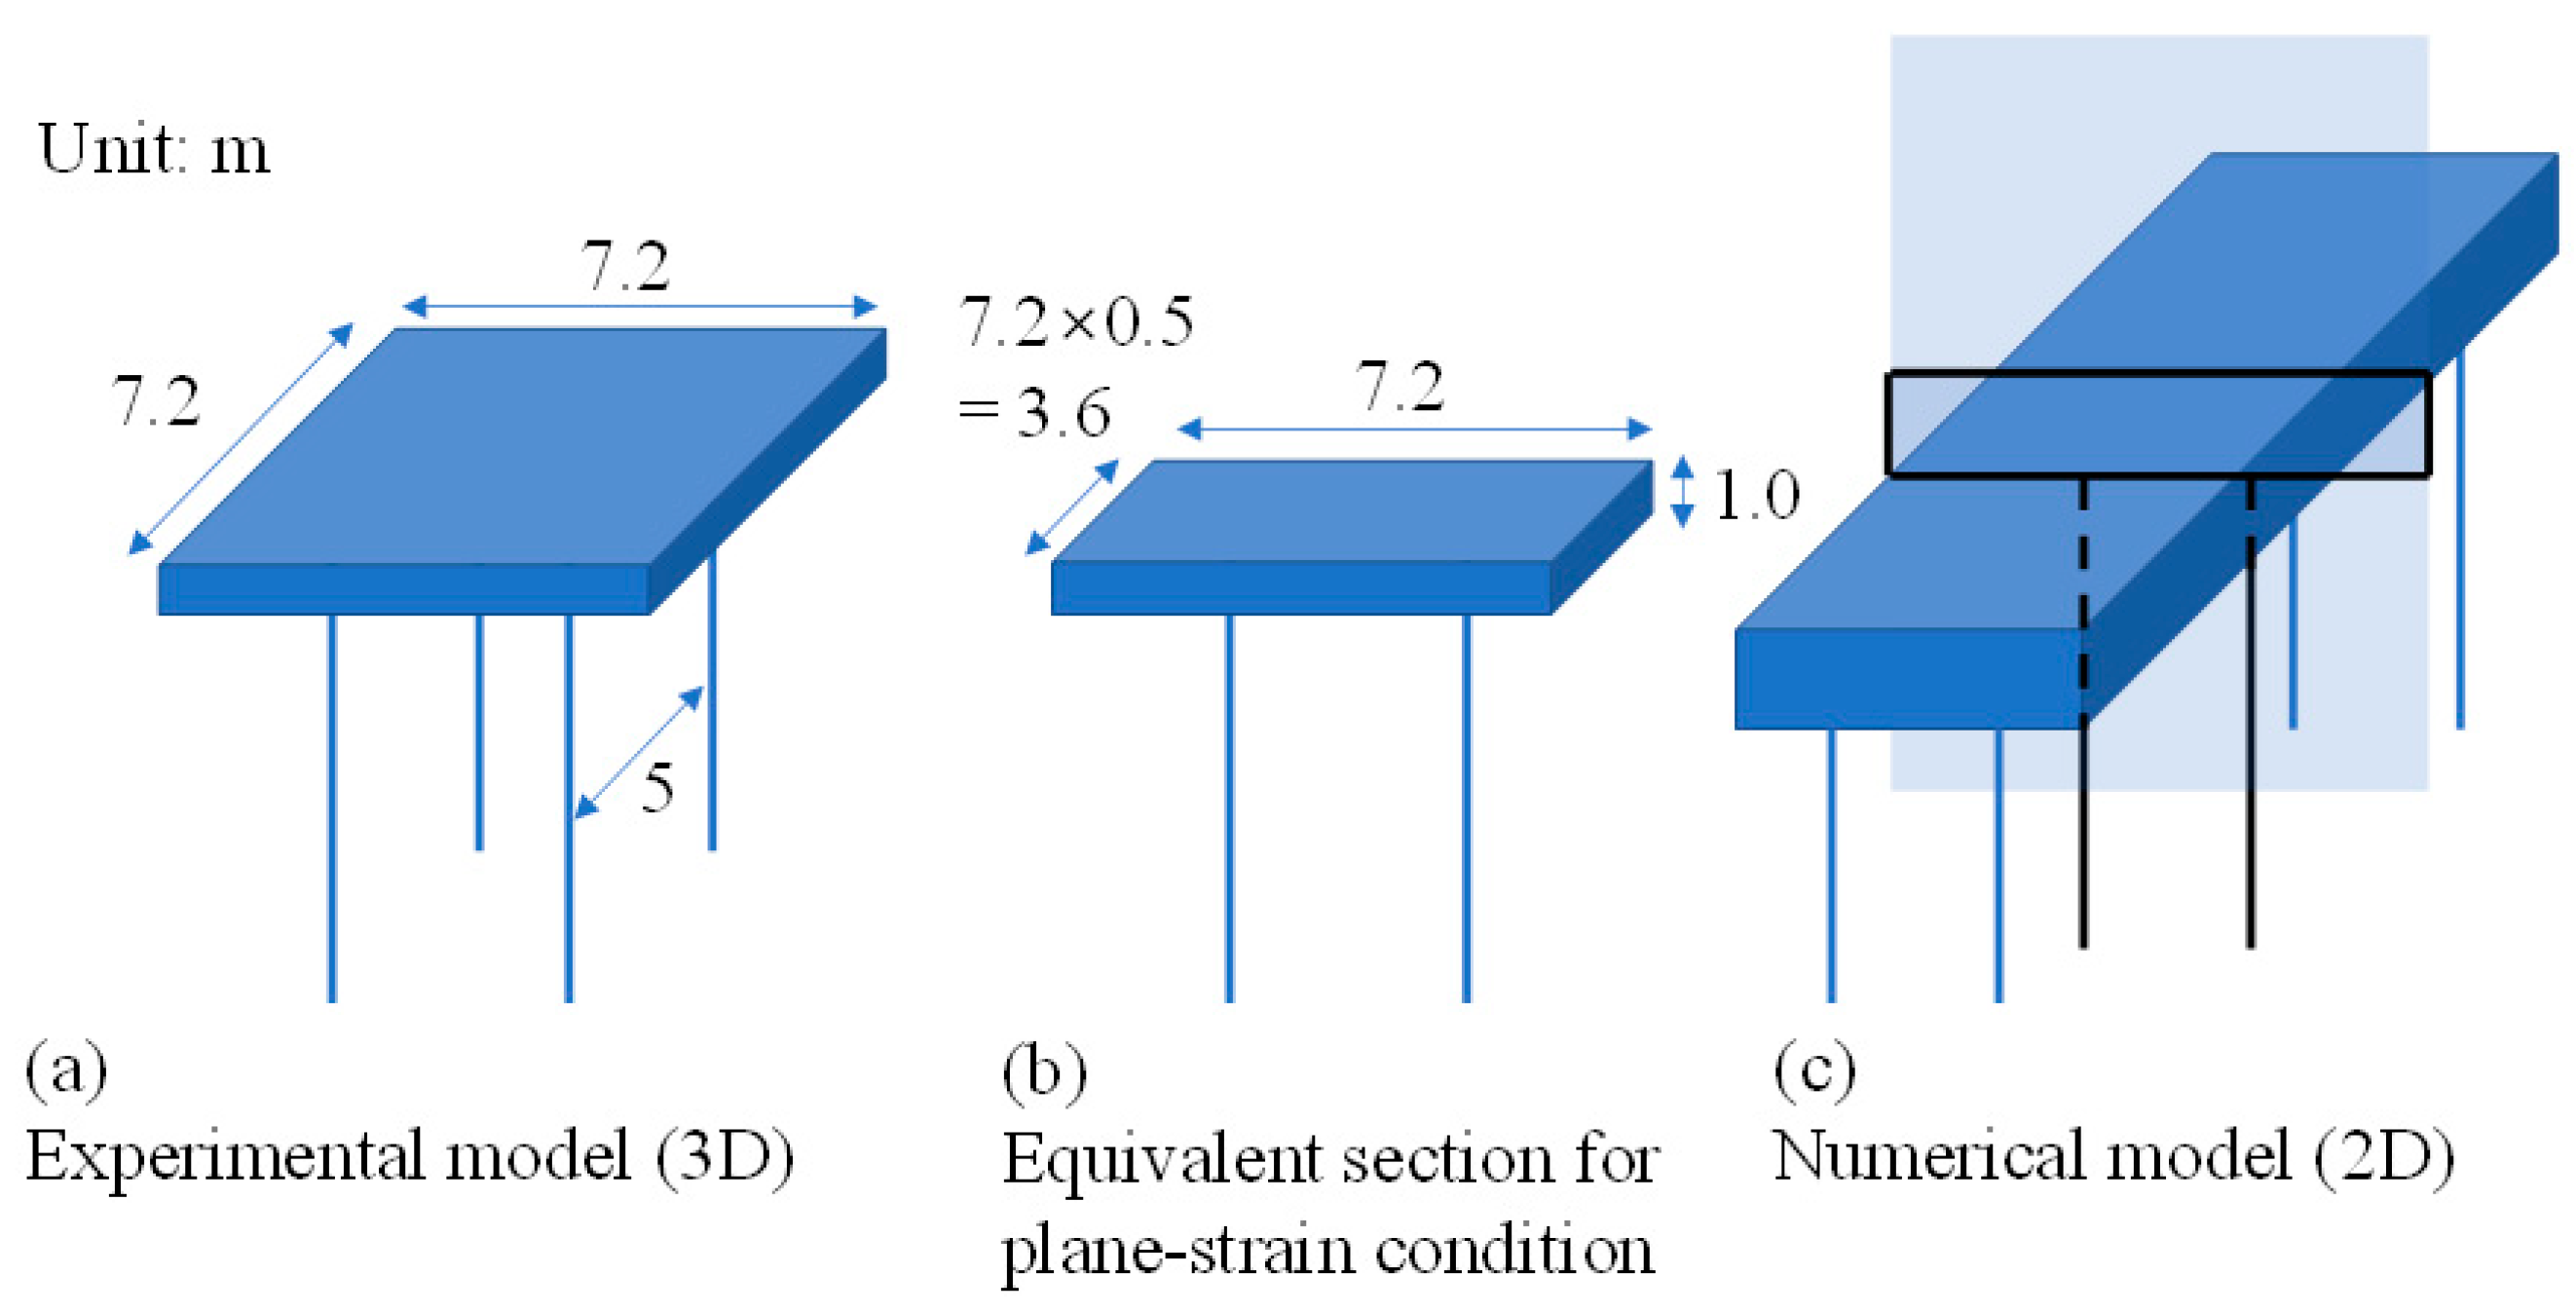
The deck was modeled using elastic materials with high stiffness, as it had a significantly higher strength compared with the piles. The spacing of the piles and the density of the deck were adjusted to consider the effects that arise from converting a 3D experimental model to a 2D numerical model.
Figure 4 illustrates the effects of transforming from a 3D experimental model to a 2D numerical model. The experimental model was created by cutting a portion of a long wharf supported by many rows of piles. To convert the experimental model back to plane-strain conditions, which was the numerical model, the deck mass supported by a row of piles was selected as an equivalent section. Half the length of the deck was determined as the spacing for piles in the numerical model. Considering the unit length of the numerical model, the density of the deck was increased by 3.6 times. The input properties of the elastic deck element and the pile beam element are summarized in
Table 6 and
Table 7.
The deck was rigidly connected to the pile head following the experimental condition. The vertical movement of the pile toe was not allowed in the same manner.
2.3. Soil–Pile Interface Model Development
The group pile was modeled using beam elements with interface springs to simulate its flexural behavior and interaction with the soil. The interface springs represented the relationship between a pile node and a soil grid containing the node. The interface at each pile node was simulated by two different springs: the shear spring in the pile axial direction and the normal spring in the direction perpendicular to the pile axis. Note that the normal spring differs from the commonly used p-y curve in two fundamental aspects. First, the purpose of the interface normal spring is to simulate the force exerted on the pile as a result of the displacement of liquefied soil, directly representing the effective force without incorporating an elastic behavior due to its high stiffness. Second, the interface normal spring accounts for the behavior between a single soil element and a corresponding pile node, necessitating separate modeling of the free field.
The relationship between the force and displacement of the interface springs followed an elastic–perfectly plastic manner. The parameters used to characterize the behavior of the interface spring were stiffness and strength. The interface stiffness should not be too large or small because it can cause ineffective force transference or penetration at the interface, respectively [
39,
40]. In this study, several preliminary analyses were conducted and it was found that the spring stiffness of 1.0 GN/m was reasonable to support the effective force transference at the interface. Since sandy soil was considered in this study, the strength parameter of the interface spring was defined as the interface friction angle in relation to the confining soil stress at the pile node. A value of two-thirds of the soil friction angle was applied to the friction angle of the shear spring [
41].
To model the interaction between the liquefied soil and the pile, it was necessary to simulate the push and pull between the two, which depended on the interfacial normal spring. The friction angle of the normal spring for piles embedded in a drained condition was proposed to be no less than 80 degrees, or not allowing separation, regardless of the soil type [
42,
43]. Itasca [
32] suggested a static simulation of pushing a section of a pile under single-stress conditions to determine the friction angle of the normal spring. However, the compatibility of the pile-pushing analysis with the advanced soil model for liquefaction remains unverified. Consequently, this study evaluated the compatibility of the PM4S and model for the static pile-pushing analysis. By conducting the pile-pushing analysis, the friction angle of the normal spring was determined to be 60 degrees and 7.8 degrees for the soil modeled using the Mohr–Coulomb model and PM4Sand model, respectively.
To the authors’ awareness, no proposal has been made yet for the strength parameter of the normal spring used to simulate the interaction between the liquefied soil flow and pile. Therefore, the suggestion of Tran et al. [
44] considering the effect of confining stress through the friction angle of the normal spring was applied in this study. Tran et al. [
44] proposed that the friction angle of the interface normal spring decreases as the embedment depth decreases in dry sand. The friction angle of the interface normal spring can decrease due to the liquefaction of the ground. In this study, a linear decrease in the tangential friction angle to 5% of the initial value was applied, with an increase in the excess pore pressure ratio. The residual value of 5% is generally adopted for the residual strength of liquefied ground [
22,
45].
Figure 5 illustrates the mechanism of the interface normal spring operating between the pile node and the soil grid containing the node. Here,
ru refers to the excess pore pressure ratio,
φ’sp to the friction angle of the normal spring, and
σ’c to the effective confining stress. The normal spring with a sufficiently large coefficient generates a maximum normal force when subjected to the relative displacement between the pile and the soil. However, the normal spring proposed for dry soil does not consider the change in the friction angle due to changes in the excess pore pressure ratios. As a result, the increase in excess pore pressure ratio in the soil grid including the pile node decreases the normal force through a decrease in the effective confining stress (blue path in
Figure 5). On the other hand, the proposed method considers the decrease in tangential friction angle due to the increase in the excess pore pressure ratios, leading to a faster decrease in the maximum normal force (red path in
Figure 5).
While no gap developed between the pile and sandy soil element during cycling [
46,
47], the separation between the soil and pile elements should be considered due to the slope failure and soil settlement induced by the liquefaction and dissipation process. The soil–pile separation was simulated by switching on the large strain mode in FLAC2D, which can help to avoid the transfer of large forces at the pile node resulting from severe soil displacement. All parameters of the interface springs were accessed and adjusted using subroutines written in the FISH programming language, which is available in FLAC2D.
3. Validation of Numerical Modeling
The applicability of the numerical model proposed in
Section 2 was verified by comparing the results with the centrifuge model experiments.
Figure 6 and
Figure 7 show the excess pore pressure in the ground and the settlement of the crest, respectively.
The numerical analyses conducted in this study demonstrated an overall agreement with the experimental results. However, the estimated excess pore pressure in the deep soil was found to underestimate the experimental results.
The limited excess pore pressure observed in the deep soil was attributed to the numerical modeling of the soil container. A cork was attached to the rigid soil container to minimize the boundary effect and allow for free deformation of the soil adjacent to the boundary in the experiment conducted by Yoo et al. [
33]. However, in the numerical simulation, the cork was not individually simulated; only the rigid soil container was considered. Consequently, limited deformation constrained the increase in excess pore pressure of deep soil in the numerical simulation.
The simulation results using the flexible soil container successfully captured the increase in excess pore pressure in the deep layer. However, due to the complete exclusion of the restraining effect of the rigid container, it was challenging to simulate the excess pore pressure response throughout the entire ground. Therefore, in this study, the soil container was simulated under rigid conditions to align with the experimental setup.
The simulation results of the crest settlement closely replicated the experimental results with an acceptable margin of error. The final settlements were 1.19 m and 1.25 m in the simulation and experiment, respectively, achieving an accuracy of approximately 95%. Furthermore, the model successfully captured the time-dependent behavior, accurately predicting an increase in settlement rate after approximately 10 s, coinciding with the sufficient increase in excess pore pressure in the soil. The average settlement velocities of the crest were 0.085 m/s and 0.088 m/s in the simulation and experiment, respectively, resulting in an error of 3%.
Modeling the interface between the liquefied soil and piles is crucial because existing interface models have limitations in simulating the soil–pile dynamic behavior within liquefied soil.
Figure 8 compares the pile-bending moments of applying constant interface friction angles of 60 degrees and 7.8 degrees, and applying the proposed model, which linearly decreased the interface friction angle from the initial value of 60 degrees according to the increase in excess pore pressure ratio.
The constant 60 degrees model overestimated the bending moments from approximately 15 s, which was when the excess pore pressure ratio of the deep layer started to increase. The constant value of the interface friction angle led to an overestimation of the lateral soil load caused by the liquefaction-induced slope failure. In addition, the analysis results revealed that using the pile-pushing analysis to determine the initial friction angle of the normal spring was incompatible with the PM4Sand model. The constant 7.8 degrees model predicted that the bending moment would decrease after approximately 20 s when the deep soil became fully liquefied.
On the other hand, the proposed interface model accurately predicted the time history of the pile-bending moments in comparison with the experimental results. In particular, the proposed model predicted that the bending moment would be maintained with the quick recovery of the normal force, reflecting the effect of the development and the dissipation of the excess pore pressure.
Furthermore, the proposed model accurately predicted the distribution of the bending moments at the pile head and pile toe, as well as the bending moments at the group-down (near the slope toe) and group-up (near the slope crest), for all experimental cases, as shown in
Figure 9,
Figure 10 and
Figure 11.
The comparison verified that the numerical modeling and proposed interface model adopted in this study could accurately predict the dynamic behavior of the piles installed in liquefied slopes.
4. Parametric Study
A parametric study was conducted to analyze the effects of changes in the slope inclination and input motion amplitude on the displacement of the slope and the dynamic behavior of piles in liquefaction-susceptible slopes. The study utilized a validated numerical analysis model that was applied consistently. The slope inclination was varied using 12.5, 15.9, 18.4, 21.8, 29.1, and 33.7 degrees, while the input amplitude was varied using 0.05 g, 0.1 g, 0.15 g, 0.2 g, and 0.25 g.
4.1. Effect of the Slope Inclination
Figure 12 illustrates the depth profile of the residual lateral displacement of soil at three different locations, namely, the (a) slope toe, (b) slope center, and (c) slope crest. The profile at the slope toe exhibited a sharp increase and reached its maximum at the ground surface. On the other hand, the profiles at the slope center and crest showed maximum values at a depth of approximately 5D with a bulging shape, which was attributed to the failure of liquefied slope. D denotes the diameter of the pile. Regardless of the location, an increase in slope inclination led to an increase in lateral displacement of the soil. Moreover, the increase in slope inclination resulted in a greater increase in lateral displacement of soil closer to the ground surface than at deeper depths.
The normalized depth of the ground without residual displacement did not consistently increase with the slope angle but instead became shallower after the angle of 21.8 degrees. This observation was attributed to the residual lateral displacement of the ground resulting from the liquefaction-induced slope failure. The failure surface of the liquefied slope progressively extended into deeper ground as the slope inclination increased from 12.5 to 21.8 degrees. However, beyond 21.8 degrees, a notable change occurred as the center of rotation of the failure surface started to shift toward the slope crest. This phenomenon can be attributed to the heightened instability of the slope at steeper angles.
Figure 13 and
Figure 14 illustrate the profiles of the residual bending moment of two different groups of piles, namely, group-up (located near the slope crest) and group-down (located near the slope toe), and the residual bending moment at the pile head and toe for various slope inclinations, respectively.
When the slope inclination was less than 20 degrees, the moment at the pile head and toe were nearly symmetric, and there was no significant difference between those of group-up and group-down. However, when the slope inclination exceeded 20 degrees, the residual moment at the pile toe was considerably greater than that at the pile head. Li et al. [
48] reported that in a centrifuge test for 5 × 5 group piles in a 27-degree liquefied slope, the maximum bending moment at the pile toe was greater for piles located near the slope toe than for piles located near the slope crest.
The neutral point, where the bending moment becomes zero, was observed at a distance of 12 m from the pile head, irrespective of the slope inclination and pile location. As the slope inclination increased, both above and below the neutral point, the moment showed a tendency to increase. This phenomenon occurred because the boundary condition at the head of the pile allowed for horizontal movement but restricted rotation. Under this fixed end beam with a sinking support condition, the bending moments at the head and toe were theoretically equal in magnitude and opposite in direction [
49]. In addition, Abdoun and Dobry [
50] reported that opposite bending moments occurred at the top and bottom boundaries of the liquefied layer in a series of centrifuge tests with a pile in sloping ground.
4.2. Effect of the Input Amplitude
The excess pore pressure in the ground is induced by cyclic shear load from seismic motion. Therefore, the study analyzed the effect of input motion amplitude by varying it from 0.05 g to 0.25 g. The input motions were created by adjusting the motion used in the experiment.
Figure 15 displays the excess pore pressure profile after the end of shaking based on the input amplitude. Increasing the input amplitude from 0.05 g to 0.15 g significantly raised the excess pore pressure in the ground. The 0.15 g input amplitude resulted in complete liquefaction at the center of the slope, but it did not lead to full liquefaction at the crest of the slope. No further changes in the failure behavior of the liquefied slope were observed by the 0.25 g input amplitude since both the slope center and crest had already experienced complete liquefaction due to the 0.2 g input amplitude.
Figure 16 demonstrates the lateral displacement profile of the ground after the end of shaking according to the input amplitude. The profile caused by motions with an amplitude of less than 0.15 g showed a linear shape regardless of the slope location. However, input motions with an amplitude greater than 0.2 g made the profile shape change depending on the slope location. These motions caused the sliding of the soil block from the ground surface to a depth of 10D in the center of the slope.
The lateral displacement of the ground due to input motion induced a residual bending moment in the piles.
Figure 17 shows the residual bending moment profile of the group piles according to the input amplitude. Input motions weaker than 0.1 g failed to cause liquefaction of the ground at deep depths, resulting in the maximum bending moment occurring not at the pile toe but within the ground.
The residual bending moment of the pile varied significantly depending on the excess pore pressure at the slope crest. The 0.2 g amplitude, which could induce additional excess pore pressure increase at the slope crest compared with the 0.15 g amplitude resulted in a greater failure of the liquefied slope. This suggests that the input amplitude affected the failure of the liquefied slope, as well as the soil liquefaction. Furthermore, the maximum residual bending moments at the pile toe caused by the input amplitudes of 0.2 g and 0.25 g were 2.2 MN∙m and 2.3 MN∙m, respectively. It is worth noting that the increase in the moment (5%) was relatively small compared with the magnitude of the increase in the input amplitude (25%). This implies that input amplitude beyond a certain level did not induce a further increase in the bending moment of the piles.


