Article

Evaluation of Table Grape Flavor Based on Deep Neural Networks

1
School of Computer Science and Technology, Zhejiang Sci-Tech University, Hangzhou 310018, China
2
Institute of Agricultural Safety and Nutrition, Zhejiang Academy of Agricultural Sciences, Hangzhou 310022, China
3
Department of Data Science, New Jersey Institute of Technology, Newark, NJ 07102, USA
*
Authors to whom correspondence should be addressed.
Appl. Sci. 2023, 13(11), 6532; https://doi.org/10.3390/app13116532
Submission received: 24 March 2023 / Revised: 3 May 2023 / Accepted: 22 May 2023 / Published: 27 May 2023
(This article belongs to the Special Issue Application of Artificial Intelligence in Engineering)

Abstract

:
For fresh table grapes, flavor is one of the most important components of their overall quality. The flavor of table grapes includes both their taste and aroma, involving multiple physical and chemical properties, such as soluble solids. In this paper, we investigate six factors, divide flavor ratings into a range of five grades based on the results of trained food tasters, and propose a deep-neural-network-based flavor evaluation model that integrates an attention mechanism. After training, the proposed model achieved a prediction accuracy of 94.8% with an average difference of 2.657 points between the predicted score and the actual score. This work provides a promising solution to the evaluation of table grapes and has the potential to improve product quality for future breeding in agricultural engineering.

1. Introduction

With the rapid development of agriculture and the continuous improvement of people’s living standards, an increasing amount of attention has been paid to the quality of fresh produce such as table grapes, which are always in high demand. In particular, industries that involve grape processing, such as wine manufacturing, have critical requirements for the quality of grapes as raw materials [1]. In addition, in agricultural engineering, it has been a fundamental task to identify and select high-quality grapes to obtain preferred seeds for breeding [2].
In such manufacturing or engineering applications, either for grape processing or for breeding, one important problem is the accurate evaluation of the quality of grapes. For fresh table grapes, flavor is one of the most important components of their overall quality and the most direct factor affecting consumers’ choices [3]. Therefore, significant efforts have been made to accurately evaluate the flavor of table grapes. In existing evaluation methods, the analysis is mainly based on the relationship between the physical and chemical properties of grapes, which is determined by using statistical methods such as principal component analysis and hierarchical analysis [4,5,6]. They usually classify flavor-influencing indicators as positively or negatively correlated with flavor quality and use normalized results to determine the contribution of each indicator to flavor quality, which is then multiplied with each indicator of flavor as the flavor score. Most of these evaluation methods suffer from the following two limitations. Firstly, the flavor indicators of fresh table grapes are treated as summarized features. For example, the titratable acid content, which represents the total amount of sour substances, such as tartaric acid and malic acid, is only used as a physical and chemical indicator. However, due to differences in the contents of various sour substances, such treatment would lead to inaccurate results. Secondly, flavor indicators always have an intricate, interactive relationship, and each indicator cannot be analyzed solely from its content.
To address the above limitations, we propose a deep-neural-network-based model to evaluate the flavor of table grapes and predict a flavor quality score based on various flavor indicators of fresh grapes. Our work makes the following technical contributions:
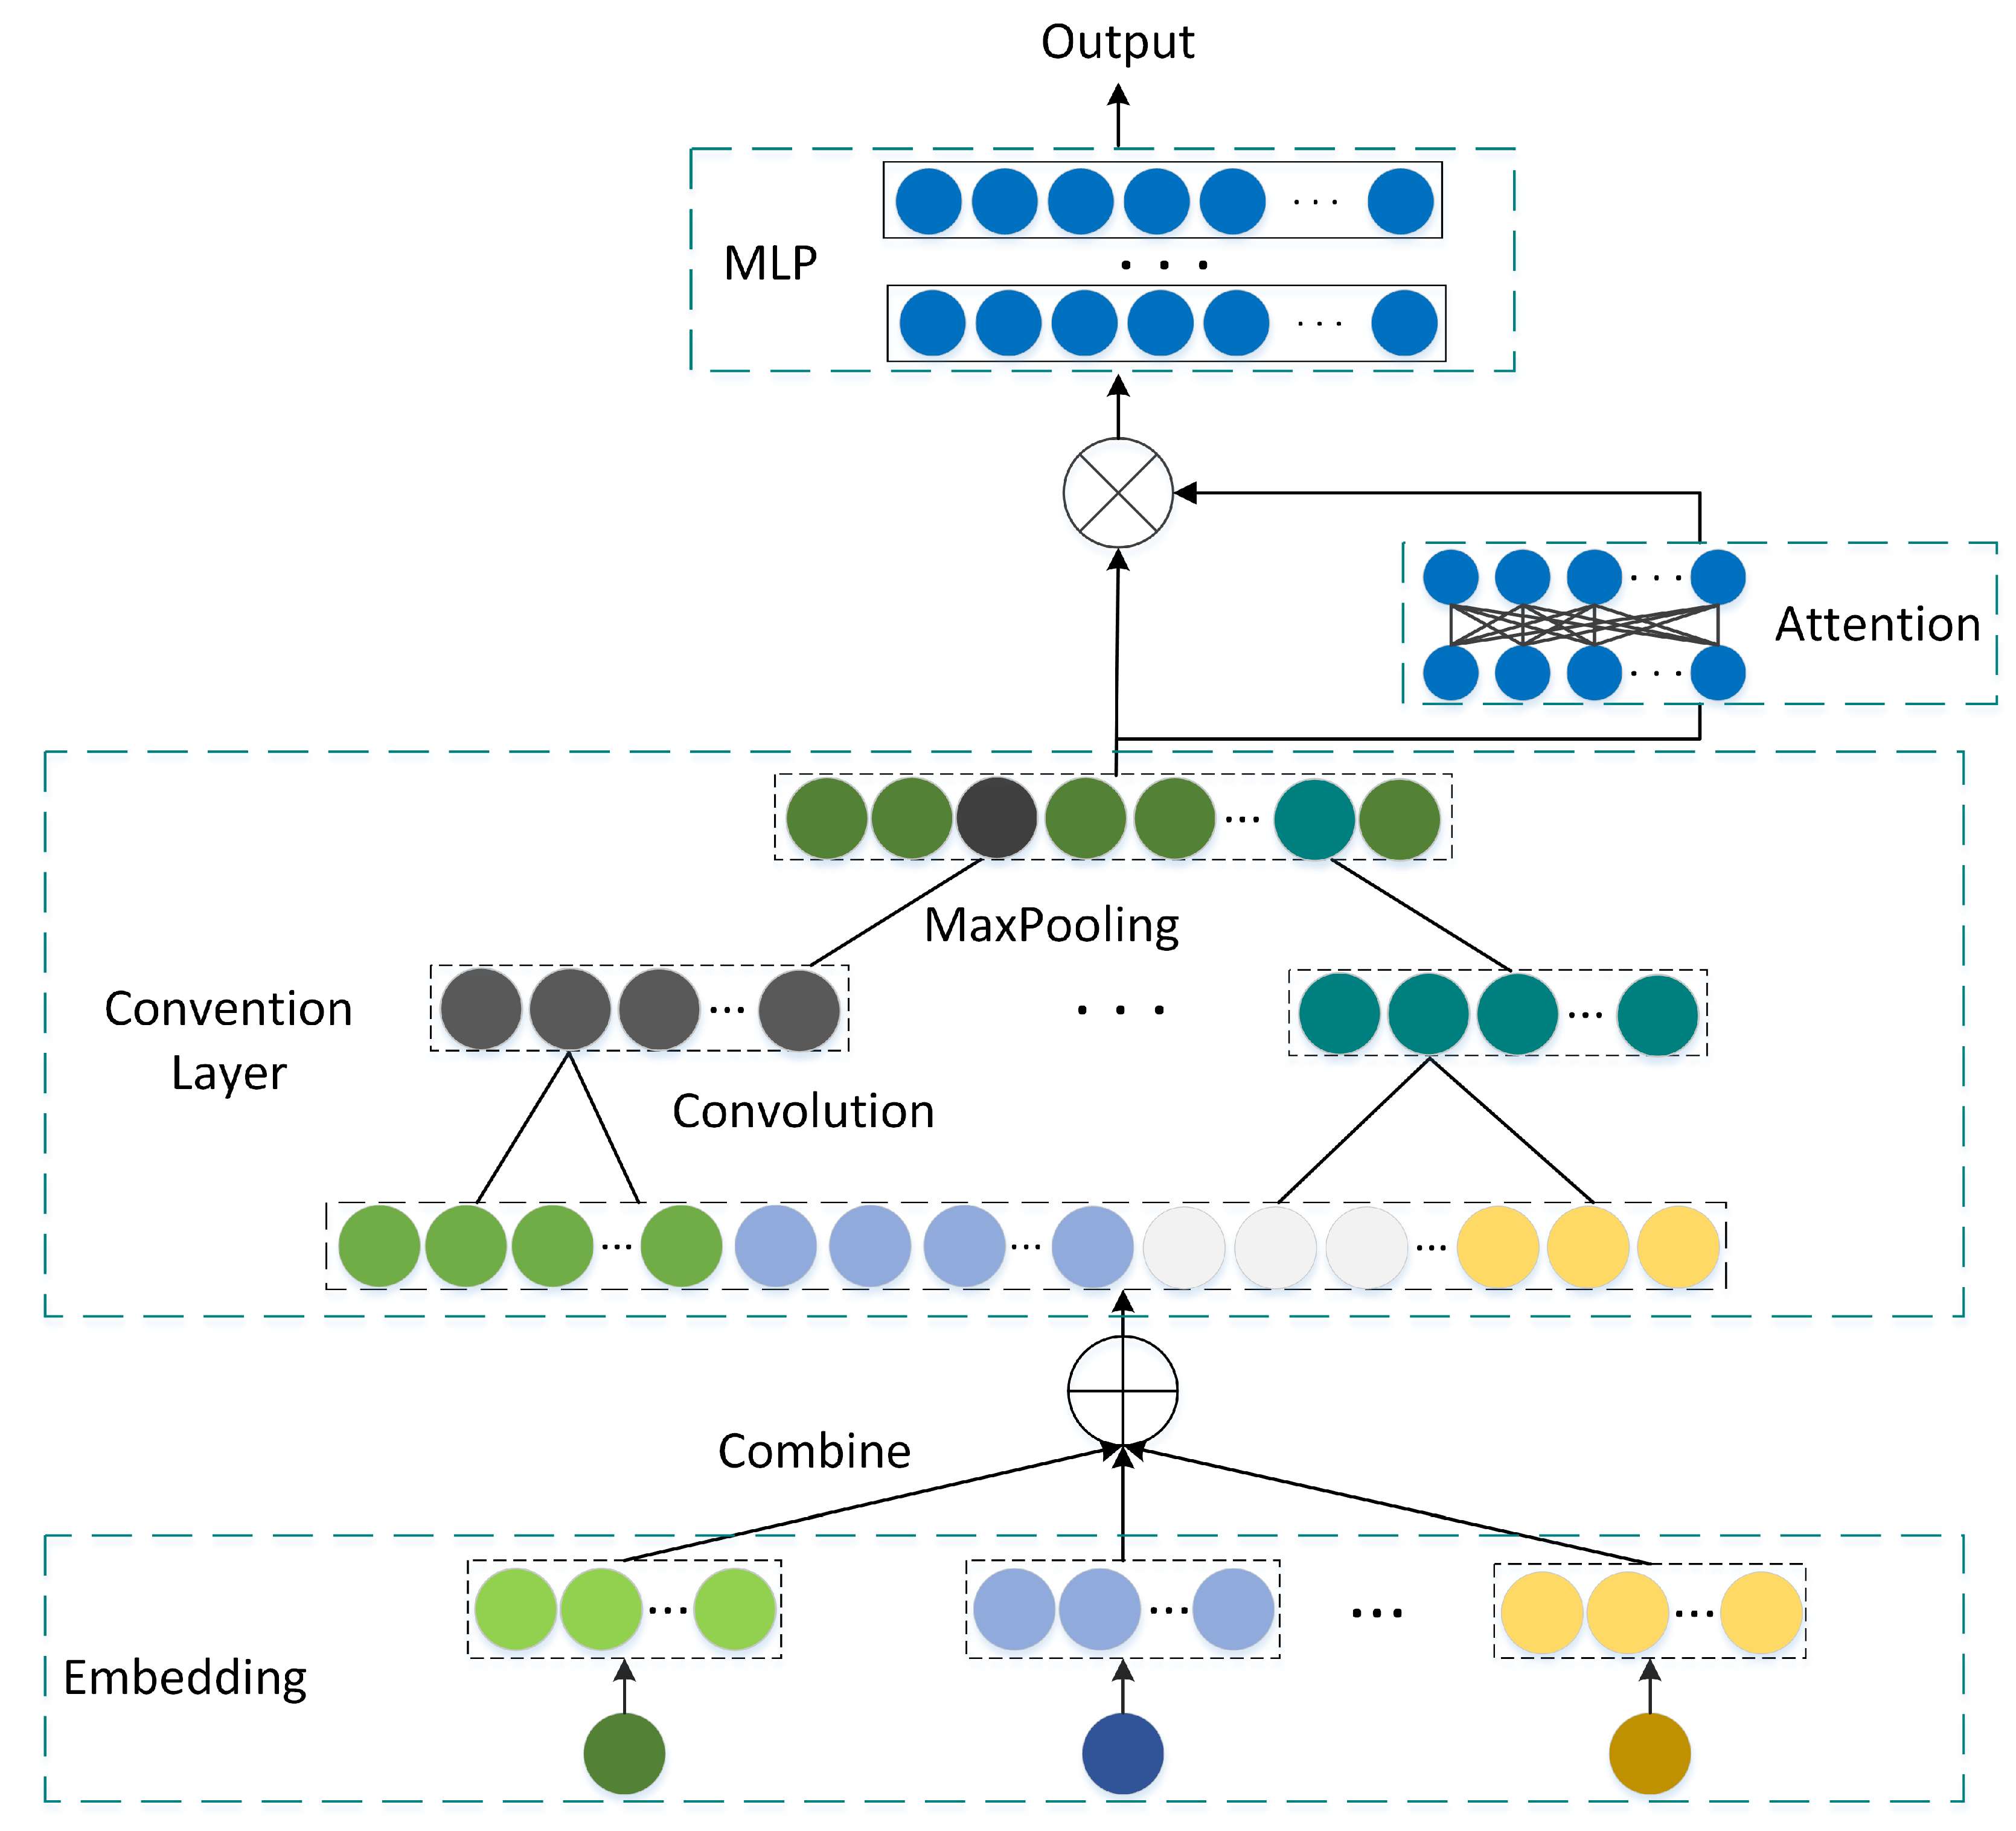
  • An embedding layer is added after the input layer to achieve a more comprehensive representation of the input indicators in the form of feature vectors.
  • Convolution kernels of different sizes are used in the convolutional layer to extract interaction features between adjacent features.
  • An attention module is embedded to enhance important features and weaken unimportant features.
  • The experimental results show that the proposed flavor evaluation model achieves high accuracy in evaluating the flavor of table grapes.
The resulted evaluation model can be used to regulate the consumer market of grapes and may also provide a quantitative solution to grape selection and breeding in the field of agricultural engineering. It is also worth noting that the proposed model is built on a general machine learning architecture, which can be applied and extended to the evaluation of other fruits and products.

2. Related Work

2.1. Statistical Methods for Grape Quality Evaluation

Due to the complexity of the physicochemical indicators affecting grape quality, many of them have high correlations with each other. Therefore, in the study of wine grapes and table grapes, researchers often transform these indicators into composite indicators to reduce dimensions. A few composite indicators that contain more than 85% of the grape information are selected to represent the overall characteristics of grapes, and one needs to determine the weight of each indicator to evaluate the overall quality of grapes.
The existing evaluation methods for fresh grapes mainly use statistical methods, such as principal component analysis and hierarchical analysis, based on the relationship between the physical and chemical properties of grapes. In 2002, Gong et al. [4] combined gray correlation analysis with hierarchical analysis to comprehensively evaluate 14 traits of 12 grape varieties to select the best grape varieties. In 2018, Pan et al. [5] used principal component analysis and hierarchical analysis to classify the factors affecting grape quality into appearance, nutrition, edibility, and sensory categories and to establish a database of key grape varieties. In 2020, Cheng et al. [6] used principal component analysis and stepwise linear regression analysis to evaluate 15 fresh grape varieties to establish a regression model for grape quality evaluation. In 2021, Shen et al. [7] evaluated and analyzed ten species of grapes in the Ningxia region in China by using 14 quality characteristics based on hierarchical correlation and principal component analysis and screened four principal component factors. These methods focus on correlations and differences among grape data, ignoring the influence of consumers’ subjective preferences for grapes, while single physical and chemical indicators, such as soluble solids and total acid in the flavor evaluation, lacked rationality in establishing positive and negative correlations with fruit quality.

2.2. Machine Learning for Wine Quality Evaluation

In the field of wine quality evaluation, the most effective method is manual tasting by wine judges. Still, it is only applicable in some scenarios due to its high cost and subjective nature. The existing wine quality evaluation methods include physical and chemical index analysis, multivariate statistical analysis, and machine learning methods. Among them, machine learning methods have a good performance in fitting multifactorial nonlinear indicators and thus can characterize the complex relationships between physical and chemical indicators and wine quality more accurately and comprehensively.
Many researchers have applied machine learning methods to build wine quality evaluation models. In 2014, Zeng et al. [8] combined principal component analysis with a BP neural network to predict wine quality. In 2015, Luo et al. [9] considered that wine quality is influenced by various factors and used BP neural networks to determine weights based on the normalization of physical and chemical indicators and aromatic substances in wine grapes and wine to establish a more comprehensive wine quality evaluation model. In 2016, Liu et al. [10] used feature data after the dimensionality reduction of wine indicators by PCA as input parameters and sensory tasting scores as output parameters to fit the relationship between wine indicators and quality using RBF neural networks. In 2018, Trivedi et al. [11] used various machine learning methods to predict wine quality based on wine testing data, and their results show that Random Forest improved the accuracy by 8% compared with logistic regression. In 2019, Aich et al. [12] used multiple classification models trained on 12 impact factors for white and red wines based on different feature sets of the UCI database and found that SVM performed the best for both types of wines. Although machine learning is widely used in wine evaluation, limited work has been conducted on its application to the flavor evaluation of fresh grapes.

3. Deep-Neural-Network-Based Grape Flavor Evaluation

In this paper, we propose a deep-neural-network-based flavor evaluation model, which uses neurons at different levels to simulate the complex, intricate relationships among index factors to accurately evaluate the flavor of fresh grapes.
First, the input features, after being preprocessed by the data processing module, are fed into the embedding layer. The features are mapped to vectors to achieve an accurate expression of the features. Then, the convolutional layer module is used to reduce the computational effort of the model by extracting features from the mapped features, and the attention module is used to extract and enhance important features. Finally, they are fed into the multilayer perceptron layer, which is mapped to a higher feature space through a fully connected layer composed of multiple neurons, thus increasing the nonlinear representation of the model. The model structure is shown in Figure 1.

3.1. Batch Normalization Layer

Batch normalization (BN) is a data preprocessing technique proposed by Ioffe [13] in 2015, and it has been widely used in deep learning. Using BN can effectively reduce the number of training rounds and speed up the convergence of the neural network. It can enhance the generalization ability of the model, prevent overfitting, and make the network more stable.
Due to the problem of having different dimensions between indicators in the flavor detection data of table grapes, the differences in the values of each indicator are substantial. If normalization is not performed, there will be an imbalance in gradient descent, resulting in inaccurate model predictions. In order to solve this problem and speed up convergence, this study used the PyTorch framework to batch normalize the table grape flavor data:
x n o r m a l = x E [ x ] V a r [ x ] + e p s · γ + β ,
where x n o r m a l is the normalized data, x is the original input feature data, E [ x ] is the expected value of the input feature data, V a r [ x ] is the calculated sample variance of the input feature data, e p s is a hyperparameter for stability that prevents division by zero and defaults to 1 × 10⁻⁵, and γ and β are learnable parameter vectors that default to 1 and 0, respectively.

3.2. Embedding Layer

For fresh table grapes, the total amount of a certain type of substance is usually used as an indicator in the actual detection. For example, the total amount of acidic substances, such as malic acid and tartaric acid, is recorded as titratable acid. As far as acids are concerned, people’s sensory responses to sour substances such as tartaric acid and malic acid are obviously different, so they cannot generally be classified as a physical and chemical index for evaluation. In this work, the embedding technique was used to map the features into vectors to achieve a more accurate expression of the features.
Embedding techniques are widely used in natural language processing to express words as a vector [14], which is beneficial for neural network training. Similarly, in the processing of table grape features, each feature is represented as a word (feature value), and the corresponding feature vector is generated by using the embedding technique. Each feature value is multiplied by the feature vector to obtain the final feature vector, as shown in Figure 2. The feature vector generated by the embedding layer can represent the grape features more accurately. It can encode the correlation and similarity between different features into the feature vector, thus better utilizing the relationship between features to improve the model’s performance.

3.3. Convolutional Layer

In deep neural networks, fully connected neural networks are usually used to extend hidden layers to achieve the mapping of input features and the fitting of output results. However, this approach has an obvious drawback: as the number of inter-layer neurons increases, the computational effort for model training also increases exponentially, severely affecting the model’s training efficiency. To solve this problem, a convolution module is used in deep learning to perform feature extraction on the input feature vectors between the fully connected layers of the model. The convolution operation extracts features using its feature translation invariance principle, and then the extracted features are fused and used as the input for the next layer [15].
In view of the intricate interaction between the indicators of table grape flavor, we use a convolutional layer [16] to extract the feature vector after the embedding layer mapping.
This module sets up multiple convolution kernels of different lengths, and each convolution kernel performs convolution operations on a different number of adjacent features and generates feature vectors. The convolution kernel can be viewed as a feature extraction filter that, after training, can identify effective feature combinations at different local positions in the vector. For the feature vector after convolution, we use a maximum pooling layer to extract key features. Finally, we concatenate all key features into a vector as the input to the next layer. This vector can maximize the interaction between the flavor indicators.

3.4. Attention Layer

According to previous research [17], each flavor index has a different effect on flavor quality. For example, TSS and TA have a significantly greater impact on flavor than volatile substances. If a reasonable weight distribution is not carried out for each indicator feature, it may lead to a low model training efficiency and unsatisfactory prediction. Therefore, we use an attention mechanism [18] to assign different weights to the features extracted by the convolutional layer so as to make the model more efficient. The attention mechanism can effectively improve the model’s prediction performance, especially when dealing with data with complex relationships. Compared with the traditional fully connected layer, the attention mechanism can be weighted according to the importance of different features, thus making better use of the information in the input data. In our method, we use the attention mechanism to make the model better understand the relationship between flavor indicators, thus improving the model’s prediction accuracy and generalization ability.
We wish to pay more attention to relatively important features to improve the prediction accuracy of the model, as shown in Figure 3 and defined by
α i = ω 2 T f ( ω 1 T x i + b 1 ) + b 2 ,
where α is the attention score, ω * and b * are the weight vector and bias terms of the *th layer, respectively, and f ( ) is the sigmoid activation function.

3.5. Multilayer Perceptron Layer

In deep learning, due to the large number of input features and the nonlinear relationship with the input results, it is often impossible to use a single layer of neurons to achieve nonlinear fitting. In this case, multiple neurons of a multilayer perceptron [19] need to be used. The multilayer perceptron can handle more complex input features, which allows the model to make more accurate predictions about the target. In addition, it can enhance the nonlinear representation of the model to capture nonlinear relationships in the input data.
To simulate the input feature distribution, we map it to other sample spaces for analysis so as to achieve an accurate prediction by the model. For more complex input features, selecting a reasonable activation function and adding a fully connected layer can strengthen the model’s nonlinear expression ability. At the same time, increasing the number of neurons in each fully connected layer can also further improve the learning ability of the model.
In this work, we used a multilayer perceptron to comprehensively process the features extracted by the convolutional layer and map them to a higher-dimensional space to improve the nonlinear expression ability of the model:
h 1 = f ( ω 1 x C o n v + b 1 ) , h 2 = f ( ω 2 h 1 + b 2 ) , y = f ( ω n h n 1 + b n ) ,
where x C o n v is the feature vector extracted by the convolutional layer, f ( ) is the ReLU activation function, ω * and b * are the weights and bias terms of the *th layer, respectively, and y is the final prediction score of the model.

4. Experiments and Performance Evaluation

4.1. Data Collection

4.1.1. Flavor Data Collection

We selected fresh grapes marketed from June to August 2021, including 15 varieties such as Kyoho, Summer Black, and Shine Muscat, mainly from the provinces of Jiangsu and Zhejiang in China, for a total of 126 batches of samples. After the reaping of grapes, smooth and full fruits were screened out. Juices were extracted and filtered as samples, and the physical and chemical indicators of the grape pulp were tested according to the methods shown in Table 1.
We selected five commonly used physicochemical indicators that affect grape flavor and are generalizable to the grape varieties analyzed in the experiments. We present each of these five indicators and explain their influence on grape flavor as follows.
Soluble solids are the total amount of sugars and other water-soluble substances in the grapes, and their contents reflect the sweetness and ripeness of the grapes. The higher the soluble solids are, the sweeter the taste is. However, too many soluble solids can also make the grapes cloyingly sweet or sticky.
Titratable acid is the total amount of acids in grape juices, usually composed of malic, citric, and other organic acids. It is an essential indicator of the acidity of grape juices and greatly impacts the flavor and quality of the grapes. Grapes with high titratable acid contents exhibit strong acidity, while grapes with low titratable acid contents exhibit a blander taste.
The solid/acid ratio is the ratio of the total acid to soluble solids in grape juices. It is a key indicator of the acidity and sugar content of grapes and reflects the ripeness and flavor of the grapes. Generally, grapes with a low solid/acid ratio have a softer taste and relatively low acidity, while grapes with a high solid/acid ratio have higher acidity and a stronger taste.
Total phenols are a mixture of natural compounds present in the skins and seeds of grapes. They include compounds such as tannins, anthocyanins, and flavonoids. Total phenols can increase the bitterness and dryness of grapes. At the same time, total phenols can also enhance the fruitiness and herbaceousness of the grapes, which may give them a more complex and deep flavor.
Volatile substances volatilize easily at room temperature and include esters, alcohols, aldehydes, aromatic compounds, etc. In grapes, volatile substances are mainly found in the skin and flesh, and they are one of the primary sources of the aroma and taste of wine.
The relationship between the physicochemical indicators of grapes is very complex, and these indicators interact with each other. Therefore, judging the flavor of grapes solely from the content of a single indicator is insufficient. An accurate assessment of the flavor and quality of grapes requires a combination of factors and the contents of multiple indicators. The range of data for each physicochemical index for grape flavor determined experimentally is provided in Table 2.
This table provides data ranges, means, and standard deviations for five physical and chemical indicators to determine the flavor profile of grapes. These measurements are important in assessing the quality and flavor characteristics of the samples and therefore can be used for model training to ensure the good generalization performance of the model in predicting the sensory quality of different grape varieties. Since these metrics reflect the chemical composition and flavor characteristics of grapes, they are considered the input features of the model to predict the sensory scores of grape flavors. A comprehensive analysis of these indicators facilitates a deeper understanding of the chemical composition and flavor characteristics of grapes and provides valuable information and data support for the construction of a grape flavor evaluation model.

4.1.2. Sensory Evaluation Data Collection

Following the method in [20], we provided sensory training to teachers and students in our institution who voluntarily participated in the evaluation. A group of 15 students and faculty members were selected to form the evaluation team. The sensory analysis was conducted in a quiet and comfortable environment, where each taster had an independent space to avoid disturbances. The evaluation of grape flavor consisted of two parts: taste and aroma. The tasters were required to score the grapes together, and the total score was averaged. The evaluation questionnaire is provided in Table 3.
To ensure that the assessment results are representative and objective, we determined the age distribution and the gender distribution of the assessment groups, as shown in Table 4 and Table 5, respectively.
These tables show a reasonable age distribution and a balanced gender distribution of the sensory analysis evaluation panel. Among them, people in the age group of 20–39 years old account for nearly 70% of the entire panel, which is in line with the characteristics of young and keen senses. The proportions of males and females are 53.3% and 46.7%, respectively, which are also relatively balanced and could represent the sensory experiences of more different groups.
The grape juice samples were first tested for physical and chemical indicators, and then the sensory evaluation was performed by professionally trained tasters. Based on objective and subjective data, a dataset was formed and is available in [21]. Each data point in the dataset corresponds to a grape sample, with measurements of physical and chemical indicators, sensory scores, and average scores of the evaluation panel. To ensure the accuracy and reliability of the model, the dataset was split into a training set and a test set with a ratio of 8:2, which means that 80% of the data were used for model training and fitted to obtain the model’s parameters, and the remaining 20% of the data were used to predict the sensory scores of the grapes. The physical and chemical index values were used as input features for the model, and the model’s predictive performance was evaluated by comparing the model’s predicted score with the average sensory score.

4.2. Performance Evaluation Indicators

The model proposed in this paper is designed to accurately evaluate the flavor quality of fresh grapes and predict flavor quality scores based on fresh grape flavor indicators.
To comprehensively assess the score-based prediction performance of the model, we considered multiple metrics, such as root-mean-square error (RMSE), R2, and the Akaike Information Criterion (AIC). RMSE reflects the magnitude of the error between the predicted and actual values, R2 assesses the model’s goodness-of-fit, which is a measure of how well the model’s predicted values match the actual values, and AIC weighs the complexity and goodness of the fitness of the model to avoid the problem of overfitting.
Furthermore, to describe consumer flavor distinctions of grapes and expand the generalizability of the research proposed in this paper, we divided the fresh grape samples into five grades and used accuracy, precision, recall, and F1-score to evaluate the performance of the classification, which reflects the validity of the grape grade prediction.

4.2.1. R 2 , RMSE, and AIC for Prediction Evaluation

We used metrics such as R2, RMSE, and AIC to assess the scoring predictive power of the model. Sum-of-squares error (SSE) is the basis for measuring the goodness-of-fit of the model and is the sum of squares of the differences between the predicted and actual values:
SSE = i = 1 m ( h ( x i ) y i ) 2 ,
where h ( x i ) is the predicted value, and y i is the corresponding true value.
Total sum of squares (TSS) measures the degree of variability or dispersion in the data. It is the total sum of squares between all actual values and the mean of the data and is the basis for other statistical indicators:
TSS = i = 1 m y i y ¯ 2 m ,
where m is the number of samples.
The Coefficient of Determination ( R 2 ) is used to assess how well the model fits the data and takes a value between 0 and 1, with a value closer to 1 indicating a better fit:
R 2 = 1 SSE TSS .
RMSE [22] is the average difference between the predicted score and the actual score, which intuitively shows the prediction performance of the model:
RMSE = SSE m ,
AIC (Akaike Information Criterion) is a model selection criterion that takes into account the prediction accuracy and complexity of the model and is calculated as:
AIC = m ln ( SSE ) + 2 p ,
where p is the number of parameters used in the model.

4.2.2. Accuracy, Precision, Recall, and F1-Score for Classification Evaluation

According to the scoring criteria, we divided the grades of table grape samples into five grades with an interval of 20 points. Based on this scheme, if the predicted score and the actual score are at the same level, we claim it as a correct prediction; otherwise, it is considered an incorrect prediction.
Accuracy is defined as the ratio of the number of correctly predicted samples to the total number of samples. We used accuracy as a measure of the generalization ability of the model to compare the prediction results of different models.
For each level, precision is the proportion of samples correctly predicted for the level to the number of samples predicted for that level, and recall is the proportion of samples correctly predicted for the level to the actual number of samples for that level, as defined below:
P r e c i s i o n = TP TP + FP ,
R e c a l l = TP TP + FN ,
where TP is the number of positive samples predicted as positive samples, FP is the number of negative samples predicted as positive samples, and FN is the number of positive samples predicted as negative samples. Precision and recall represent the model’s false detection rate and the missed detection rate.
The F-score is an evaluation indicator that takes into account both precision and recall. The F1-score is the summed average of precision and recall and is the most commonly used evaluation indicator for classification:
F 1 = 2 · P r e c i s i o n · R e c a l l P r e c i s i o n + R e c a l l .
The F1-score can be used to visually measure the effectiveness of the model. We calculated the precision, recall, and F1-score corresponding to each level and calculated the overall model value by weighting the average of the precision, recall, and F1-score values of all levels.

4.3. Environmental Setup

The proposed DNN-based classifier was implemented and tested on a computer with the configuration shown in Table 6.

4.4. Evaluation Results

4.4.1. Comparison of Different Models

To evaluate the performance of the proposed model, we conducted a controlled experiment to compare different models, using RMSE, R 2 , AIC, accuracy, precision, recall, and F1-score as the evaluation indicators. The experimental results are provided in Table 7.
We compared four different models, namely, Support Vector Machine (SVM), Random Forest, Convolutional Neural Network (CNN), and BP Neural Network (BPNN). In general, our model performs better with respect to all evaluation metrics.
Specifically, for the rating prediction, our model performs the best in terms of RMSE at 2.657, which indicates that our model accurately predicts the grape flavor with less error. Meanwhile, our model performs well in terms of R 2 at 0.987, implying that the variability in the target variables is well explained. AIC evaluates the explanatory performance and complexity of the model. Our model performs the best in terms of AIC, which indicates that our model better explains the nature and characteristics of grapes and performs better in prediction.
In terms of classification metrics, our model consistently performs better, achieving an accuracy of 0.948, which indicates that our model classifies grape flavors into different categories with a high degree of accuracy. Our model also achieves a better performance in terms of precision, recall, and F1-score, which indicates that our model has high comprehensiveness and reliability in classifying different categories of grape flavors.
SVM performs poorly in the grape flavor multi-classification problem, achieving the lowest accuracy and F1-score. Note that SVM is a binary classifier, and it requires multiple binary classifiers for multi-category classification problems, which can be complex and computationally intensive. In addition, SVM is not suitable for handling nonlinear problems. Random Forest (RF) performs better in multi-classification problems than SVM. RF directly handles multi-category classification problems with better generalization ability and noise immunity. It uses multiple decision trees to reduce overfitting and can handle nonlinearity and missing data. However, it is generally less effective than neural networks for nonlinear problems. CNN and BPNN perform better in the grape flavor evaluation problem. Due to the powerful representation capability of neural networks, they can better learn and represent the complex relationships in the data. CNN is stronger in extracting local features using convolutional and pooling layers and weaker in handling global relationships. BPNN uses fully connected neural networks to fit the data and can adaptively adjust the weights and biases to better fit complex multi-category classification problems, making it a more effective solution.
The model in this paper is based on DNN, with models such as embedding and attention added to improve its expression ability and achieve the best prediction results. The feature vector generated by the embedding layer can represent the grape features more accurately and thus better express the semantic information of the data. In addition, the attention mechanism helps the model pay more attention to essential data features, which further improves the model’s prediction accuracy. Overall, our model can better explain the nature and characteristics of the grapes and simulate the complex relationships between different fresh grape flavor indicators, allowing for an accurate evaluation of fresh grape flavor.

4.4.2. Effects of Different Layers

In order to understand the effects of each module of the model, we analyzed the contributions that three modules make to the model prediction, namely, the embedding module, the convolution module, and the attention module. The results are provided in Table 8. These results show that the embedding module expresses the input features more comprehensively and accurately by using the feature vector, which makes the model more robust, suitable for different types of grape samples, hence achieving higher accuracy. The convolution operation characterizes the interaction between various grape flavor-influencing indicators by capturing the local relationships between input features, allowing the model to better understand the correlations between features and improving the prediction accuracy of the model. Introducing the attention module allows the model to extract the critical factors in the grape flavor feature column more effectively and attenuate non-important features, resulting in a better model prediction. The attention mechanism plays an important role in feature feedback, which can speed up model convergence. It also mitigates the interference of noisy, redundant features, thus improving the robustness and generalization ability of the model.
The flavor evaluation model based on deep neural networks is designed to represent the complex, intricate relationships between the indicators to accurately evaluate the flavor of fresh grapes. Overall, each module improves the model prediction in different aspects and plays a vital role in the overall performance of the model. The complete model achieves the best performance in terms of all metrics, illustrating its efficacy and reliability in predicting the flavor quality of fresh grapes.

4.4.3. Effects of Different Dimensions of the Embedding Layer

In the embedding layer, the dimension D of the mapping vector has a significant impact on the prediction results. With all other hyperparameters remaining unchanged, we adjusted the dimension D from 32, 64, 128, 256, to 512. The prediction results are provided in Figure 4, which shows that the model achieves the best prediction when D is 128. This suggests that when the dimension D is too large, the model may be overfitting due to the limited number of samples, leading to a decrease in the accuracy of the prediction results. On the other hand, when D is too small, the model may be underfitting due to the difficulty of combining the effects of all grape flavor indicators, leading to a decrease in the model’s generalization ability.

5. Discussion

In this paper, we propose a deep-neural-network-based grape flavor evaluation model and report the results of comparative experiments to illustrate our model’s accuracy and reliability in comparison with other models. Furthermore, we analyzed the contribution of each module in our model to its prediction performance. The embedding layer achieves a more comprehensive representation of the input data in the form of feature vectors, the convolutional layer extracts combined features through convolution kernels of different step sizes to characterize the interactions between flavor-influencing metrics, and the model integrates the attention module to increase the prediction accuracy. The complete model outperforms all other compared models in terms of all metrics.
We collected measurements of five physicochemical indicators: the total soluble solids, titratable acid, solid/acid ratio, total phenols, and volatile substances of grapes. Since these indicators reflect grapes’ chemical composition and flavor profile, they are used as input features of the model to predict the sensory scores of grape flavor. These five physicochemical indicators significantly impact the flavor of fresh grapes: soluble solids affect the sweetness and taste of grapes, while titratable acid affects the acidity of grapes. The solid/acid ratio reflects the balance of acidity and sugar in grape juices. Total phenols provide grapes with complex flavors and textures, while volatiles are the source of aromas that provide grapes with a unique smell and taste. Since there is a complex, interactive relationship between these five indicators, we need to consider their collective effects to achieve a high accuracy in flavor assessment. Considering the advantages of machine learning in nonlinear, multivariate fitting, we designed our flavor evaluation model based on a deep neural network with different levels of neurons to represent the complex interplay between different indicators. As a result of the experimental validation analysis, we obtained a range of indicators for predicting the flavor of grapes belonging to the first class, as shown in Table 9.
To ensure the quality of fresh grapes, certain sugar and acidity requirements must be satisfied. These requirements can vary according to different varieties and different origins. For example, the first grade of Thompson Seedless grapes in Xinjiang, China, requires that the soluble solids be above 20% and the total acid content be less than 0.80% [23]; the first grade of Summer Black grapes in Henan, China, should have a soluble solids content above 18% and a total acid content below 0.5% [24]. These requirements are generally in line with the predicted ranges in this work. In addition, the taste of fresh grapes primarily depends on the balance between sugar and acid contents, i.e., the solid/acid ratio [25]. A study by the Grape Research Group at Beijing Agricultural University, China, shows that an appropriate ratio of soluble solids to acid contents for Xuanhua Milk Grapes is about 35:1 to 40:1 [26]. In Xinjiang, China, the grading standard for Red Globe grapes requires a solid/acid ratio of not less than 39.1% for extra-grade fruits [27]. Total phenols mainly determine grapes’ astringency, bitterness, color, and antioxidant properties [28]. The total phenol content varies widely among grape varieties [29,30] and is affected by various factors, such as environmental conditions during fruit growth and ripeness at harvest [31]. A high total phenol content can make the grapes bitter and affect the taste and quality of the grapes, while a low total phenol content can cause the grapes to lack certain flavors and textures. The model predicts the best flavor at a total phenol content of 1.62 to 2.23 mg/g. The composition of volatile substances in grapes is complex and determines the typical characteristics of grape flavor [32]. The magnitude of the volatile concentration varies depending on the variety, origin, and cultivation conditions [30,33]. The model predicts the optimal grape flavor to be in the concentration range between 6.84% and 13.40%.
The proposed flavor evaluation model based on a deep neural network considers the interaction effects between different flavor indicators to assess the taste and quality of fresh grapes more accurately. The experimental results show that our model achieves an accurate prediction of flavor quality scores, completing a critical link in the fresh grape evaluation system. Users are able to predict grape flavor scores by feeding the test data of grape samples into the model. Our work can be applied to a variety of applications in four main domains. First, in the food and beverage industry, companies can use this model to evaluate the taste and quality of raw materials used in the production and sale of wines, juices, and other products and to improve and optimize products based on the evaluation results [34]. Second, in agricultural research, the model can be used to evaluate the flavor characteristics of different grape varieties and help select and breed varieties with better flavor characteristics [35]. Third, in market research and consumer studies, the model can be used to assess consumer preferences for the flavor of different grape varieties to better understand market demands and develop suitable products that meet such demands [36]. Finally, in environmental research, the model can be used to evaluate the flavor and texture of different grape varieties and their relationship with other environmental factors (region, climate, etc.). In addition, the methodology in our research can be extended to evaluate the flavor quality of other fruits and produce.

6. Conclusions

We investigated the problem of the flavor evaluation of table grapes and designed a deep-neural-network-based approach. We measured the physical and chemical index data related to the flavor of fresh table grapes and designed a sensory evaluation experiment to obtain the sensory scores of grape samples. The model uses an embedding layer to map the input index data to feature vectors for a more comprehensive and accurate representation. Considering the complex interaction between flavor indicators, we used convolutional layers with convolution kernels of different stride lengths to maximize the representation of such interactions. Since flavor indicators significantly differ in their influence on flavor quality, we introduced an attention module into the model to highlight important features and weaken non-important features.
We evaluated the prediction performance in terms of RMSE, R 2 , and AIC and the classification performance in terms of accuracy, precision, recall, and F1-score. The experimental results show that the proposed model outperforms other classic classification models. Our model conducts a comprehensive evaluation of the flavor quality of fresh grapes and provides an accurate prediction of flavor quality scores based on fresh grape flavor indicators, hence completing a critical link in the evaluation system of fresh grapes. This model has great potential to be used in a wide spectrum of applications, especially in the food and beverage industry, agricultural research, market and consumer research, and environmental research.

Author Contributions

Conceptualization, Y.Z. (Yu Zhang), W.S. and Z.L.; methodology, Z.L., L.G. and C.W.; software, Z.L.; validation, L.G. and Y.Z. (Yicheng Zhang); formal analysis, Z.L.; investigation, L.G.; resources, Y.Z. (Yu Zhang); data curation, Y.Z. (Yicheng Zhang); writing—original draft preparation, Z.L., C.W. and L.G.; writing—review and editing, C.W. and L.G.; visualization, L.G.; supervision, Y.Z. (Yu Zhang), C.W. and W.S. All authors have read and agreed to the published version of the manuscript.

Funding

This research was funded by the Modern Agricultural Industry Technology System Construction Special Funds (CARS-29).

Institutional Review Board Statement

Not applicable.

Informed Consent Statement

Not applicable.

Data Availability Statement

The data presented in this study are openly available in FigShare at https://doi.org/10.6084/m9.figshare.22730081 (accessed on 2 May 2023).

Conflicts of Interest

The authors declare no conflict of interest.

References

  1. Winkler, A.J. Better grapes for wine. Am. J. Enol. Vitic. 1958, 9, 202–203. [Google Scholar] [CrossRef]
  2. Diamanti, J.; Battino, M.; Mezzetti, B. Breeding for fruit nutritional and nutraceutical quality. In Breeding for Fruit Quality; John Wiley & Sons: Hoboken, NJ, USA, 2011; pp. 61–80. [Google Scholar]
  3. Muñoz-Robredo, P.; Robledo, P.; Manríquez, D.; Molina, R.; Defilippi, B.G. Characterization of sugars and organic acids in commercial varieties of table grapes. Chil. J. Agric. Res. 2011, 71, 452. [Google Scholar] [CrossRef]
  4. Cehnglin, G.; Aimin, G.; Xiaowei, W. Integrated evaluation of grape quality by the method of gray related degree analysis and analytic hierarchy process. Southwest China J. Agric. Sci. 2002, 15, 79–82. [Google Scholar]
  5. Pan, Z.; Zhou, W.; Xiao, Y.; Huizi. Quality evaluation of different table grape based on principal component analysis. Food Mach. 2018, 34, 139–146. [Google Scholar]
  6. Dawei, C.; He, S.; Li, M.; Gu, H.; Guo, X.; Chen, J. Difference and Comprehensive Evaluation of Fruit Nutritional Quality of Different Grape Varieties. Acta Agric. Jiangxi 2020, 32, 72–76. [Google Scholar]
  7. Shen, T.; Niu, R.; Huang, X.; Xu, Z.; Chen, W. Quality Assessment of Seedless Table Grapes Based on Hierarchy-relation and Principal Component Analysis. Sci. Technol. Food Ind. 2021, 42, 53–60. [Google Scholar]
  8. Xiangyan, Z.; Liangzhong, Z.; Wenbing, S.; Shengyan, J. Prediction model of quality of wine on principal component analysis and BP neural networks. Food Mach. 2014, 30, 40–44. [Google Scholar]
  9. Luo, Y.; Huang, Z.; Xu, J.; Wen, Q.; Ma, C.; Zhang, Z. Evaluation on Wine Quality Based on the Extraction of Neural Network Weights and Consistency of Particle Size. J. Liaocheng Univ. 2015, 28, 67–73. [Google Scholar]
  10. Liu, Y.; Wang, Y.; Miao, Y.; Song, J.; Chen, L. Research of the wine evaluation model based on PCA & neural network. Intell. Comput. Appl. 2016, 6, 67–69. [Google Scholar]
  11. Trivedi, A.; Sehrawat, R. Wine quality detection through machine learning algorithms. In Proceedings of the 2018 International Conference on Recent Innovations in Electrical, Electronics & Communication Engineering (ICRIEECE), Bhubaneswar, India, 27–28 July 2018; pp. 1756–1760. [Google Scholar]
  12. Aich, S.; Al-Absi, A.A.; Hui, K.L.; Sain, M. Prediction of quality for different type of wine based on different feature sets using supervised machine learning techniques. In Proceedings of the 2019 21st International Conference on Advanced Communication Technology (ICACT), Pyeongchang, Republic of Korea, 17–20 February 2019; pp. 1122–1127. [Google Scholar]
  13. Ioffe, S.; Szegedy, C. Batch normalization: Accelerating deep network training by reducing internal covariate shift. In Proceedings of the International Conference on Machine Learning, PMLR, Lille, France, 7–9 July 2015; pp. 448–456. [Google Scholar]
  14. Neishi, M.; Sakuma, J.; Tohda, S.; Ishiwatari, S.; Yoshinaga, N.; Toyoda, M. A bag of useful tricks for practical neural machine translation: Embedding layer initialization and large batch size. In Proceedings of the 4th Workshop on Asian Translation (WAT2017), Taipei, Taiwan, 27 November–1 December 2017; pp. 99–109. [Google Scholar]
  15. Dahiya, S.; Tyagi, R.; Gaba, N. Streamlining choice of CNNs and structure framing of convolution layer. In Proceedings of the Soft Computing: Theories and Applications: Proceedings of SoCTA 2019; Springer: Berlin/Heidelberg, Germany, 2020; pp. 705–718. [Google Scholar]
  16. Pang, Y.; Sun, M.; Jiang, X.; Li, X. Convolution in convolution for network in network. IEEE Trans. Neural Netw. Learn. Syst. 2017, 29, 1587–1597. [Google Scholar] [CrossRef]
  17. Maoz, I.; Kaplunov, T.; Raban, E.; Dynkin, I.; Degani, O.; Lewinsohn, E.; Lichter, A. Insights into the chemosensory basis of flavor in table grapes. J. Sci. Food Agric. 2020, 100, 1405–1417. [Google Scholar] [CrossRef] [PubMed]
  18. Vaswani, A.; Shazeer, N.; Parmar, N.; Uszkoreit, J.; Jones, L.; Gomez, A.N.; Kaiser, Ł.; Polosukhin, I. Attention is all you need. In Proceedings of the 31st Conference on Neural Information Processing Systems (NIPS 2017), Long Beach, CA, USA, 4–9 December 2017.
  19. Zare, M.; Pourghasemi, H.R.; Vafakhah, M.; Pradhan, B. Landslide susceptibility mapping at Vaz Watershed (Iran) using an artificial neural network model: A comparison between multilayer perceptron (MLP) and radial basic function (RBF) algorithms. Arab. J. Geosci. 2013, 6, 2873–2888. [Google Scholar] [CrossRef]
  20. GB/T 16291. 1-2012; General Guidelines for the Selection, Training and Management of Evaluators by Sensory Analysis Part 1: Preferred Evaluators. Standardization Administration of the People’s Republic of China: Beijing, China, 2012.
  21. Liu, Z. Grape Flavor Dataset. 2023. Available online: https://doi.org/10.6084/m9.figshare.22730081 (accessed on 2 May 2023).
  22. Chai, T.; Draxler, R.R. Root mean square error (RMSE) or mean absolute error (MAE)?–Arguments against avoiding RMSE in the literature. Geosci. Model Dev. 2014, 7, 1247–1250. [Google Scholar] [CrossRef]
  23. Ministry of Agriculture of the PRC. Thompson Seedless NY/T 704-2003; Standards Press of China: Beijing, China, 2004.
  24. Dawei, C.; Jinyong, C.; Hong, G.; Weiyuan, Z.; Yang, Z.; Xizhi, G.; Luzhen, J. Resarech on grading evaluation about fruit quality of‘Summer Black’ grape. J. Fruit Sci. 2016, 33, 1396–1404. [Google Scholar]
  25. Tian, S.; Ruimin, N.; Weiping, C.; Zehua, X.; Xiaojing, H. Evaluating the quality of eighteen table grapes by applying hierarchy-correlation degree and cluster analysis. North. Hortic. 2017, 23, 64–72. [Google Scholar]
  26. Guoguang, L. Quality Requirements and Taste Scoring Criteria for Table Grapes. Sino-Overseas Grapevine Wine 1986, 3, 4–7. [Google Scholar]
  27. DB65/T2832-2007; Red Globe Quality Classification Standard of Xinjiang Uygur Autonomous Region Quality and Technical Supervision Bureau. Administration of Quality and Technology Supervision of Xinjiang Uygur Autonomous Region: Xinjiang, China, 2008.
  28. Buhai, Z.; Keyu, G.; Hongshan, L.; Yuxiang, S.; Yanan, J.; Guowei, H.; Huawei, M. Comparative Study on Fruit Quality of Six Eurasia Grape Varieties. Acta Agric. Jiangxi 2011, 12, 45–47. [Google Scholar]
  29. Peng, L.; Tao, Y.; Ye, M.; Ye, X. Comparison of Physicochemical Properties and Phenolic Substances Composition of Five Grape Varieties. Food Ferment. Ind. 2019, 45, 74–81. [Google Scholar]
  30. Wei, S.; Chengmin, L.; Shouming, S.; Jiawei, W.; Yue, J. Comparative Analysis of Fruit Quality and Aroma Components of Different Grape Varieties. China South. Agric. Mach. 2022, 53, 20–25. [Google Scholar]
  31. Serratosa, M.P.; Marquez, A.; Moyano, L.; Zea, L.; Merida, J. Chemical and morphological characterization of Chardonnay and Gewürztraminer grapes and changes during chamber-drying under controlled conditions. Food Chem. 2014, 159, 128–136. [Google Scholar] [CrossRef]
  32. Bo, L.; Yuxia, S.; Xinjie, Z.; Xiao, W.; Jinhua, D. The volatile components of Muscat Hambourg grape were analyzed by GC-MS. Sino-Overseas Grapevine Wine 2005, 2, 4–6. [Google Scholar]
  33. Zhigang, G.; Tianming, L.; Changzeng, Z.; Minfang, Z.; Hui, W. Comparison of Aroma Components of the Grape and Wine from Different Area. China Brew. 2008, 16, 15–18. [Google Scholar]
  34. Dharmadhikari, M. Composition of grapes. Vineyard Vintage View State Univ. 1994, 9, 3–8. [Google Scholar]
  35. Egorov, E. Grape breeding is a key link in the development of the grapes and wine-making industry. Vavilov J. Genet. Breed. 2021, 25, 408. [Google Scholar] [CrossRef]
  36. Feng, H.; Feng, J.; Tian, D.; Mu, W. Consumers’ perceptions of quality and safety for grape products: A case study in Zhejiang Province, China. Br. Food J. 2012, 114, 1587–1598. [Google Scholar] [CrossRef]
Figure 1. The overall structure of the proposed model.
Applsci 13 06532 g001
Figure 2. A schematic diagram of the embedding layer.
Applsci 13 06532 g002
Figure 3. The structure of the attention layer.
Applsci 13 06532 g003
Figure 4. Effects of different dimensions on model prediction.
Applsci 13 06532 g004
Table 1. Indicators and detection methods.
IndicatorMethod
Total soluble solids (TSS)Brix meter
Titratable acid (TA)Acid–base titration
Solid/acid ratioCalculation
Total phenols (TP)Folin–Ciocalteu
Volatile substances (VS)HS-SPME
Table 2. Data ranges of grape flavor indicators.
IndexTSS (%)TA (%)Solid/Acid
Ratio
VS (%)TP (mg/g)
Range11.4∼26.90.34∼1.2211.45∼72.350.14∼13.401.05∼2.39
Average19.300.7329.248.731.79
STDEV3.900.2311.314.240.45
Table 3. Tasting score and flavor correspondence.
Score GradeTasteAroma
0∼20 (points)Rough, little juiceWeak aroma
20∼40 (points)Light, no harshnessLight aroma
40∼60 (points)Fresh, slight acidityDistinct aroma
60∼80 (points)Rich, multiple layersStrong aroma
80∼100 (points)Full-bodied, superior tasteExtremely intense aroma
Table 4. Age distribution of the evaluation panel.
Age GroupNumberPercentage
20∼29533.3%
30∼39533.3%
40∼49320%
50∼59213.3%
Table 5. Gender distribution of the evaluation panel.
GenderNumberPercentage
Male853.3%
Female746.7%
Table 6. Experimental environment configuration.
ConfigurationParameter
CPUIntel(R) Xeon Silver 4114
Memory128GB DDR4
Operating SystemUbuntu18.04 STL
Graphics CardGTX1060 Ti
Disk1TB SSD
Program LanguagePython 3.7
FrameworkPyTorch 1.6
IDEPycharm 2020.3.5
Table 7. Results of different models.
ModelRMSER2AICAccuracyPrecisionRecallF1
SVM---0.7280.6850.6980.691
Random Forest---0.7950.7510.7760.763
CNN6.4580.701800.1190.8450.8200.8260.823
BPNN5.7480.855550.9270.8520.8320.8660.835
Our Model2.6570.987206.4720.9480.9200.9360.928
Table 8. Effects of different layers on model prediction.
ModelRMSER2AICAccuracyPrecisionRecallF1
Without embedding layer3.5260.923512.4440.9060.8990.9030.901
Without convolutional layer4.2910.869553.9970.8910.8450.8980.869
Without attention layer2.9640.948392.0810.9240.9010.9300.915
The complete model2.6570.987206.4720.9480.9200.9360.928
Table 9. Range of indicators for predicting the flavor of grapes belonging to the first class.
TSS (%)TA (%)Solid/Acid
Ratio
TP (mg/g)VS (%)
Range18.10∼22.300.40∼0.7030.90∼40.451.62∼2.236.84∼13.40
Disclaimer/Publisher’s Note: The statements, opinions and data contained in all publications are solely those of the individual author(s) and contributor(s) and not of MDPI and/or the editor(s). MDPI and/or the editor(s) disclaim responsibility for any injury to people or property resulting from any ideas, methods, instructions or products referred to in the content.

