Article

Antidiabetic and Hypolipidemic Properties of Newly Isolated Wild Lacticaseibacillus paracasei Strains in Mature Adipocytes

1
Department of Pharmacology, Animal Physiology, Biochemistry and Chemistry, Faculty of Veterinary Medicine, Trakia University, 6000 Stara Zagora, Bulgaria
2
Department of Biochemistry, Microbiology and Physics, Faculty of Agriculture, Trakia University, 6000 Stara Zagora, Bulgaria
*
Author to whom correspondence should be addressed.
Appl. Sci. 2023, 13(11), 6489; https://doi.org/10.3390/app13116489
Submission received: 19 April 2023 / Revised: 18 May 2023 / Accepted: 22 May 2023 / Published: 25 May 2023

Abstract

:
This study investigates the antidiabetic and hypolipidemic potential of newly isolated Lacticaseibacillus paracasei strains in mature adipocytes. Differentiated 3T3-L1 cells are treated with 10% cell-free supernatants (CFSs) from four autochthonous (wild) strains (M2.1, C8, C15, and P4) of Lacticaseibacillus paracasei. Glucose consumption, intracellular lipid deposition, lipolysis rates, and some gene expressions related to adipocyte insulin sensitivity are evaluated. The results show that all CFS-treated groups experienced a substantial increase in glucose uptake, indicating a promising potential for countering glucotoxicity and insulin resistance. The different strains had notable differences in metabolic pathway modulation. Generally, the P4 CFS supplementation seems to enhance insulin-dependent glucose inflow, while M2.1, C8, and C15 supernatants stimulate insulin-independent glucose consumption by mature adipocytes. M2.1 CFSs ameliorate the mature adipocyte buffer capacity by enhancing intracellular lipid accumulation and reducing the lipolysis rate—an advantageous therapeutic effect in overweight individuals subjected to substantial obesity-predisposing factors. Notably, C8 and C15 CFSs suppressed the gene expression of crucial adipocyte insulin sensitivity markers, indicating an unfavorable outcome risk with prolonged treatment. Overall, our findings suggest that M2.1 and P4 Lacticaseibacillus paracasei strains may be implemented as nutraceuticals to counteract glucotoxicity and insulin resistance, potentially easing the health status of obese individuals.

1. Introduction

Obesity has been cited as a significant risk factor for morbidity and mortality worldwide. Deepening energy imbalance and mechanical stress in over-expanded adipocytes often trigger inadequate cellular responses to insulin, accompanied by an abrupt increase in free fatty acid release. This further induces disorders such as metabolic syndrome, insulin resistance, type II diabetes, cardiovascular diseases, and cancer formation [1,2,3,4]. Several therapy strategies, including diet manipulations, drugs, food additives, and surgical procedures, are used to treat obesity. However, depending on the patient’s initial metabolic state and the diet administered, consequences of obesity-related disorders remain largely irreversible, and extreme weight loss could even worsen the condition [5,6]. Recent attention has been focused on the relationship between gut microbiota composition and the development of obesity [7,8,9]. It is well-known that the correct modulation of the intestinal population regulates the gut micro-ecosystem, benefiting the host’s gastrointestinal and immune health status [10,11,12,13]. However, the biologically active substances released in probiotics’ fermentative activity are further absorbed by the intestinal epithelium to reach target tissues and organs via the bloodstream and affect key signaling molecules involved in the body’s metabolism [14,15,16]. Probiotics from Lacticaseibacillus and Bifidobacterium genera are broadly considered weight-lowering, hypolipidemic, hypoglycemic anticancer agents without much perceptible adversity in animals and humans [7,14,17,18,19,20,21]. Their byproducts mediate key adipogenic transcriptional factors [14,15,16,18,22,23], accelerate lipolysis in white adipose tissue [19], and enhance adipocyte insulin sensibility [14].
These effects have rarely been explored in existing obesity, especially when overnutrition is combined with solid predisposing factors. In this respect, Lacticaseibacillus paracasei (L. paracasei) strains have shown promising health-promoting properties by ameliorating obesity in mice and rats fed with a high-fat diet by alleviating inflammation and insulin resistance, as some strains substantially reduce animal weight [16,24,25,26,27]. L. paracasei strains are highly versatile and can be found in various environments, including the urogenital and gastrointestinal tracts of humans and animals, plants, soil, and naturally fermented products [28]. Therefore, research attention is being directed to identifying new L. paracasei strains with distinct health-promoting attributes in the context of obesity, as they could be potentially valuable as food additives and functional dairy products. The specific natural conditions and climate in Bulgarian mountainous regions contribute to the development of a unique and endemic microflora with proven health-promoting effects [12,13,29,30,31]. Therefore, certain projects have focused on searching for authentic Bulgarian microorganisms that are not part of commercial starters. Up to now, autochthonous L. paracasei strains, newly isolated from red ants in high mountainous areas, have shown significant antimicrobial and mycotoxic effects [32]. A recent study has also revealed their probiotic and antitumor potential [33] which underscores the significance of our current research.
Alternatively, the appropriate administration of live microorganisms is justified by the proclivity of probiotics for inactivation in unfavorable physical conditions during their distribution and storage. In immunocompromised individuals and patients with concomitant diseases, live probiotics could provoke significant adverse concerns due to their antigenicity and the possibility of bloodstream influx [18,34]. In order to avoid such disadvantages, paraprobiotics and postbiotics are preferred [10,14,18,35], and numerous studies investigate the direct effects of cellular lysates and supernatants from potential probiotic species on adipocytes [14,18,20,21,22,23] using the 3T3-L1 cells as a widely accepted model of white adipocytes [36].
The purpose of the current study is to investigate the potential health benefits of newly isolated wild L. paracasei strains that inhabit indigenous, native ecological niches in Bulgaria. The research focuses explicitly on the impact of their CFSs in the context of obesity. The impact of these CFSs is evaluated by considering their effect on adipogenesis, the lipolysis rate, glucose uptake, and the expression of specific genes involved in the insulin signaling pathway in differentiated 3T3-L1 cells.

2. Materials and Methods

2.1. Isolation and Identification of L. paracasei Strains

Wild L. paracasei strains M2.1, C8, C15, and P4 were isolated from eight native anthills of red wood ants (Formica rufa L.) by inserting wooden sticks and transferring the specimens into sterilized containers with skimmed milk. The anthills were located in Sinite Kamani National Park, Sliven, Bulgaria.
The obtained specimens were cooled and transported to the lab. Following a 24 h incubation period at 37 °C, 1 mL of the samples that exhibited visible coagulation was transferred to 9 mL of sterile saline solution (0.85% sodium chloride, w/v), which was supplemented with peptone (0.1%, w/v; Oxoid, UK). Subsequently, further serial dilutions of homogenates were carried out. For L. paracasei, in isolation, one milliliter of 10−4, 10−5, 10−6, and 10−7 dilution was pour-plated on a de Man, Rogosa, and Sharp agar (Oxoid, UK) in duplicate and incubated anaerobically at 37 °C for 48 h. The Gram-stained strains were analyzed microscopically, and catalase availability was tested directly by application of 3% H2O2 to the colonies. To obtain pure cultures, the Gram-positive and catalase-negative rods were streaked thrice on the de Man, Rogosa, and Sharpe agar (Oxoid, UK). Ultimately, the bacterial cultures identified as Lactobacillus spp. were further analyzed via the ARDRA technique [37] and species-specific PCR analysis based on particular primer sets as follows: L. paracasei (5′-CCCACTGCTGCCTCCCGTAGGAGT-3′ and 5′-CACCGAGATTCAACATGG-3′) [38] and L. rhamnosus (5′-CAGACTGAAAGTCTGACGG-3′ and 5′-GCGATGCGAATTTCTATTATT-3′) [39]. Primers used were derived from the 16S rRNA V1 region of L. paracasei and conserved 16S rRNA sequence of Lactobacillus [40]. The procedures are described in detail in our previous studies [32,37].

2.2. Preparation of L. paracasei Cell-Free Supernatants

Cell-free supernatants (CFSs) were produced, as described by Melo et al. [41] with some modifications. Briefly, each newly identified L. paracasei strain (M2.1, C8, C15, and P4) was routinely cultured in de Man, Rogosa, and Sharpe broth (MRS) (Oxoid, UK) at 37 °C for 24 h. The CFSs from L. paracasei strains were obtained by centrifugation at 9000 rpm for 10 min at 4 °C and were sterilized by filtration, passed through a 20 μm filter. They were then neutralized with 0.1 N NaOH to pH = 7 and frozen at −20 °C until use (maximum storage of three days).
Supernatants were included in the culture media as 10% of the whole quantity immediately before use. The implemented concentration was chosen based on the literature [33,42].

2.3. Cell Differentiation and Design of the Experiment

3T3-L1 MBX clone (3T3-L1) purchased from the American Type Culture Collection (CRL-3242, ATCC, Washington, DC, USA) was propagated in basal medium (BM), consisting of Dulbecco’s modified Eagle’s medium (DMEM; Sigma-Aldrich Chemie GmbH (Merck KGaA, Darmstadt, Germany)), 10% fetal bovine serum (FBS; Sigma-Aldrich Chemie GmbH), and 1% penicillin/streptomycin (PS; Sigma), in T75 flasks. When 80% of the surface of the culture vessel was covered with cells, 3T3-L1 preadipocytes were reseeded at a concentration of 4 × 10⁴/mL in 12- and 24-well plates (Corning, Inc., Sigma-Aldrich (Merck KGaA, Darmstadt, Germany). Twenty-four hours post-confluence, differentiation was induced by adding 1 μM dexamethasone (Sigma-Aldrich, St. Louis, MO, USA), 0.5 mM 3-isobutyl-1-methylxanthine (Cayman Chemical, Ann Arbor, ML, USA), 100 μM indomethacin (Sigma-Aldrich Chemie GmbH (Merck KGaA, Darmstadt, Germany)), and 10 mg/mL insulin (cell application, San Diego, CA, USA) in BM. The inducing medium was replaced by maintenance media (MM, consisting of BM, supplemented with 10 µM insulin) 48 h later, and adipogenesis was continued for another seven days until full maturation was reached.
Twelve groups (n = 6) were formed at this stage:
  • Two controls—treated with 10% v/v MRS (MRS_C/24 h and MRS_C/48 h), added to the MM for 24 or 48 h, respectively.
  • Eight experimental groups—M2.1/24 h, C8/24 h, C15/24 h, P4/24 h, M2.1/48 h, C8/48 h, C15/48 h, and P4/48 h; treated with L. paracasei CFSs of the respective strain, also as a 10% v/v of MM for 24 or 48 h, respectively.
  • Two negative controls—composed of growth-arrested preadipocytes kept in BM throughout the whole experiment and served to exclude the percentage of spontaneous adipogenesis, basal lipolysis, and direct glucose uptake caused only by the high concentration of glucose in the medium.
The cells were kept in a humidified atmosphere of 5% CO2 during the trial at 37 °C. Cell culture media were changed every two days during adipogenic differentiation and after 24 h during treatments. Cell viability, intracellular lipid accumulation, and glucose consumption were assessed 24 h and 48 h after treatment. The lipolysis rate was estimated at the end of the experiment (after 48 h of treatment), and the total RNA was collected for qPCR gene expression.

2.4. Cell Viability Assay (MTT Assay)

3T3-L1 cells were differentiated in 24-well plates, as previously described. A cell viability assay was performed after 24 or 48 h of treatment with L. paracasei CFSs according to the method described by Yang et al. [43]. Briefly, 60 µL (5 mg/mL) metabolic dye (4,5-dimethylthiazol-2-yl)-2,5-diphenyl tetrazolium (MTT) (Sigma, St. Louis, MO, USA) was added to each well and incubated at 37 °C for 80 min in the dark. Then, the absorbance of MTT reduced to formazan was measured at 570 nm wavelength (Synergy™ LX Multi-Mode Microplate Reader, BioTek Instruments, Inc., Santa Clara, CA, USA), and the percentage of cell viability was calculated using the following equation [44]:
Cell viability (%) = [OD570 (sample)/OD570 (MRS-C)] × 100

2.5. Oil Red O-Staining and Neutral Lipid Measurement

After 24 or 48 h of L. paracasei CFS treatment, mature adipocytes were washed with PBS, fixed in 10% (v/v) neutral buffered formalin for 10 min, dried in 60% isopropanol for 5 min, and stained with ex tempore prepared Oil Red O working solution for 30 min [45]. After removal of the staining solution, intracellular lipid accumulation in all cell groups was visualized using a Leica inverted cell and tissue culture microscope (Heerbrugg, Switzerland), equipped with a DMi1 version 5i megapixel camera and software platform Leica Application Suite Core. A final step to quantify intracellular lipid accumulation was isopropanol extraction of the dye and spectrophotometric determination of its absorbance at a wavelength of 490 nm (Biochrom Anthos Zenyth 200 rt microplate reader, Biochrom Ltd., Cambridge, UK). All data obtained are expressed relative to the respective MRS-treated control.

2.6. Glucose Concentration in Supernatants and Glucose Consumption Calculation

Following the L. paracasei CFS treatment of mature 3T3-L1 adipocytes for 24/48 h, the extracellular glucose concentration (EG) in the cell supernatants was determined using a Mindray BS-120 automatic biochemical analyzer (Guangzhou, China) and Glucose GOD-PAD reagent (Biolabo SAS, Maizy, France), according to the manufacturer’s guidelines. Briefly, the method involved the oxidation of glucose by glucose oxidase to gluconic acid and hydrogen peroxide, followed by the formation of a red quinoneimine compound. The concentration of glucose in the supernatants was determined by measuring the absorbance of the colored complex at 500 nm, which was directly proportional to the concentration of glucose. Part of the initially prepared, cell-free culture media from each group (IG) was also kept in empty wells under the same conditions and analyzed in parallel with the experimental supernatants.
Subsequently, the glucose consumption by the cells was calculated according to the following equation described by Diaz et al. [46]:
Glucose consumption (mg/L) = IG − EG
The final glucose consumption of adipocytes in each group was estimated as a percentage relative to the MRS_C.

2.7. Adipolysis Assay

To compare the rate of lipolysis in mature adipocytes after 48 h of the L. paracasei CFS treatment, we measured the glycerol concentration in all cell supernatants using the Adipolysis AssayKit (MAK313; Sigma-Aldrich Chemie GmbH). All samples were analyzed twice at 10 µL, strictly following the manufacturer’s protocol. The optical density (OD) was measured at a wavelength of 570 nm (Synergy™ LX Multi-Mode Microplate Reader, BioTek Instruments, Inc., Santa Clara, CA, USA) with 630 nm correction. Then, the glycerol concentration was calculated in µg/mL according to the OD of the standard curve, and the percentage of lipolysis was assessed relative to MRS_C.

2.8. Gene Expression Analysis with Real-Time PCR

After 48 h of L. paracasei CFS treatment, the adipocytes from 12-well plates were lysed, and a total amount of RNA was isolated using an RNeasy Mini Lipid Tissue Kit (QIAGEN GmbH). The obtained RNA quantity and quality were determined spectrophotometrically at 260 and 280 nm wavelengths using Synergy™ LX Multi-Mode Microplate Reader (BioTek Instruments, Inc., Santa Clara, CA, USA), equipped with Take3 Microvolume Plate (BioTek Instruments, Inc., Santa Clara, CA, USA). Then, the total RNA concentration was equilibrated to the lowest concentration among all samples (1000 ng/µL), and cDNA was synthesized by the RevertAid First Strand cDNA Synthesis Kit (Thermo Scientific, Waltam, MA, USA) according to the manufacturer’s instructions. cDNAs were stored at −20 °C until use.
Housekeeping and target-gene primer pairs were designed by “Primer 3_4.1” and the NCBI software program. The specification of the primer pairs was further confirmed in Primer-BLAST (NCBI), Primer 3plus (version: 3.2.5), and SerialCloner (version 2.6.1). The predicted products’ melting temperature and curves were analyzed using uMelt QuartzSM (Version: Release: 3.6.2 “Quartz”/5 November 2020). The primer sequences used in this experiment are listed in Table 1.
Gene expression was evaluated by SYBR Green-based two-step detection method performed on Real-Time PCR System (PikoReal, Thermo Scientific, Waltam, MA, USA), strictly following the KAPA SYBR® fast qPCR master mix kit manufacturer’s criteria (Qiagen Sciences, Inc., Germantown, MD, USA). All real-time PCR reactions were performed in duplicate.
Housekeeping gene stability was evaluated separately and in combination using the Ref Finder software (20 October 2020–25 May 2023) (http://blooge.cn/RefFinder/), accessed on 8 February 2023. The results revealed that the average value of both housekeeping genes (Ribosomal protein, large, P0, and β-actin) was the most stable. Therefore, gene expressions were evaluated using the modified 2–∆∆Ct approach with multiple reference genes [47,48]. The expression efficiency of each gene was also estimated and accounted for in the approach mentioned above. The PCR efficiency varied between 97–99%.

2.9. Statistical Analysis

All statistical analyses were performed using Statistica version 10 (StatSoft Inc., 2011, Tusla, OK, USA). Descriptive data analysis was applied to assess the mean and standard error. A nonparametric Mann–Whitney U test was performed to estimate the significant differences between the control (MRS_C) and each experimental group. p values less than 0.05 were assumed as statistically significant.

3. Results

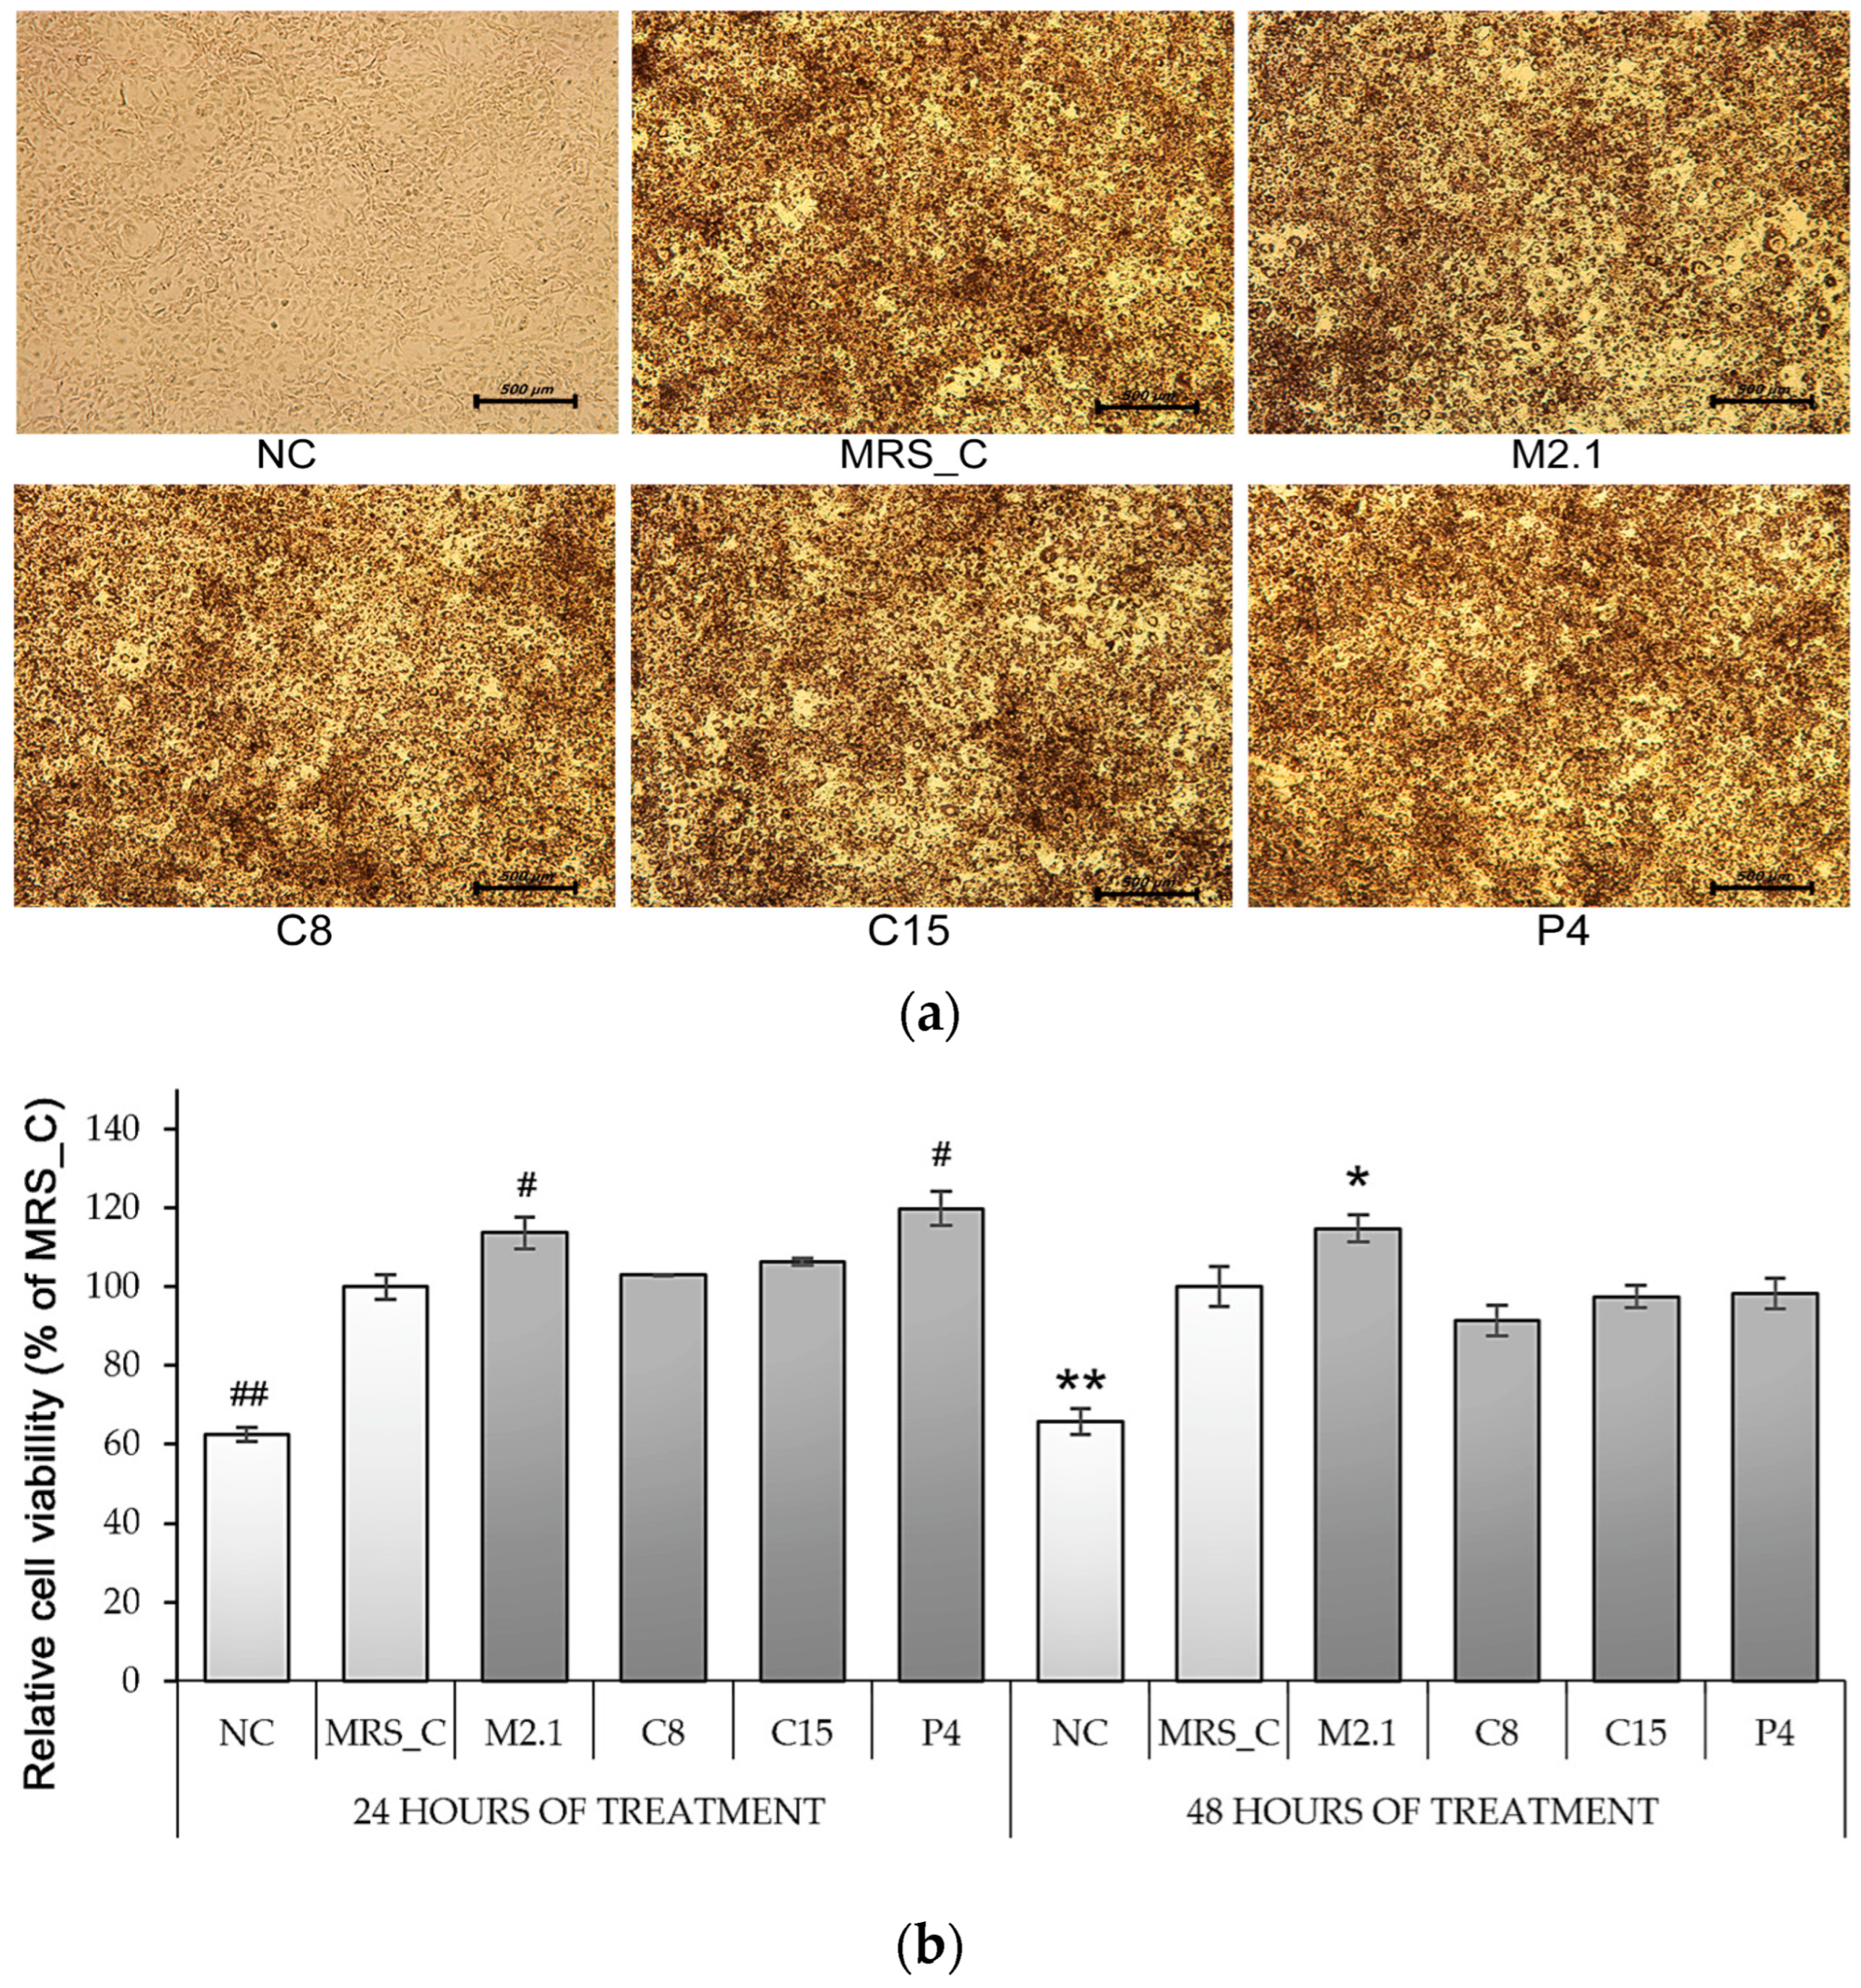
3.1. Effect of L. paracasei CFSs on Cell Viability in 3T3-L1 Adipocytes

The MTT assay evaluated cytotoxicity after 24 or 48 h of exposure of fully differentiated 3T3-L1 adipocytes to 10% supernatants from L. paracasei strains M2.1, C8, C15, and P4. Microscopic images taken at the end of treatments depict a preserved integrity of the cell monolayer (Figure 1a). The MTT assay testified an increase in cell vitality in the induced group (MRS_C) compared to NC (p < 0.01) and a lack of any significant effect in the tested CFSs compared to MRS_C (Figure 1b).
Therefore, in the current experiment, we assumed there to be no non-specific cytotoxic effect influencing adipocyte differentiation, lipid accumulation, glucose consumption, and lipolysis after 48 h of exposure to 10% CFSs.

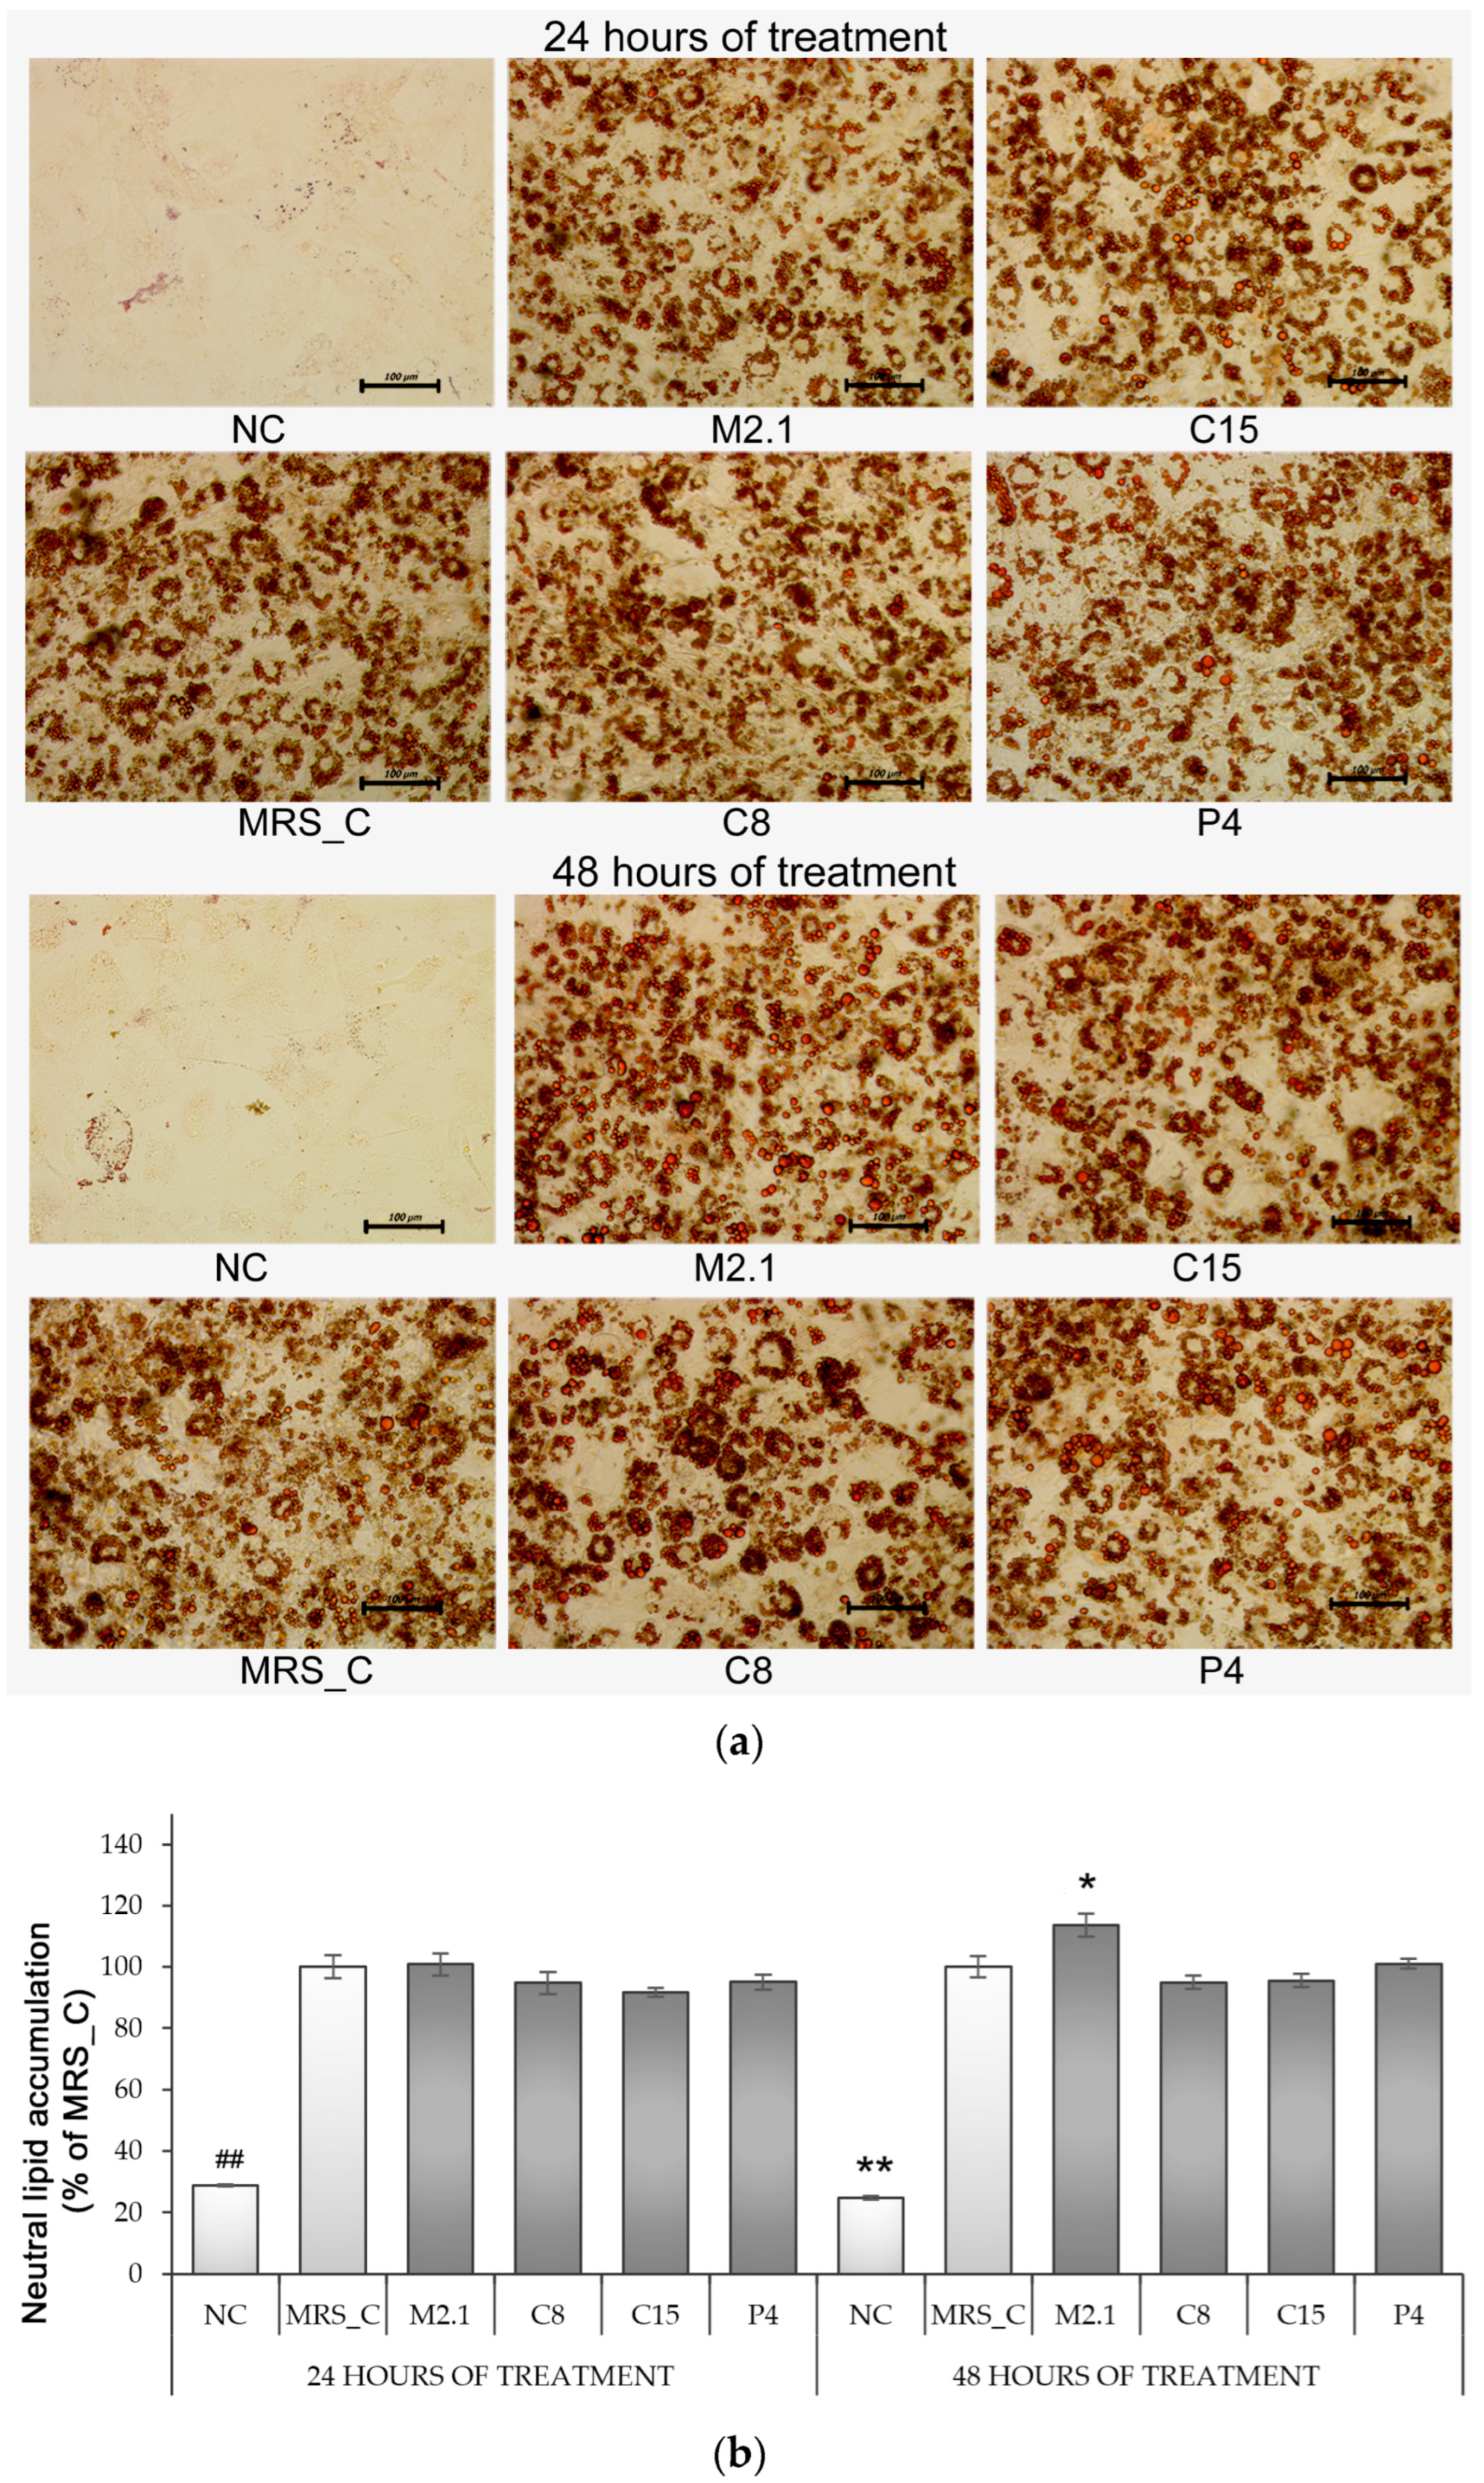
3.2. Effect of L. paracasei CFSs on Neutral Lipid Accumulation in 3T3-L1 Adipocytes

Oil Red O staining was used to visualize lipid droplet deposition in mature 3T3-L1 treated with 10% supernatants from M2.1, C8, C15, or P4 for 24 or 48 h. The images presented in Figure 2a depict abundant intracellular lipid accumulation in differentiated adipocytes compared to the NC. No visible differences among the induced groups were observed, regardless of the duration and type of culture media supplementation.
Furthermore, the abovementioned observations were confirmed by measuring the OD values of isopropanol extractions. Intracellular lipid accumulation in MRS_C marked a fourfold increase compared to NC. However, no significant modulation among the differentiated groups was established, regardless of the type or longevity of treatment. The only exception was found in M2.1 after 48 h of exposure, where neutral lipid accumulation was increased by 14% compared to MRS_C (p < 0.05) (Figure 2b).

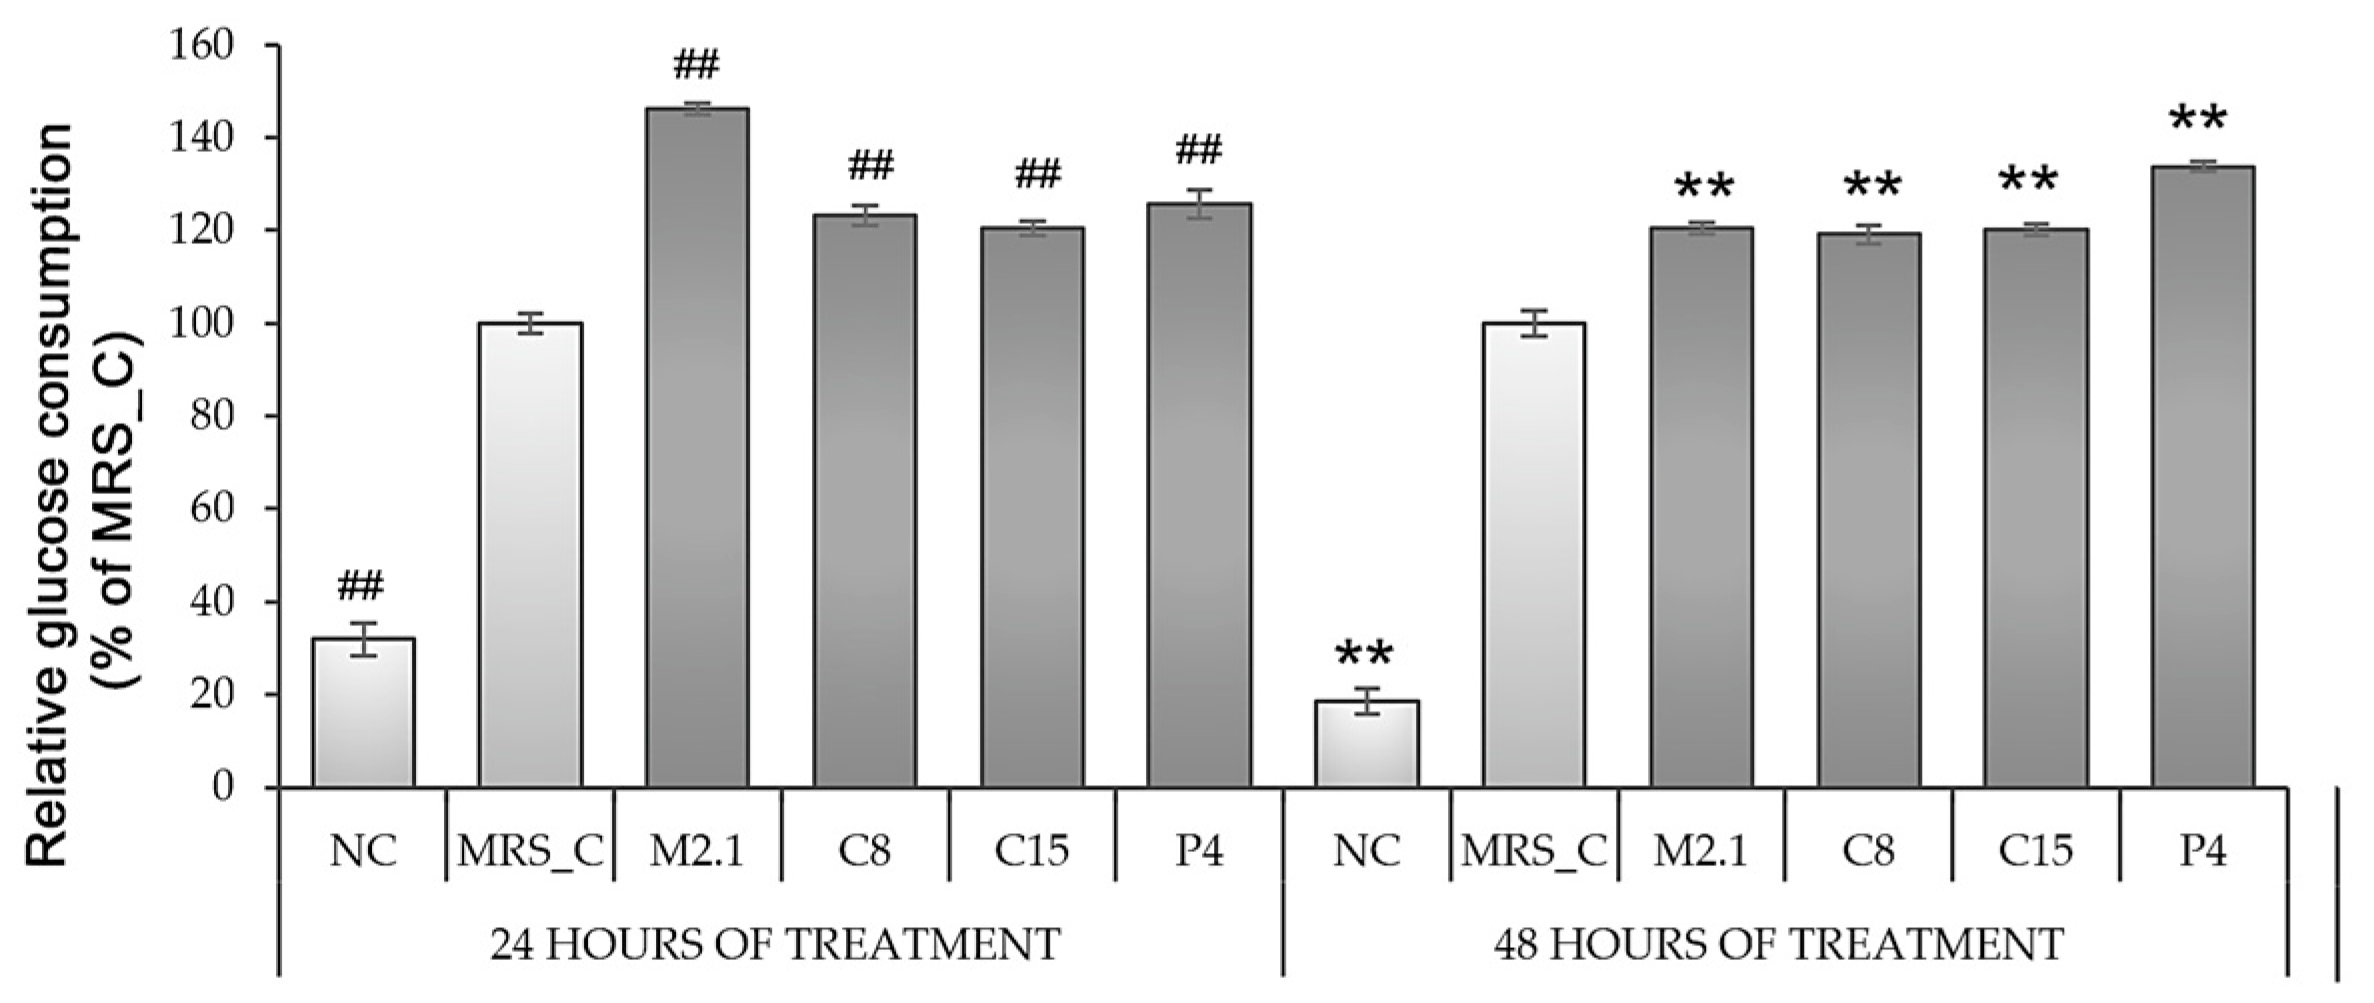
3.3. Effect of L. paracasei CFSs on Glucose Consumption in 3T3-L1 Adipocytes

After 24 and 48 h of treatment, we examined the cell supernatants’ extracellular glucose concentrations (EG) and calculated the relative glucose consumption levels related to MRS_C. As expected, the glucose consumption by mature adipocytes in MRS_C was 60% higher than in the preadipocytes from NC (p < 0.01). However, a further increase in glucose consumption by a minimum of 20% was observed in all CFS-treated groups (p < 0.01) (Figure 3).

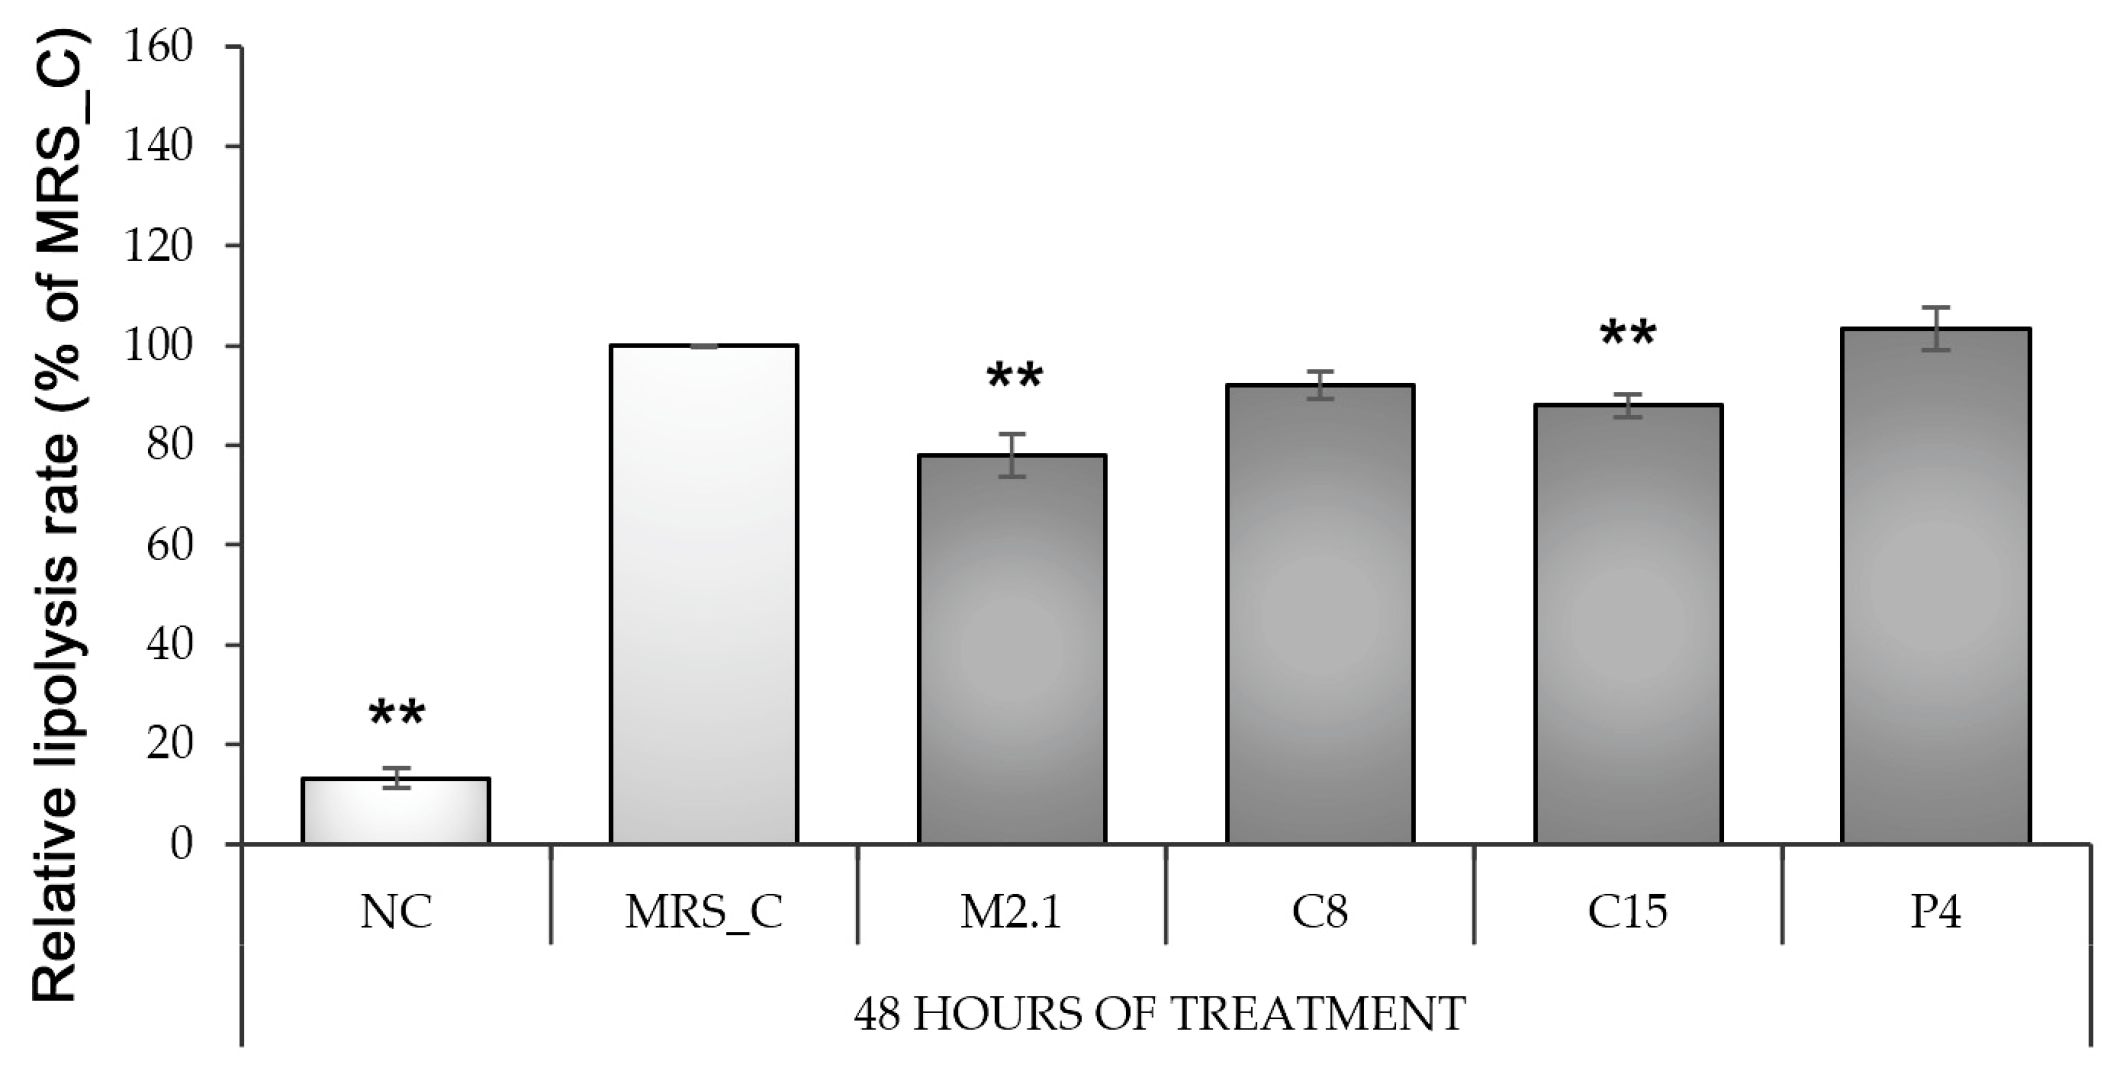
3.4. Effect of L paracasei CFSs on Lipolysis Rate in 3T3-L1 Adipocytes

To evaluate the lipolysis rate, we used an indirect method of determination based on the glycerol concentration in the cell supernatants after 48 h of CFS supplementation. The obtained data are expressed as a percentage of the MRS_C and show that differentiation alone increased the lipolysis level by 87% compared to NC (p < 0.01). However, the supplementation of L. paracasei M2.1 or C15 CFSs in the culture media of mature adipocytes significantly attenuates this effect in comparison to MRS_C (p < 0.01) (Figure 4).

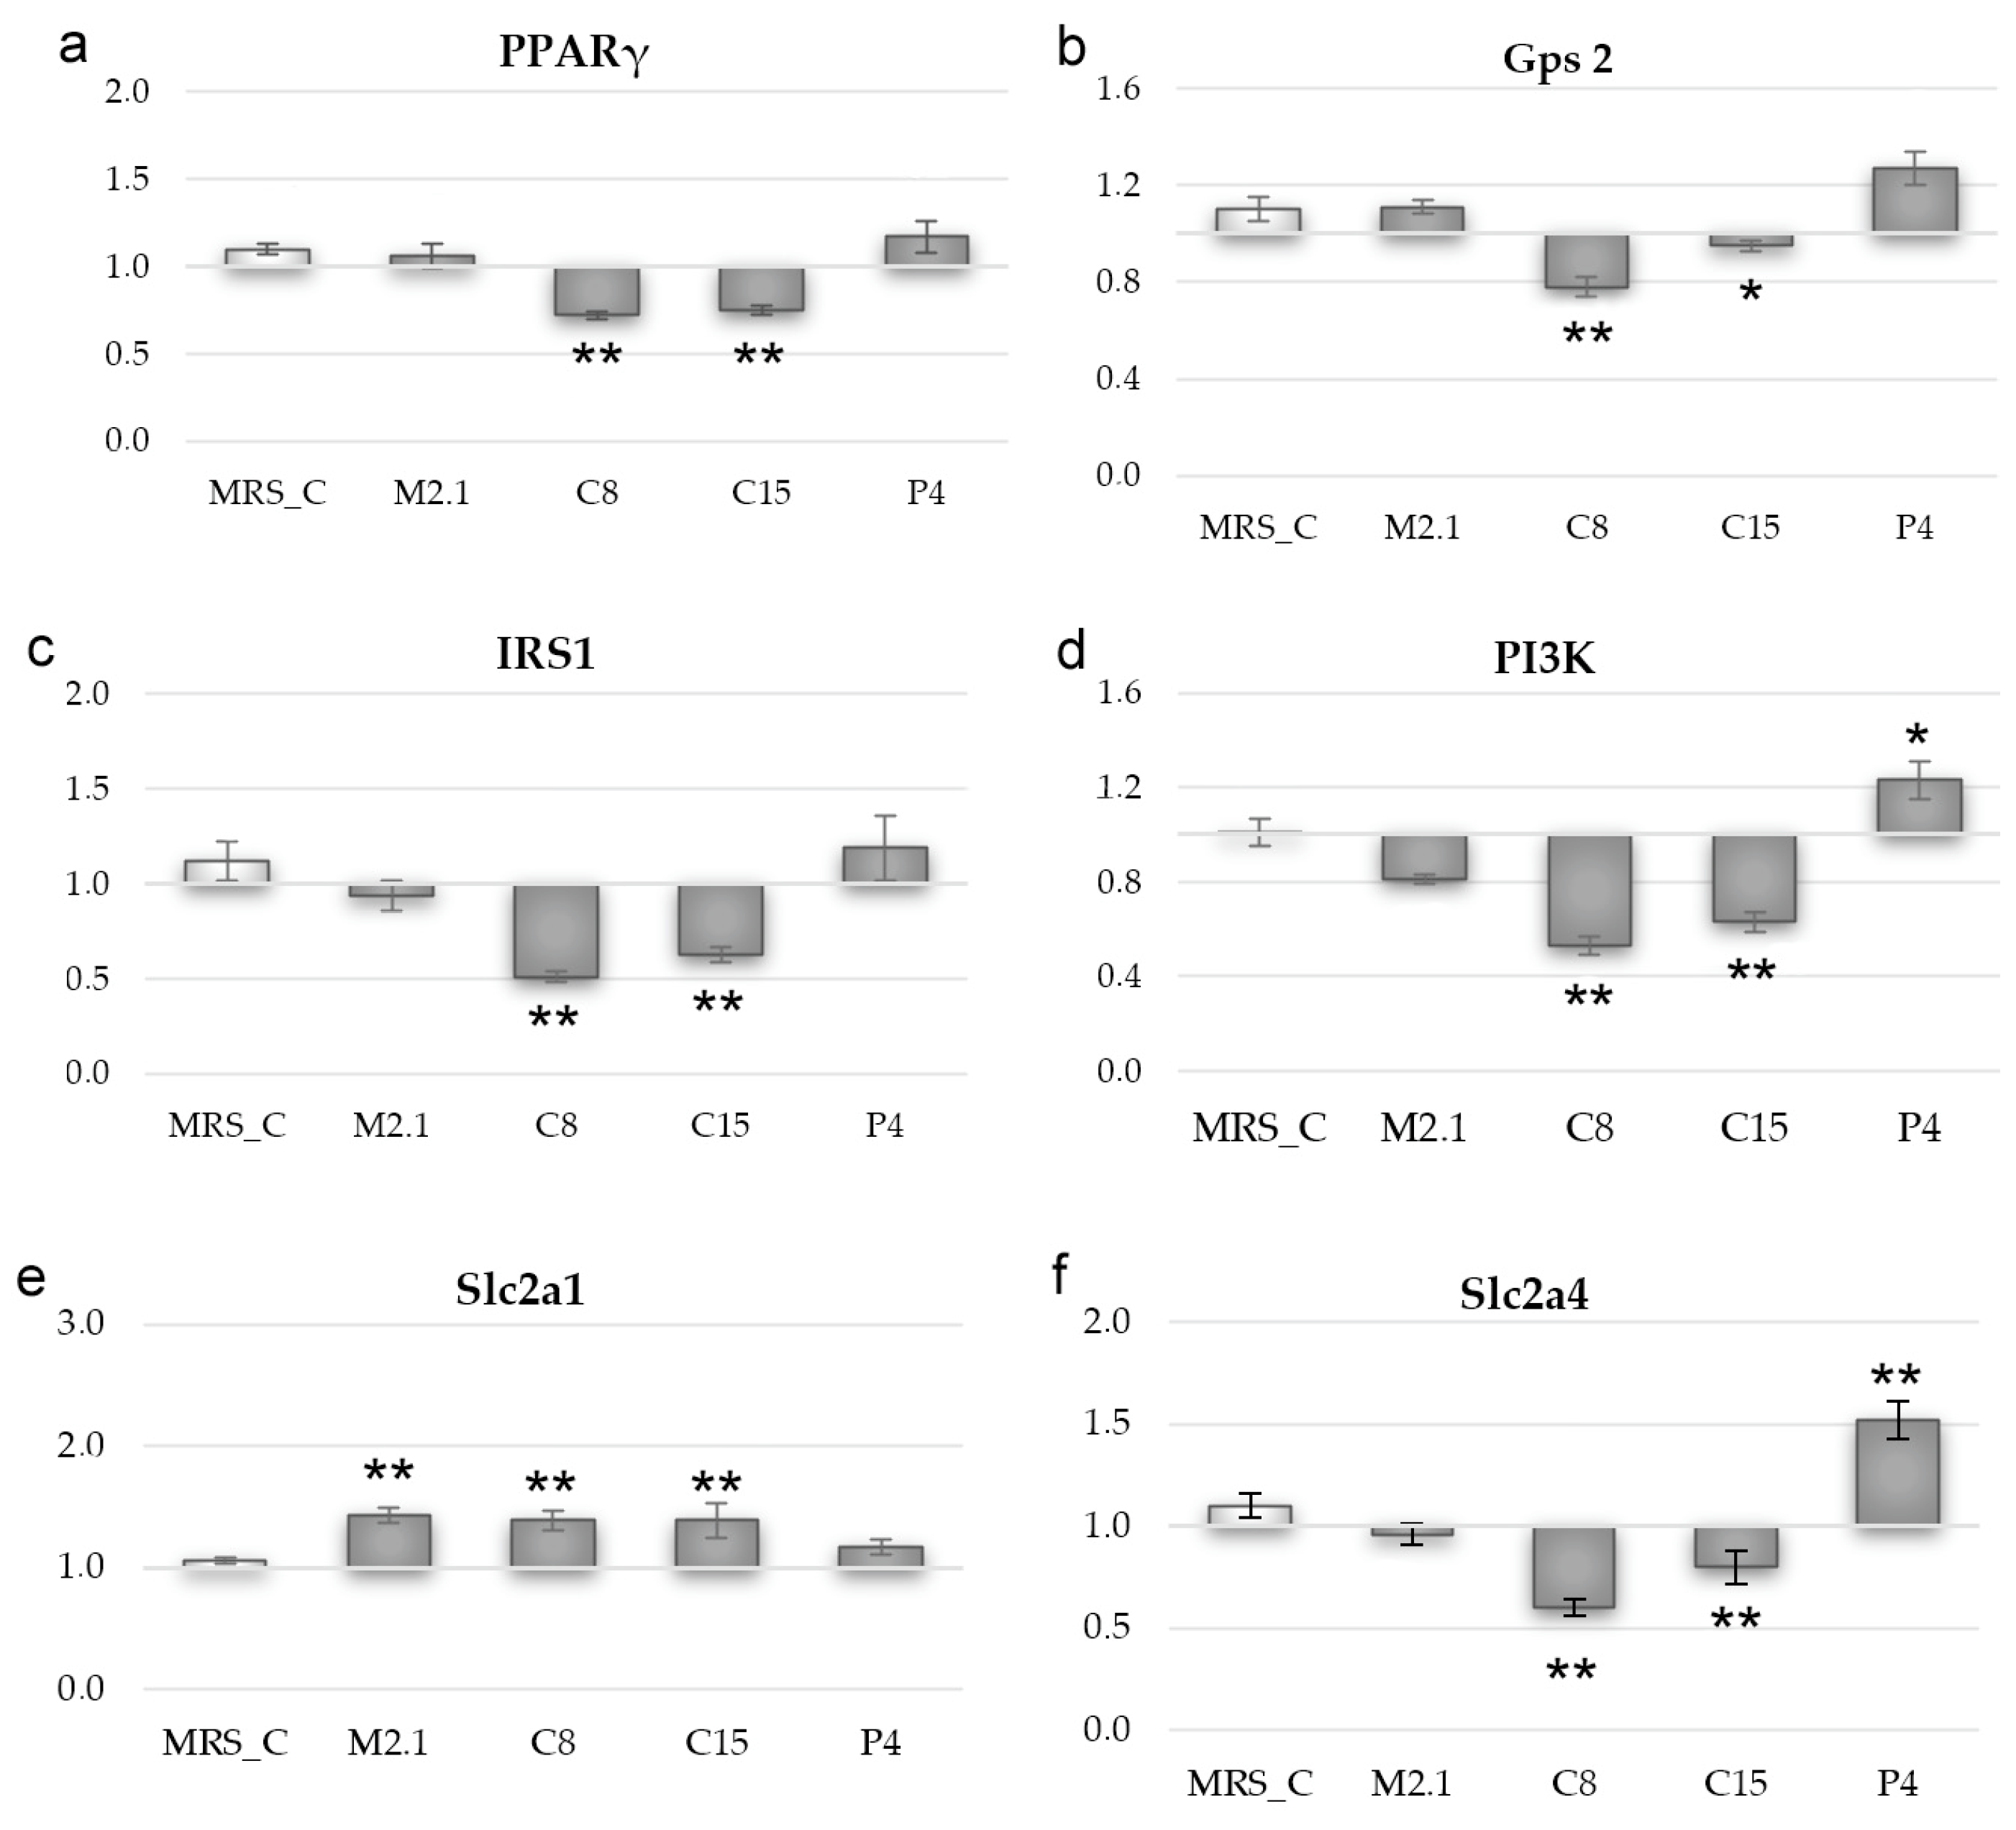
3.5. Effect of L. paracasei CFSs on Relative mRNA Expression in 3T3-L1 Adipocytes

Based on the considerably enhanced glucose consumption, we further evaluated the mRNA expression levels of some critical genes involved in adipogenesis and glucose consumption in adipocytes. The results are presented in Figure 5.
To our surprise, the seemingly similar effects in glucose uptake provoked by the studied L. paracasei CFSs were grounded by divergent metabolic pathway modulations. The data revealed upregulation in PI3K and Slc1a4 gene expression in P4 compared to MRS_C (p < 0.05), suggesting an enhanced insulin-dependent influx of glucose in these cells. In contrast, the mRNA gene expressions of IRS-1, PI3K, and Slc1a4 in C8 and C15 were significantly downregulated compared to MRS_C (p < 0.01). However, we found a notable increase in Slc1a1 gene expression in M2.1, C8, and C15 compared to MRS_C (p < 0.01), which indicates intensification of basal (insulin-independent) glucose uptake in these groups. Gps2—a newly identified crucial factor of adipocyte biology, involved in the modulation of PPARγ expression and the insulin signaling pathway—was downregulated in C8 (p < 0.01) and C15 (p < 0.05), compared to the control group. The PPARγ mRNA gene expression in these groups was also suppressed (p < 0.01), but these changes were not accompanied by variations in intracellular lipid deposition after 48 h of treatment.

4. Discussion

The current study investigated the possible anti-diabetic and hypolipidemic potential of newly isolated Bulgarian autochthonous L. paracasei strains in mature 3T3-L1 adipocytes. The obtained data indicated typical fat overload and an abrupt increase in lipolysis rate in MRS_C, compared to the non-induced control group. It was presumed that the applied eight days of adipogenic differentiation successfully mimicked the obesity-related enhanced systematic flux of FFA, which is generally accepted as a critical factor in the pathogenesis of muscle and liver insulin resistance and the lipotoxicity of peripheral tissues [49,50].
Under these circumstances, we tested CFSs from L. paracasei strains M2.1, C8, C15, and P4 at a dose of 10 percent for 48 h.
Several studies have demonstrated that the administration of lactic acid bacteria to 3T3-L1 preadipocytes inhibits the early stages of adipogenesis by suppressing adipogenic transcriptional factors, such as PPARγ, CCAAT–enhancer-binding proteins, fatty acid synthase, and fatty-acid-binding protein 4, and often potentiates glucose uptake [14,18,21,22,23]. The health benefits of these probiotics are more concerned with obesity prevention rather than treatment. The anti-obesity and anti-diabetic properties of probiotics are rarely explored in already mature adipocytes. Taghizad et al. [51] conducted a parallel investigation of the Lactobacillus gasseri LA39 bacterial product’s effect on differentiating and already differentiated 3T3-L1 cells. Interestingly, the adipogenic differentiation was suppressed in the treated preadipocytes but not in the mature adipocytes. In another trial, Guha et al. [20] tested the possible anti-obesity effect of the well-known probiotic strains of Lactobacillus acidophilus and a cocktail of Lactobacillus delbruckei sp. Bulgaricus and Streptococcus thermophilus in fully differentiated 3T3-L1 and established that both treatments suppressed lipid accumulation by the downregulation of crucial adipogenesis factors. Notably, the authors assumed that the aforementioned effect was due to the reduced entry and intracellular transport of lipids, which could be detrimental in vivo. Based on elevated blood lipid levels, the infiltration of lipids into non-lipidemic organs and subsequent cardiovascular disturbances are frequently observed, especially in overweight individuals exposed to factors highly predisposing to obesity.
Contrarily, our results revealed that the tested M2.1, C8, C15 and P4 L. paracasei strains enhanced the so-called “buffer capacity” of mature adipocytes due to the established increased glucose uptake, suppressed or unchanged lipolysis rate, and preserved intracellular lipid accumulation levels. Upon excess food intake or obesity-predisposing factors, such as immobilization and hormonal imbalances, a higher adipose tissue buffering capacity would maintain glucose and lipid homeostasis in physiological ranges over an extended period of time. Hence, the changes induced in this experiment would benefit the health status of obese individuals.
Insulin signaling modulation plays a crucial role in storing excessive nutrients in adipose tissue by regulating the glucose influx, intracellular triglyceride synthesis, breakdown, deposition, and lipolysis rate and ultimately affecting the whole body’s metabolism. Cellular mechanisms that modify physiological responses to insulin have been studied extensively, and multiple transduction pathways have been identified [4]. The IRS-1/PI3K/AKT pathway is assumed to be fundamental, mediated primarily by kinases counter-regulated by phosphatases (i.e., PI3K and PTEN) [52]. Regardless of the specific intracellular mechanism, increased insulin sensitivity in adipocytes provokes the translocation of insulin-induced glucose transporter 4 (GLUT4) from cytoplasmic storage vesicles to the cell membrane without changing the GLUT4-specific activity, followed by dramatically increasing the glucose flux rate into a cell.
Unexpectedly, the promoted glucose intake in our study could be explained by the stimulated insulin signaling pathway only in P4, where we found upregulation in mRNA gene expression of PI3K and Slc2a4, coding the GLUT4 protein. The lack of alteration in the lipolysis rate and intracellular lipid deposition in this group, alongside an increased glucose flux by 41%, suggests stimulated beta-oxidation. Increased beta-oxidation after probiotic administration in mice and 3T3-L1 cells was reported by Huo et al. [16], further manifested by a proven weight loss effect.
In the rest of the L. paracasei CFS-treated groups, the Slc2a4 gene expression was similar (in M2.1) or downregulated (in C8 and C15) compared to the control (MRS_C). At the same time, the increased glucose consumption remained approximately the same compared to P4. These supernatants significantly upregulate the Slc2a1–GLUT1 protein-coding gene expression, which is responsible for basal glucose uptake in many cell types, including adipocytes. Like GLUT4, the final step of GLUT1′s physiological role realization is its translocation to the cell surface. Several extracellular stimuli are shown to modulate this process, but kinetic analyses indicate that the insulin impact is negligible. Thus, its expression levels remain almost unchanged in a diabetic state [53,54].
It should be emphasized that in adipose tissue, GLUT1-mediated glucose transport is less effective than GLUT4 ones [54], and the increased activity of GLUT1 is more likely to contribute to adipocyte glucose uptake only in preserved GLUT4 functionality. Therefore, the facilitated glucose influx in group M2.1 was most likely due to the upregulation of Slc2a1 mRNA gene expression, where no suppression of Slc2a4, PI3K, or IRS-1 expression was observed. The increased glucose uptake via an insulin-independent pathway without suppressing insulin signaling that was observed in this group could benefit existing insulin resistance or type II diabetes. Additionally, we established an increased neutral lipid deposition and a significant decrease in lipolysis rate or the so-called “healthy expansion” of adipocytes, which is extremely valuable in the presence of factors highly predisposing to obesity.
The obtained results from the C8 and C15 groups appear controversial. In fact, the data indicated an effect similar to that of M2.1. Moreover, the suppressed lipolysis and intensified glucose uptake were not accompanied by increased intracellular lipid deposition, which indicates a potentiated beta-oxidation. The gene analyses in these groups noted a decreased mRNA expression of PPARγ—a highly desired effect of food additives preventing obesity.
However, considering that mature adipocytes were used in our study, the gene expression analyses in C8 and C15 outlined likely adverse health outcomes. Plenty of evidence indicates the pivotal role of PPARγ in metabolic homeostasis in adipose tissue physiology. It has been widely adopted as a classical drug target for ameliorating metabolic syndrome and type 2 diabetes. PPARγ triggers a subtle network of transcriptional changes in early adipogenic differentiation. So far, no transcriptional factor has been found to promote preadipocyte adipogenic differentiation in the absence of PPARγ [55]. PPARγ also remains essential for maintaining homeostasis in mature adipocytes. Its ablation from adult mouse adipocytes makes them prone to apoptosis [56]. Recently, it has been clarified that in lean mice models, the PPARγ1 isoform plays a central role in adipose tissue development and function. In a high-fat state, PPARγ2 is crucial for balancing energy expenditure and intracellular lipid deposition, being a critical factor in adipose total storage capacity and healthy expandability [55,57]. Its inhibited expression is concomitant with detrimental adipocyte hypertrophy, mitochondrial dysfunction, and adipose tissue inflammation, which are strongly associated with obesity-associated metabolic complications, including insulin-deficient diabetes [58,59].
A new body of evidence has focused on the decisive role of transcriptional coregulators in adipocyte biology. It has been especially pointed to the multifunctional protein Gps2 due to its ability to interact with numerous transcriptional factors involved in lipid metabolism, inflammation, mitochondrial biogenesis, and the insulin signaling pathway [57,60,61]. Although the physiological Gps2 action is still debatable, it is known to control the activity of master adipogenic regulators PPARγ and C/EBPs [62]. Gps2 depletion is assumed to upregulate PPARγ and C/EBPs mRNA expression and unleash transcription factors responsible for epigenetic remodeling, eventually promoting adipocyte maturation. Moreover, it is thought that Gps2 depletion correlates positively with improved insulin sensitivity, acting as an intrinsic suppressor of insulin-mediated ubiquitination of protein kinase B (PKB/AKT) [4,62]. A large body of scientific work has indicated AKT as an irreplaceable mediator of the insulin signaling pathway downstream of PI3K, and its full activation is promoted by PI3K-dependent kinase phosphorylation. Still, more recent studies suggest that the critical rate-limiting step is not phosphorylation, but its ubiquitination and subsequent recruitment to the cell membrane. Gps2 restricts this insulin signaling pathway activation through inhibiting the uncoupling of the protein 13-mediated ubiquitination of AKT, so it is supposed that Gps2 realizes a crucial adjustment of insulin signaling, with respect to the cell’s energy needs [4,62].
However, there is a discrepancy between our results and the above-mentioned effects. The downregulation of mRNA Gps2 gene expression in C8 and C15 was accompanied by significant suppression of PPARγ, IRS-1, PI3K, and Slc2a4—modulations strongly associated with diminished insulin sensitivity and almost always followed by adipocyte metabolic dysfunction and unhealthy adipose tissue hypertrophy [63].
Similar conflicting data in human adipocytes were obtained by Barilla et al. [62], who supposed that Gps2 changes its physiological role depending on the maturity of the adipocytes. Its suppressed expression in the early stages of adipogenesis potentiates the intracellular triglyceride accumulation and amplifies the insulin signal, enabling more nutrients to flow in and be stored in the cell. In mature adipocytes, however, Gps2 adjusts the sphingolipid metabolism, thus modulating their expandability [57,62]. Its reduced expression in the late stages of adipogenesis, primarily upon overnutrition, is accompanied by increased mechanical stress due to limited expandability, leading to subsequent pro-inflammatory states in the adipose tissue [64].
Therefore, the gene expression data obtained from C8 and C15 L. paracasei CFS treatment suggest that prolonged application may substantially deteriorate metabolism in mature adipocytes. However, it should be emphasized that a wealth of information has indicated PPARγ and Slc2a4 as important tumor markers in different tissues. Their suppressed levels are associated with reduced intracellular energy supply, further manifested by inhibited tumor growth and cancer cell survival [65,66,67,68]. This may prove to be a promising strategy in anticancer therapy. However, further studies are needed to explore their full potential.

5. Conclusions

The current investigation revealed the potential of autochthonous L. paracasei strains, isolated from anthills populated by red wood ants, to facilitate glucose consumption and restrict the lipolysis rate in mature adipocytes upon highly predisposing obesity factors. It was found that each strain, regardless of its genus affiliation, affects the metabolic processes in a particular manner. The P4 and M2.1 strains showed promising results in ameliorating the buffering capacity of 3T3-L1 cells. P4 CFS supplementation enhanced the insulin-dependent glucose inflow in 3T3-L1 and thus manifested a potential to counteract the onset of glucotoxicity and insulin resistance. The M2.1 supernatant seemed to stimulate insulin-independent glucose consumption by mature adipocytes without affecting the insulin signaling pathway, which might benefit the prediabetic state. In addition, the established modulation in energy storage pointed to a desired health impact of enhanced expandability in factors highly predisposing obesity. Concerning the effects of supernatants from the C8 and C15 strains, the 48 h application induced favorable changes in glucose and lipid utilization, similar to those in M2.1. The modulations of gene expression, however, indicated a possible metabolic deterioration and a decrease in the absorption capacity of nutrients during their long-term administration in mature adipocytes.
The obtained results reveal that the P4 and M2.1 L. paracasei strains provide a solid reason for further investigation and could emerge as a promising method to overcome obesity-related metabolic disorders. However, additional investigations and in vivo studies are required to add value to the reported effects.
In conclusion, we believe that supernatants from the newly isolated L. paracasei P4 and M2.1 strains could be implemented as potential additives in functional foods with antidiabetic properties, benefiting the health status of already obese individuals.

Author Contributions

Conceptualization, N.G., E.V. and G.B.; Methodology, N.G., G.B., E.V. and Z.I.; Software, N.G. and V.P.; Validation, E.V., Z.I. and G.B.; Formal Analysis, Z.I., N.G. and V.P.; Investigation, G.B., E.V. and Z.I.; Resources, G.B.; Data Curation, Z.I. and N.G.; Writing—Original Draft Preparation, N.G. and Z.I.; Writing—Review and Editing, G.B., E.V. and N.G.; Visualization, N.G. and Z.I.; Supervision, E.V. and G.B.; Project Administration, G.B.; Funding Acquisition, G.B. All authors have read and agreed to the published version of the manuscript.

Funding

This research was funded by the “Bulgarian Ministry of Education and Science” under the National Research Program “Healthy Foods for Strong Bio-Economy and Quality of Life”, approved by DCM # 577/17.08.2018.

Institutional Review Board Statement

Not applicable.

Informed Consent Statement

Not applicable.

Data Availability Statement

The datasets generated for this study are available to the corresponding author upon request.

Acknowledgments

The authors acknowledge Sinite Kamani National Park for the administrative and technical support. Laboratory of experimental cellular physiology and therapeutic drug monitoring, Faculty of Veterinary Medicine, Trakia University, Stara Zagora, Bulgaria.

Conflicts of Interest

The authors declare no conflict of interest.

References

  1. Hill, J.O.; Wyatt, H.R.; Peters, J.C. Energy Balance and Obesity. Circulation 2012, 126, 126–132. [Google Scholar] [CrossRef] [PubMed]
  2. Virtue, S.; Vidal-Puig, A. Adipose Tissue Expandability, Lipotoxicity and the Metabolic Syndrome—An Allostatic Perspective. Biochim. Biophys. Acta 2010, 1801, 338–349. [Google Scholar] [CrossRef]
  3. Rutkowski, J.M.; Stern, J.H.; Scherer, P.E. The Cell Biology of Fat Expansion. J. Cell Biol. 2015, 208, 501–512. [Google Scholar] [CrossRef] [PubMed]
  4. Cederquist, C.T.; Lentucci, C.; Martinez-Calejman, C.; Hayashi, V.; Orofino, J.; Guertin, D.; Fried, S.K.; Lee, M.J.; Cardamone, M.D.; Perissi, V. Systemic Insulin Sensitivity Is Regulated by GPS2 Inhibition of AKT Ubiquitination and Activation in Adipose Tissue. Mol. Metab. 2016, 6, 125–137. [Google Scholar] [CrossRef] [PubMed]
  5. Lee, E.; Jung, S.R.; Lee, S.Y.; Lee, N.K.; Paik, H.D.; Lim, S.I. Lactobacillus Plantarum Strain Ln4 Attenuates Diet-Induced Obesity, Insulin Resistance, and Changes in Hepatic MRNA Levels Associated with Glucose and Lipid Metabolism. Nutrients 2018, 10, 643. [Google Scholar] [CrossRef]
  6. Siebenhofer, A.; Winterholer, S.; Jeitler, K.; Horvath, K.; Berghold, A.; Krenn, C.; Semlitsch, T. Long-term Effects of Weight-reducing Drugs in People with Hypertension. Cochrane Database Syst. Rev. 2021, 2021, CD007654. [Google Scholar] [CrossRef]
  7. Cerdó, T.; García-Santos, J.A.; G Bermúdez, M.; Campoy, C. The Role of Probiotics and Prebiotics in the Prevention and Treatment of Obesity. Nutrients 2019, 11, 635. [Google Scholar] [CrossRef]
  8. Zsálig, D.; Berta, A.; Tóth, V.; Szabó, Z.; Simon, K.; Figler, M.; Pusztafalvi, H.; Polyák, É. A Review of the Relationship between Gut Microbiome and Obesity. Appl. Sci. 2023, 13, 610. [Google Scholar] [CrossRef]
  9. Geng, J.; Ni, Q.; Sun, W.; Li, L.; Feng, X. The Links between Gut Microbiota and Obesity and Obesity Related Diseases. Biomed. Pharmacother. 2022, 147, 112678. [Google Scholar] [CrossRef]
  10. Han, X.; Lee, A.; Huang, S.; Gao, J.; Spence, J.R.; Owyang, C. Lactobacillus Rhamnosus GG Prevents Epithelial Barrier Dysfunction Induced by Interferon-Gamma and Fecal Supernatants from Irritable Bowel Syndrome Patients in Human Intestinal Enteroids and Colonoids. Gut Microbes 2019, 10, 59–76. [Google Scholar] [CrossRef]
  11. Sanders, M.E.; Merenstein, D.J.; Reid, G.; Gibson, G.R.; Rastall, R.A. Probiotics and Prebiotics in Intestinal Health and Disease: From Biology to the Clinic. Nat. Rev. Gastroenterol. Hepatol. 2019, 16, 605–616. [Google Scholar] [CrossRef] [PubMed]
  12. Raheem, A.; Liang, L.; Zhang, G.; Cui, S. Modulatory Effects of Probiotics During Pathogenic Infections with Emphasis on Immune Regulation. Front. Immunol. 2021, 12, 616713. [Google Scholar] [CrossRef] [PubMed]
  13. Song, H.; Zhou, L.; Liu, D.; Ge, L.; Li, Y. Probiotic Effect on Helicobacter pylori Attachment and Inhibition of Inflammation in Human Gastric Epithelial Cells. Exp. Ther. Med. 2019, 18, 1551–1562. [Google Scholar] [CrossRef]
  14. Oh, N.; Lee, J.; Kim, H.; Kwon, M.; Seo, J.; Roh, S. Comparison of Cell-Free Extracts from Three Newly Identified Lactobacillus Plantarum Strains on the Inhibitory Effect of Adipogenic Differentiation and Insulin Resistance in 3T3-L1 Adipocytes. BioMed Res. Int. 2021, 2021, 6676502. [Google Scholar] [CrossRef] [PubMed]
  15. Lebeer, S.; Bron, P.A.; Marco, M.L.; Van Pijkeren, J.P.; O’Connell Motherway, M.; Hill, C.; Pot, B.; Roos, S.; Klaenhammer, T. Identification of Probiotic Effector Molecules: Present State and Future Perspectives. Curr. Opin. Biotechnol. 2018, 49, 217–223. [Google Scholar] [CrossRef] [PubMed]
  16. Huo, Y.; Zhao, G.; Li, J.; Wang, R.; Ren, F.; Li, Y.; Wang, X. Bifidobacterium Animalis Subsp. Lactis A6 Enhances Fatty Acid-Oxidation of Adipose Tissue to Ameliorate the Development of Obesity in Mice. Nutrients 2022, 14, 598. [Google Scholar] [CrossRef] [PubMed]
  17. Wang, M.; Zhang, B.; Hu, J.; Nie, S.; Xiong, T.; Xie, M. Intervention of Five Strains of Lactobacillus on Obesity in Mice Induced by High-Fat Diet. J. Funct. Foods 2020, 72, 104078. [Google Scholar] [CrossRef]
  18. Kim, H.; Lim, J.J.; Shin, H.Y.; Suh, H.J.; Choi, H.S. Lactobacillus Plantarum K8-Based Paraprobiotics Suppress Lipid Accumulation during Adipogenesis by the Regulation of JAK/STAT and AMPK Signaling Pathways. J. Funct. Foods 2021, 87, 104824. [Google Scholar] [CrossRef]
  19. Castañeda-Márquez, A.C.; Díaz-Benítez, C.E.; Bahena-Roman, M.; Campuzano-Benítez, G.E.; Galván-Portillo, M.; Campuzano-Rincón, J.C.; Lagunas-Martínez, A.; Bermudez-Morales, V.H.; Orbe-Orihuela, Y.C.; Peralta-Romero, J.; et al. Lactobacillus paracasei as a Protective Factor of Obesity Induced by an Unhealthy Diet in Children. Obes. Res. Clin. Pract. 2020, 14, 271–278. [Google Scholar] [CrossRef]
  20. Guha, D.; Mukherjee, R.; Aich, P. Effects of Two Potential Probiotic Lactobacillus Bacteria on Adipogenesis in Vitro. Life Sci. 2021, 278, 119538. [Google Scholar] [CrossRef]
  21. Han, K.J.; Lee, N.K.; Yu, H.S.; Park, H.; Paik, H.D. Anti-Adipogenic Effects of the Probiotic Lactiplantibacillus Plantarum KU15117 on 3T3-L1 Adipocytes. Probiotics Antimicrob. Proteins 2022, 14, 501–509. [Google Scholar] [CrossRef] [PubMed]
  22. Choi, W.J.; Dong, H.J.; Jeong, H.U.; Ryu, D.W.; Song, S.M.; Kim, Y.R.; Jung, H.H.; Kim, T.H.; Kim, Y.H. Lactobacillus Plantarum LMT1-48 Exerts Anti-Obesity Effect in High-Fat Diet-Induced Obese Mice by Regulating Expression of Lipogenic Genes. Sci. Rep. 2020, 10, 869. [Google Scholar] [CrossRef] [PubMed]
  23. Lee, C.S.; Park, M.H.; Kim, S.H. Selection and Characterization of Probiotic Bacteria Exhibiting Antiadipogenic Potential in 3T3-L1 Preadipocytes. Probiotics Antimicrob. Proteins 2022, 14, 72–86. [Google Scholar] [CrossRef]
  24. Wu, C.-S.; Lin, C.-C.; Hsieh, F.-C.; Wu, T.-Y.; Fang, A.-H. Antiobesity Effect of Lacticaseibacillus Paracasei LM-141 on High-Fat Diet-Induced Rats through Alleviation of Inflammation and Insulin Resistance. Evid. Based Complement. Alternat. Med. 2023, 2023, 1011591. [Google Scholar] [CrossRef] [PubMed]
  25. Lee, C.S.; Park, M.H.; Kim, B.K.; Kim, S.H. Antiobesity Effect of Novel Probiotic Strains in a Mouse Model of High-Fat Diet–Induced Obesity. Probiotics Antimicrob. Proteins 2021, 13, 1054–1067. [Google Scholar] [CrossRef] [PubMed]
  26. Miao, Z.; Zheng, H.; Liu, W.-H.; Cheng, R.; Lan, H.; Sun, T.; Zhao, W.; Li, J.; Shen, X.; Li, H.; et al. Lacticaseibacillus Paracasei K56 Attenuates High-Fat Diet-Induced Obesity by Modulating the Gut Microbiota in Mice. Probiotics Antimicrob. Proteins 2022. [CrossRef]
  27. Gu, Y.; Chen, H.; Li, X.; Li, D.; Sun, Y.; Yang, L.; Ma, Y.; Chan, E.C.Y. Lactobacillus Paracasei IMC 502 Ameliorates Type 2 Diabetes by Mediating Gut Microbiota– SCFA –Hormone/Inflammation Pathway in Mice. J. Sci. Food Agric. 2023, 103, 2949–2959. [Google Scholar] [CrossRef]
  28. Stefanovic, E.; McAuliffe, O. Comparative Genomic and Metabolic Analysis of Three Lactobacillus paracasei Cheese Isolates Reveals Considerable Genomic Differences in Strains from the Same Niche. BMC Genom. 2018, 19, 869. [Google Scholar] [CrossRef]
  29. Petrova, P.; Arsov, A.; Tsvetanova, F.; Parvanova-Mancheva, T.; Vasileva, E.; Tsigoriyna, L.; Petrov, K. The Complex Role of Lactic Acid Bacteria in Food Detoxification. Nutrients 2022, 14, 2038. [Google Scholar] [CrossRef]
  30. Krastanov, A.; Georgiev, M.; Slavchev, A.; Blazheva, D.; Goranov, B.; Ibrahim, S.A. Design and Volatile Compound Profiling of Starter Cultures for Yogurt Preparation. Foods 2023, 12, 379. [Google Scholar] [CrossRef]
  31. Ivanov, I.; Petrov, K.; Lozanov, V.; Hristov, I.; Wu, Z.; Liu, Z.; Petrova, P. Bioactive Compounds Produced by the Accompanying Microflora in Bulgarian Yoghurt. Processes 2021, 9, 114. [Google Scholar] [CrossRef]
  32. Dinev, T.; Rusenova, N.; Velichkova, K.; Beev, G. Antimicrobial Potential of Eleven Lacticaseibacillus Paracasei Strains Isolated from Mountain Anthills. Bulg. J. Agric. Sci. 2022, 28, 949–955. [Google Scholar]
  33. Vachkova, E.; Petrova, V.; Grigorova, N.; Ivanova, Z.; Beev, G. Evaluation of the Anticancer and Probiotic Potential of Autochthonous (Wild) Lacticaseibacillus paracasei Strains from New Ecological Niches as a Possible Additive for Functional Dairy Foods. Foods 2023, 12, 185. [Google Scholar] [CrossRef] [PubMed]
  34. Ayichew, T.; Belete, A.; Alebachew, T.; Tsehaye, H.; Berhanu, H.; Minwuyelet, A. Bacterial Probiotics Their Importances and Limitations: A Review. J. Nutr. Health Sci. 2017, 4, 1. [Google Scholar] [CrossRef]
  35. Lee, J.; Park, S.; Oh, N.; Park, J.; Kwon, M.; Seo, J.; Roh, S. Oral Intake of Lactobacillus Plantarum L-14 Extract Alleviates TLR2- and AMPK-Mediated Obesity-Associated Disorders in High-Fat-Diet-Induced Obese C57BL/6J Mice. Cell Prolif. 2021, 54, e13039. [Google Scholar] [CrossRef]
  36. Ruiz-Ojeda, F.J.; Rupérez, A.I.; Gomez-Llorente, C.; Gil, A.; Aguilera, C.M. Cell Models and Their Application for Studying Adipogenic Differentiation in Relation to Obesity: A Review. Int. J. Mol. Sci. 2016, 17, 1040. [Google Scholar] [CrossRef]
  37. Beev, G.; Michaylova, M.; Dinev, T.; Naydenova, N.; Tzanova, M.; Urshev, Z. ARDRA Analysis on Biodiversity of Lactobacilli Isolated from Bulgarian Raw Buffalo Milk. Acta Microbiol. Bulg. 2021, 37, 22–26. [Google Scholar]
  38. Roy, D.; Ward, P.; Vincent, D.; Mondou, F. Molecular Identification of Potentially Probiotic Lactobacilli. Curr. Microbiol. 2000, 40, 40–46. [Google Scholar] [CrossRef]
  39. Walter, J.; Tannock, G.W.; Tilsala-Timisjarvi, A.; Rodtong, S.; Loach, D.M.; Munro, K.; Alatossava, T. Detection and Identification of Gastrointestinal Lactobacillus Species by Using Denaturing Gradient Gel Electrophoresis and Species-Specific PCR Primers. Appl. Environ. Microbiol. 2000, 66, 297–303. [Google Scholar] [CrossRef]
  40. Ward, L.J.H.; Timmins, M.J. Differentiation of Lactobacillus casei, Lactobacillus paracasei and Lactobacillus rhamnosus by Polymerase Chain Reaction. Lett. Appl. Microbiol. 1999, 29, 90–92. [Google Scholar] [CrossRef]
  41. Melo, T.A.; Dos Santos, T.F.; De Almeida, M.E.; Junior, L.A.G.F.; Andrade, E.F.; Rezende, R.P.; Marques, L.M.; Romano, C.C. Inhibition of Staphylococcus aureus Biofilm by Lactobacillus Isolated from Fine Cocoa. BMC Microbiol. 2016, 16, 250. [Google Scholar] [CrossRef]
  42. De Marco, S.; Sichetti, M.; Muradyan, D.; Piccioni, M.; Traina, G.; Pagiotti, R.; Pietrella, D. Probiotic Cell-Free Supernatants Exhibited Anti-Inflammatory and Antioxidant Activity on Human Gut Epithelial Cells and Macrophages Stimulated with LPS. Evid. Based Complement. Alternat. Med. 2018, 105, 1349–1356. [Google Scholar] [CrossRef] [PubMed]
  43. Yang, Z.; Tu, Y.; Xia, H.; Jie, G.; Chen, X.; He, P. Suppression of Free-Radicals and Protection against H2O2-Induced Oxidative Damage in HPF-1 Cell by Oxidized Phenolic Compounds Present in Black Tea. Food Chem. 2007, 105, 1349–1356. [Google Scholar] [CrossRef]
  44. Park, Y.J.; Liang, J.F.; Ko, K.S.; Kim, S.W.; Yang, V.C. Low Molecular Weight Protamine as an Efficient and Nontoxic Gene Carrier: In Vitro Study. J. Gene Med. 2003, 5, 700–711. [Google Scholar] [CrossRef] [PubMed]
  45. Yang, M.T.; Fu, J.; Wang, Y.K.; Desai, R.A.; Chen, C.S. Assaying Stem Cell Mechanobiology on Microfabricated Elastomeric Substrates with Geometrically Modulated Rigidity. Nat. Protoc. 2011, 6, 187–213. [Google Scholar] [CrossRef] [PubMed]
  46. Diaz, P.A.; Gómez Camargo, D.E.; Ondo-Méndez, A.; Gómez-Alegría, C.J. A Colorimetric Bioassay for Quantitation of Both Basal and Insulin-Induced Glucose Consumption in 3T3-L1 Adipose Cells. Heliyon 2020, 6, e03422. [Google Scholar] [CrossRef]
  47. Vandesompele, J.; De Preter, K.; Pattyn, F.; Poppe, B.; Van Roy, N.; De Paepe, A.; Speleman, F. Accurate Normalization of Real-Time Quantitative RT-PCR Data by Geometric Averaging of Multiple Internal Control Genes. Genome Biol. 2002, 3, research0034.1. [Google Scholar] [CrossRef]
  48. Hellemans, J.; Mortier, G.; De Paepe, A.; Speleman, F.; Vandesompele, J. QBase Relative Quantification Framework and Software for Management and Automated Analysis of Real-Time Quantitative PCR Data. Genome Biol. 2007, 8, R19. [Google Scholar] [CrossRef]
  49. Zhai, W.; Xu, C.; Ling, Y.; Liu, S.; Deng, J.; Qi, Y.; Londos, C.; Xu, G. Increased Lipolysis in Adipose Tissues Is Associated with Elevation of Systemic Free Fatty Acids and Insulin Resistance in Perilipin Null Mice. Horm. Metab. Res. Horm. Stoffwechs. Horm. Metab. 2010, 42, 247–253. [Google Scholar] [CrossRef]
  50. Tumova, J.; Andel, M.; Trnka, J. Excess of Free Fatty Acids as a Cause of Metabolic Dysfunction in Skeletal Muscle. Physiol. Res. 2016, 65, 193–207. [Google Scholar] [CrossRef]
  51. Taghizad, F.; Kazerani, H.R.; Dehghani, H.; Asoodeh, A.; Yaghubi, D. A Novel Approach towards Obesity: The Use of a Bacterial Product, Gassericin A, in 3T3-L1 Cells. Obes. Res. Clin. Pract. 2021, 15, 499–505. [Google Scholar] [CrossRef] [PubMed]
  52. Huang, X.; Liu, G.; Guo, J.; Su, Z.Q. The PI3K/AKT Pathway in Obesity and Type 2 Diabetes. Int. J. Biol. Sci. 2018, 14, 1483. [Google Scholar] [CrossRef] [PubMed]
  53. Kahn, B.B.; Charron, M.J.; Lodish, H.F.; Cushman, S.W.; Flier, J.S. Differential Regulation of Two Glucose Transporters in Adipose Cells from Diabetic and Insulin-Treated Diabetic Rats. J. Clin. Investig. 1989, 84, 404–411. [Google Scholar] [CrossRef] [PubMed]
  54. Chadt, A.; Al-Hasani, H. Glucose Transporters in Adipose Tissue, Liver, and Skeletal Muscle in Metabolic Health and Disease. Pflüg. Arch.-Eur. J. Physiol. 2020, 472, 1273–1298. [Google Scholar] [CrossRef] [PubMed]
  55. Sun, C.; Mao, S.; Chen, S.; Zhang, W.; Liu, C. Ppars-Orchestrated Metabolic Homeostasis in the Adipose Tissue. Int. J. Mol. Sci. 2021, 22, 8974. [Google Scholar] [CrossRef] [PubMed]
  56. Imai, T.; Takakuwa, R.; Marchand, S.; Dentz, E.; Bornert, J.M.; Messaddeq, N.; Wendling, O.; Mark, M.; Desvergne, B.; Wahli, W.; et al. Peroxisome Proliferator-Activated Receptor Gamma Is Required in Mature White and Brown Adipocytes for Their Survival in the Mouse. Proc. Natl. Acad. Sci. USA 2004, 101, 4543–4547. [Google Scholar] [CrossRef]
  57. Barilla, S.; Liang, N.; Mileti, E.; Ballaire, R.; Lhomme, M.; Ponnaiah, M.; Lemoine, S.; Soprani, A.; Gautier, J.F.; Amri, E.Z.; et al. Loss of G Protein Pathway Suppressor 2 in Human Adipocytes Triggers Lipid Remodeling by Upregulating ATP Binding Cassette Subfamily G Member. Mol. Metab. 2020, 42, 101066. [Google Scholar] [CrossRef]
  58. Phua, W.W.T.; Wong, M.X.Y.; Liao, Z.; Tan, N.S. An APPARent Functional Consequence in Skeletal Muscle Physiology via Peroxisome Proliferator-Activated Receptors. Int. J. Mol. Sci. 2018, 19, 1425. [Google Scholar] [CrossRef]
  59. Bond, S.T.; Moody, S.C.; Liu, Y.; Civelek, M.; Villanueva, C.J.; Gregorevic, P.; Kingwell, B.A.; Hevener, A.L.; Lusis, A.J.; Henstridge, D.C.; et al. The E3 Ligase MARCH5 Is a PPARγ Target Gene That Regulates Mitochondria and Metabolism in Adipocytes. Am. J. Physiol. Endocrinol. Metab. 2019, 316, E293–E304. [Google Scholar] [CrossRef]
  60. Drareni, K.; Ballaire, R.; Barilla, S.; Mathew, M.J.; Toubal, A.; Fan, R.; Liang, N.; Chollet, C.; Huang, Z.; Kondili, M.; et al. GPS2 Deficiency Triggers Maladaptive White Adipose Tissue Expansion in Obesity via HIF1A Activation. Cell Rep. 2018, 24, 2957–2971.e6. [Google Scholar] [CrossRef]
  61. English, J.; Orofino, J.; Cederquist, C.T.; Paul, I.; Li, H.; Auwerx, J.; Emili, A.; Belkina, A.; Cardamone, D.; Perissi, V. GPS2-Mediated Regulation of the Adipocyte Secretome Modulates Adipose Tissue Remodeling at the Onset of Diet-Induced Obesity. Mol. Metab. 2023, 69, 101682. [Google Scholar] [CrossRef] [PubMed]
  62. Serena, B. Role of GPS2 in the Regulation of Adipocyte Fate and Function: A Multi-Omics Approach; Karolinska Institutet: Solna, Sweden, 2020; ISBN 978-91-7831-960-2. [Google Scholar]
  63. Jackson, R.M.; Griesel, B.A.; Gurley, J.M.; Szweda, L.I.; Olson, A.L. Glucose Availability Controls Adipogenesis in Mouse 3T3-L1 Adipocytes via Up-Regulation of Nicotinamide Metabolism. J. Biol. Chem. 2017, 292, 18556–18564. [Google Scholar] [CrossRef] [PubMed]
  64. Toubal, A.; Clément, K.; Fan, R.; Ancel, P.; Pelloux, V.; Rouault, C.; Veyrie, N.; Hartemann, A.; Treuter, E.; Venteclef, N. SMRT-GPS2 Corepressor Pathway Dysregulation Coincides with Obesity-Linked Adipocyte Inflammation. J. Clin. Investig. 2012, 123, 362–379. [Google Scholar] [CrossRef]
  65. Cheng, H.S.; Yip, Y.S.; Lim, E.K.Y.; Wahli, W.; Tan, N.S. PPARs and Tumor Microenvironment: The Emerging Roles of the Metabolic Master Regulators in Tumor Stromal–Epithelial Crosstalk and Carcinogenesis. Cancers 2021, 13, 2153. [Google Scholar] [CrossRef] [PubMed]
  66. Hartley, A.; Ahmad, I. The Role of PPARγ in Prostate Cancer Development and Progression. Br. J. Cancer 2023, 128, 940–945. [Google Scholar] [CrossRef]
  67. Eghtedari, A.R.; Vaezi, M.A.; Safizadeh, B.; Ghasempour, G.; Babaheidarian, P.; Salimi, V.; Tavakoli-Yaraki, M. Evaluation of the Expression Pattern and Diagnostic Value of PPARγ in Malignant and Benign Primary Bone Tumors. BMC Musculoskelet. Disord. 2022, 23, 746. [Google Scholar] [CrossRef]
  68. Szablewski, L. Glucose Transporters as Markers of Diagnosis and Prognosis in Cancer Diseases. Oncol. Rev. 2022, 16, 561. [Google Scholar] [CrossRef]
Figure 1. Cell viability in fully differentiated 3T3-L1 adipocytes, treated with 10% cell-free supernatants (CFSs) from Lacticaseibacillus paracasei strains. (a) Native images of the intensity of cells after 48 h of CFS treatment (magnification 4×; bars = 500 µm); (b) Relative cell viability evaluated via MTT assay. Abbreviations: NC—negative, non-induced control; MRS_C—induced control, treated with MRS; M2.1, C8, C15, P4—experimental groups, induced and treated with supernatants of the respective strains for 24 or 48 h. Data (mean ± SEM) are expressed relatively as percentages of the respective MRS_C. The symbol “#” and the asterisk indicate the significant differences between MRS_C and all other groups at 24 or 48 h of treatment, respectively: #, *—p < 0.05; ##, **—p < 0.01.
Applsci 13 06489 g001
Figure 2. Neutral lipid accumulation in fully differentiated 3T3-L1 adipocytes, treated with 10% cell-free supernatants from Lacticaseibacillus paracasei strains. (a) Oil Red-O-stained images (magnification 20×; bars = 100 µm); (b) Quantification of ORO-stained lipid accumulation by spectrophotometric measurement of the isopropanol extracts. Abbreviations: NC—negative, non-induced control; MRS_C—induced control, treated with MRS; M2.1, C8, C15, P4—experimental groups, induced and treated with supernatants of the respective strains for 24 or 48 h. Data (mean ± SEM) are expressed relatively as percentages of the respective MRS_C after excluding the spontaneous adipogenesis found in NC. The symbol “#” and the asterisk indicate the significant differences between MRS_C and all other groups at 24 or 48 h of treatment, respectively: *—p < 0.05; ##, **—p < 0.01.
Applsci 13 06489 g002
Figure 3. Glucose consumption by fully differentiated 3T3-L1 adipocytes, treated with 10% cell-free supernatants from Lacticaseibacillus paracasei strains. Abbreviations: NC—negative, non-induced control; MRS_C—induced control, treated with MRS; M2.1, C8, C15, P4—experimental groups, induced and treated with supernatants of the respective strains once for 24 h or twice for 48 h. Data (mean ± SEM) are expressed relatively as percentages of the respective MRS_C after excluding the basal glucose consumption found in the non-induced (negative) control group. The symbol “#” and the asterisk indicate the significant differences between MRS_C and all other groups at 24 or 48 h of treatment, respectively: ##, **—p < 0.01.
Applsci 13 06489 g003
Figure 4. Lipolysis rate in fully differentiated 3T3-L1 adipocytes, treated with 10% cell-free supernatants from Lacticaseibacillus paracasei strains. Abbreviations: NC—negative, non-induced control; MRS_C—induced control, treated with MRS; M2.1, C8, C15, P4—experimental groups, induced and treated with supernatants of the respective strains for 48 h. Data (mean ± SEM) are expressed relatively as percentages of MRS_C after the basal lipolysis rate was excluded from the non-induced (negative) control group. The asterisk indicates the significant differences between MRS_C and all other groups, as **—p < 0.01.
Applsci 13 06489 g004
Figure 5. Relative mRNA expression of markers involved in adipogenesis and glucose metabolism in fully differentiated 3T3-L1 adipocytes, treated with 10% cell-free supernatants from Lacticaseibacillus paracasei strains. (a) Peroxisome proliferator-activated receptor gamma (PPARγ); (b) G-protein pathway suppressor 2 (Gps2); (c) insulin receptor substrate 1 (IRS-1); (d) phosphoinositide 3-kinase (PI3K); (e) solute carrier family 2, member 1 (Slc2a1); (f) solute carrier family 2, member 4 (Slc2a4). Abbreviations: MRS_C—induced control, treated with MRS; M2.1, C8, C15, P4—experimental groups, induced and treated with supernatants of the respective strains for 48 h. Data (mean ± SEM) were relatively estimated by applying the modified 2–∆∆Ct approach with GeoMean value of the reference genes (ribosomal protein, large, P0, and beta-actin) and are expressed relatively to MRS_C. The asterisk indicates the significant differences between MRS_C and all other groups, as *—p < 0.05; **—p < 0.01.
Applsci 13 06489 g005
Table 1. Primer sequences used for Real-Time PCR (q-PCR) analysis.
AbbreviationFull NameForward PrimerReverse PrimerProduct Size (bp)
PPARγ NM_001127330.2Peroxisome proliferator-activated receptor gamma, transcript variant 2 AGGGCGATCTTGACAGGAAACGAAACTGGCACCCTTGAAA164
Gps2 NM_001357906.2G protein pathway suppressor 2ACAAGTGCTTACGACCCGGGGAAATGCTGATGGGGCTCT183
Slc2a1 NM_011400.3Solute carrier family 2 (facilitated glucose transporter), member 1GGAATCGTCGTTGGCATCCTTCTTCAGCACACTCTTGGCC202
IRS-1 NM_010570.4Insulin receptor substrate 1TTAGGCAGCAATGAGGGCAACGTGAGGTCCTGGTTGTGAA212
PI3K NM_001077495.2Phosphoinositide-3-kinase regulatory subunit 1ATACTTGATGTGGCTGACGCGTCTCGCTTCCCTCGCAATA193
Slc2a4 NM_009204.2Solute carrier family 2 (facilitated glucose transporter), member 4CGTTGGTCTCGGTGCTCTTAAGCTCTGCCACAATGAACCA220
36b4 NM_007475.5Ribosomal protein, large, P0TTATAACCCTGAAGTGCTCGACCGCTTGTACCCATTGATGATG147
Actb NM_007393.5β-actinCCTCTATGCCAACACAGTGCGTACTCCTGCTTGCTGATCC211
Disclaimer/Publisher’s Note: The statements, opinions and data contained in all publications are solely those of the individual author(s) and contributor(s) and not of MDPI and/or the editor(s). MDPI and/or the editor(s) disclaim responsibility for any injury to people or property resulting from any ideas, methods, instructions or products referred to in the content.

