Article

Glass Fillers in Three Different Forms Used as Reinforcement Agents of Polylactic Acid in Material Extrusion Additive Manufacturing

1
Department of Mechanical Engineering, Hellenic Mediterranean University, 71410 Heraklion, Greece
2
Department of Industrial Design and Production Engineering, University of West Attica, 12243 Athens, Greece
*
Author to whom correspondence should be addressed.
Appl. Sci. 2023, 13(11), 6471; https://doi.org/10.3390/app13116471
Submission received: 10 May 2023 / Revised: 20 May 2023 / Accepted: 24 May 2023 / Published: 25 May 2023

Abstract

:
The industrial demand for functional filaments made of bio-sourced, biocompatible, biodegradable, and/or recyclable polymers and composites for material extrusion (MEX) 3D printing is continuously growing. Polylactic acid (PLA), the most popular filament, combines such properties, yet its reinforcement with low-cost, inert, and/or recycled fillers remains challenging. Herein, glass in three different micro/nano-forms was the reinforcement agent in PLA. Three different experimental tiers were elaborated by producing composite filaments with glass in powder, beads, and flake forms in various loadings to optimize the concentrations. A thermomechanical process, i.e., melt filament extrusion, was exploited. The composites were evaluated for their thermal degradation stability and composition using thermogravimetric analysis and Raman. MEX 3D printing was used to produce tensile, flexural, impact, and microhardness specimens, to quantitatively evaluate their mechanical response. Field emission scanning electron microscopy evaluation and fractography were carried out to depict fracture patterns of the specimens after their tests. All three glass types induced impressive reinforcement effects (up to 60% in flexural loading), especially in the flake form. The impact of the additional process cost through glass fillers implementation was also assessed, indicating that such composites are cost-effective.

1. Introduction

Polymer components are frequently manufactured using additive manufacturing (AM), from prototypes to finished products [1]. To produce polymeric parts, a number of additive manufacturing (AM) methods have been developed, including vat photopolymerization (VPP), which uses photopolymer liquids [2], powder bed fusion (PBF) which uses polymer powders [3], and material extrusion (MEX) which uses polymer filaments [4]. MEX is a preferred process for additive manufacturing (AM) of polymer components, and it is renowned for its affordability, material effectiveness, and user-friendliness [5,6,7]. Due to their low cost and relatively low melting temperatures, thermoplastics are currently the most widely used feedstock materials for fused filament fabrication (FFF) or MEX [8]. Polycarbonate (PC) [9], polylactic acid (PLA) [10,11], acrylonitrile butadiene styrene (ABS) [12,13], and polyamide (PA or nylon) [14] are a few examples of thermoplastics that are frequently utilized as feedstock materials for fused filament fabrication (FFF).
It is crucial to note that the FFF 3D printing technique has certain significant drawbacks, such as the rough surface of the produced parts and their porosity [15]. By adding reinforcing fibers or particles, attempts have been undertaken to remedy the inferior mechanical response of the 3D-printed products compared to the respective injection-molded ones [16]. Fiber-reinforced polymers (FRP) are materials that were developed by the polymer industry to increase the structural durability of traditional composites [17]. Fiber-reinforced composites prepared, utilizing additive manufacturing (AM), have been found to have problems with porosity or air bubbles. The fiber–matrix bond is weaker when there is porosity, which reduces the composite’s overall strength [18,19,20]. Research has suggested several approaches to address this issue, such as employing expanding microspheres as fillers [19] or flake or particle reinforcement rather than chopped fiber reinforcement [20]. These techniques have demonstrated success in lowering the porosity levels to under 10% [16].
Numerous studies have been published regarding the creation of composites reinforced with fibers. For example, Zhong et al. [21] added chopped glass fibers to ABS polymers using MEX 3D printing technology to increase the tensile strength of the finished product. According to the research, the bridging effect produced by the fibers crossing between layers led to an increase in interlayer bonding strength as the number of fibers grew [16,21]. It was also discovered that adding glass fibers to an ABS filament considerably increased its strength, albeit at the expense of decreased flexibility and handling properties [21]. In another investigation, carbon, Kevlar, and glass fiber nylon composites were created, and the mechanical characteristics of each type of composite were examined. The study concluded that this technology has significant potential for further development, which may result in the creation of composite materials that are currently unattainable [16].
Glass is one of the first and best-known high-performance fibers [22]. Since the 1930s, it has been utilized to produce fiber [23]. In general, fiberglass is a generic term used to describe plastics reinforced with glass fibers. Depending on the intended use, several varieties of glass can be used to create glass fibers [24]. Particularly, in comparison to other fibers, fiberglass is a material that is lightweight, sturdy, and less brittle. Its main benefit is that it can be shaped into complex designs, which is why it is frequently used in products, such as bathtubs, boats, airplanes, roofing, and many other things [25]. Glass fiber-reinforced concrete (GFRC) has been a major contributor to the economics, technology, and aesthetic of the global building industry for more than 40 years now [25,26].
In this study, glass was used as a reinforcement agent in a PLA matrix in three different forms: beads, flakes, and powder. Glass flakes are a high aspect-ratio reinforcing additive with several industrial uses, such as in fire protection [27] and in denture applications [28]. It is made of modified ‘C’ glass and is available in three thickness ranges: 3.5–5.5, 1.9–2.5, and 1.4–1.9 μm [28]. Glass flakes are also available in three different particle size distributions: unmilled, milled, and micronized. Producers of glass flakes assert that adding glass flakes to specific thermoplastics has significantly enhanced planar reinforcement and flexural modulus [28]. The addition of glass beads also significantly improved the stiffness and strength of the materials in fiber-reinforced laminated polymer bulk composites. The glass beads’ rigidity, which made it easier for the load to be transferred from the matrix to the fiber reinforcements with efficiency, was credited for this improvement [28]. The glass beads’ spherical form and micro-scale diameter make them effective in preventing crack progression [29,30,31,32]. Last but not least, after being crushed and ground with a breaker, glass powder can be turned into granules by passing it through sieves [28]. This granulated glass powder is used for a variety of tasks, including path lines, synthetic resin reinforcement, and surface treatment through blasting [28]. Along with enhancing the mechanical properties of the polymers, adding glass powder as reinforcing filler during the polymer processing also lowers the cost of production [33].
This study’s main objective was to introduce glass fillers into a polylactic acid (PLA) matrix material in three different forms: beads, flakes, and powder. PLA is a thermoplastic polyester that may be composted and degraded after use. It is made from renewable resources, such as corn starch, cassava roots, or sugarcane [34]. Due to its biocompatibility and bio-absorbability, polylactic acid has been employed in several biomedical applications, including rapid drug delivery [35,36]. It is frequently used in the production of food packaging [37], textiles, and medical implants [38]. Although biodegradable plastics, such as PLA, are better for the environment than conventional plastics made of fossil fuels, they do not have the same thermal, mechanical, or rheological characteristics [36]. Due to their limited compatibility with other materials and the current recycling methods, biodegradable plastics frequently need to be blended with additives or co-polymerized in order to get the necessary properties [39]. As expected, PLA is widely used in AM as it is the most popular polymer for MEX 3D printing [40]. Its performance and how it is affected by the 3D printing parameters have been thoroughly investigated [41,42,43,44], along with its quality characteristics [45] and its sustainability in the process [46]. Aiming to expand its performance in MEX 3D printing, nanocomposites have been developed [47,48,49,50,51]. Further exploiting its biocompatibility, composites for medical and culinary applications with antibacterial performance have also been investigated [52,53,54,55]. Finally, it has been investigated in pure form and a matrix in composites, in hybrid AM (HAM) for expanding the fields of application of MEX 3D printing [56,57,58]. For glass-based composites featuring PLA as the matrix material, a novel method for 3D printing composites of continuous glass fibers (CGF)/PLA was proposed [59]. The results showed that with a fiber content of up to 45 wt.%, the flexural strength and modulus of CGF/PLA composites created through 3D printing were 313 MPa and 21.5 MPa, respectively. The composites’ excellent impregnation and a large fraction of glass fibers gave them mechanical properties that were on par with those of composites reinforced with carbon fibers [59].
This research was focused on developing innovative composites for MEX 3D printing by combining PLA with glass flakes, beads, or powder with loadings ranging from 0 wt.% to 9 wt.%, which according to the authors’ best knowledge, has never been presented in the literature so far. The aim was to develop composites with biocompatible and eco-friendly ingredients sourced from natural resources, with improved mechanical performance for the MEX 3D printing process. As mentioned above, the PLA matrix material is a biocompatible polymer, sourced from natural resources, the same as the glass-based additives investigated herein [60]. The objective was to achieve a proper degree of filler distribution and dispersion, to investigate how the concentration of glass affected the new composites’ ability to respond mechanically, and to obtain knowledge about the material’s microstructure and mechanism. Raman and energy dispersive spectroscopy (EDS) were used to determine the compounds’ chemical and elemental composition. Thermogravimetric analysis (TGA) was used to assess the produced compounds’ thermal stability. Additionally, a thorough analysis was conducted on the impact of glass particles on the mechanical behavior of both the manufactured filaments and the 3D-printed samples. Scanning electron microscopy (SEM) was used to examine the morphological characteristics of all the 3D-printed samples and assess the MEX printing method. AFM was used to analyze the surface topography of the produced filaments. All the mechanical tests were performed according to ASTM guidelines. The results indicate that the PLA composites prepared herein are highly efficient for MEX 3D printing. Given the high demand for materials with improved mechanical properties in MEX 3D printing [61], these results expand the range of applications for this technique.

2. Materials and Methods
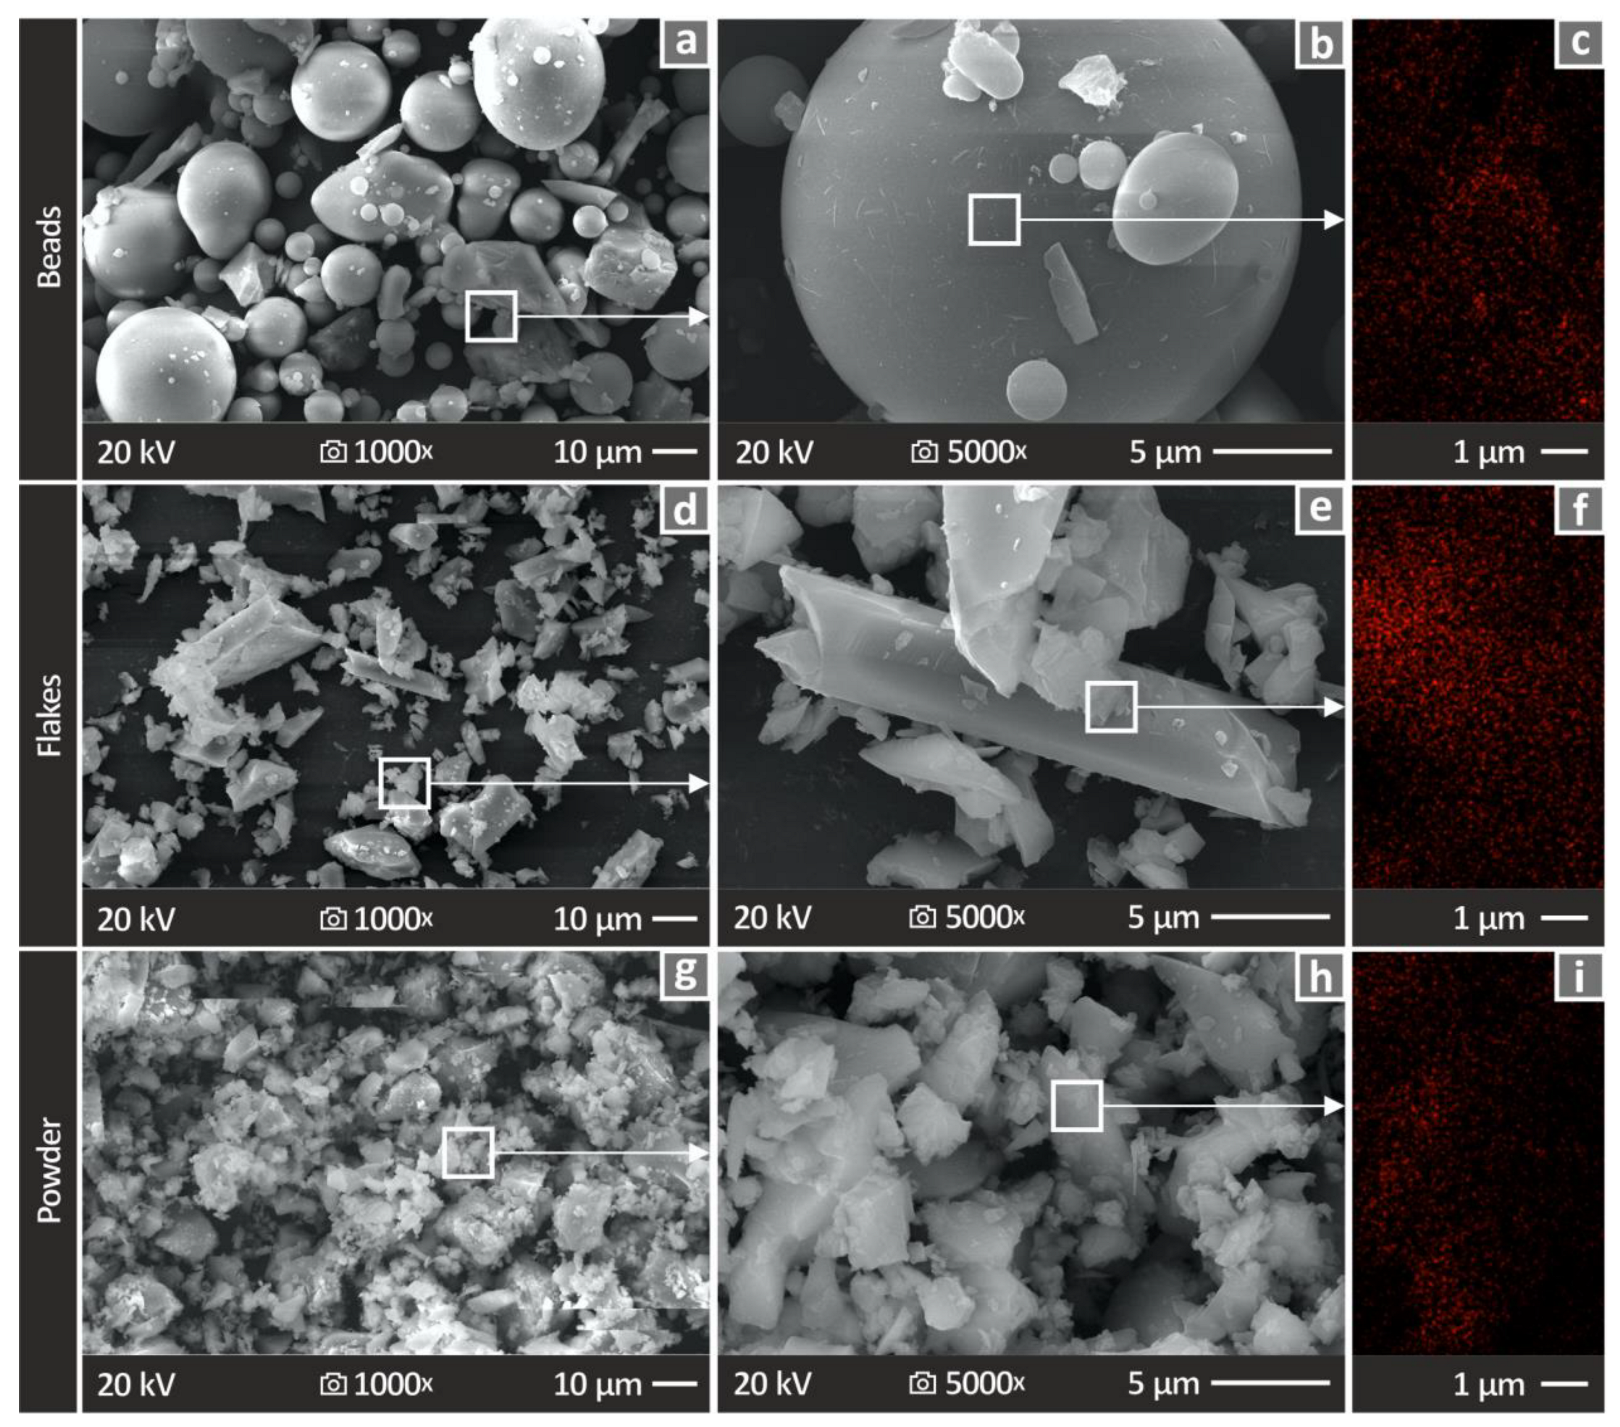
The experimental procedure used to produce the test specimens and the following analysis of their thermal, mechanical, and morphological properties is outlined in Figure 1. Figure 1a,b in particular, show visual depictions of the raw materials undergoing the drying process, which occurred for 24 h at a temperature of 60 °C. Extrusion of the filament is depicted in Figure 1c,d, and its quality and tensile strength are then assessed, as seen in Figure 1e,f. Figure 1g,h show how the specimens were created using 3D printing, while Figure 1i,j show how their mechanical quality was evaluated. Finally, Figure 1k–m highlight the fractography and microstructure analysis using SEM images.

2.1. Materials

The polylactic acid (PLA) polymer in the 3052D grade was delivered as a coarse powder by Plastika Kritis S.A. (Heraklion, Crete, Greece). The samples were prepared using this particular PLA polymer as the matrix material. The glass additives in the form of beads, flakes, and powder were procured from Kremer Pigmente (Kremer Pigmente GmbH & Co. KG, Aichstetten, Germany). According to the manufacturer’s specifications, the glass beads have a powdered texture and were white. Their diameter ranges from 0 to 50 μm, and they are smooth and round with no pores. The glass beads’ specific gravity is 2.5 g/cm3, and their bulk density is between 1.51 and 1.52 g/cm3. The glass beads’ refractive index is 1.51. Glass platelets with a thickness of around 5 μm were used in this study as glass flakes. These glass flakes, which are composed of borosilicate C glass and have good chemical resistance, can be used as a protective layer in acrylic paints, epoxy, vinyl ester paints, and coatings to protect surfaces from corrosive chemical and moisture attack, according to the manufacturer. The melting point of these glass flakes is 700 °C, and their density is 2.52 g/cm3. These flakes have a nominal particle size of 160 μm and a bulk density of 0.40 g/cm3. Finally, the glass powder is colorless and has particles that are typically 20 μm in size. Its refractive index is determined to be 1.47 and its density is 2.25 g/cm3. The glass powder has an oil absorption capacity of 32 mL per 100 g and a conductivity of 134 S/cm.
Before manufacturing the composites, the chemical and shape characteristics of the glass beads, flakes, and powder were examined using scanning electron microscopy (SEM) by employing a field emission SEM JSM-IT700HR apparatus developed by Jeol Ltd. in Tokyo, Japan. At two magnifications, 1000× and 5000×, SEM images of the glass beads, flakes, and powder were captured. The glass beads are depicted in Figure 2a,b, the glass flakes are shown in Figure 2d,e, and the glass powder is shown in Figure 2g,h. Through the inspection of the three different glass fillers using SEM, their shape and their size were verified. The glass particles’ EDS mappings results are shown in Figure 2c,f,i. The mappings show that the distribution of particles is mostly uniform, with only a few voids or places showing a different concentration, especially in the case of the glass flakes in Figure 2f. In the SEM images in Figure 2, the shape of the flakes and the powder is quite similar. Still, powder particles seem to be shorter in length, while flakes have a higher length-to-width ratio. These observations refer to the specific grades tested in the study. These particles come in different grades, with some of them being finer than others and each grade is made for specific types of applications. Herein, fine grades were used, as they were considered commonly used particles with good value for their cost. Other grades came with higher prices with differences being from marginal to huge ones. Additionally, these different shape additives are made for different types of applications. Flakes are mainly made for use in coatings, while powder is suitable for acrylics, ceramics, cement, frescos, silicate binder, water glass, tempera, etc.

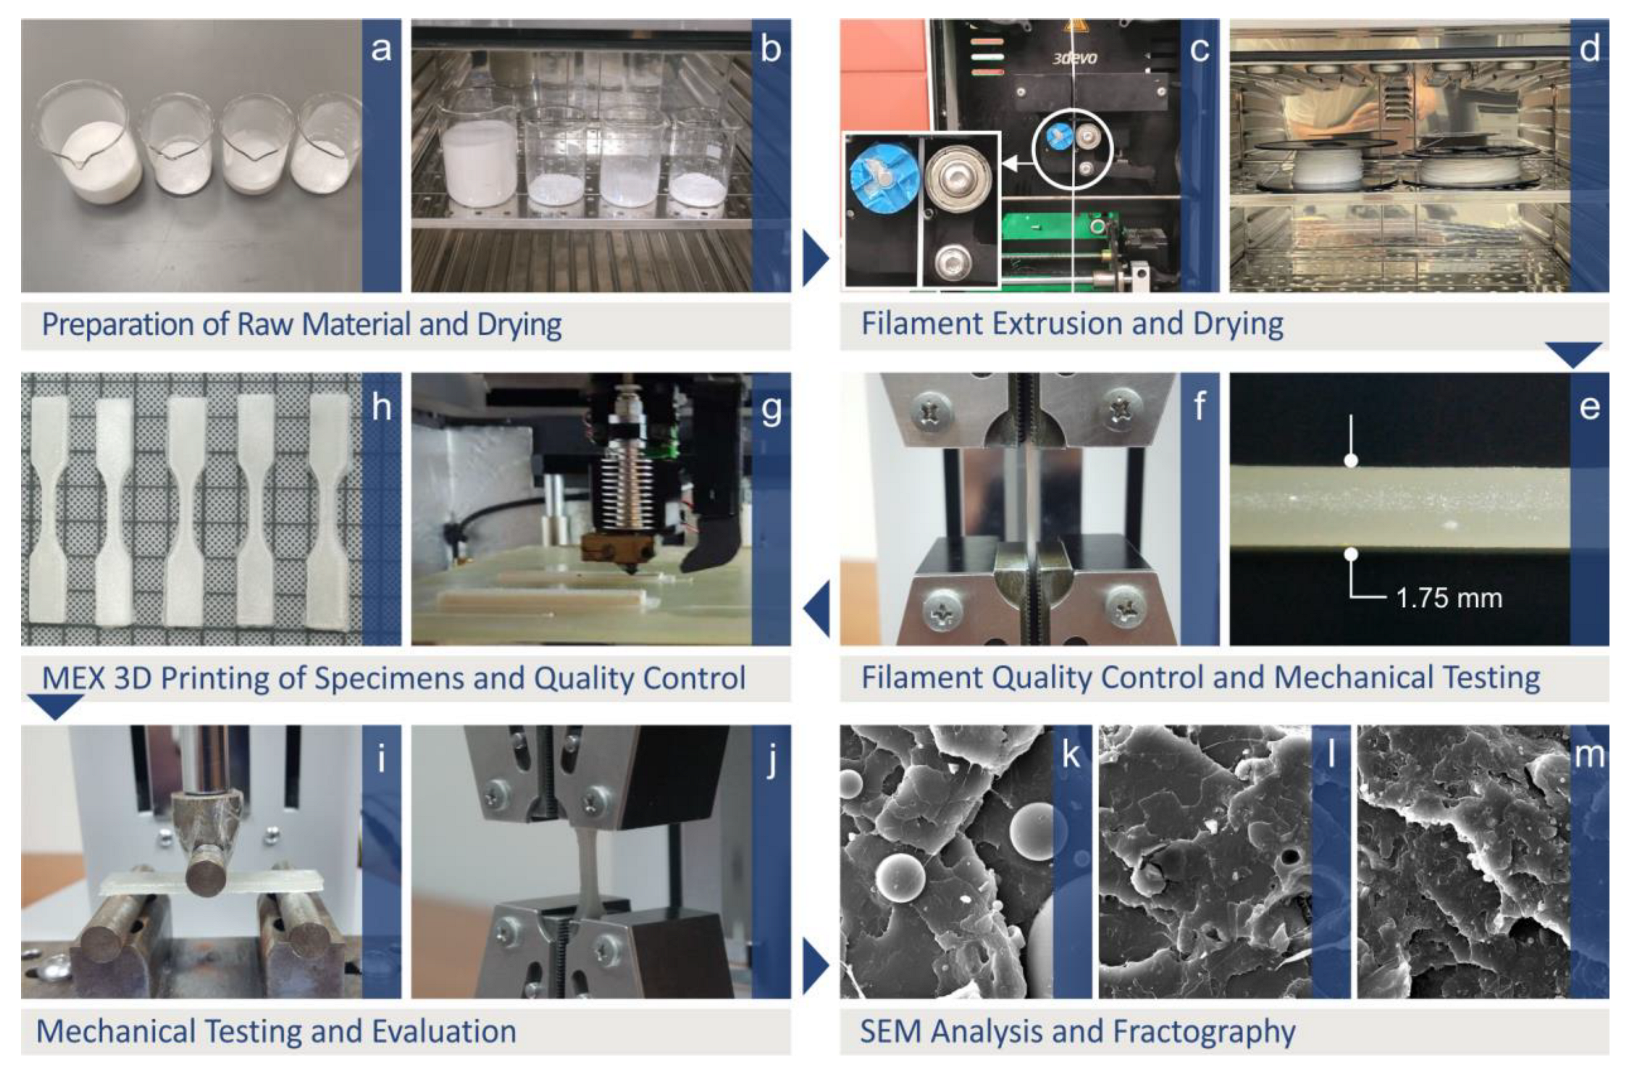
2.2. Composites Preparation

For each type of glass filler, three distinct material mixtures with weight concentrations of 3.0%, 6.0%, and 9.0% were developed. This indicates that a portion of the weight of the composite material was made up of glass particles, and the remaining portion of the weight was that of PLA polymer. Glass particles were initially dispersed in the PLA polymer for 30 min at ambient temperature (23 °C) at 4000 rpm using a high-wattage blender. The mixtures underwent an additional drying step after the blending stage. For an initial dispersion of the glass particles in the PLA matrix, the blends were introduced to a Noztek extruder (Noztek, Shoreham-by-Sea, UK), and the filament of each composite was derived. The filaments were subsequently processed through a 3devo shredder (3devo B.V., Utrecht, The Netherlands) to create pellets. The final filaments appropriate for 3D MEX printing were produced by processing the pellets through a 3devo Composer (3devo B.V., Utrecht, The Netherlands) single-screw extruder. The screw configuration on this extruder was specifically designed to be efficient for melting and combining ingredients, in this case, the PLA polymer with one of the three different types of glass particles in each compound. The filaments were produced with a nominal diameter of 1.75 mm. All PLA/glass compounds, including beads, flakes, and powder, are subjected to the same extruding temperature conditions. These conditions were determined based on preliminary tests and in accordance with the literature [41]. In this case, the first and fourth heating zones are set to a uniform temperature of 170 °C, while the second and third zones are set to a uniform temperature of 190 °C. During filament extrusion, the fan speed was adjusted to 55% and the screw rotation speed was set to 5 rpm. The two extrusion processes previously presented were intended to ensure that the glass particles were sufficiently dispersed throughout the polymer matrix.

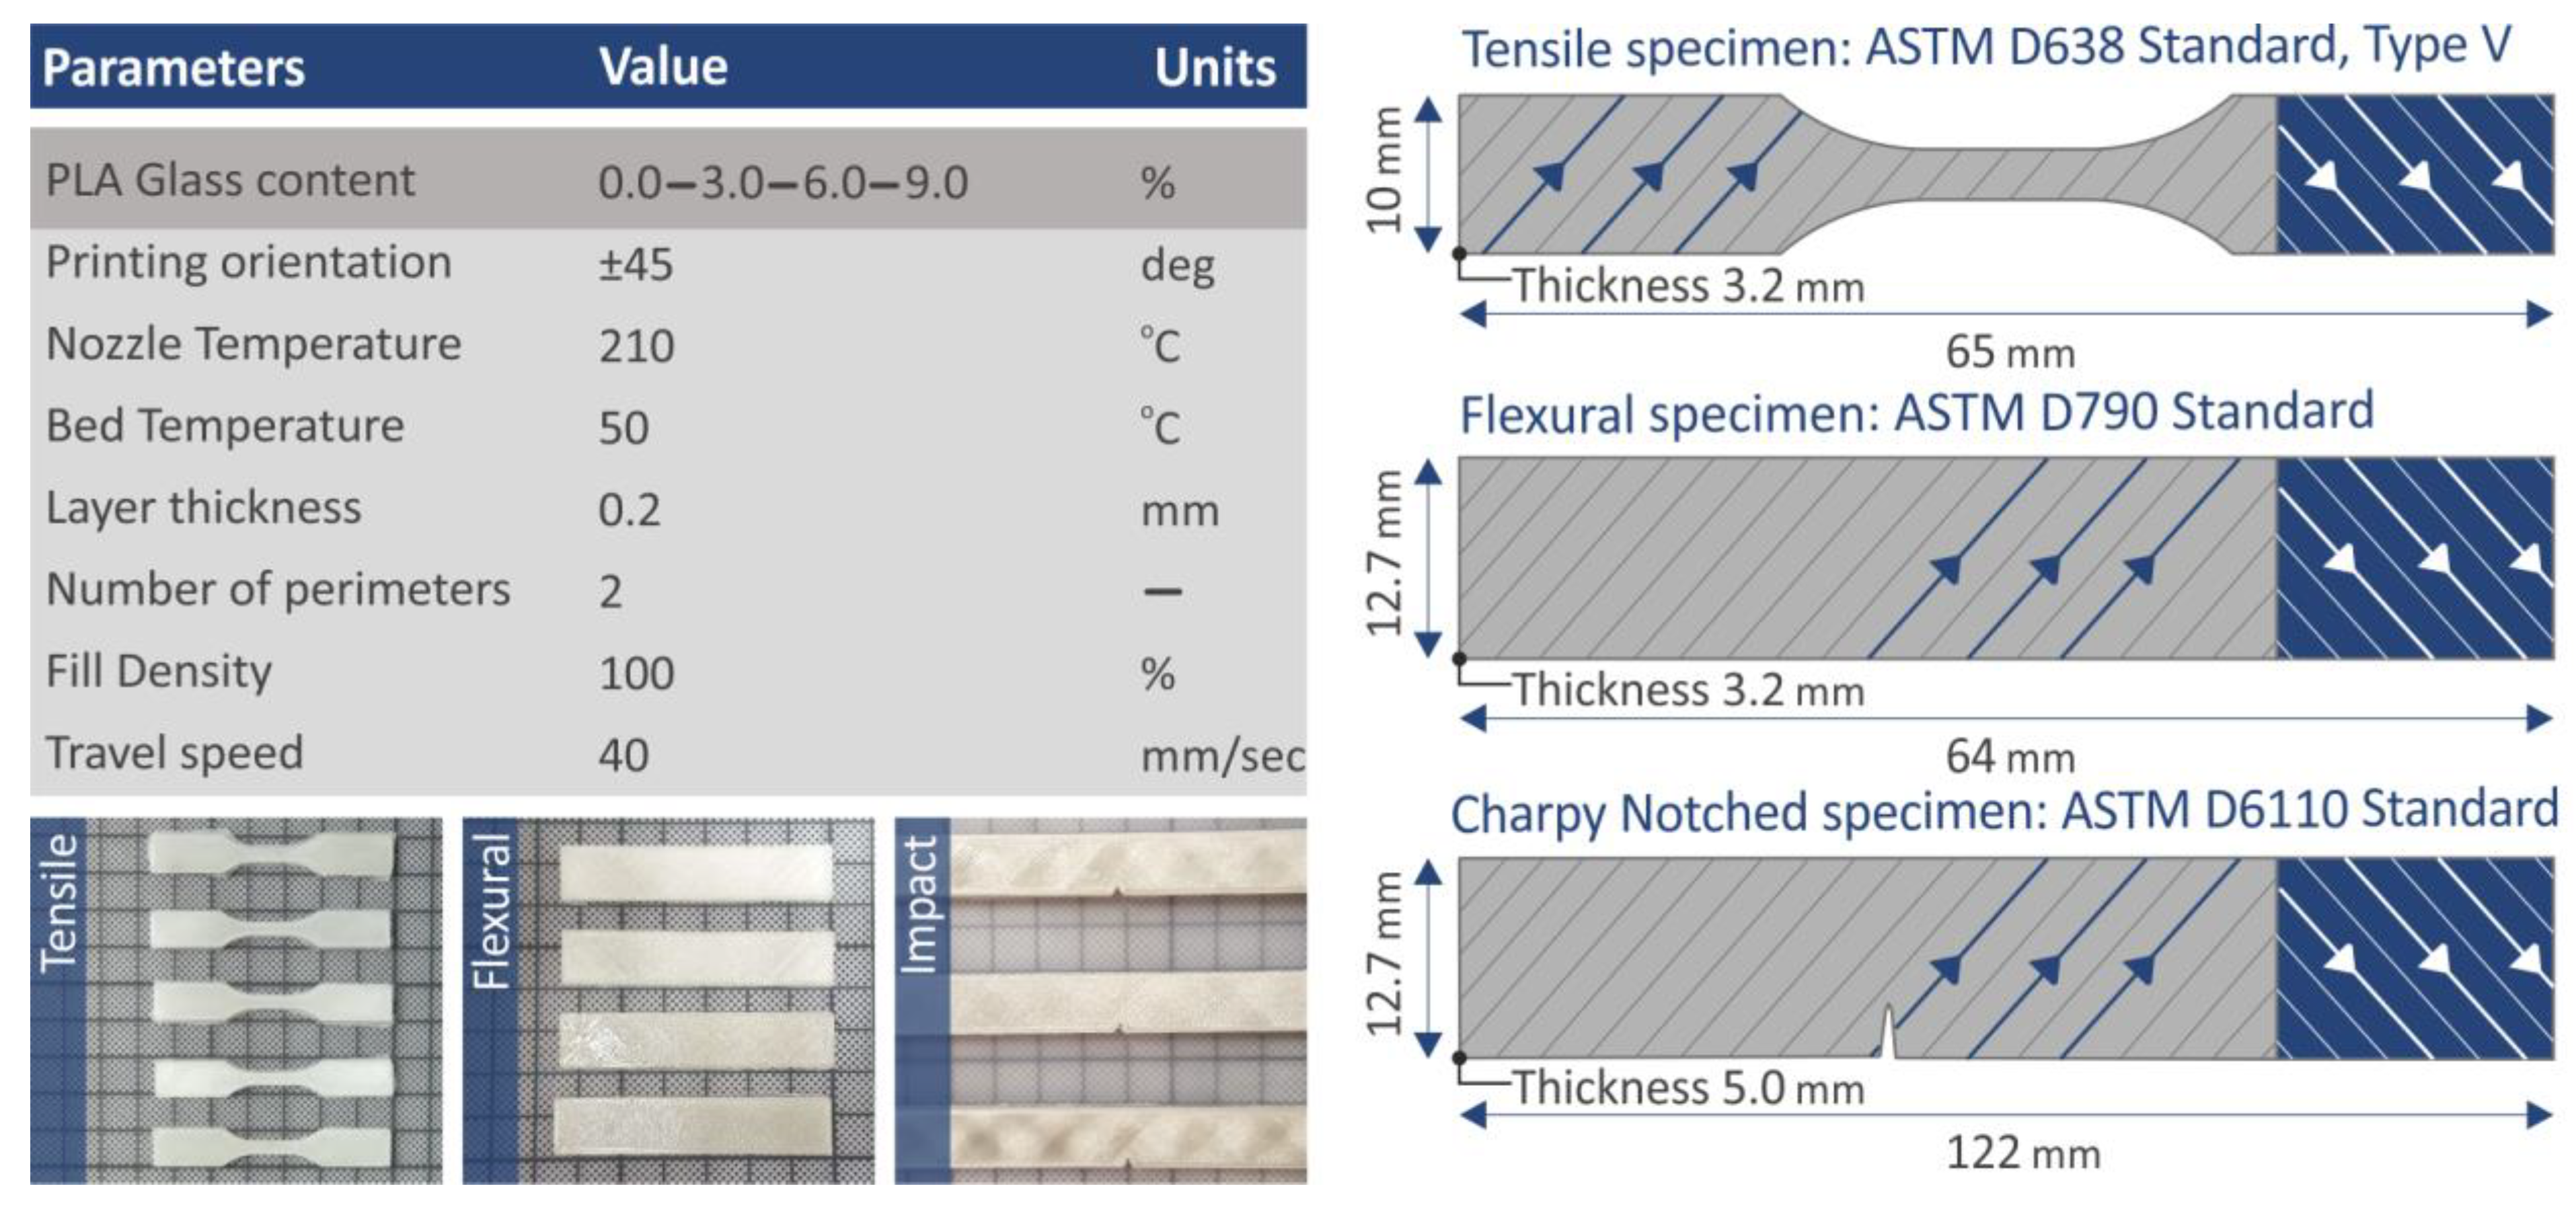
2.3. Production of the 3D-Printed Samples

The filaments produced by the two extrusion steps included the pure PLA polymer, which was utilized as a reference material to evaluate the mechanical properties of the composites, as well as PLA/glass beads, PLA/glass flakes, and PLA/glass powder composites. The filaments produced were used to fabricate specimens on the Intamsys Funmat HT 3D printer (Shanghai, China). Prior to 3D printing, the 3D printer settings were determined through trials using the Intamsuite software platform (Intamsys, Shanghai, China). For each experiment, the specimens were created following the dimensional specifications listed in the respective ASTM standards. Figure 3 provides a summary of the 3D printing parameters used in the study, the geometry, the 3D printing structure, and the corresponding standard used in each mechanical test.

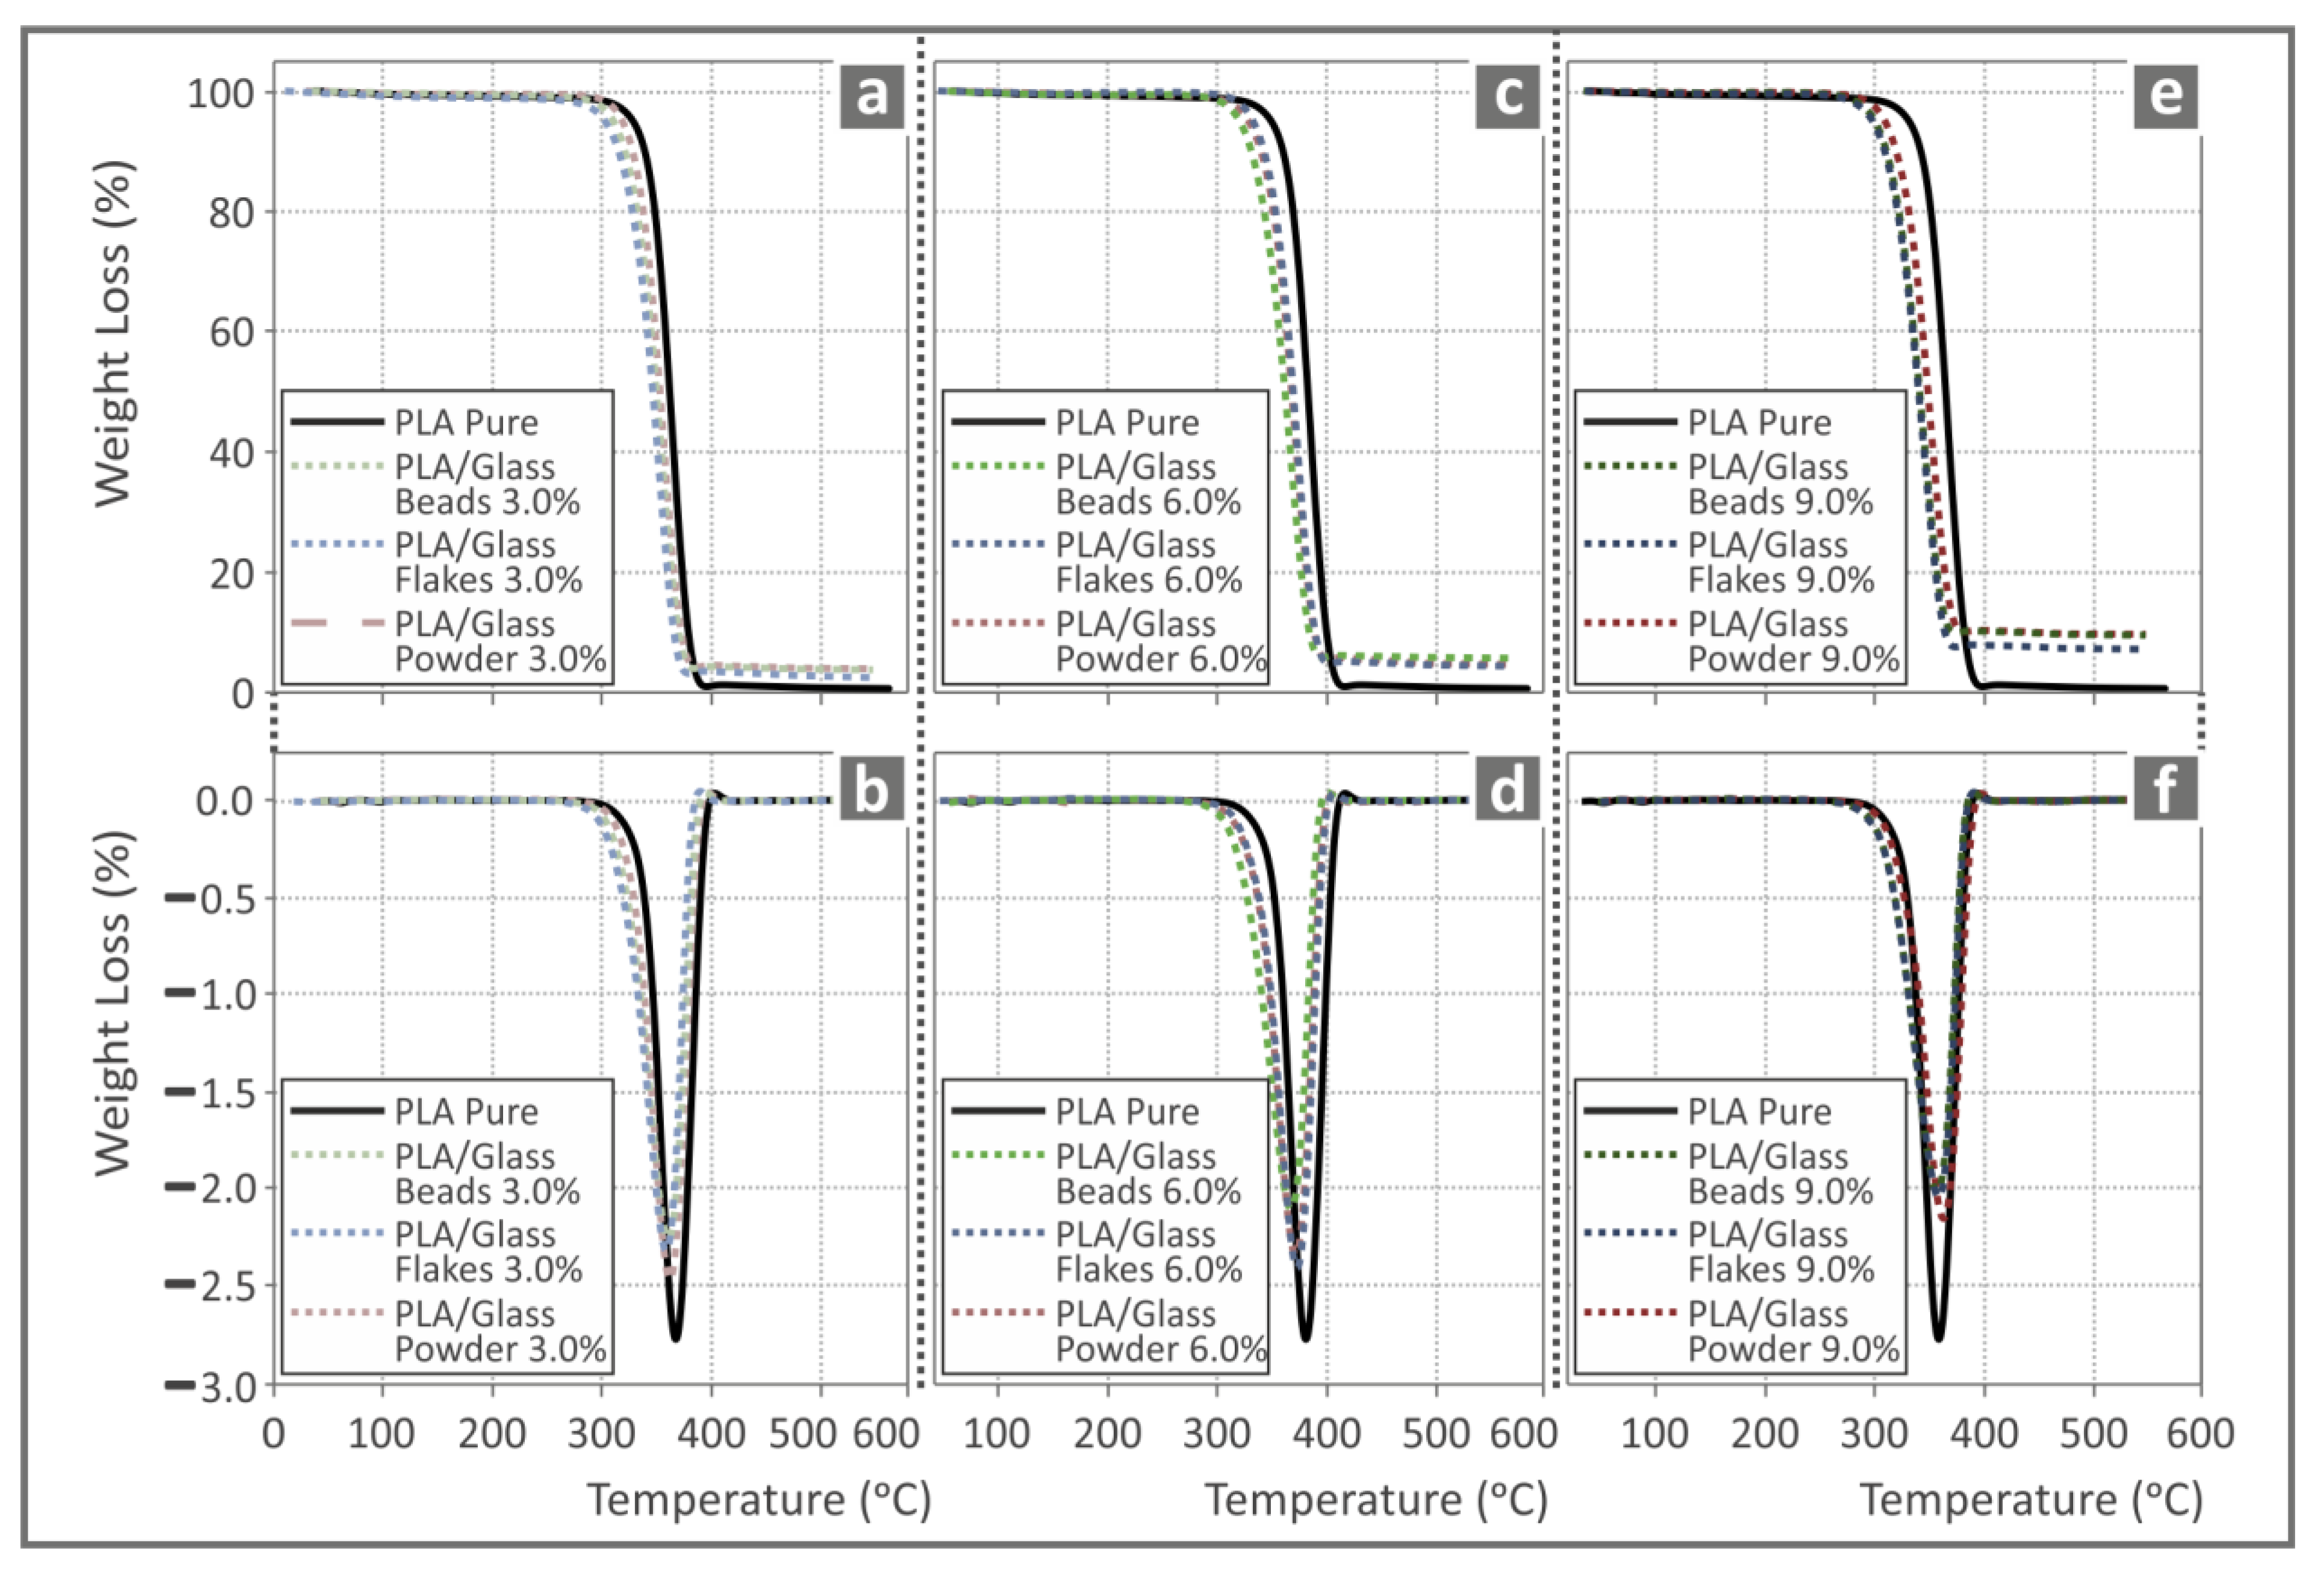
2.4. Thermographic Analysis

Thermogravimetric analysis (TGA) was carried out via the Perkin Elmer Diamond instrument (Perkin Elmer Diamond, Waltham, MA, USA) in a nitrogen atmosphere to assess the composites’ capacity to keep their structural integrity when subjected to high temperatures. The analysis comprised tracking the weight loss owing to volatilization while the temperature was raised gradually from room temperature to 550 °C at a rate of 10 °C per minute. Measurements were implanted in a nitrogen atmosphere. The weight loss rate was calculated using the DTGA (Derivative Thermogravimetric Analysis), which is the first derivative of the TGA curve. Using mathematical differentiation, the experimental TGA data were used to create the DTGA graphs.

2.5. Raman Spectroscopy Evaluation

The LabRAM HR Raman Spectrometer manufactured by HORIBA Scientific in Kyoto, Japan was used to perform the acquisition of Raman spectra. A 532 nm solid-state laser module was selected for excitation with a maximum output power of 90 mW. Raman spectral resolution was approximately 2 cm−1 achieved by 600 grooves grating. An Olympus objective lens (LMPlanFL N) with a numerical aperture of 0.5 delivered light onto the sample whilst also collecting the Raman signals. The 50× magnification objective lens operated at a 10.6 mm working distance. A Neutral Density filter with 5% transmittance limited the laser power, which was measured to be 2 mW on the sample. The measurement volume was found to be 1.7 μm laterally and 2 μm axially. Raman spectra collected were between 50 and 3900 cm−1, which was achieved with three optical windows. Each measurement point had an exposure time of 5 s with 5 accumulations.

2.6. Estimation of the Produced Filaments

Before being used for 3D printing and producing the test samples, the generated filaments underwent several tests. These tests included determining their diameter, tensile strength, and surface composition. Real-time monitoring of the filament diameter was performed using a closed-loop control system to make sure it complied with the regulations. A digital caliper was also used to check its diameter by taking measurements at random sections. The tensile strength of the filaments was measured using the Imada MX2 apparatus (Imada Inc., Northbrook, IL, USA). The samples were fixed in the machine using conventional grips, and the tests were run at a constant speed of 10 mm/min. Each composite underwent testing on five samples. An XE7 AFM machine from Park Systems (Suwon, Republic of Korea) was employed in ambient air to conduct the atomic force microscopy (AFM) analysis on the surface morphology of the filaments.
The AFM images were acquired in tapping mode using a PPP-NCHR tip from Nanosensors (Si-doped tip, force constant 42 N/m, resonance frequency = 330 kHz). The 10 × 10 μm2 images were acquired at 256 pixels × 256 pixels, giving a lateral resolution of 39.1 nm. The vertical resolution of the device is about 1 nm. A continuous working set point amplitude of more than 70% of the natural oscillation was maintained while taking images using the intermittent contact method with a scanning rate of 0.5 Hz.

2.7. Mechanical Assessment

As previously stated, the mechanical characteristics of the 3D-printed samples were assessed in accordance with ASTM standards using a variety of tests aiming at evaluating their strength, rigidity, resistance to external forces, and capacity for deformation without breaking. These tests’ main goal was to evaluate the materials’ overall mechanical characteristics. Additionally, the tests examined the impact that each type of glass particle used had on the compounds’ ability to respond mechanically. The typical environmental parameters of 23 °C temperature and 55% relative humidity were maintained throughout all the trials. Five samples of the PLA composites, containing each one of the three types of glass particles (beads, flakes, and powder), were produced and put through a series of tests utilizing different instruments and specifications. Tensile tests were carried out using standard grips and the Imada MX2 equipment from Imada Inc. (based in Northbrook, IL, USA). Flexural testing was performed using Imada Inc.’s (Northbrook, IL, USA) MX2 equipment at a strain rate of 10 mm/min and a support span of 52 mm (three-point bending test). Impact tests were carried out via Charpy, notched samples, and a hammer release height of 367 mm using the Terco MT-220 equipment (located in Kungens-Kurva, Sweden). Finally, microhardness was assessed using InnovaTest 300 gear from Maastricht, the Netherlands. Measurements were taken at 10 s duration with a Vickers tip and a 200 gF load.

2.8. Analysis of the Morphology of 3D-Printed Samples

Using a field emission scanning electron microscope (JSM-IT700HR, Jeol Ltd. Tokyo, Japan) operating in a high vacuum with a voltage of 20 kV, the shape and structure of the 3D-printed samples were carefully examined. To examine the cracked and lateral surfaces of the gold-sputtered samples, images at various magnifications were taken using the scanning electron microscope.

3. Results

3.1. TGA and DTGA Analysis of Pure PLA and Glass PLA Composites

Figure 4 shows the weight loss and derivative weight loss in relation to temperature for both pure PLA and the tested composites using TGA and DTGA plots, respectively. Figure 4a,c,e demonstrate the weight loss for composites with concentrations of 3.0 wt.%, 6.0 wt.%, and 9.0 wt.%, respectively. The TGA graph of pure PLA is also included in each graph for comparison. Figure 4b,d,f, respectively, show the DTGA curves for the studied composites at concentrations of 3.0 wt.%, 6.0 wt.%, and 9.0 wt.%, along with the DTGA curves of the pure PLA for comparison. It can be confirmed for the TGA curves that the residual weight of the glass additives following the combustion of PLA up to 550 °C is commensurate with the weight of the filler used to make the composite filaments. It is observable that the weight loss of PLA composites containing 3.0 wt.% of glass additions responds similarly to that of the pure PLA polymer (Figure 4a). However, the weight loss of the composites starts to deviate at slightly lower temperatures from that of pure PLA as the concentration of glass additives rises (Figure 4c,e). It is important to note that the weight loss of pure PLA is more rapid than that of composites. The maximal rate of weight loss for pure PLA is noticeably larger than that of the composites, which is consistent with this tendency, as seen in Figure 4b,d,f. The maximum weight loss rate for the 3 and 6 wt.% glass-filled composites occurs at slightly lower temperatures than the pure PLA, while the 9 wt.% glass-filled composites develop their maximum weight loss rate at similar temperatures with the pure PLA polymer.

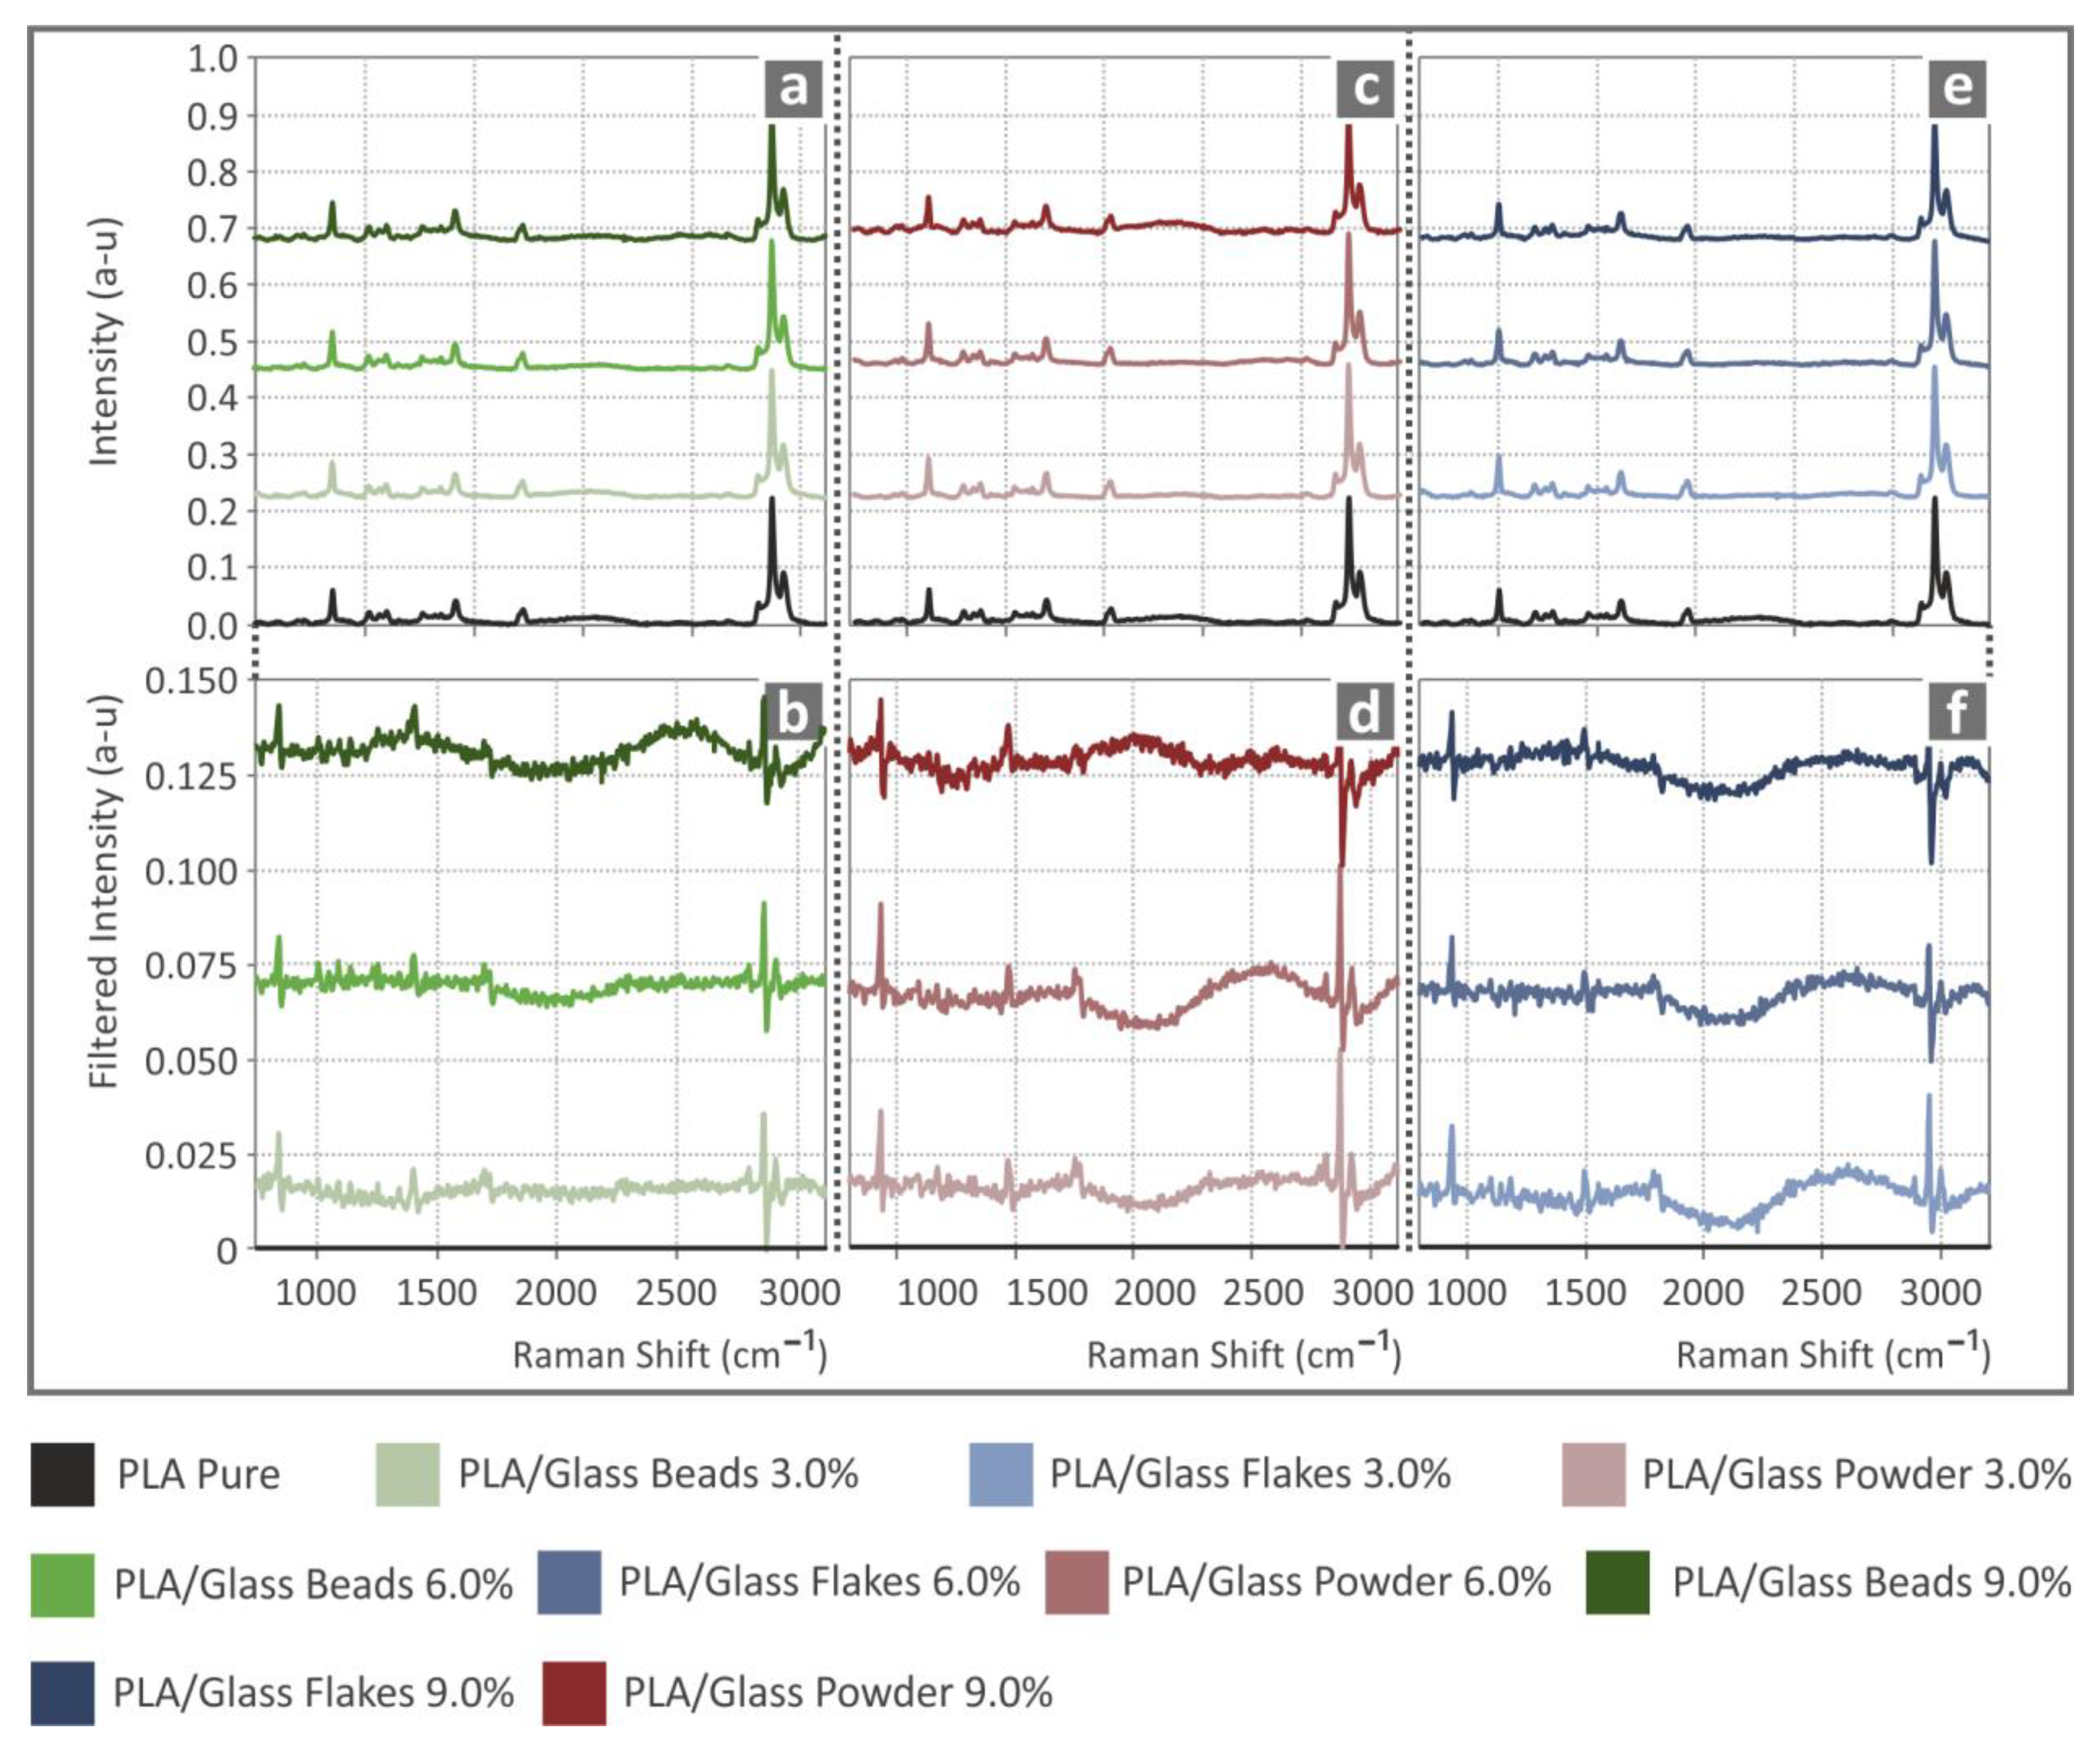
3.2. Quantifying Material Properties Using Raman Spectroscopy

Figure 5 presents the Raman spectra of the samples that were analyzed in this study. In Figure 5a,c,e, the clear Raman spectra can be observed from the pure material PLA and the PLA/Glass mixtures. There are no clear Raman spectra differences due to the additives, with only two minimal changes which are close to the noise level. Only when the Raman spectrum of pure PLA was used for normalization, differences in the Raman spectrum were observed. As is seen in Figure 5b,d,f, the first difference is an increase at 870 cm−1 (C-COO stretching) and the second at 2945 cm−1 (C-H2 asymmetric stretching). The related Raman peaks from the pure PLA sample are presented in Table 1 and are validated by the literature.

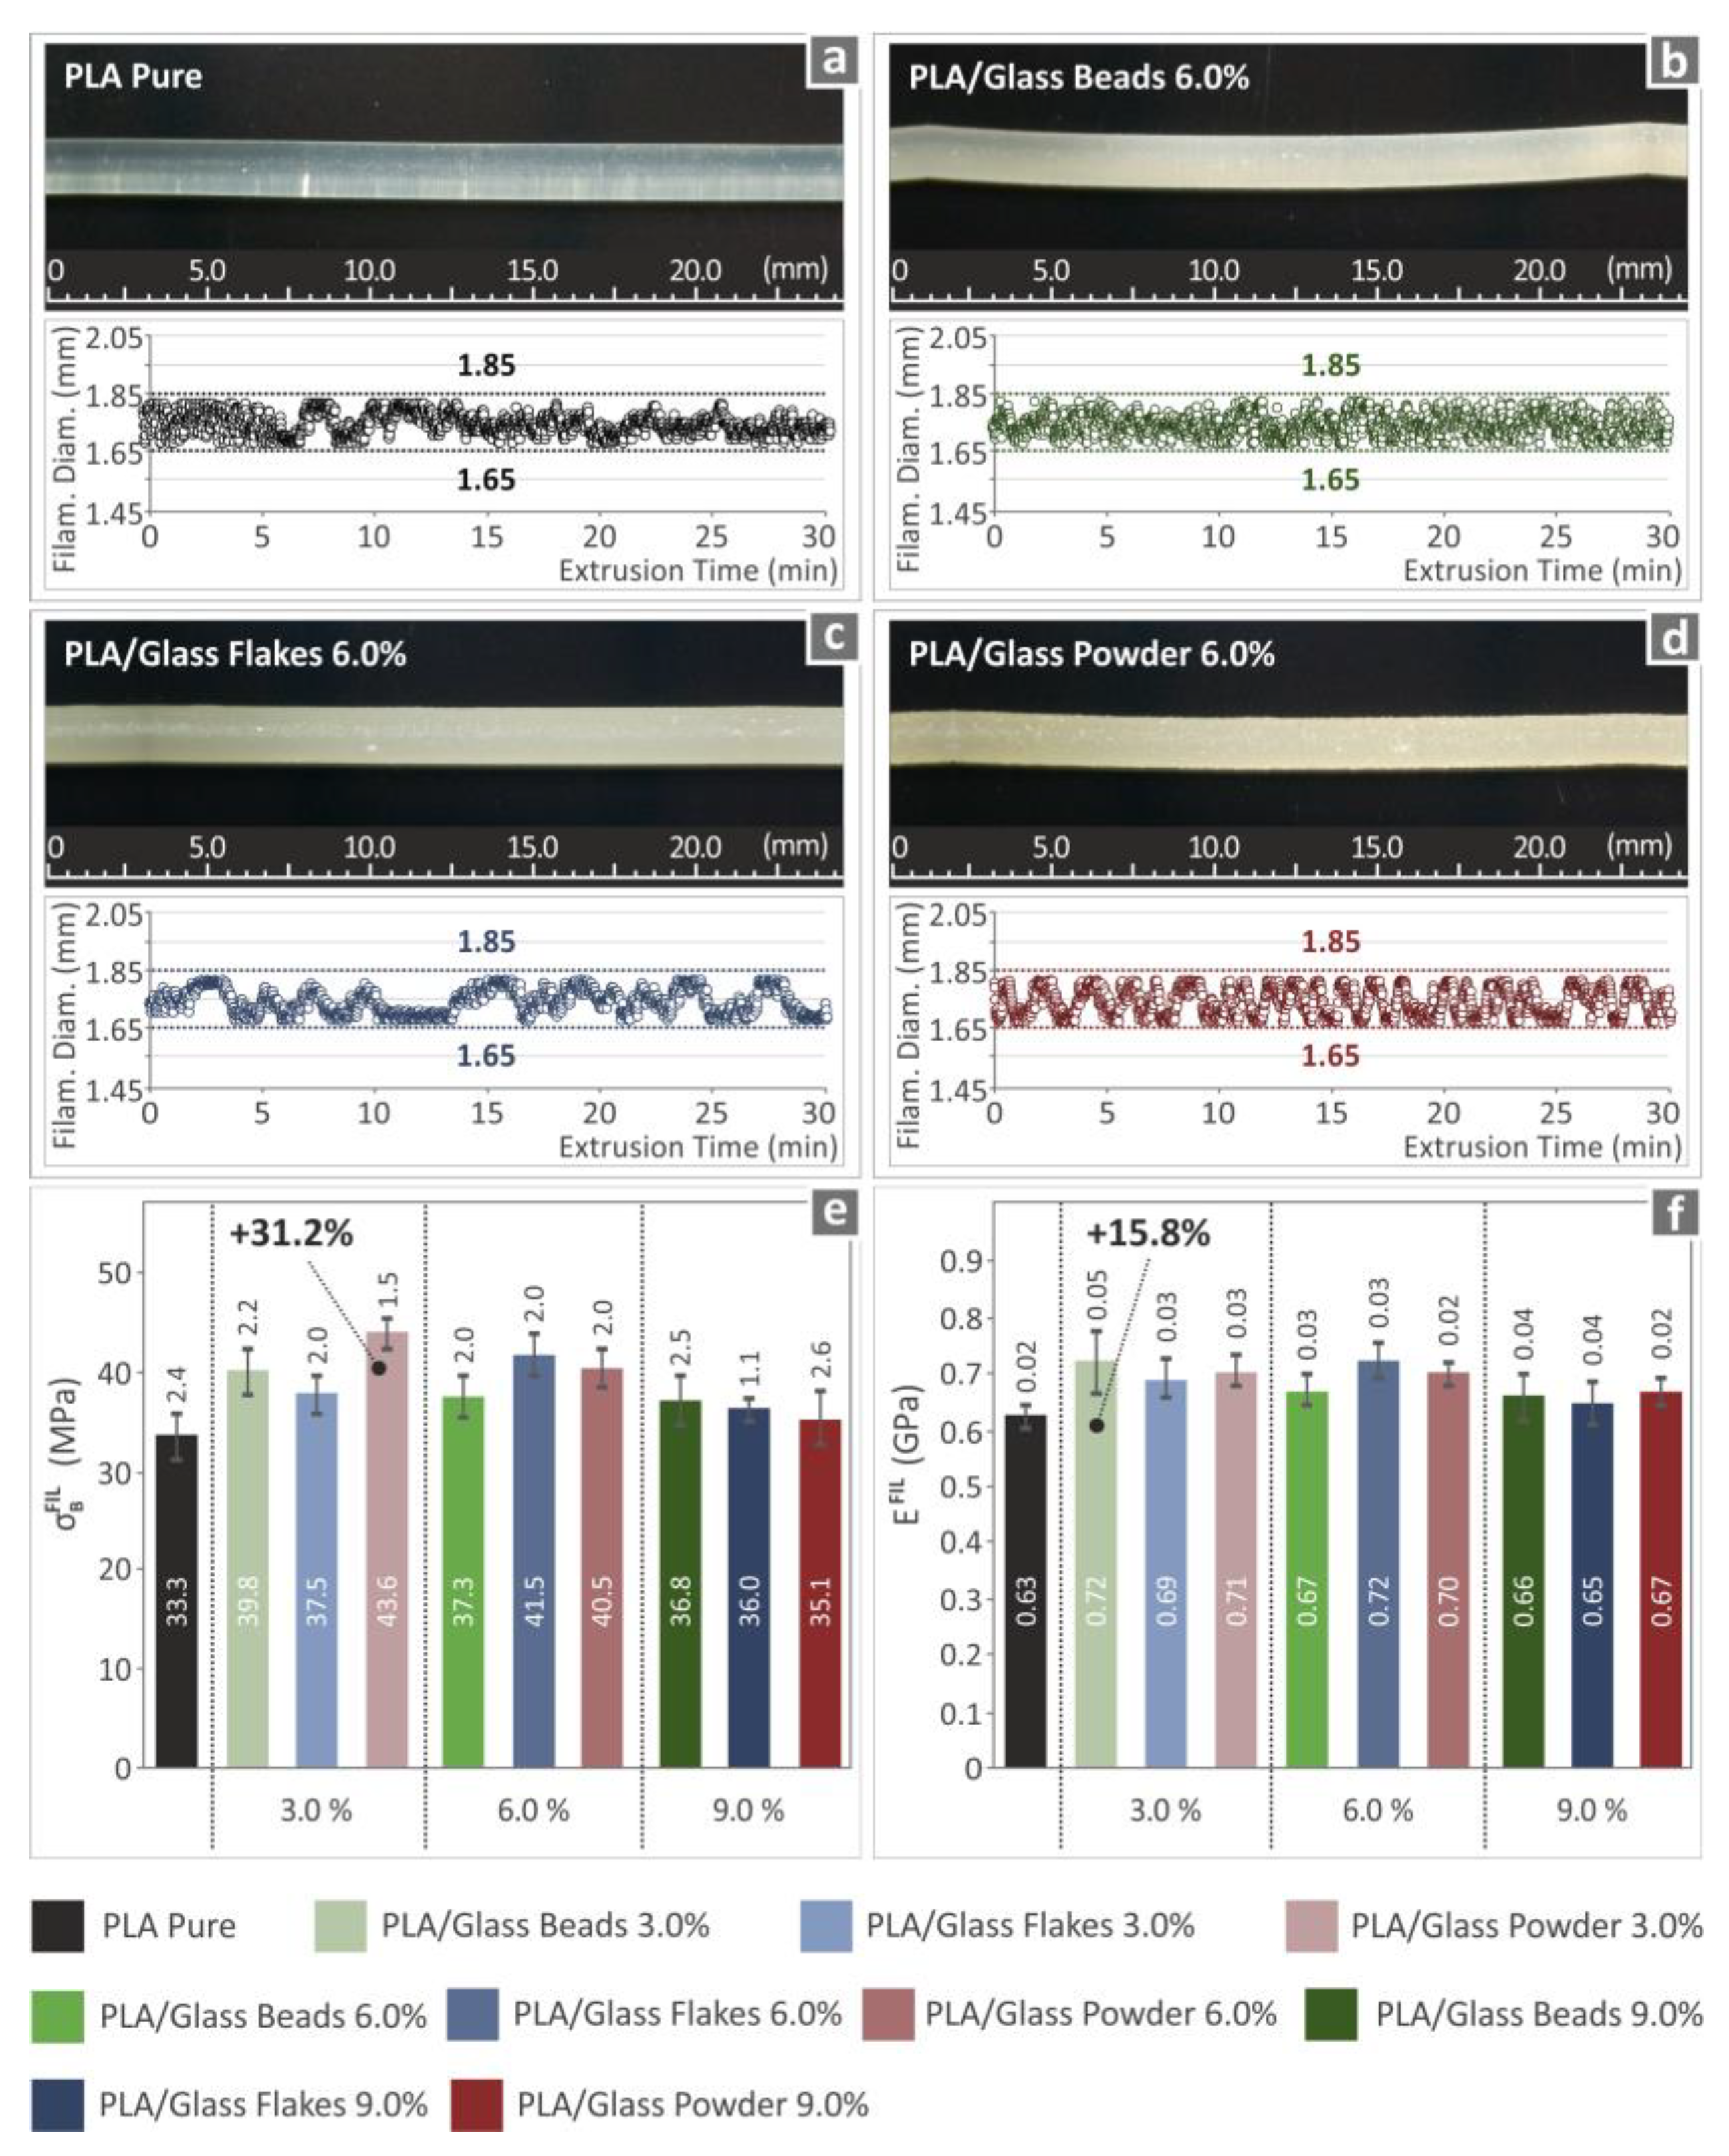
3.3. Assessing Filament Quality and Performance

Atomic force microscopy (AFM) was used to examine the side surface morphologies of all filaments produced. It is evident from the examination of the PLA/Glass Bead composites that as the additive concentration increases from 3.0 wt.% to 6.0 wt.%, the surface roughness decreases (Figure 6a,b). All three surface roughness parameters (Rq, Ra, and Rz), however, show higher values when the filler concentration is increased to 9.0 wt.% (Figure 6c). According to the findings on composites of PLA/Glass Flakes, the surface roughness steadily increases with an increase in the additive’s content. In the PLA/Glass Powder composites, the surface roughness of all three parameters increases as the additive concentration rises from 3.0 wt.% to 6.0 wt.%, according to the data. When the concentration is raised to 9.0 wt.%, two surface roughness metrics (Rq and Ra) display a decrease while Rz shows an increase when compared to the 6.0 wt.% concentration. These results indicate that the surface morphology of PLA/glass powder composites is not linearly dependent on the concentration of glass powder, and further investigation is required to clarify the underlying mechanisms causing these observations. The graphs in Figure 6j,k, and l show the correlation between the three surface roughness parameters, Rq, Ra, and Rz, and the concentration of glass additives in the compounds. It should be noted that the quality of filaments can be substantially impacted by surface roughness.
The closed-loop filament diameter system, as previously mentioned on the 3devo composer (3devo B.V., Utrecht, The Netherlands) extruder, was used for monitoring the filaments’ diameter. The extrusion settings can be automatically adjusted using this method based on real-time measurements of the filament diameter. In this way, it is consistent and within a range that ensures its compatibility with the MEX 3D printing process, in terms of diameter and homogeneity. Figure 7a–d depict different manufactured filament segments that were chosen randomly along with in-process diameter measurements. The photos were taken with an optical OZR5 stereoscope (KERN & SOHN GmbH, Albstadt, Germany). The figures show the results for four different composites: pure PLA, PLA/glass beads (6.0 wt.%), PLA/glass flakes (6.0 wt.%), and PLA/glass powder (6.0 wt.%). The results show that all created filaments have low deviations in their diameter measurements (200 μm), which is sufficient for MEX 3D printing. It is significant to note that none of the created filaments’ real-time diameter measurements during the extrusion process exceeded this variation, demonstrating the precision of the experimental procedure and the proper selection of the setup parameters. The optical stereoscopic images (shown in Figure 7a–d) revealed that the filaments’ side surface was smooth and devoid of any flaws.
An assessment of the filaments’ tensile strength was performed, and the results are shown in Figure 7e. Among all concentrations tested, the PLA/Glass Powder 3.0 wt.% composite had the highest strength of 43.6 MPa, representing a 31.2% increase over the pure PLA filament, which was the highest value observed overall. The outcomes additionally show that all of the composite filaments examined had higher tensile strengths than the pure PLA ones. The results for the filaments’ tensile modulus of elasticity are shown in Figure 7f. Again, it is evident that all composite filaments exhibited greater values of modulus of elasticity than pure PLA at all concentrations of the various types of glass additions. The greatest value of 0.72 GPa was found in the PLA/Glass Beads composite, which had a concentration of 3.0 wt.%. This value was 15.8% higher than that of the pure PLA material.

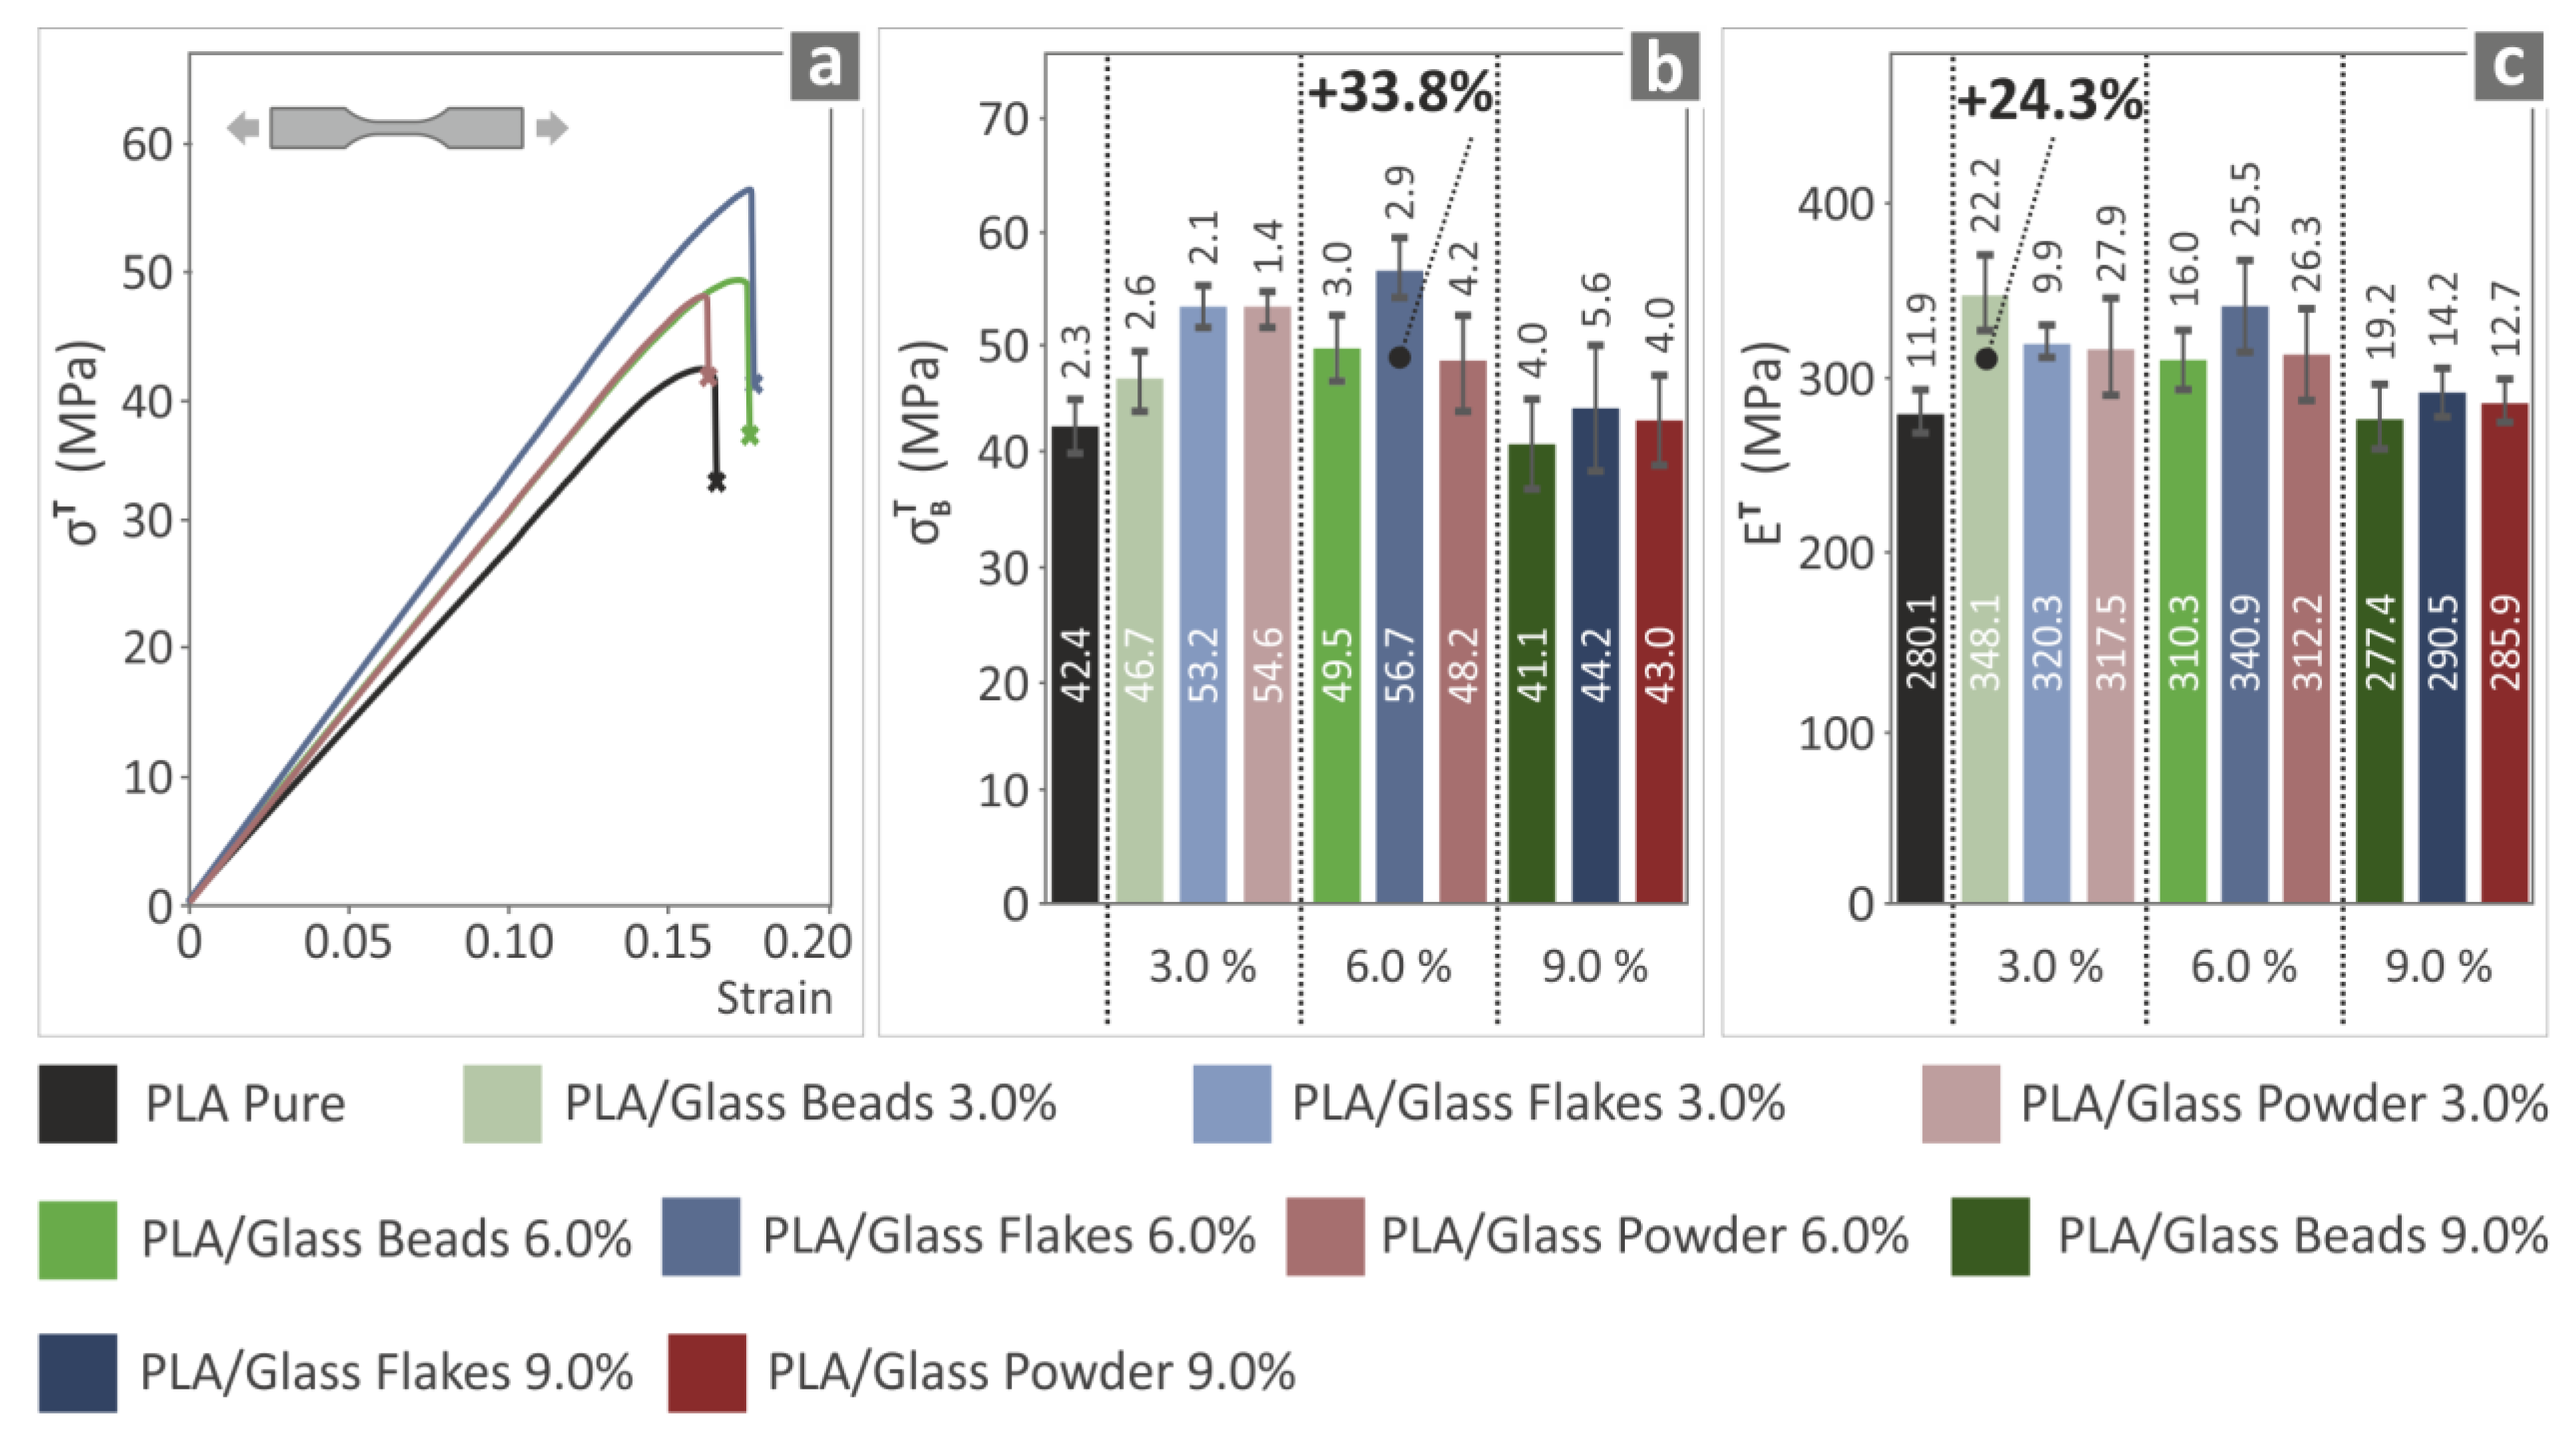
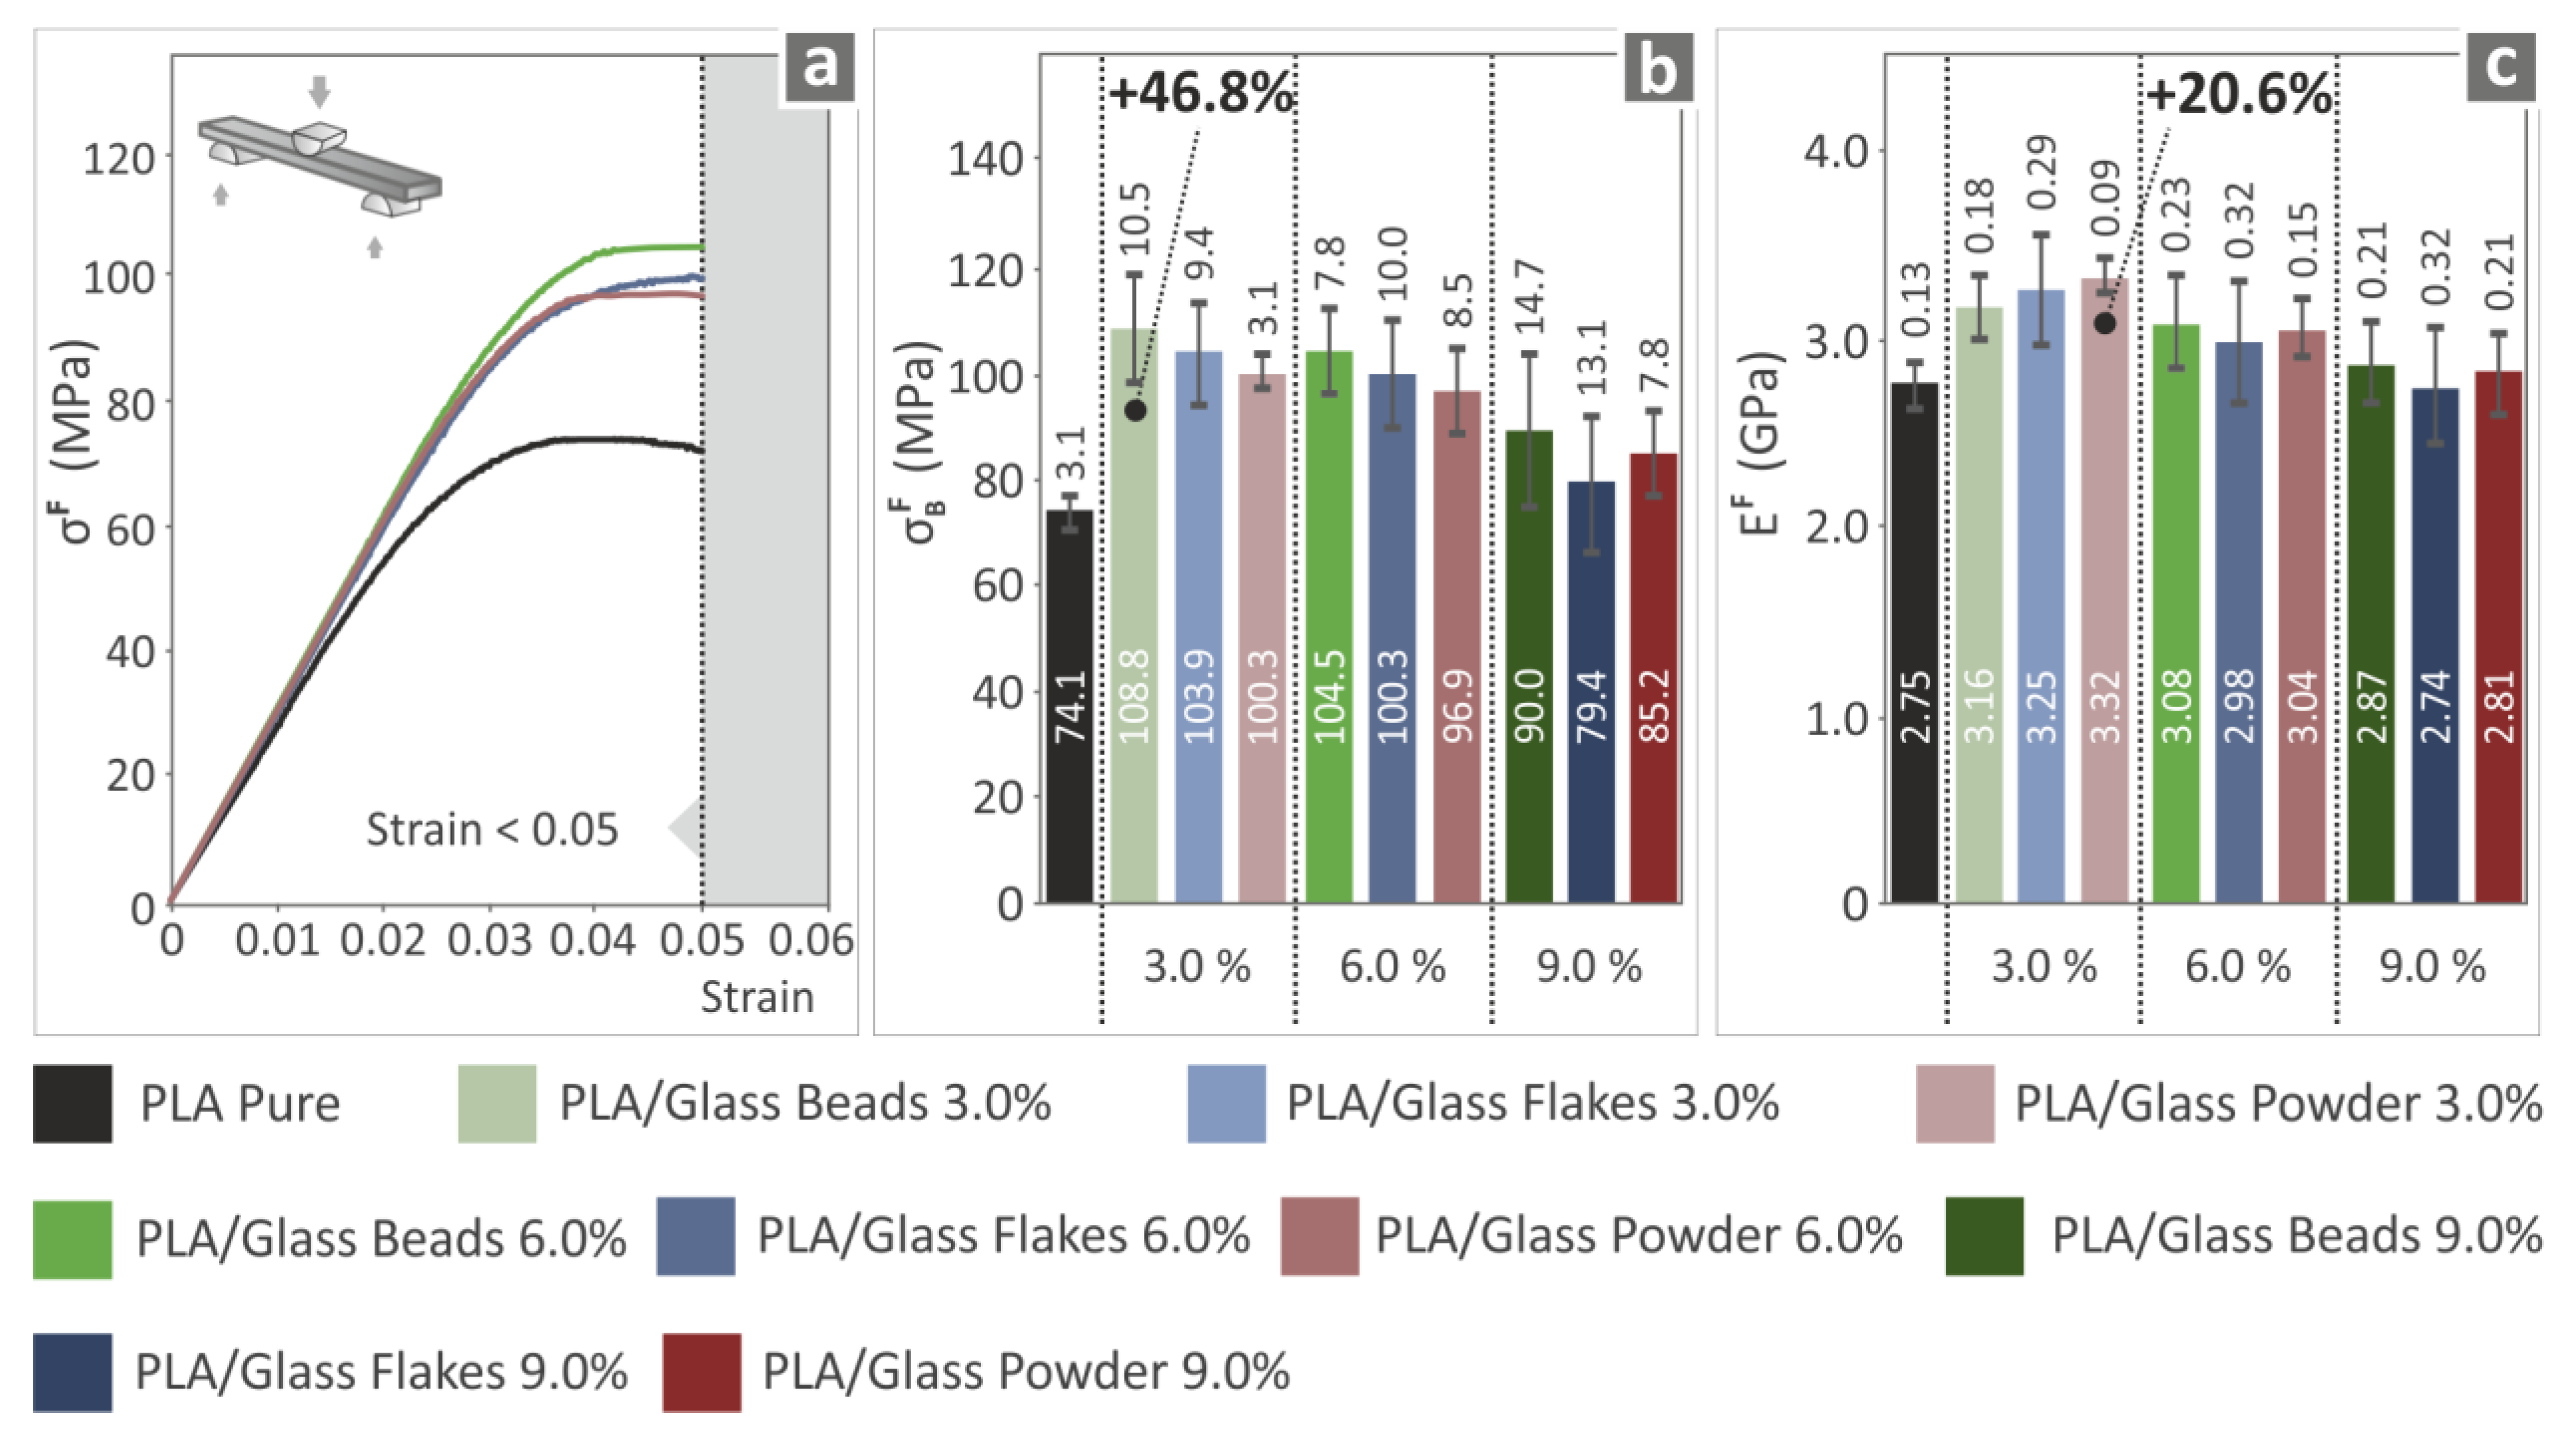
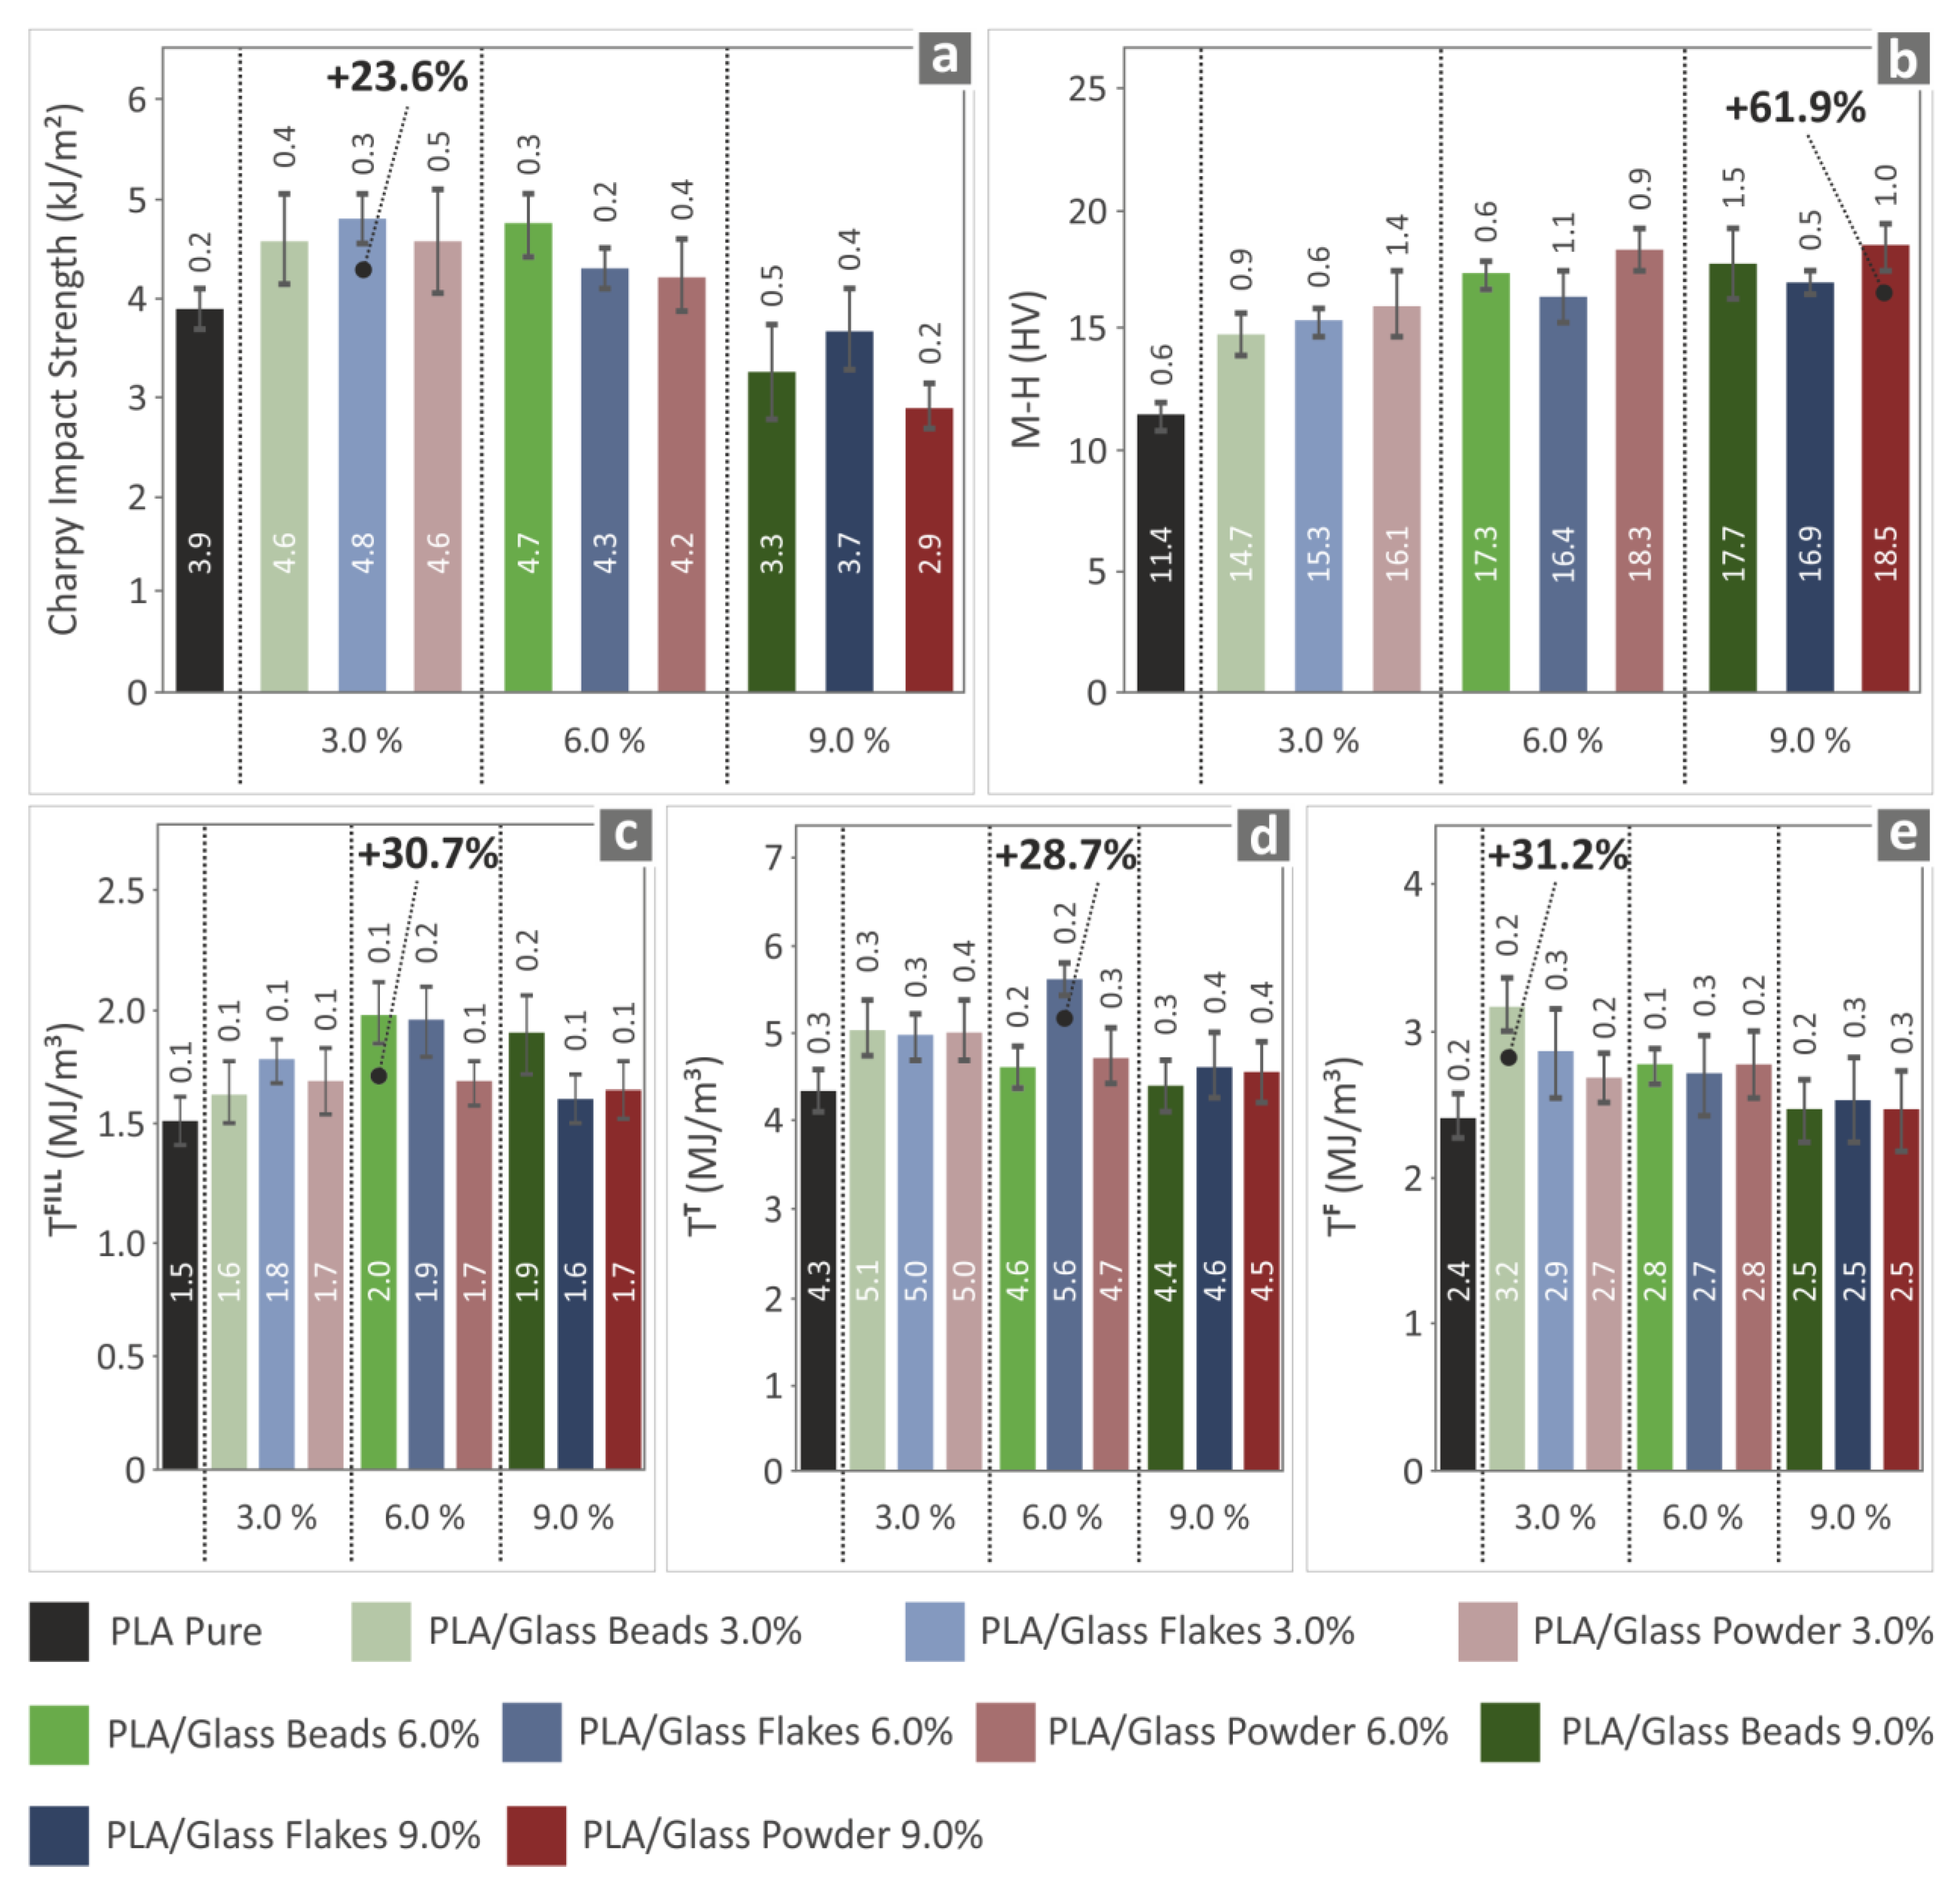
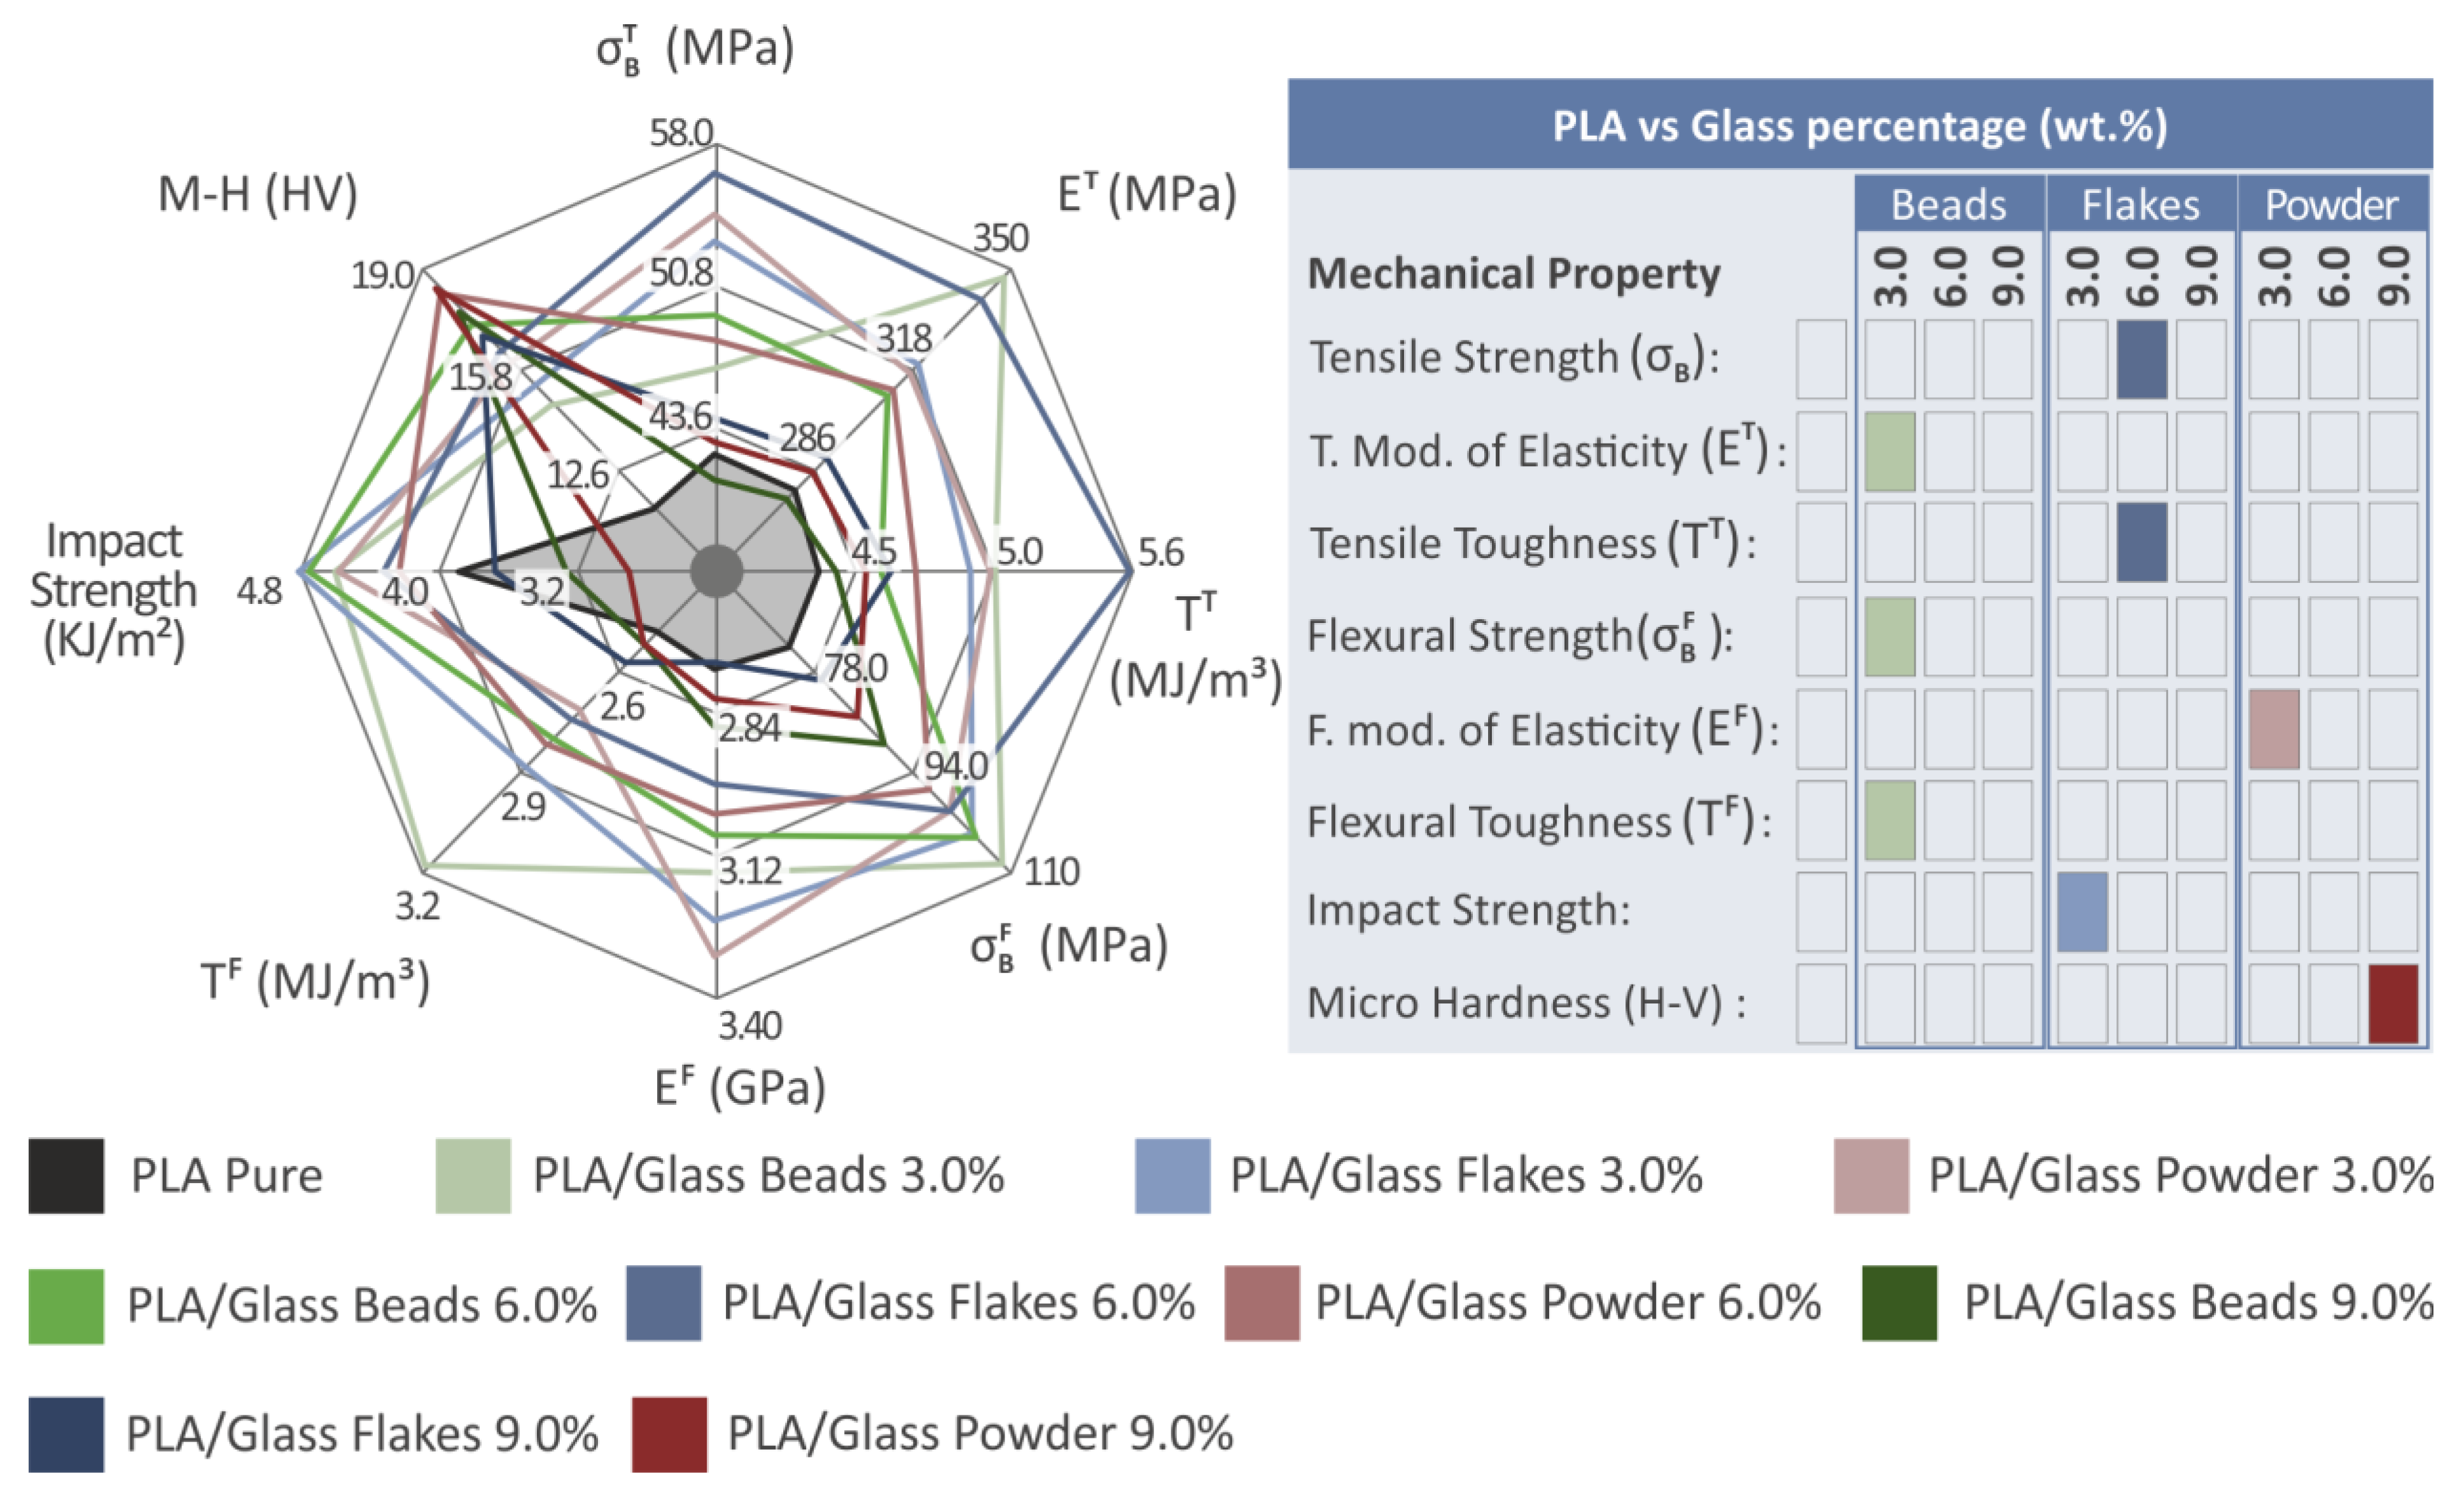
3.4. Analysis of the Mechanical Properties of the 3D-Printed Samples

The 3D printing process followed after the filaments were assessed, in order to manufacture specimens and examine their mechanical behavior. The tensile test results are displayed in Figure 8. All of the specimens prepared, at all concentrations of the three distinct glass additive types, showed an improvement in tensile strength, according to Figure 8b. The PLA/Glass Beads specimens at a concentration of 9.0 wt.% showed a slight decrease compared to the other composites; still, their properties were marginally higher than the pure PLA polymer. The PLA/Glass Flakes composite with 6.0 wt.% concentration revealed the highest value of 56.7 MPa out of all the samples tested, which was 33.8% higher than the sample composed of PLA. Figure 8c shows a similar pattern for the modulus of elasticity, with all samples exhibiting an increase in value aside from the PLA/Glass Beads specimen with a concentration of 9.0 wt.%, which once more exhibited a minor decline. The sample with the highest elasticity modulus, which was 24.3% higher than that of pure PLA and contained glass beads, was that with a concentration of 3.0 weight percent.
Figure 9 shows the values of the flexural properties as they were derived in the corresponding tests. According to the ASTM D790-10 standard, the average flexural strength values were calculated at a maximum strain of 5% since no failure occurred at the specimens up to this stain. The reinforcement of the flexural characteristics was significantly improved by the addition of glass particles to the PLA matrix, with all composites exhibiting higher values than those of the pure polymer. The maximum flexural strength value found at the PLA/Glass Beads composite at 3.0 wt.%, which was 108.8 MPa, i.e., 46.8% greater than the value for pure PLA (Figure 9b). The flexural modulus of elasticity followed a similar trend, with all composites containing glass additives showing enhanced mechanical responsiveness relative to the virgin polymeric matrix. In this instance, the PLA/Glass Powder combination with a 3.0 wt.% concentration achieved 3.32 GPa, reaching a 20.6% increase over that of pure PLA. The composite with 9.0 wt.% of glass flakes showed a minor decrease (Figure 9c).
Figure 10 shows the specimens’ impact strength, Vickers microhardness, tensile and flexural toughness, as well as the toughness calculated in the tensile tests for the filaments. Figure 10a demonstrates how the addition of all types of glass fillers (beads, flakes, and powder) at various concentrations affected the composites’ impact strength. When compared to the pure PLA polymer, the mechanical response was improved at 3.0 and 6.0 wt.% concentrations of all three types of glass fillers. At 9.0 wt.% concentration, the impact strength was decreased. Compared to the pure polymer, PLA/Glass Flakes with 6.0 wt.% concentration showed an improvement of 23.6%. Figure 10b also shows that the Vickers microhardness results for all composites improved gradually as the concentration of the glass additives increased. The maximum value of 18.5 HV was measured in the PLA/Glass Powder with 9.0 wt.% loading.
The stress–strain curves of the samples and filaments were integrated to get the tensile and flexural toughness values, which represent the energy absorbed by the materials throughout the testing. Figure 10c shows that when compared to the pure PLA polymeric matrix, the tensile toughness values of the tested filaments demonstrate an overall increase for all composites formed. This is evident regardless of the concentration of the three types of glass fillers. The PLA/Glass Beads 6.0 wt.% composite filament obtained the maximum toughness value of 2.0 MJ/m3, which marks a 30.7% improvement over the toughness of the pure PLA polymer. As seen in Figure 10d,e, there is also a discernible improvement in the specimens’ tensile and flexural toughness when compared to pure PLA samples. The findings reveal that at all concentrations of the three different types of glass fillers, all composites exhibit an overall improvement in both tensile and flexural toughness. The PLA/Glass Flakes 6.0 wt.% sample exhibits the highest tensile toughness value, which is 5.6 MJ/m3 (28.7% improvement over the pure PLA polymer). The PLA/Glass Beads 3.0 wt.% sample, on the other hand, has the highest flexural toughness value, reaching 3.2 MJ/m3 (31.2% improvement over the pure PLA polymer).

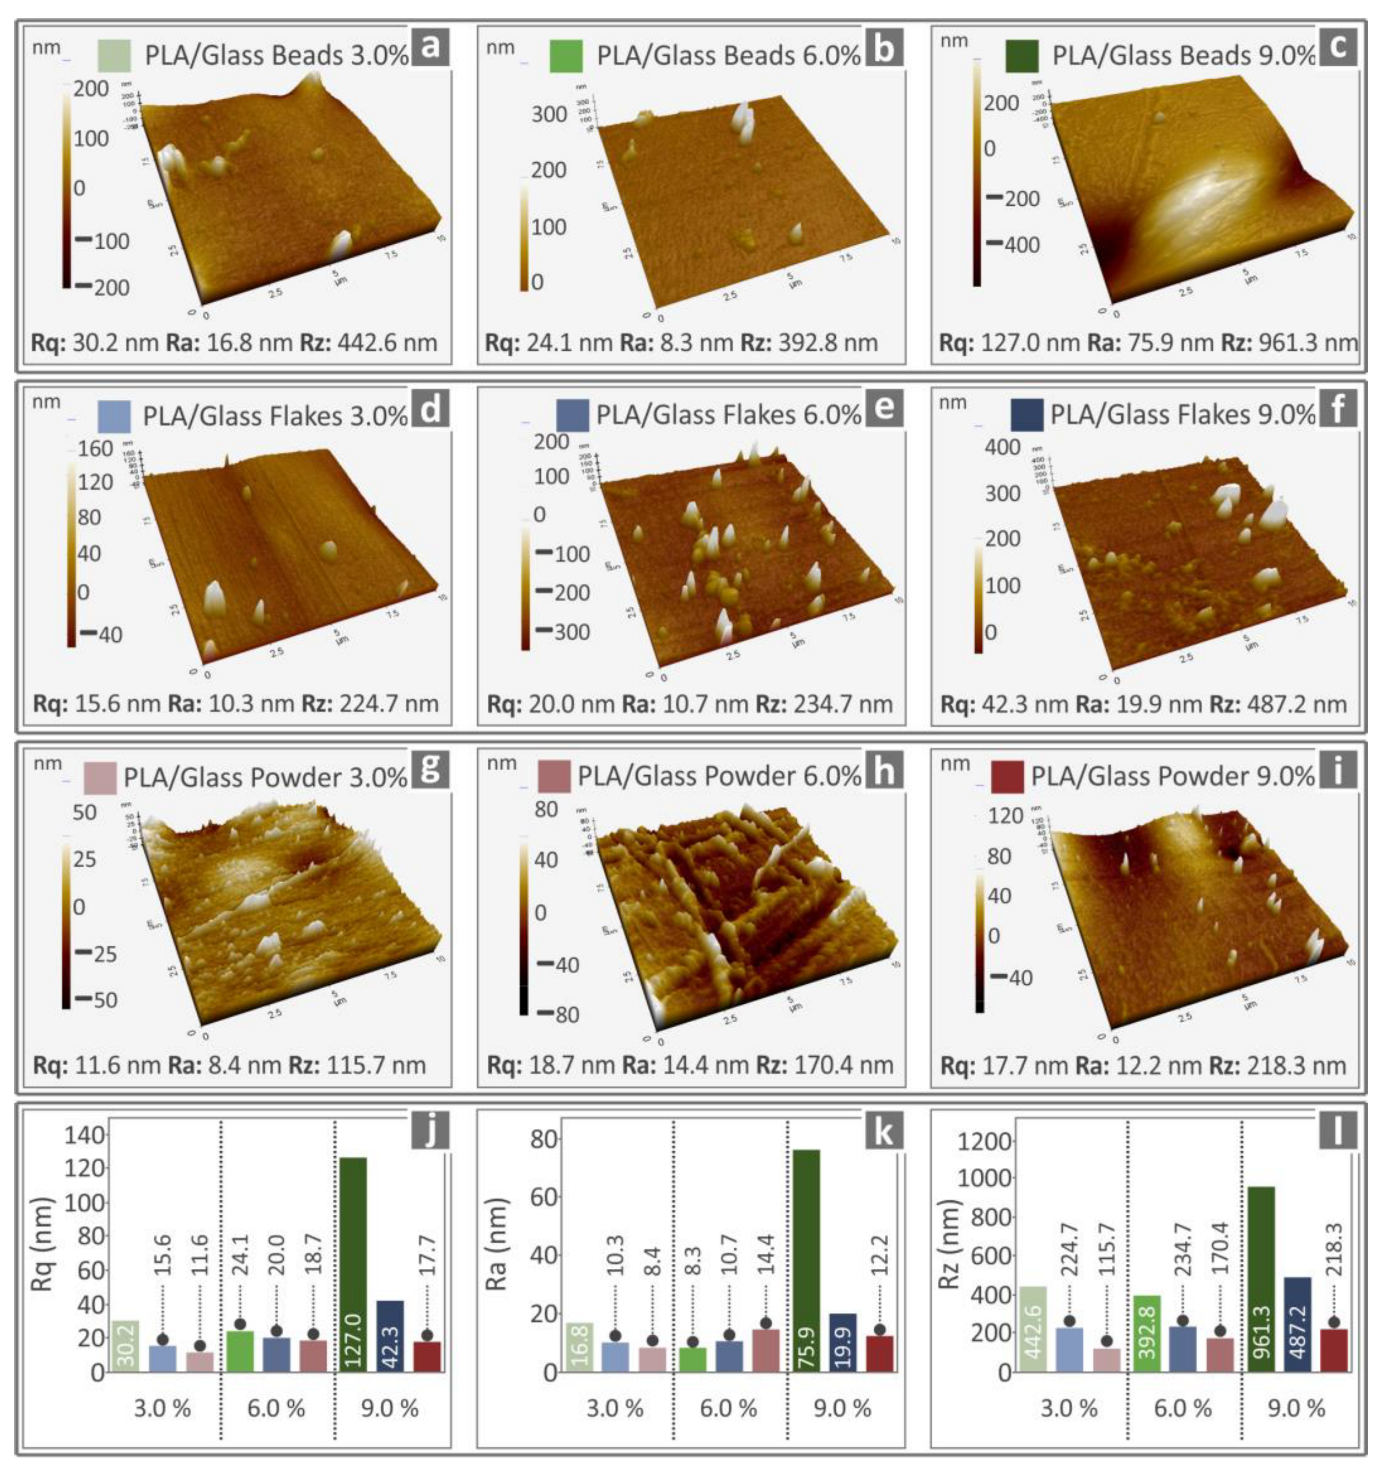
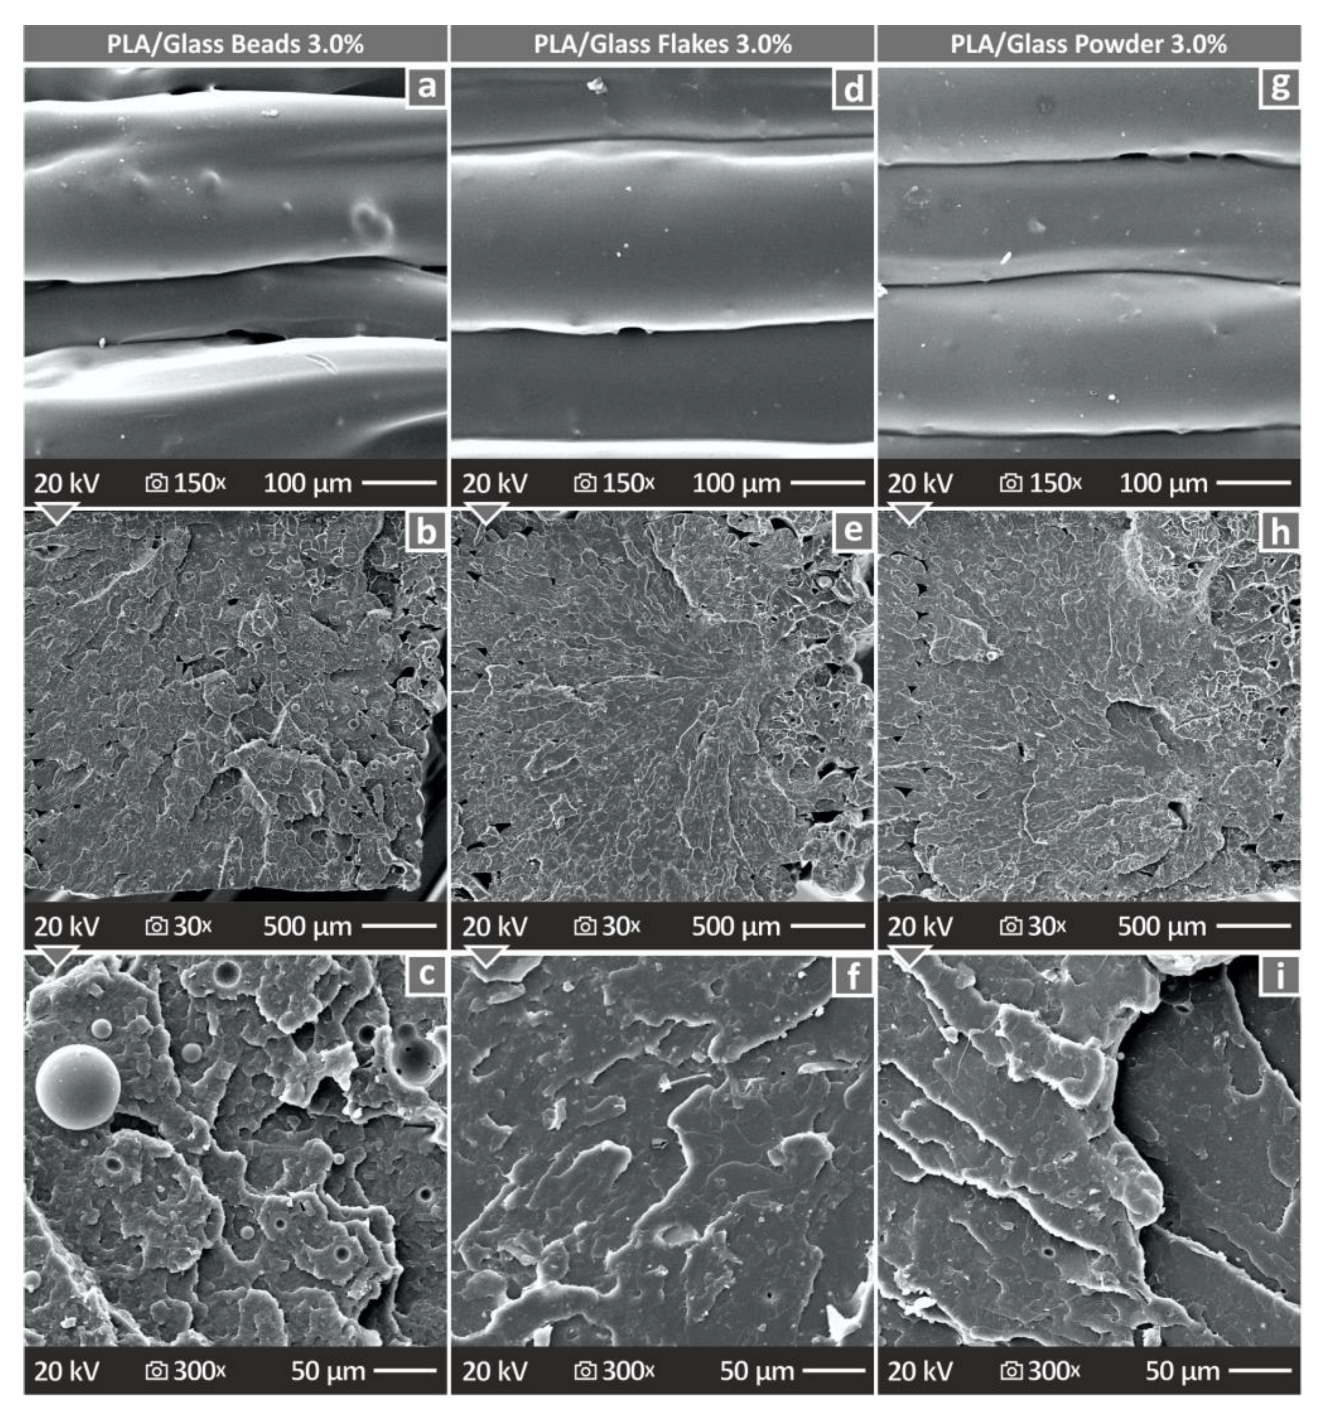
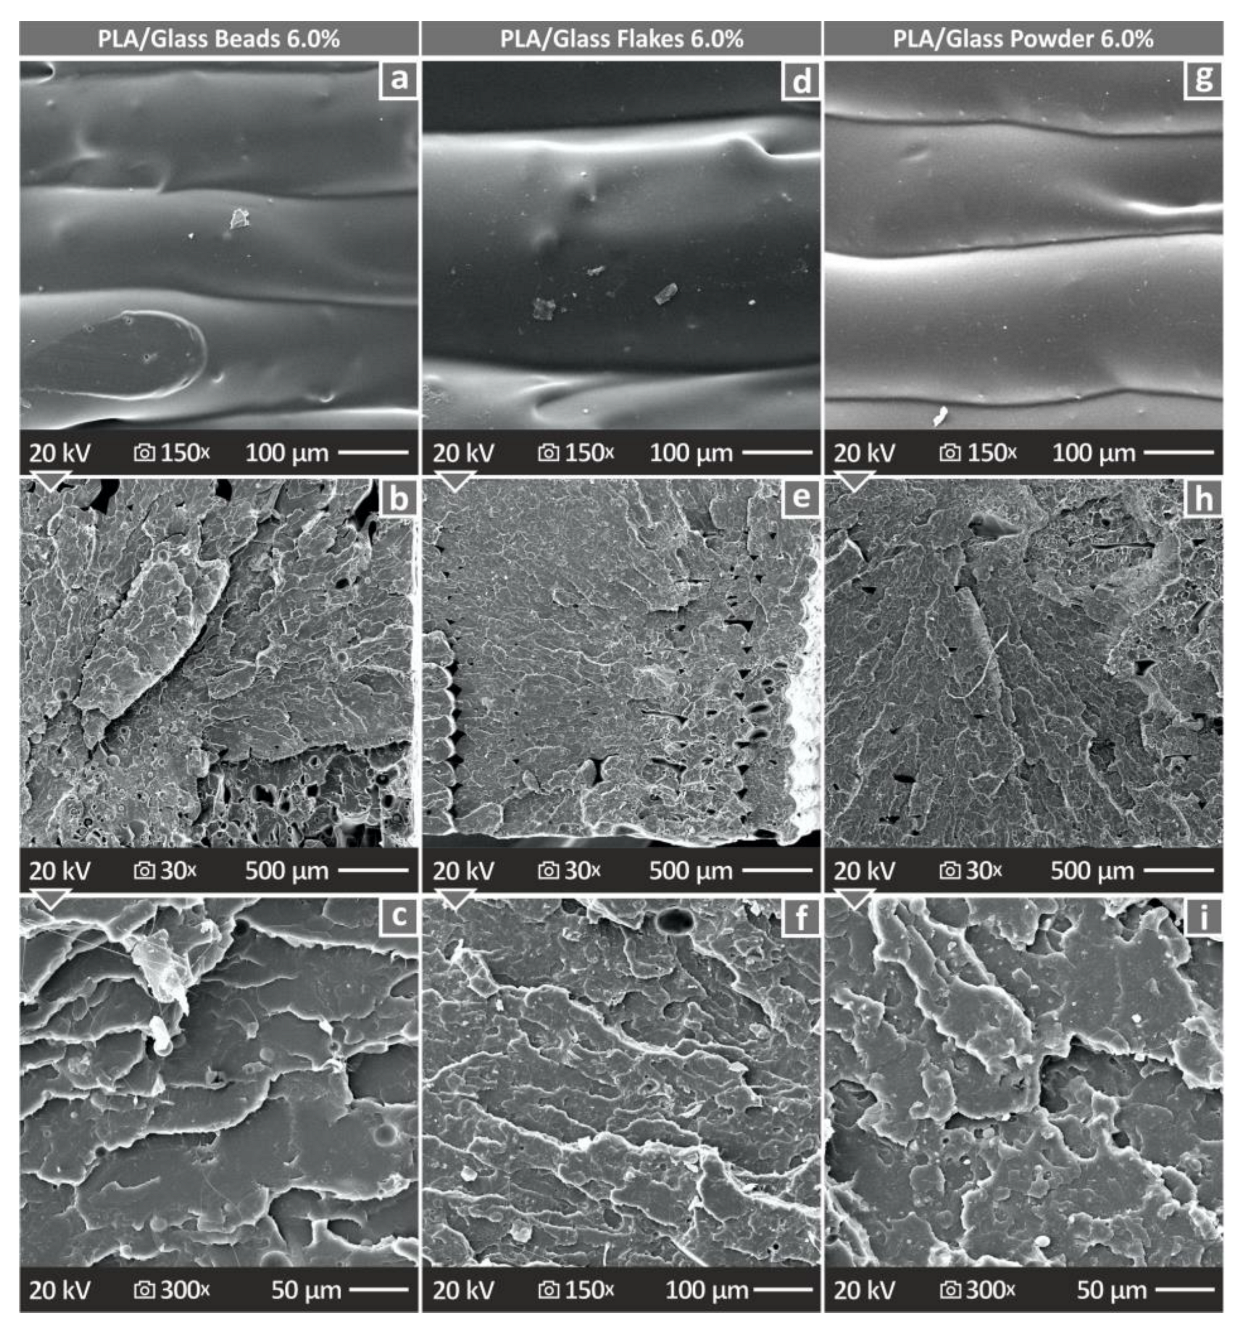
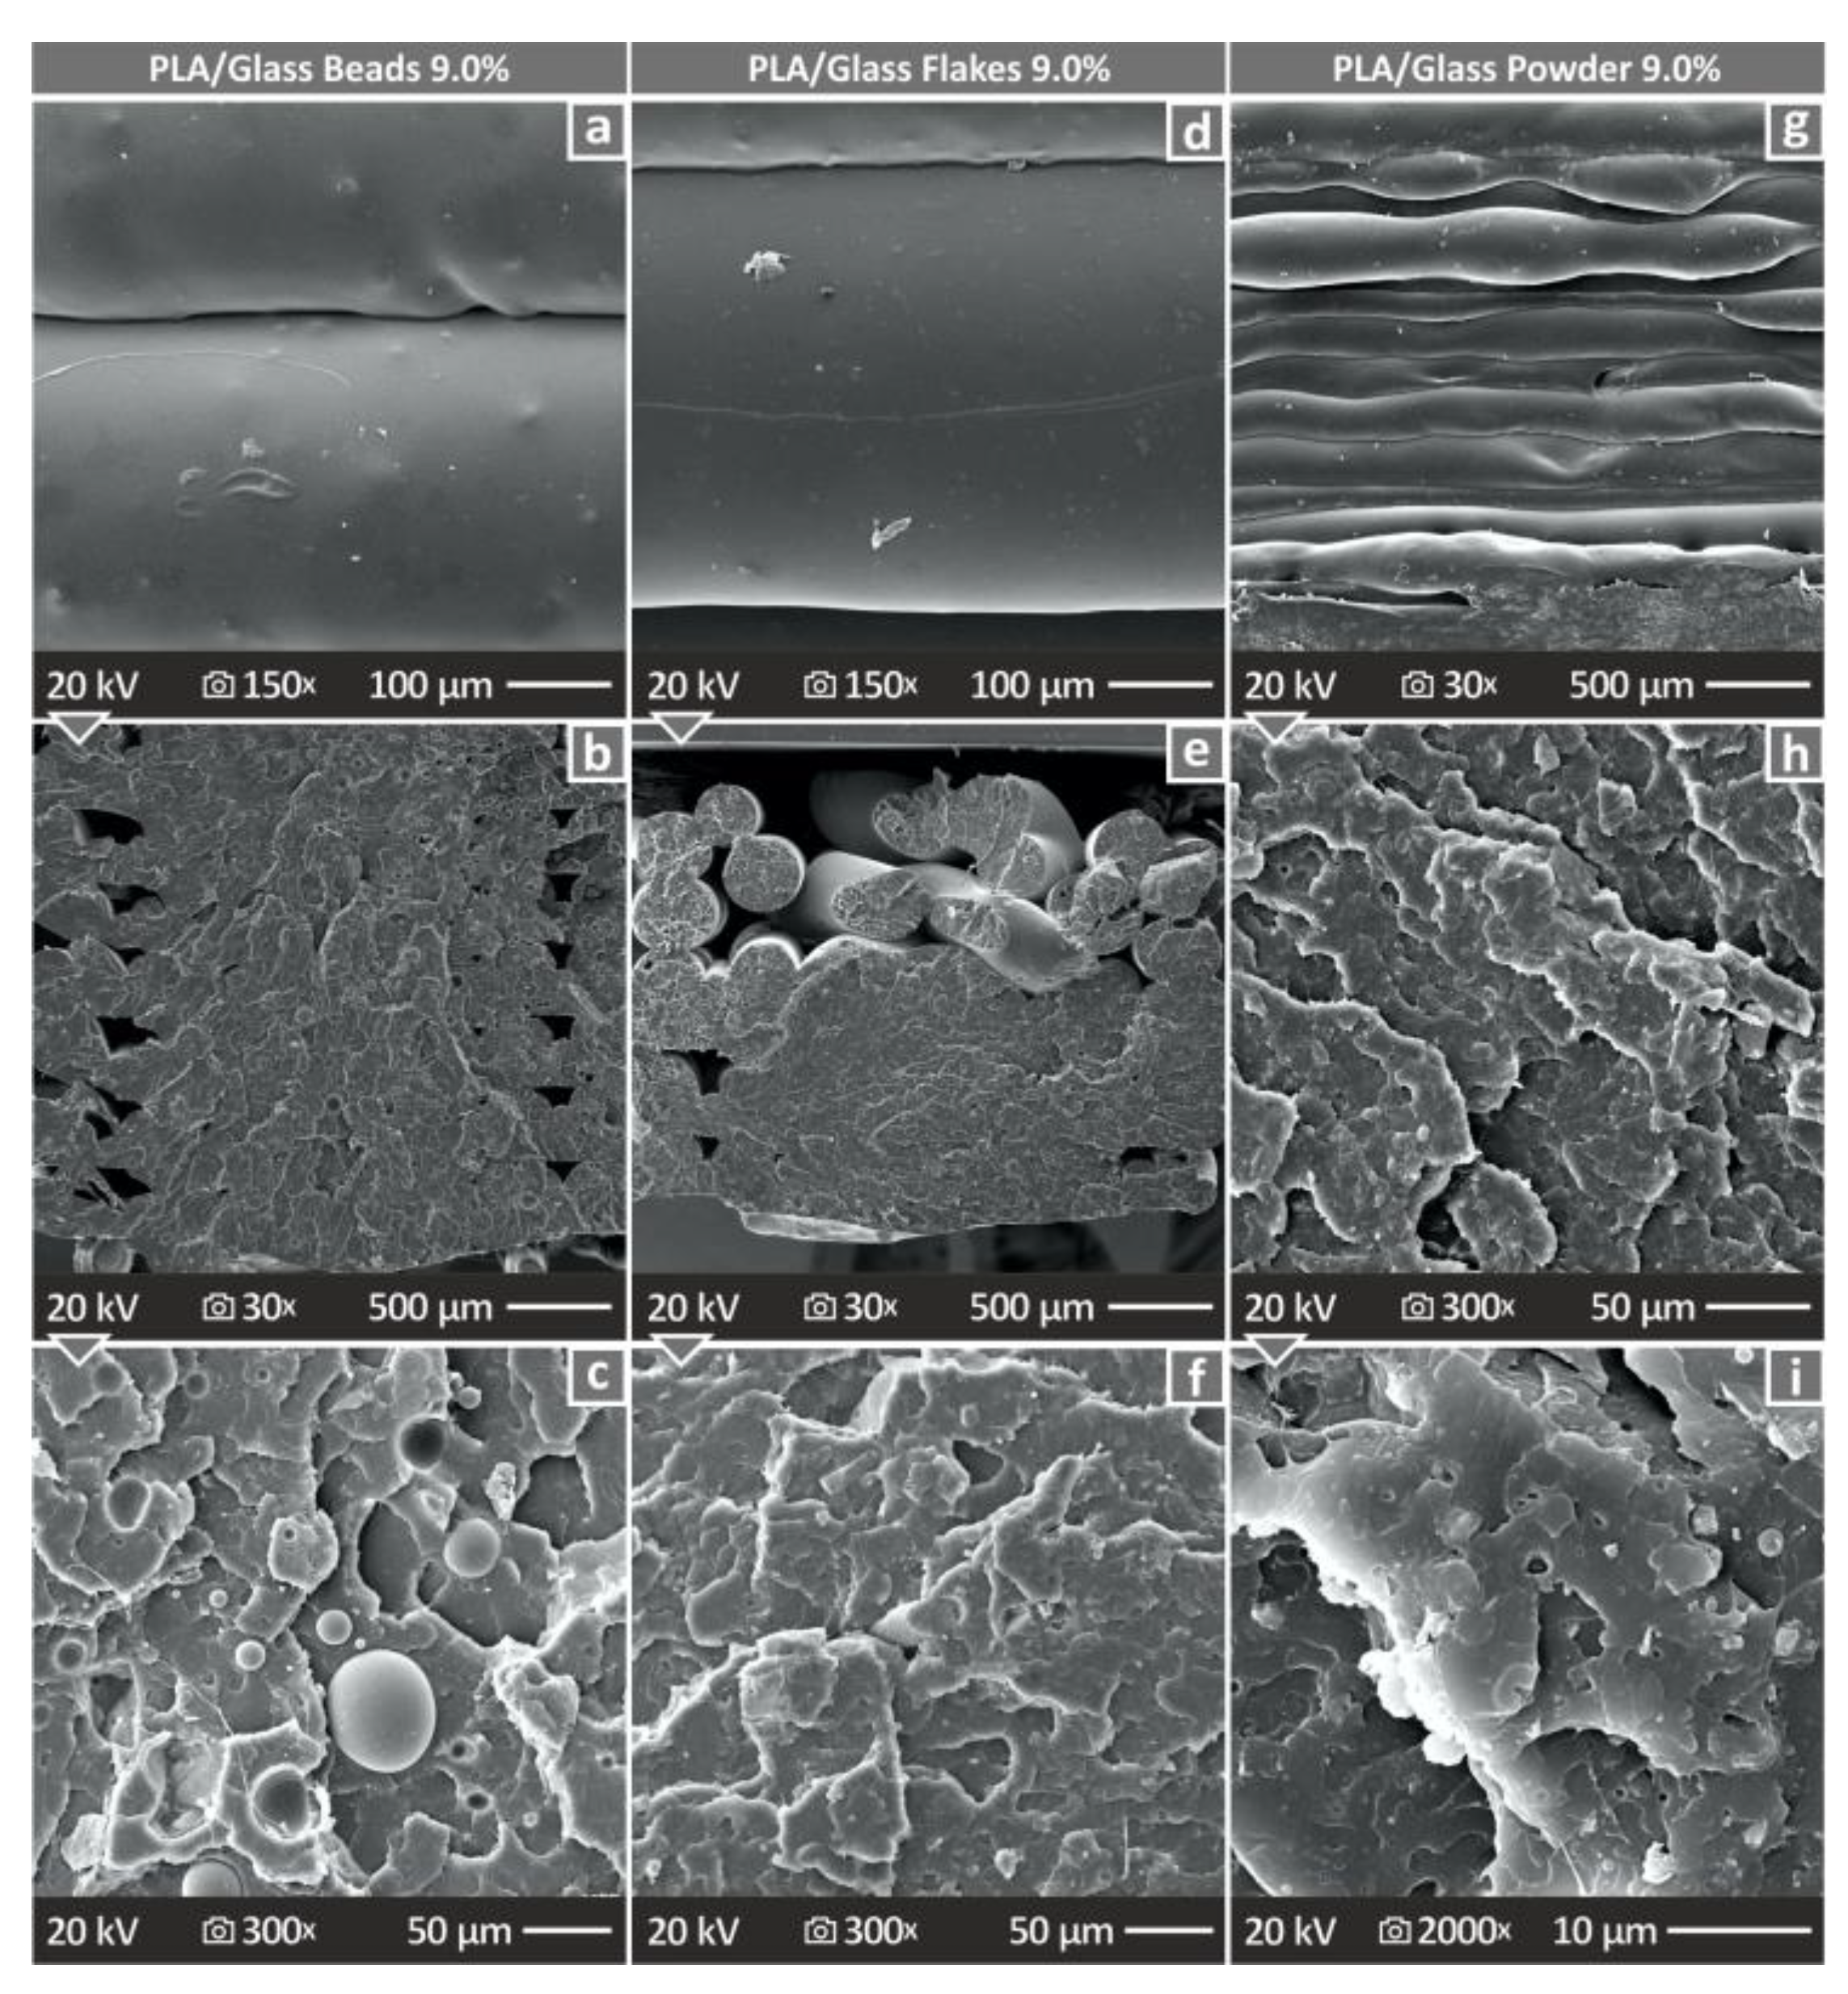
3.5. Analysis of the Morphology of the 3D-Printed Specimens

SEM imaging was used to investigate the fragmentation and side surfaces of the 3D-printed specimens in order to evaluate their morphology. Images of the side surfaces of three tensile test samples, each made up of one of the three types of glass used in this study—PLA/Glass Beads 3.0 wt.%, PLA/Glass Flakes 3.0 wt.%, and PLA/Glass Powder 3.0 wt.%—are shown in Figure 11. Figure 11a,d, and g illustrate pictures of the samples’ side surfaces at a magnification of 150×. Small defects in the layer fusion can be seen in the images. Specifically, in the case of the PLA/Glass Beads 3.0 wt.% sample (Figure 11a), the layer interfusion is not flawless. These flaws can be related to the possibility that the fillers in the matrix have saturated, which will affect how easily the material can be processed during 3D printing [52]. SEM pictures of the fracture surfaces of the tested composites’ tensile specimens, captured at a magnification of 30×, are shown in Figure 11b,e,h. The photos do not display considerable deformation, suggesting a mostly brittle fracture mechanism. Images at a greater magnification of 300× were used to undertake a more thorough inspection of the broken surface (Figure 11c,f,i). There were no agglomerations visible at this degree of magnification. Noteworthy is the presence of glass beads in Figure 11c.
The specimens with 6.0 wt.% of the three types of glass filler underwent the same investigation process. As shown in Figure 12a,d,g, the side surfaces were initially inspected using SEM images at a magnification of 150×. In this instance, the photos reveal that all specimens demonstrate flawless layer interfusion without any flaws or voids. However, the layer shape does not appear to be uniform across the specimens. Micro-voids and micro-porosity were discovered when the fracture surface was examined at a magnification of 30×, especially in specimens of PLA/Glass Beads 6.0 wt.% (Figure 12b). These findings suggest evidence of moisture absorption in the specimens [69,70]. Micro-voids were found in the sample of PLA/Glass Flakes 6.0 wt.% (Figure 12e), primarily in the vicinity of the specimen’s margins. Even when employing a 100% infill ratio, these micro-voids in the 3D-printed structure are acceptable because they result from the MEX 3D printing technique used to build the object layer [71]. A more ductile behavior is discovered after scrutinizing the sample using SEM pictures at 300× (Figure 12c,i), and 150× (Figure 12f) magnification levels. In the fracture sites, deformation is evident.
Finally, both lateral and fracture surface investigations were performed on the specimens with a 9.0 wt.% concentration of each type of glass filler. The images were captured at 150× magnification. The images depict that the samples of PLA/Glass Beads and PLA/Glass Flakes demonstrate faultless layer diffusion with no flaws or cavities. Additionally, these samples appear to have a uniform layer shape, as seen in Figure 13a,d. Figure 13g, on the other hand, depict a sample of PLA/Glass Powder 9.0 wt.% that was acquired at a magnification of 30× and shows that while the fusion between the layers is well-maintained, the creation of the layers is not as well-defined. SEM pictures of the fractured surface of the PLA/Glass Beads compound containing a 9.0 wt.% filler is shown in Figure 13b,c. These pictures are taken at two different magnifications, 30× and 300×, respectively. Micro-voids are clearly visible along the borders of the specimen in Figure 13b due to the utilization of MEX 3D printing technology in the manufacturing process. As mentioned before, it is crucial to remember that even when utilizing a 100% infill ratio, these micro-voids are still recognized as normal in the 3D-printing construction. A ductile behavior was found through the examination of the sample, utilizing SEM images at 300× magnification. It is important to note that glass beads are present, as seen in Figure 13c. Figure 13e, on the other hand, shows the PLA/Glass Flakes 9.0 wt.% specimen, where some discontinuities and faults can be seen in the specimen’s interior structure. The sample also exhibits a rather “brittle” fracture mechanism, as seen in the low magnification photograph (30×). Images of the PLA/Glass Powder 9.0 wt.% sample were captured at greater magnifications compared to the other samples to enable a more thorough examination of the fracture surface. Figure 13h shows a 300× magnified image, whereas Figure 13i shows a 2000× magnified image. In these photos, the specimen’s fracture area exhibits a more ductile response.

4. Discussion

An overview of the mechanical tests performed on the compounds under investigation and the pure PLA polymer is shown in Figure 14. The characteristics regarding the mechanical properties of the material were consistently improved by the addition of various glass particles. The improvement in the mechanical performance caused by the addition of glass particles in different forms (beads, flakes, and powder) may also be influenced by the interactions occurring at the interface between the particles and the matrix [72].
As can be observed in Figure 14, in the majority of the investigations, the PLA/Glass Beads with 3.0 wt.% concentration displayed the highest mechanical response. Particularly, the specimens made with PLA/Glass Beads 3.0 wt.% show notable increases in their flexural properties, including strength and toughness. Additionally, the tensile stiffness has improved significantly. The specimens containing PLA/Glass Flakes 6.0 wt.% show a considerable increase in both the tensile strength (σB) and stiffness when examining the impact of the same type of glass additives. No other mechanical parameter was adversely impacted by the addition of the glass particles, with the exception of the impact strength, which decreased as the filler concentration reached 9.0 wt.%. In conclusion, the unfilled PLA polymer was surpassed in the majority of the investigations, even by the composites with the greatest loading of 9.0 wt.%, which showed superior values in their mechanical properties.
A number of important insights can be gained from the investigation of the microstructure of the 3D-printed samples, especially from their side surface. It enables the assessment of critical data, including the thickness of each printed layer and the general calibration of the 3D printing procedure. Additionally, this study can reveal significant features of the interfaces between the layers and evaluate the strength of their bonding and fusion. SEM pictures demonstrate that, in comparison with pure PLA, the addition of glass fillers to the PLA matrix does not result in the creation of voids on the surface of the 3D-printed samples. It is important to note that there are slight imperfections in the layer-fusing when the layer shape is uneven. The mechanical performance of the composites was unaffected by the 3D printing structure’s imperfections, such as minor flaws in layer fusing and irregular layer shapes. This suggests that the mechanical response of the composites is not adversely affected by these flaws.
It is important to note that TGA analysis shows that the materials used in the MEX procedure are not harmed by the processing temperatures used. This is important since it guarantees that material deterioration will not have a negative impact on the 3D printing process as a whole or the mechanical performance of the samples made using the generated composites. It is also notable that practically every concentration of each glass component consistently improved the mechanical characteristics of the PLA polymer. This demonstrates how adding glass additives has a favorable impact on improving the PLA polymer’s mechanical performance.
The use of glass additives as reinforcement agents for polymers in 3D printing is currently being studied, while as was mentioned in the literature review section, research is still limited. Nonetheless, it shows that efforts are being made to utilize the advantages of glass additives for improving the functionality of polymers in the context of 3D printing. An investigation into the effects of the geometry and filling level of glass dispersion particles on the optical and mechanical characteristics of flexible high-transmission composites based on thermoplastic polyurethane (TPU) showed that adding any filler reduced the tensile strength while increasing the elastic modulus of the composite material [73]. So, the response of TPU upon the addition of glass particles differs from the findings presented herein. Glass spheres, glass flakes, and milling glass fiber were some of the fillers utilized. Notably, the material’s yield strength increased significantly as a result of the addition of glass flakes and the milling of glass fiber [73]. Additionally, glass fiber (GF) is frequently utilized in polylactic acid (PLA) composites as a reinforcing material, but not for MEX 3D printing so far. The mechanical properties of PLA composites are significantly enhanced by the addition of glass fiber, with an approximately 40% improvement. The glass fiber reinforcement acts as a crystallinity-promoting nucleating agent for the composites [74]. Such results agree with the findings of the current study, in which a 33.8% increase in the tensile strength of PLA/Glass Flakes 6 wt.% compared to the unfilled PLA polymer was achieved.
The examined composites’ mechanical and thermal properties have significantly improved as a result of the addition of glass fillers, such as glass beads, glass flakes, and glass powder. The inclusion of glass fillers has improved various mechanical properties while preserving or even increasing tensile strength and stiffness. Additionally, the glass fillers have demonstrated positive benefits on the composites’ thermal stability, with variations depending on the filler’s form and concentration [74]. Overall, the use of glass fillers as reinforcement agents has been successful in improving the composites’ overall performance, opening up possibilities for further study and prospective applications in a variety of industries.
It is also crucial to point out that incorporating glass particles into the PLA matrix to strengthen the polymer’s strength during the production of 3D parts does not result in a significantly higher cost. It should be noted, nevertheless, that the use of three different kinds of glass particles came at an added cost. The price of the raw material needed to prepare PLA (polylactic acid) is approximately EUR 5 per kilogram or EUR 0.005 per gram. The price increases to about EUR 20 per kilogram after this raw material is processed and turned into industrial filament. The cost of the raw materials required to create the filament is approximately one-fourth of the final cost of the filament, which supports the price disparity. The price of the three types of glass particles (beads, flakes, and powder) for laboratory-scale research is approximately EUR 0.4–0.5 per gram. Consider the 3.0 wt.% glass beads compound, which demonstrated the greatest increase in the mechanical response, as an example. In order to add 3.0 wt.% of glass beads to the PLA matrix, additional raw material expenses must be incurred, which are estimated as EUR 0.5/g (the cost of the glass beads) times 0.03 (3.0 wt.%). As a result, the glass bead reinforcing incurs an additional cost of EUR 0.015/g. Since the composite is reinforced with 3.0 wt.% glass beads, the overall cost per gram rises from EUR 0.005/g for pure PLA to EUR 0.02/g. It is important to note that when switching to industrial-scale utilization, this price can be considerably lowered. Economies of scale are advantageous for industrial-scale production and can result in decreased material prices, including glass particles.

5. Conclusions

The goal of this study was to determine how three different varieties of glass particles impacted the performance of the PLA polymer in MEX 3D printing. Glass particles in various shapes and concentrations were used to create PLA-based compounds, with a maximum weight concentration of 9.0% in the polymer matrix. A variety of mechanical tests were used to thoroughly characterize the PLA polymer with glass additions. The evaluation of qualities including impact strength, micro-hardness, tensile strength, and flexural properties, was performed in accordance with international standards. The filaments created by thermomechanical extrusion were also put through tensile testing. This extensive experimental procedure enabled a complete evaluation of the mechanical properties of the PLA composites with glass fillers and offered insightful information about how effectively they performed in 3D printing applications.
The findings of the investigation confirmed the hypothesis, showing that adding glass particles enhanced the mechanical properties of the polymeric matrix. Significant improvements have been observed in most of the mechanical properties of all types of glass particles employed in this study. Among the mechanical parameters examined, flexural strength showed the greatest improvement. In particular, a notable increase of 46.8% was achieved when evaluating the PLA/Glass Beads 3.0 wt.% sample in comparison to pure PLA. Additionally, the PLA/Glass Beads 3.0 wt.% sample’s flexural toughness significantly increased above pure PLA by 31.2%. The results highlight the significance of glass beads as an efficient reinforcement agent, enhancing the durability and performance of the PLA composite in situations where bending load resistance is essential. Additionally, after evaluating the PLA/Glass Flakes 6.0 wt.% sample, the tensile strength showed a substantial improvement of 25.6%. The material’s increased resistance to tensile pressures and deformation is indicated by this improvement.
The thermogravimetric measurements revealed that the inclusion of glass particles had no discernible impact on the thermostability of the thermoplastic polymer. The absence of a substantial change in thermal stability suggests that the addition of glass particles had no adverse effects on the composite materials’ overall thermal performance. This demonstrates that the selected methodology and processing settings are appropriate for the materials under investigation. The investigations of the Raman spectroscopy used in this study provided important insights into the chemical interactions that occurred between the glass particles and the polymeric matrix. According to the findings, neither PLA nor glass particles had any chemical reactions, nor were any alterations to the polymeric matrix’s chemical linkages noted. This result implies that there were no major chemical alterations or reactions brought about by the addition of glass particles to the composite material. These findings open up new directions for research and development in the fields of advanced materials and 3D printing technology by highlighting the potential of glass particles as efficient reinforcement agents for improving the performance of PLA composites in a variety of applications. Such composites expand the fields of application of MEX 3D printing, particularly in areas requiring higher mechanical standards from the 3D printing parts, exploiting the advantages of the process, such as the freedom to produce complex geometry parts in a short span. At the same time, both the matrix and the additives are sustainable and biocompatible materials that can be used in respective types of applications. In future work, additional types of glass particles can be evaluated for their performance as reinforcement agents, and loadings in the composites can be further optimized and the process for their preparation can be upscaled for industrial use.

Author Contributions

Conceptualization, N.V. and M.P.; methodology, N.V.; software, N.M. and P.B.; validation, V.R. and V.P.; formal analysis, N.M., P.B., C.C. and V.P.; investigation, P.B. and C.C.; resources, N.V.; data curation, N.M., V.R. and V.P.; writing—original draft preparation. C.C.; writing—review and editing, M.P.; visualization, N.M.; supervision, N.V.; project administration, N.V.; funding acquisition, N.V. All authors have read and agreed to the published version of the manuscript.

Funding

This research received no external funding.

Institutional Review Board Statement

Not applicable.

Informed Consent Statement

Not applicable.

Data Availability Statement

The data presented in this study are available upon request from the corresponding author.

Acknowledgments

Authors would like to thank the Institute of Electronic Structure and Laser of the Foundation for Research and Technology-Hellas (IESL-FORTH) and in particular Aleka Manousaki for taking the SEM images presented in this work, and the Photonic Phononic and Meta-Materials Laboratory for sharing the Raman Instrumentation.

Conflicts of Interest

The authors declare no conflict of interest.

References

  1. Hajare, D.M.; Gajbhiye, T.S. Additive Manufacturing (3D Printing): Recent Progress on Advancement of Materials and Challenges. Mater. Today Proc. 2022, 58, 736–743. [Google Scholar] [CrossRef]
  2. West, A.P.; Sambu, S.P.; Rosen, D.W. A Process Planning Method for Improving Build Performance in Stereolithography. Comput.-Aided Des. 2001, 33, 65–79. [Google Scholar] [CrossRef]
  3. Kruth, J.P.; Wang, X.; Laoui, T.; Froyen, L. Lasers and Materials in Selective Laser Sintering. Assem. Autom. 2003, 23, 357–371. [Google Scholar] [CrossRef]
  4. Dudek, P. FDM 3D Printing Technology in Manufacturing Composite Elements. Arch. Metall. Mater. 2013, 58, 1415–1418. [Google Scholar] [CrossRef]
  5. Yasa, E.; Ersoy, K. Dimensional Accuracy and Mechanical Properties of Chopped Carbon Reinforced Polymers Produced by Material Extrusion Additive Manufacturing. Materials 2019, 12, 3885. [Google Scholar] [CrossRef]
  6. Velu, R.; Jayashankar, D.K.; Subburaj, K. Chapter 20—Additive Processing of Biopolymers for Medical Applications. In Additive Manufacturing; Pou, J., Riveiro, A., Davim, J.P., Eds.; Elsevier: Amsterdam, The Netherlands, 2021; pp. 635–659. ISBN 978-0-12-818411-0. [Google Scholar]
  7. Pulipaka, A.; Gide, K.M.; Beheshti, A.; Bagheri, Z.S. Effect of 3D Printing Process Parameters on Surface and Mechanical Properties of FFF-Printed PEEK. J. Manuf. Process. 2023, 85, 368–386. [Google Scholar] [CrossRef]
  8. Tekinalp, H.L.; Kunc, V.; Velez-Garcia, G.M.; Duty, C.E.; Love, L.J.; Naskar, A.K.; Blue, C.A.; Ozcan, S. Highly Oriented Carbon Fiber–Polymer Composites via Additive Manufacturing. Compos. Sci. Technol. 2014, 105, 144–150. [Google Scholar] [CrossRef]
  9. Vidakis, N.; Petousis, M.; Korlos, A.; Velidakis, E.; Mountakis, N.; Charou, C.; Myftari, A. Strain Rate Sensitivity of Polycarbonate and Thermoplastic Polyurethane for Various 3D Printing Temperatures and Layer Heights. Polymers 2021, 13, 2752. [Google Scholar] [CrossRef]
  10. García Plaza, E.; Núñez López, P.J.; Caminero Torija, M.Á.; Chacón Muñoz, J.M. Analysis of PLA Geometric Properties Processed by FFF Additive Manufacturing: Effects of Process Parameters and Plate-Extruder Precision Motion. Polymers 2019, 11, 1581. [Google Scholar] [CrossRef]
  11. Pierre, J.; Iervolino, F.; Farahani, R.D.; Piccirelli, N.; Lévesque, M.; Therriault, D. Material Extrusion Additive Manufacturing of Multifunctional Sandwich Panels with Load-Bearing and Acoustic Capabilities for Aerospace Applications. Addit. Manuf. 2023, 61, 103344. [Google Scholar] [CrossRef]
  12. Andrés, M.S.; Chércoles, R.; Navarro, E.; de la Roja, J.M.; Gorostiza, J.; Higueras, M.; Blanch, E. Use of 3D Printing PLA and ABS Materials for Fine Art. Analysis of Composition and Long-Term Behaviour of Raw Filament and Printed Parts. J. Cult. Herit. 2023, 59, 181–189. [Google Scholar] [CrossRef]
  13. Vidakis, N.; Kechagias, J.D.; Petousis, M.; Vakouftsi, F.; Mountakis, N. The Effects of FFF 3D Printing Parameters on Energy Consumption. Mater. Manuf. 2022, 38, 915–932. [Google Scholar] [CrossRef]
  14. Vidakis, N.; Petousis, M.; Kechagias, J.D. Parameter Effects and Process Modelling of Polyamide 12 3D-Printed Parts Strength and Toughness. Mater. Manuf. Process. 2022, 37, 1358–1369. [Google Scholar] [CrossRef]
  15. Buj-Corral, I.; Bagheri, A.; Sivatte-Adroer, M. Effect of Printing Parameters on Dimensional Error, Surface Roughness and Porosity of FFF Printed Parts with Grid Structure. Polymers 2021, 13, 1213. [Google Scholar] [CrossRef] [PubMed]
  16. Dickson, A.N.; Barry, J.N.; McDonnell, K.A.; Dowling, D.P. Fabrication of Continuous Carbon, Glass and Kevlar Fibre Reinforced Polymer Composites Using Additive Manufacturing. Addit. Manuf. 2017, 16, 146–152. [Google Scholar] [CrossRef]
  17. Ivanova, O.; Williams, C.; Campbell, T. Additive Manufacturing (AM) and Nanotechnology: Promises and Challenges. Rapid Prototyp. J. 2013, 19, 353–364. [Google Scholar] [CrossRef]
  18. Wang, X.; Jiang, M.; Zhou, Z.; Gou, J.; Hui, D. 3D Printing of Polymer Matrix Composites: A Review and Prospective. Compos. B Eng. 2017, 110, 442–458. [Google Scholar] [CrossRef]
  19. Wang, J.; Xie, H.; Weng, Z.; Senthil, T.; Wu, L. A Novel Approach to Improve Mechanical Properties of Parts Fabricated by Fused Deposition Modeling. Mater. Des. 2016, 105, 152–159. [Google Scholar] [CrossRef]
  20. Ning, F.; Cong, W.; Hu, Z.; Huang, K. Additive Manufacturing of Thermoplastic Matrix Composites Using Fused Deposition Modeling: A Comparison of Two Reinforcements. J. Compos. Mater. 2017, 51, 3733–3742. [Google Scholar] [CrossRef]
  21. Zhong, W.; Li, F.; Zhang, Z.; Song, L.; Li, Z. Short Fiber Reinforced Composites for Fused Deposition Modeling. Mater. Sci. Eng. A 2001, 301, 125–130. [Google Scholar] [CrossRef]
  22. Parsons, A. 2—Reinforcing Fibres. In Woodhead Publishing Series in Composites Science and Engineering; Woodhead Publishing: Sawston, UK, 2023; pp. 19–34. ISBN 978-0-12-819160-6. [Google Scholar]
  23. Jones, F.R.; Huff, N.T. 19—The Structure and Properties of Glass Fibers. In Handbook of Properties of Textile and Technical Fibres, 2nd ed.; Bunsell, A.R., Ed.; Woodhead Publishing: Sawston, UK, 2018; pp. 757–803. ISBN 978-0-08-101272-7. [Google Scholar]
  24. Sathishkumar, T.P.; Satheeshkumar, S.; Naveen, J. Glass Fiber-Reinforced Polymer Composites—A Review. J. Reinf. Plast. Compos. 2014, 33, 1258–1275. [Google Scholar] [CrossRef]
  25. Kumar Sharma, S.; Mehta, S. Experimental Study on Effect of Glass Fibre on Concrete Using Recycled Aggregate. Mater. Today Proc. 2023; in press. [Google Scholar] [CrossRef]
  26. Arunakanthi, E.; Chaitanya Kumar, J.D. Experimental Studies on Fiber Reinforced Concrete (FRC). Int. J. Civil Eng. Technol. 2016, 7, 329–336. [Google Scholar]
  27. Wang, G.; Yang, J. Influences of Glass Flakes on Fire Protection and Water Resistance of Waterborne Intumescent Fire Resistive Coating for Steel Structure. Prog. Org. Coat. 2011, 70, 150–156. [Google Scholar] [CrossRef]
  28. Franklin, P.; Wood, D.J.; Bubb, N.L. Reinforcement of Poly(Methyl Methacrylate) Denture Base with Glass Flake. Dent. Mater. 2005, 21, 365–370. [Google Scholar] [CrossRef]
  29. Spanoudakis, J.; Young, R.J. Crack Propagation in a Glass Particle-Filled Epoxy Resin. J. Mater. Sci. 1984, 19, 487–496. [Google Scholar] [CrossRef]
  30. Amdouni, N.; Sautereau, H.; Gerard, J.F. Epoxy Composites Based on Glass Beads. II. Mechanical Properties. J. Appl. Polym. Sci. 1992, 46, 1723–1735. [Google Scholar] [CrossRef]
  31. Debnath, S.; Wunder, S.L.; McCool, J.I.; Baran, G.R. Silane Treatment Effects on Glass/Resin Interfacial Shear Strengths. Dent. Mater. 2003, 19, 441–448. [Google Scholar] [CrossRef]
  32. Mallick, P.K.; Broutman, L.J. Mechanical and Fracture Behaviour of Glass Bead Filled Epoxy Composites. Mater. Sci. Eng. 1975, 18, 63–73. [Google Scholar] [CrossRef]
  33. Saribiyik, M.; Piskin, A.; Saribiyik, A. The Effects of Waste Glass Powder Usage on Polymer Concrete Properties. Constr. Build Mater. 2013, 47, 840–844. [Google Scholar] [CrossRef]
  34. McKeen, L. 12—Renewable Resource and Biodegradable Polymers. In The Effect of Sterilization on Plastics and Elastomers, 3rd ed.; McKeen, L., Ed.; William Andrew Publishing: Boston, MA, USA, 2012; pp. 305–317. ISBN 978-1-4557-2598-4. [Google Scholar]
  35. Hu, Y.; Jiang, X.; Ding, Y.; Zhang, L.; Yang, C.; Zhang, J.; Chen, J.; Yang, Y. Preparation and Drug Release Behaviors of Nimodipine-Loaded Poly(Caprolactone)–Poly(Ethylene Oxide)–Polylactide Amphiphilic Copolymer Nanoparticles. Biomaterials 2003, 24, 2395–2404. [Google Scholar] [CrossRef] [PubMed]
  36. Miao, Y.; Rousseau, C.; Mortreux, A.; Martin, P.; Zinck, P. Access to New Carbohydrate-Functionalized Polylactides via Organocatalyzed Ring-Opening Polymerization. Polymer 2011, 52, 5018–5026. [Google Scholar] [CrossRef]
  37. Arrieta, M.P.; Samper, M.D.; Aldas, M.; López, J. On the Use of PLA-PHB Blends for Sustainable Food Packaging Applications. Materials 2017, 10, 1008. [Google Scholar] [CrossRef] [PubMed]
  38. DeStefano, V.; Khan, S.; Tabada, A. Applications of PLA in Modern Medicine. Eng. Regen. 2020, 1, 76–87. [Google Scholar] [CrossRef]
  39. Hatti-Kaul, R.; Nilsson, L.J.; Zhang, B.; Rehnberg, N.; Lundmark, S. Designing Biobased Recyclable Polymers for Plastics. Trends Biotechnol. 2020, 38, 50–67. [Google Scholar] [CrossRef] [PubMed]
  40. Vidakis, N.; Petousis, M.; Maniadi, A.; Koudoumas, E.; Vairis, A.; Kechagias, J. Sustainable Additive Manufacturing: Mechanical Response of Acrylonitrile-Butadiene-Styrene over Multiple Recycling Processes. Sustainability 2020, 12, 3568. [Google Scholar] [CrossRef]
  41. Kechagias, J.D.; Vidakis, N.; Petousis, M.; Mountakis, N. A Multi-Parametric Process Evaluation of the Mechanical Response of PLA in FFF 3D Printing. Mater. Manuf. Process. 2022, 38, 941–953. [Google Scholar] [CrossRef]
  42. Vidakis, N.; Petousis, M.; Velidakis, E.; Liebscher, M.; Mechtcherine, V.; Tzounis, L. On the Strain Rate Sensitivity of Fused Filament Fabrication (Fff) Processed Pla, Abs, Petg, Pa6, and Pp Thermoplastic Polymers. Polymers 2020, 12, 2924. [Google Scholar] [CrossRef]
  43. Abeykoon, C.; Sri-Amphorn, P.; Fernando, A. Optimization of Fused Deposition Modeling Parameters for Improved PLA and ABS 3D Printed Structures. Int. J. Lightweight Mater. Manuf. 2020, 3, 284–297. [Google Scholar] [CrossRef]
  44. Afonso, J.A.; Alves, J.L.; Caldas, G.; Gouveia, B.P.; Santana, L.; Belinha, J. Influence of 3D Printing Process Parameters on the Mechanical Properties and Mass of PLA Parts and Predictive Models. Rapid Prototyp. J. 2021, 27, 487–495. [Google Scholar] [CrossRef]
  45. Vidakis, N.; David, C.; Petousis, M.; Sagris, D.; Mountakis, N.; Moutsopoulou, A. The Effect of Six Key Process Control Parameters on the Surface Roughness, Dimensional Accuracy, and Porosity in Material Extrusion 3D Printing of Polylactic Acid: Prediction Models and Optimization Supported by Robust Design Analysis. Adv. Ind. Manuf. Eng. 2022, 5, 100104. [Google Scholar] [CrossRef]
  46. Petousis, M.; Vidakis, N.; Mountakis, N.; Karapidakis, E.; Moutsopoulou, A. Functionality Versus Sustainability for PLA in MEX 3D Printing: The Impact of Generic Process Control Factors on Flexural Response and Energy Efficiency. Polymers 2023, 15, 1232. [Google Scholar] [CrossRef] [PubMed]
  47. Petousis, M.; Vidakis, N.; Mountakis, N.; Papadakis, V.; Tzounis, L. Three-Dimensional Printed Polyamide 12 (PA12) and Polylactic Acid (PLA) Alumina (Al2O3) Nanocomposites with Significantly Enhanced Tensile, Flexural, and Impact Properties. Nanomaterials 2022, 12, 4292. [Google Scholar] [CrossRef]
  48. Vidakis, N.; Petousis, M.; Kourinou, M.; Velidakis, E.; Mountakis, N.; Fischer-Griffiths, P.E.; Grammatikos, S.; Tzounis, L. Additive Manufacturing of Multifunctional Polylactic Acid (PLA)—Multiwalled Carbon Nanotubes (MWCNTs) Nanocomposites. Nanocomposites 2021, 7, 184–199. [Google Scholar] [CrossRef]
  49. Vidakis, N.; Petousis, M.; Savvakis, K.; Maniadi, A.; Koudoumas, E. A Comprehensive Investigation of the Mechanical Behavior and the Dielectrics of Pure Polylactic Acid (PLA) and PLA with Graphene (GnP) in Fused Deposition Modeling (FDM). Int. J. Plast. Technol. 2019, 23, 195–206. [Google Scholar] [CrossRef]
  50. Tian, X.; Liu, T.; Yang, C.; Wang, Q.; Li, D. Interface and Performance of 3D Printed Continuous Carbon Fiber Reinforced PLA Composites. Compos. Part A Appl. Sci. Manuf. 2016, 88, 198–205. [Google Scholar] [CrossRef]
  51. Tümer, E.H.; Erbil, H.Y. Extrusion-Based 3D Printing Applications of PLA Composites: A Review. Coatings 2021, 11, 390. [Google Scholar] [CrossRef]
  52. Petousis, M.; Vidakis, N.; Mountakis, N.; Papadakis, V.; Kanellopoulou, S.; Gaganatsiou, A.; Stefanoudakis, N.; Kechagias, J. Multifunctional Material Extrusion 3D-Printed Antibacterial Polylactic Acid (PLA) with Binary Inclusions: The Effect of Cuprous Oxide and Cellulose Nanofibers. Fibers 2022, 10, 52. [Google Scholar] [CrossRef]
  53. Vidakis, N.; Petousis, M.; Velidakis, E.; Liebscher, M.; Tzounis, L. Three-Dimensional Printed Antimicrobial Objects of Polylactic Acid (PLA)-Silver Nanoparticle Nanocomposite Filaments Produced by an In-Situ Reduction Reactive Melt Mixing Process. Biomimetics 2020, 5, 42. [Google Scholar] [CrossRef]
  54. Tzounis, L.; Bangeas, P.I.; Exadaktylos, A.; Petousis, M.; Vidakis, N. Three-Dimensional Printed Polylactic Acid (PLA) Surgical Retractors with Sonochemically Immobilized Silver Nanoparticles: The next Generation of Low-Cost Antimicrobial Surgery Equipment. Nanomaterials 2020, 10, 985. [Google Scholar] [CrossRef]
  55. Domínguez-Robles, J.; Martin, N.K.; Fong, M.L.; Stewart, S.A.; Irwin, N.J.; Rial-Hermida, M.I.; Donnelly, R.F.; Larrañeta, E. Antioxidant PLA Composites Containing Lignin for 3D Printing Applications: A Potential Material for Healthcare Applications. Pharmaceutics 2019, 11, 165. [Google Scholar] [CrossRef] [PubMed]
  56. Petousis, M.; Ninikas, K.; Vidakis, N.; Mountakis, N.; Kechagias, J.D. Multifunctional PLA/CNTs Nanocomposites Hybrid 3D Printing Integrating Material Extrusion and CO2 Laser Cutting. J. Manuf. Process. 2023, 86, 237–252. [Google Scholar] [CrossRef]
  57. Kechagias, J.D.; Vidakis, N.; Ninikas, K.; Petousis, M.; Vaxevanidis, N.M. Hybrid 3D Printing of Multifunctional Polylactic Acid/Carbon Black Nanocomposites Made with Material Extrusion and Post-Processed with CO2 Laser Cutting. Int. J. Adv. Manuf. Technol. 2022, 124, 1843–1861. [Google Scholar] [CrossRef]
  58. Vidakis, N.; Petousis, M.; Mountakis, N.; Kechagias, J.D. Material Extrusion 3D Printing and Friction Stir Welding: An Insight into the Weldability of Polylactic Acid Plates Based on a Full Factorial Design. Int. J. Adv. Manuf. Technol. 2022, 121, 3817–3839. [Google Scholar] [CrossRef]
  59. Chen, K.; Yu, L.; Cui, Y.; Jia, M.; Pan, K. Optimization of Printing Parameters of 3D-Printed Continuous Glass Fiber Reinforced Polylactic Acid Composites. Thin-Walled Struct. 2021, 164, 107717. [Google Scholar] [CrossRef]
  60. Vijayan, D.S.; Mohan, A.; Jebasingh Daniel, J.; Gokulnath, V.; Saravanan, B.; Kumar, P.D. Experimental Investigation on the Ecofriendly External Wrapping of Glass Fiber Reinforced Polymer in Concrete Columns. Adv. Mater. Sci. Eng. 2021, 2021, 2909033. [Google Scholar] [CrossRef]
  61. Shahrubudin, N.; Lee, T.C.; Ramlan, R. An Overview on 3D Printing Technology: Technological, Materials, and Applications. Procedia Manuf. 2019, 35, 1286–1296. [Google Scholar] [CrossRef]
  62. Lin, Z.; Guo, X.; He, Z.; Liang, X.; Wang, M.; Jin, G. Thermal Degradation Kinetics Study of Molten Polylactide Based on Raman Spectroscopy. Polym. Eng. Sci. 2020, 61, 201–210. [Google Scholar] [CrossRef]
  63. Resta, V.; Quarta, G.; Lomascolo, M.; Maruccio, L.; Calcagnile, L. Raman and Photoluminescence Spectroscopy of Polycarbonate Matrices Irradiated with Different Energy 28Si+ Ions. Vacuum 2015, 116, 82–89. [Google Scholar] [CrossRef]
  64. Zimmerer, C.; Matulaitiene, I.; Niaura, G.; Reuter, U.; Janke, A.; Boldt, R.; Sablinskas, V.; Steiner, G. Nondestructive Characterization of the Polycarbonate-Octadecylamine Interface by Surface Enhanced Raman Spectroscopy. Polym. Test. 2019, 73, 152–158. [Google Scholar] [CrossRef]
  65. Stuart, B.H. Temperature Studies of Polycarbonate Using Fourier Transform Raman Spectroscopy. Polym. Bull. 1996, 36, 341–346. [Google Scholar] [CrossRef]
  66. Zou, H.; Yi, C.; Wang, L.; Liu, H.; Xu, W. Thermal Degradation of Poly(Lactic Acid) Measured by Thermogravimetry Coupled to Fourier Transform Infrared Spectroscopy. J. Therm. Anal. Calorim. 2009, 97, 929–935. [Google Scholar] [CrossRef]
  67. Makarem, M.; Lee, C.M.; Kafle, K.; Huang, S.; Chae, I.; Yang, H.; Kubicki, J.D.; Kim, S.H. Probing Cellulose Structures with Vibrational Spectroscopy. Cellulose 2019, 26, 35–79. [Google Scholar] [CrossRef]
  68. Liu, X.; Zou, Y.; Li, W.; Cao, G.; Chen, W. Kinetics of Thermo-Oxidative and Thermal Degradation of Poy(D,L-Lactide) (PDLLA) at Processing Temperature. Polym. Degrad. Stabil. 2006, 91, 3259–3265. [Google Scholar] [CrossRef]
  69. Song, Y.; Li, Y.; Song, W.; Yee, K.; Lee, K.-Y.; Tagarielli, V.L. Measurements of the Mechanical Response of Unidirectional 3D-Printed PLA. Mater. Des. 2017, 123, 154–164. [Google Scholar] [CrossRef]
  70. Yavas, D.; Zhang, Z.; Liu, Q.; Wu, D. Fracture Behavior of 3D Printed Carbon Fiber-Reinforced Polymer Composites. Compos. Sci. Technol. 2021, 208, 108741. [Google Scholar] [CrossRef]
  71. Vidakis, N.; Mangelis, P.; Petousis, M.; Mountakis, N.; Papadakis, V.; Moutsopoulou, A.; Tsikritzis, D. Mechanical Reinforcement of ABS with Optimized Nano Titanium Nitride Content for Material Extrusion 3D Printing. Nanomaterials 2023, 13, 669. [Google Scholar] [CrossRef] [PubMed]
  72. Tzounis, L.; Hegde, M.; Liebscher, M.; Dingemans, T.; Pötschke, P.; Paipetis, A.S.; Zafeiropoulos, N.E.; Stamm, M. All-Aromatic SWCNT-Polyetherimide Nanocomposites for Thermal Energy Harvesting Applications. Compos. Sci. Technol. 2018, 156, 158–165. [Google Scholar] [CrossRef]
  73. Kobykhno, I.; Kiryanov, A.; Klinkov, V.; Chebotareva, A.; Evlashin, S.; Ju, D.; Wu, Y.; Semencha, A.; Zhao, H.; Tolochko, O. Effect of Glass Filler Geometry on the Mechanical and Optical Properties of Highly Transparent Polymer Composite. Polymers 2022, 14, 5179. [Google Scholar] [CrossRef]
  74. Sun, Y.; Zheng, Z.; Wang, Y.; Yang, B.; Wang, J.; Mu, W. PLA Composites Reinforced with Rice Residues or Glass Fiber—A Review of Mechanical Properties, Thermal Properties, and Biodegradation Properties. J. Polym. Res. 2022, 29, 422. [Google Scholar] [CrossRef]
Figure 1. The specific steps taken in the experimental approach and its process flow illustrated in screenshots (a) raw materials, (b) drying process, (c) filament extrusion, (d) filament drying, (e) filament quality control, (f) filament tensile testing, (g) samples 3D printing, (h) 3D printed samples, (i) three-point bending test, (j) tensile test, (km) SEM analysis on the fracture surface at various magnifications.
Applsci 13 06471 g001
Figure 2. Investigation of Glass Fillers: (a) SEM image of Glass Beads at 1000× magnification, (b) SEM image of Glass Beads at 5000× magnification on the region indicated in (a), (c) EDS mapping for the Glass Beads filler on the region indicated in (b), (d) SEM image of Glass Flakes at 1000× magnification, (e) SEM image of Glass Flakes at 5000× magnification on the region indicated in (d), (f) EDS mapping for the Glass Flakes filler on the region indicated in (e), (g) SEM image of Glass Powder at 1000× magnification, (h) SEM image of Glass Powder at 5000× magnification on the region indicated in (g), (i) EDS mapping for the Glass Powder filler on the region indicated in (h).
Applsci 13 06471 g002
Figure 3. 3D printing parameters for specimen manufacturing: Specimens produced using the specified 3D printing settings as displayed on the left side of the figure. On the right side, the geometry of the specimens, their 3D printing structure, and the respective standard applied in each mechanical test are presented. The infill pattern angle is altered by 90 deg between successive layers, as indicated by the arrows in the samples.
Applsci 13 06471 g003
Figure 4. Thermal Decomposition of pure PLA and PLA/Glass Fillers Compounds: (a) TGA curves for pure PLA, PLA/Glass Beads 3.0 wt.%, PLA/Glass Flakes 3.0 wt.%, PLA/Glass Powder 3.0 wt.%, (b) DTGA curves for pure PLA, PLA/Glass Beads 3.0 wt.%, PLA/Glass Flakes 3.0 wt.%, PLA/Glass Powder 3.0 wt.%, (c) TGA curves for pure PLA, PLA/Glass Beads 6.0 wt.%, PLA/Glass Flakes 6.0 wt.%, PLA/Glass Powder 6.0 wt.%, (d) DTGA curves for pure PLA, PLA/Glass Beads 6.0 wt.%, PLA/Glass Flakes 6.0 wt.%, PLA/Glass Powder 6.0 wt.%, (e) TGA curves for pure PLA, PLA/Glass Beads 9.0 wt.%, PLA/Glass Flakes 9.0 wt.%, PLA/Glass Powder 9.0 wt.%, (f) DTGA curves for pure PLA, PLA/Glass Beads 9.0 wt.%, PLA/Glass Flakes 9.0 wt.%, PLA/Glass Powder 9.0 wt.%.
Applsci 13 06471 g004
Figure 5. Raman spectra from (a) pure PLA, PLA/Glass Beads 3 wt.%, 6 wt.%, 9 wt.%; (b) the differences of PLA/Glass Beads from pure PLA; (c) pure PLA, PLA/Glass Flakes 3 wt.%, 6 wt.%, 9 wt.%; (d) the differences of PLA/Glass Flakes from pure PLA; (e) pure PLA, PLA/Glass Powder 3 wt.%, 6 wt.%, 9 wt.%, (f) the differences of PLA/Glass Powder from pure PLA.
Applsci 13 06471 g005
Figure 6. Analysis of filament side surfaces using AFM: (a) PLA/Glass Beads 3.0 wt.%, (b) PLA/Glass Beads 6.0 wt.%, (c) PLA/Glass Beads 9.0 wt.%, (d) PLA/Glass Flakes 3.0 wt.%, (e) PLA/Glass Flakes 6.0 wt.%, (f) PLA/Glass Flakes 9.0 wt.%, (g) PLA/Glass Powder 3.0 wt.%, (h) PLA/Glass Powder 6.0 wt.%, (i) PLA/Glass Powder 9.0 wt.%, and graphs representing the correlation between the glass beads, flakes, and powder content and the surface roughness parameters in the compounds are shown: (j) Rq, (k) Ra, (l) Rz.
Applsci 13 06471 g006
Figure 7. Visual inspection and diameter measurements of extruded filament segments: (a) Pure PLA filament, (b) PLA/Glass Beads 6.0 wt.% filament, (c) PLA/Glass Flakes 6.0 wt.% filament, (d) PLA/Glass Powder 6.0 wt.% filament, and (e) tensile test results, (f) modulus of elasticity results for fabricated filaments.
Applsci 13 06471 g007
Figure 8. Tensile test results for all 3D-Printed samples: (a) graphs illustrating the relationship between tensile stress and calculated strain from one randomly selected 3D-printed specimen for each composite, (b) tensile strength results, and (c) tensile modulus of elasticity results. Each compound is presented in a different color according to the legend below the graphs.
Applsci 13 06471 g008
Figure 9. Flexural test results for all 3D-printed samples: (a) graphs depicting the relationship between flexural stress and calculated strain from one randomly selected 3D-printed specimen for each composite. The experiment terminated at 5% strain, following the ASTM D790 standard instructions. Mean values and deviations are shown in (b) flexural strength results, and (c) flexural modulus of elasticity results. Each compound is presented in a different color according to the legend below the graphs.
Applsci 13 06471 g009
Figure 10. Results (mean values and deviation) for various testing parameters: (a) Impact strength, (b) Vickers microhardness, (c) Tensile toughness tension for all manufactured filaments, (d) Tensile toughness tension for all manufactured samples, and (e) Flexural toughness tension for all manufactured samples. Each compound is presented in a different color according to the legend below the graphs.
Applsci 13 06471 g010
Figure 11. SEM pictures for (a) side surface of PLA/Glass Beads 3.0 wt.% specimen at 150× magnification, (b) fracture surface of PLA/Glass Beads 3.0 wt.% specimen at 30× magnification, (c) fracture surface of PLA/Glass Beads 3.0 wt.% specimen at 300× magnification, (d) side surface of PLA/Glass Flakes 3.0 wt.% specimen at 150× magnification, (e) fracture surface of PLA/Glass Flakes 3.0 wt.% specimen at 30× magnification, (f) fracture surface of PLA/Glass Flakes 3.0 wt.% specimen at 300× magnification, (g) side surface of PLA/Glass Powder 3.0 wt.% specimen at 150× magnification, (h) fracture surface of PLA/Glass Powder 3.0 wt.% specimen at 30× magnification, and (i) fracture surface of PLA/Glass Powder 3.0 wt.% specimen at 300× magnification.
Applsci 13 06471 g011
Figure 12. SEM pictures for (a) side surface of PLA/Glass Beads 6.0 wt.% specimen at 150× magnification, (b) fracture surface of PLA/Glass Beads 6.0 wt.% specimen at 30× magnification, (c) fracture surface of PLA/Glass Beads 6.0 wt.% specimen at 300× magnification, (d) side surface of PLA/Glass Flakes 6.0 wt.% specimen at 150× magnification, (e) fracture surface of PLA/Glass Flakes 6.0 wt.% specimen at 30× magnification, (f) fracture surface of PLA/Glass Flakes 6.0 wt.% specimen at 150× magnification, (g) side surface of PLA/Glass Powder 6.0 wt.% specimen at 150× magnification, (h) fracture surface of PLA/Glass Powder 6.0 wt.% specimen at 30× magnification, and (i) fracture surface of PLA/Glass Powder 6.0 wt.% specimen at 150× magnification.
Applsci 13 06471 g012
Figure 13. SEM pictures for (a) side surface of PLA/Glass Beads 9.0 wt.% specimen at 150× magnification, (b) fracture surface of PLA/Glass Beads 9.0 wt.% specimen at 30× magnification, (c) fracture surface of PLA/Glass Beads 9.0 wt.% specimen at 300× magnification, (d) side surface of PLA/Glass Flakes 9.0 wt.% specimen at 150× magnification, (e) fracture surface of PLA/Glass Flakes 9.0 wt.% specimen at 30× magnification, (f) fracture surface of PLA/Glass Flakes 9.0 wt.% specimen at 300× magnification, (g) side surface of PLA/Glass Powder 9.0 wt.% specimen at 30× magnification, (h) fracture surface of PLA/Glass Powder 9.0 wt.% specimen at 300× magnification, and (i) fracture surface of PLA/Glass Powder 9.0 wt.% specimen at 2000× magnification.
Applsci 13 06471 g013
Figure 14. The mechanical characteristics of the examined 3D-printed samples are depicted in the left-side spider diagram. The performance of the pure PLA, which was produced and tested as a benchmark for assessing the acquired improvement, is represented by the gray region. The materials showing the highest mechanical reaction in each experiment are listed in the table on the right. Each compound is presented in a different color according to the legend provided.
Applsci 13 06471 g014
Table 1. Major Raman peaks of pure PLA identified and their related assignments.
Wavenumber (cm−1)IntensityRaman Peak Assignment
870MediumC-COO stretching [62]
1040SmallC-CH3 stretching [62]
1059SmallC−C asymmetric stretching
1126MediumC-O-C stretch [63]
1293MediumC-O-C stretch [63]; C-H2 twisting [64]
1413SmallC-H3 deformation [65]
1437MediumC-H3 deformation [65] C-H2 deformation [64]
1457MediumC-H3 symmetric bending [62,63,65]; C-H2 twisting [64]
1770MediumC=O stretching [62,63]
2721SmallC=O stretching [66]
2845MajorC-H2 symmetric stretching [67]
2880MajorC-H2 symmetric stretching [67]; C-H symmetric stretching [68]
2945MajorC-H2 asymmetric stretching [67]
3000MediumC-H3 asymmetric stretch [68]
Disclaimer/Publisher’s Note: The statements, opinions and data contained in all publications are solely those of the individual author(s) and contributor(s) and not of MDPI and/or the editor(s). MDPI and/or the editor(s) disclaim responsibility for any injury to people or property resulting from any ideas, methods, instructions or products referred to in the content.

