
Distribution Characteristics of the Geoelectric Field in Waste Dump Slopes during the Evolution of Instability Sources under Rainfall Conditions

Abstract
:1. Introduction
2. Materials and Methods
2.1. Overview of the Prototype Slope
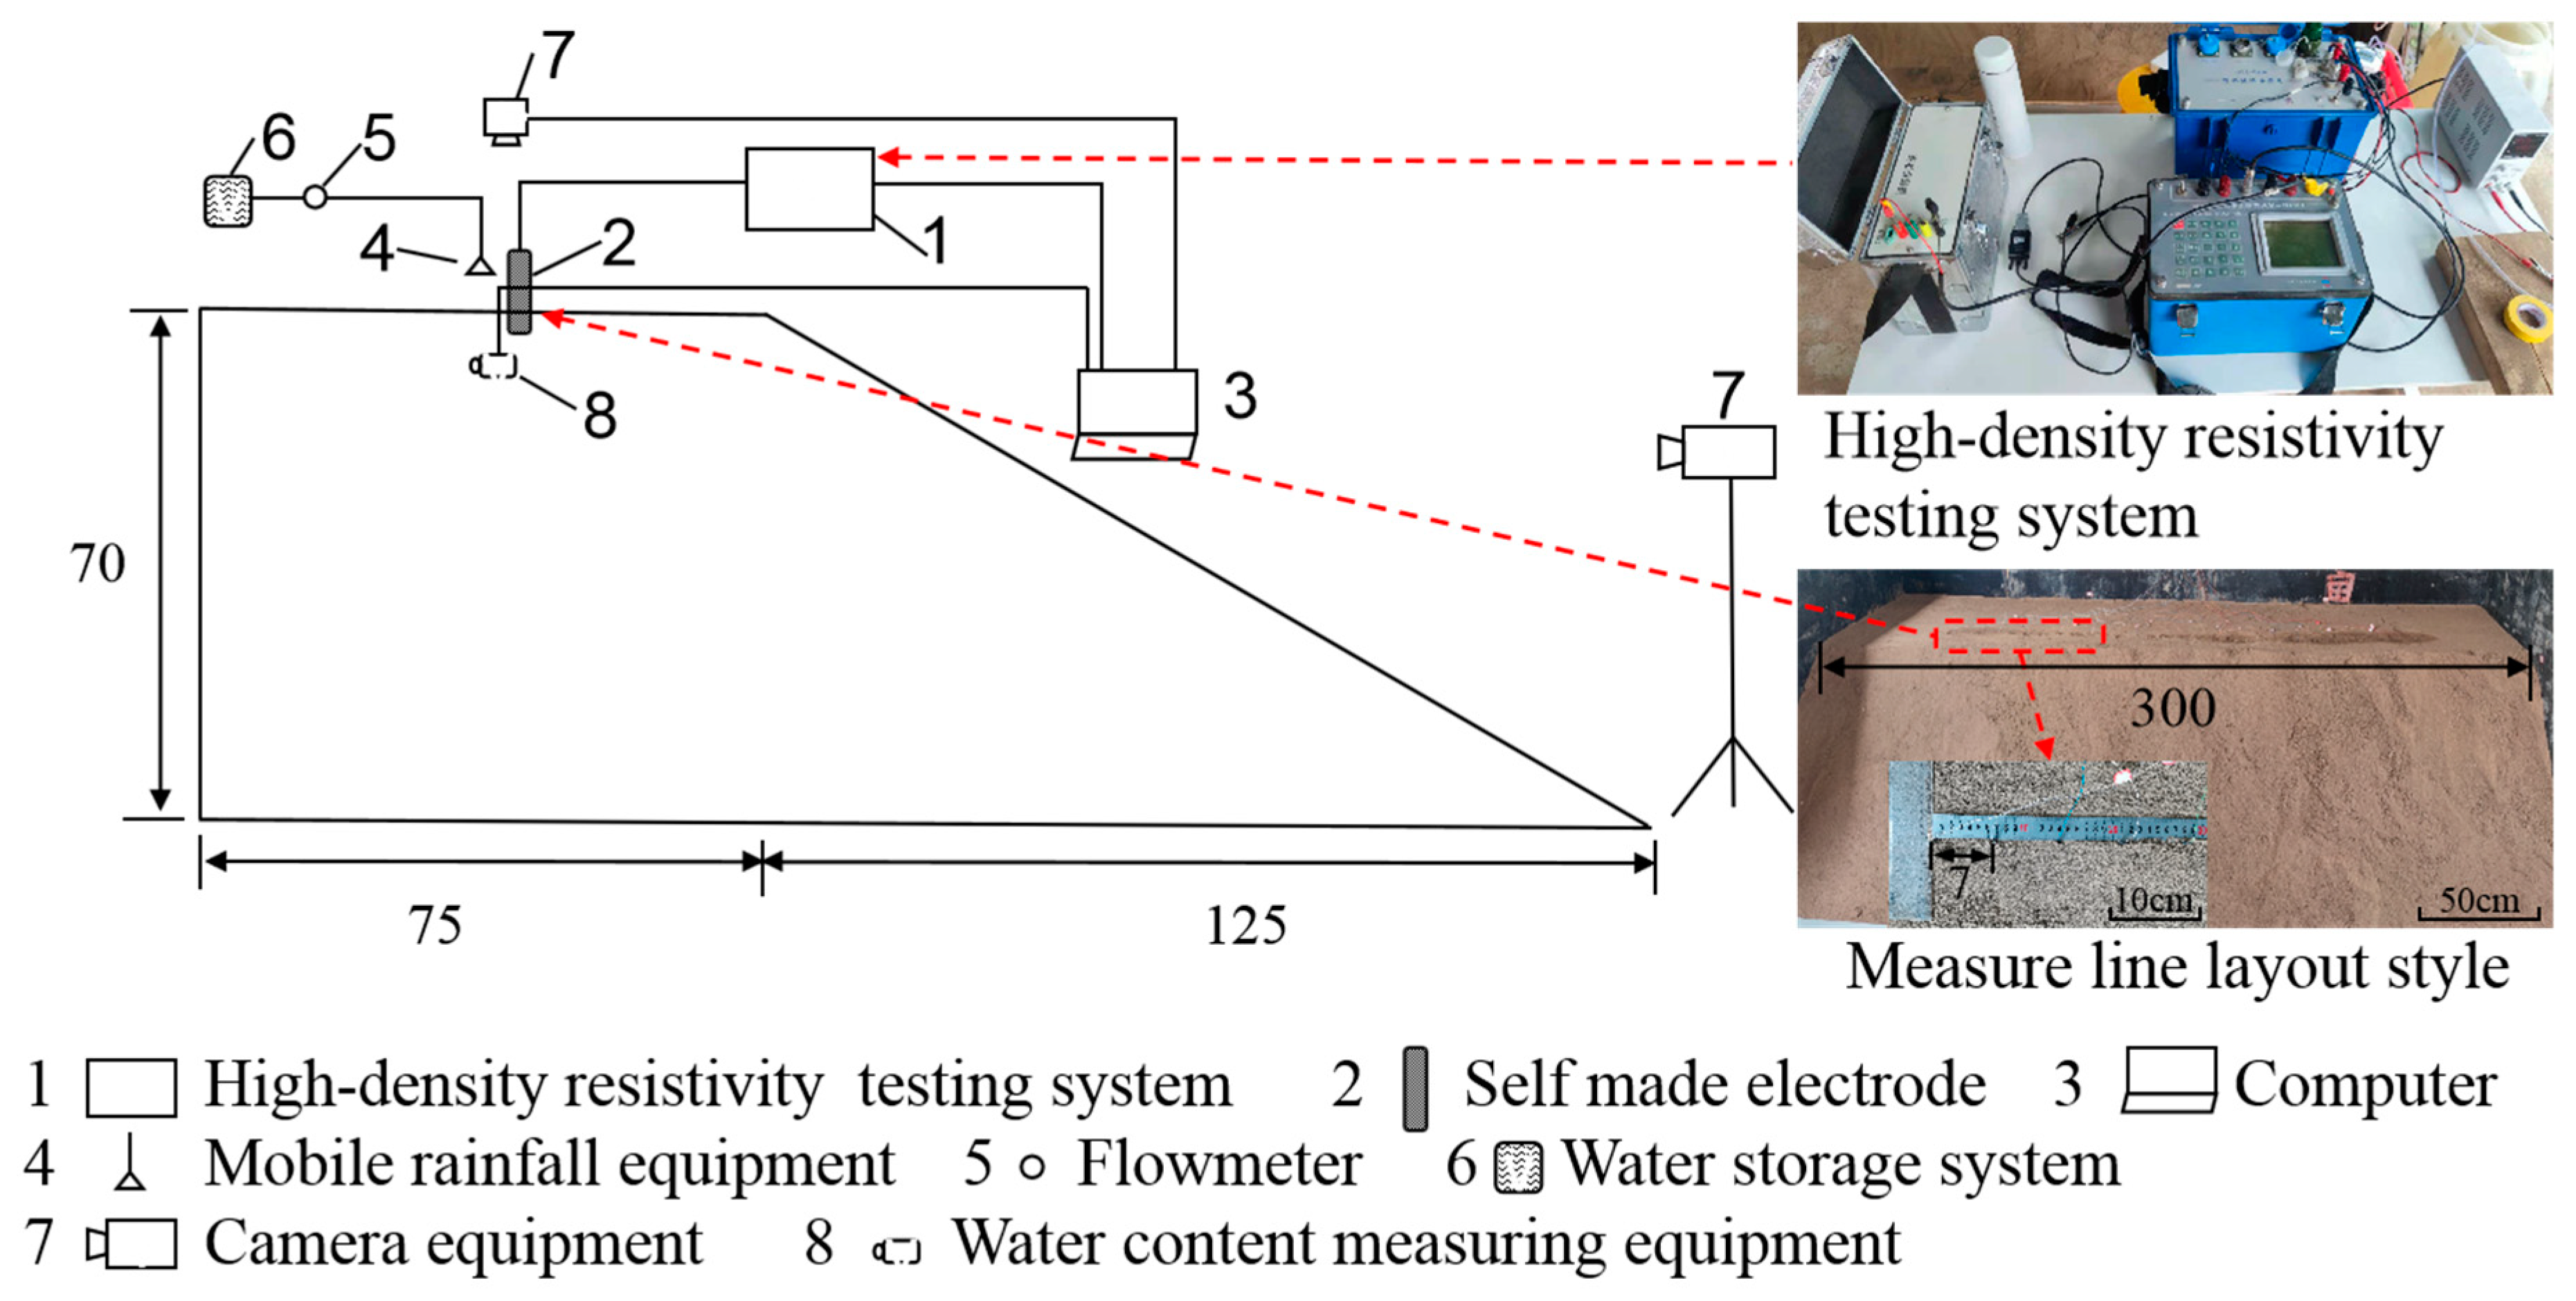
2.2. Test Model System
2.3. Study Protocol
3. Fundamentals
3.1. Saturated–Unsaturated Seepage Flow Theory
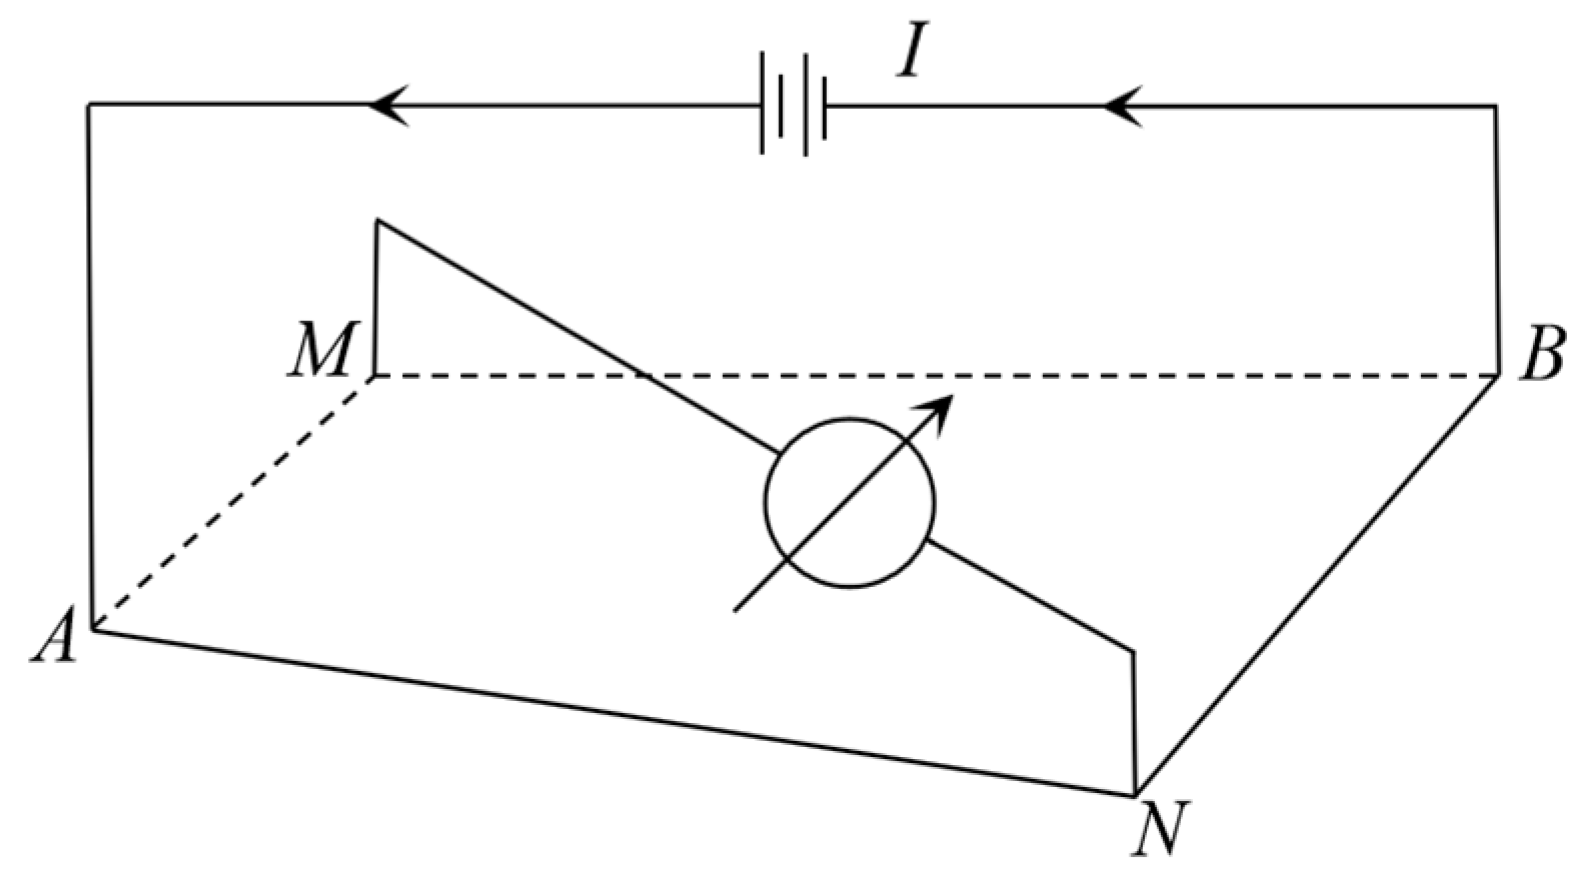
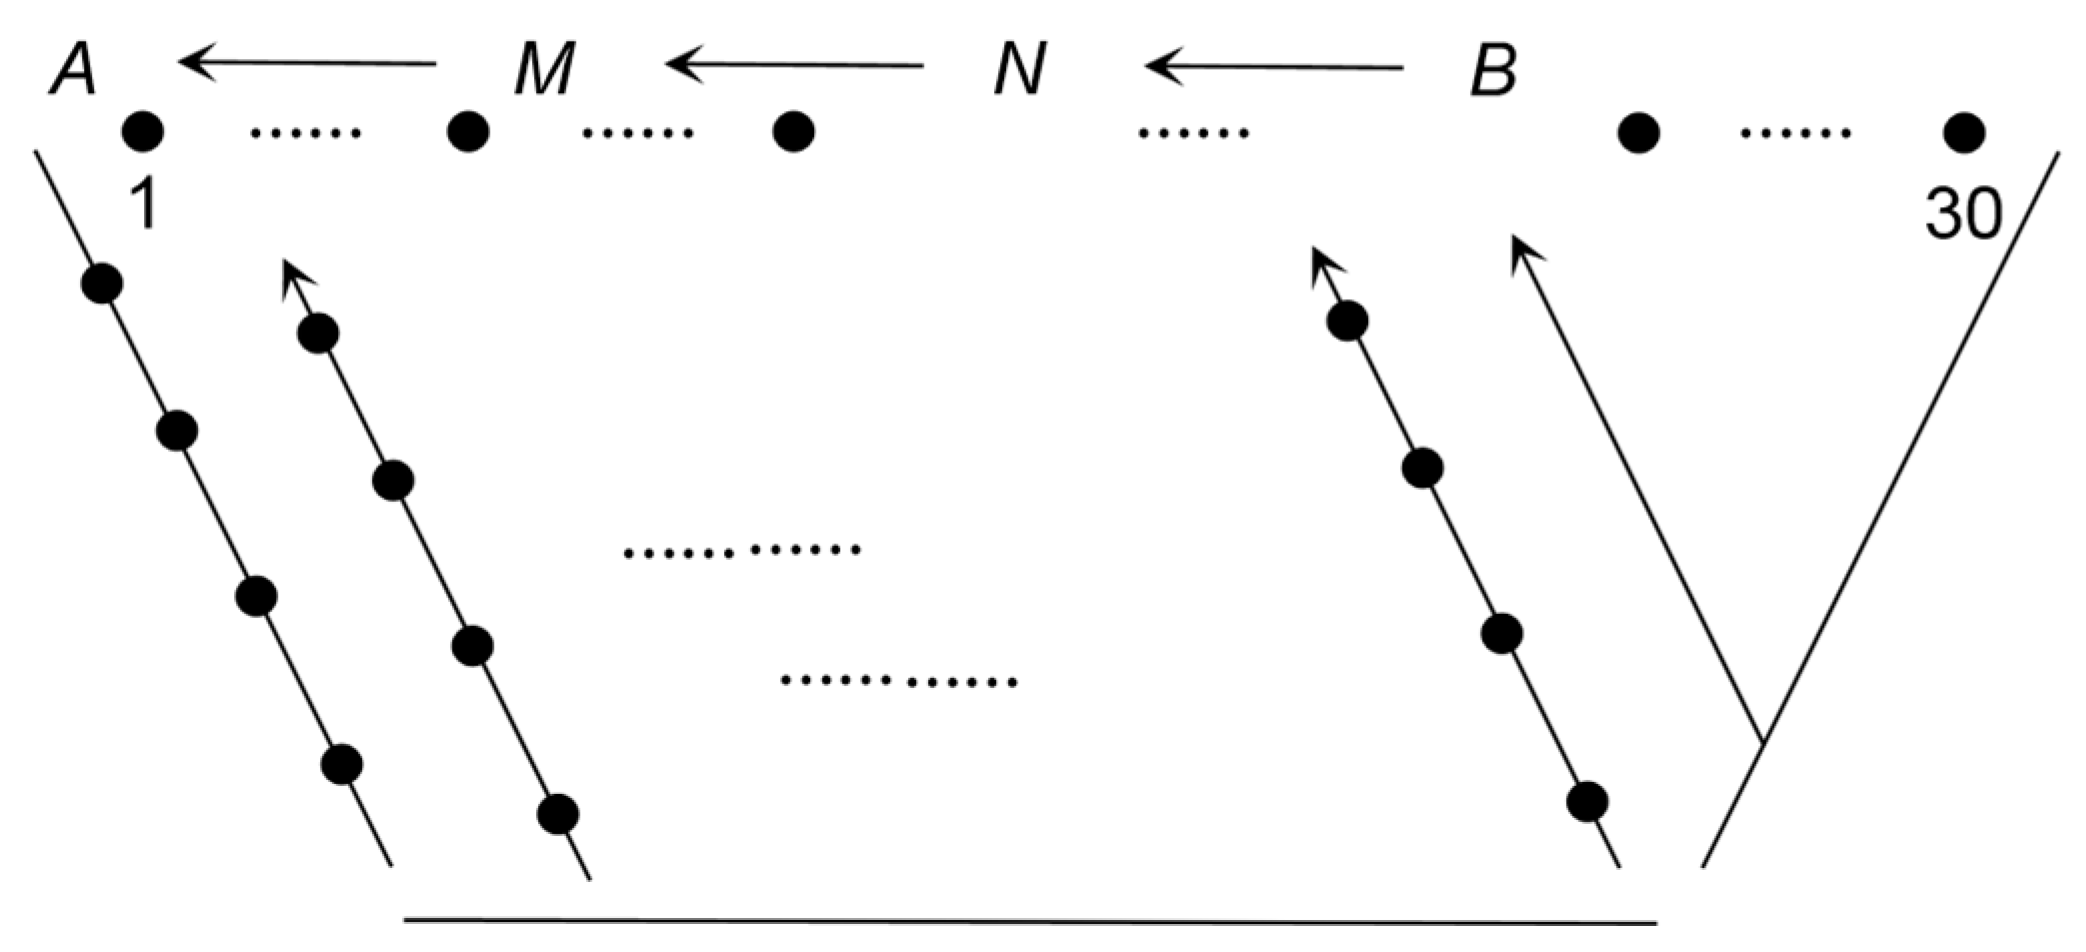
3.2. Direct Current (DC) Resistivity Theory
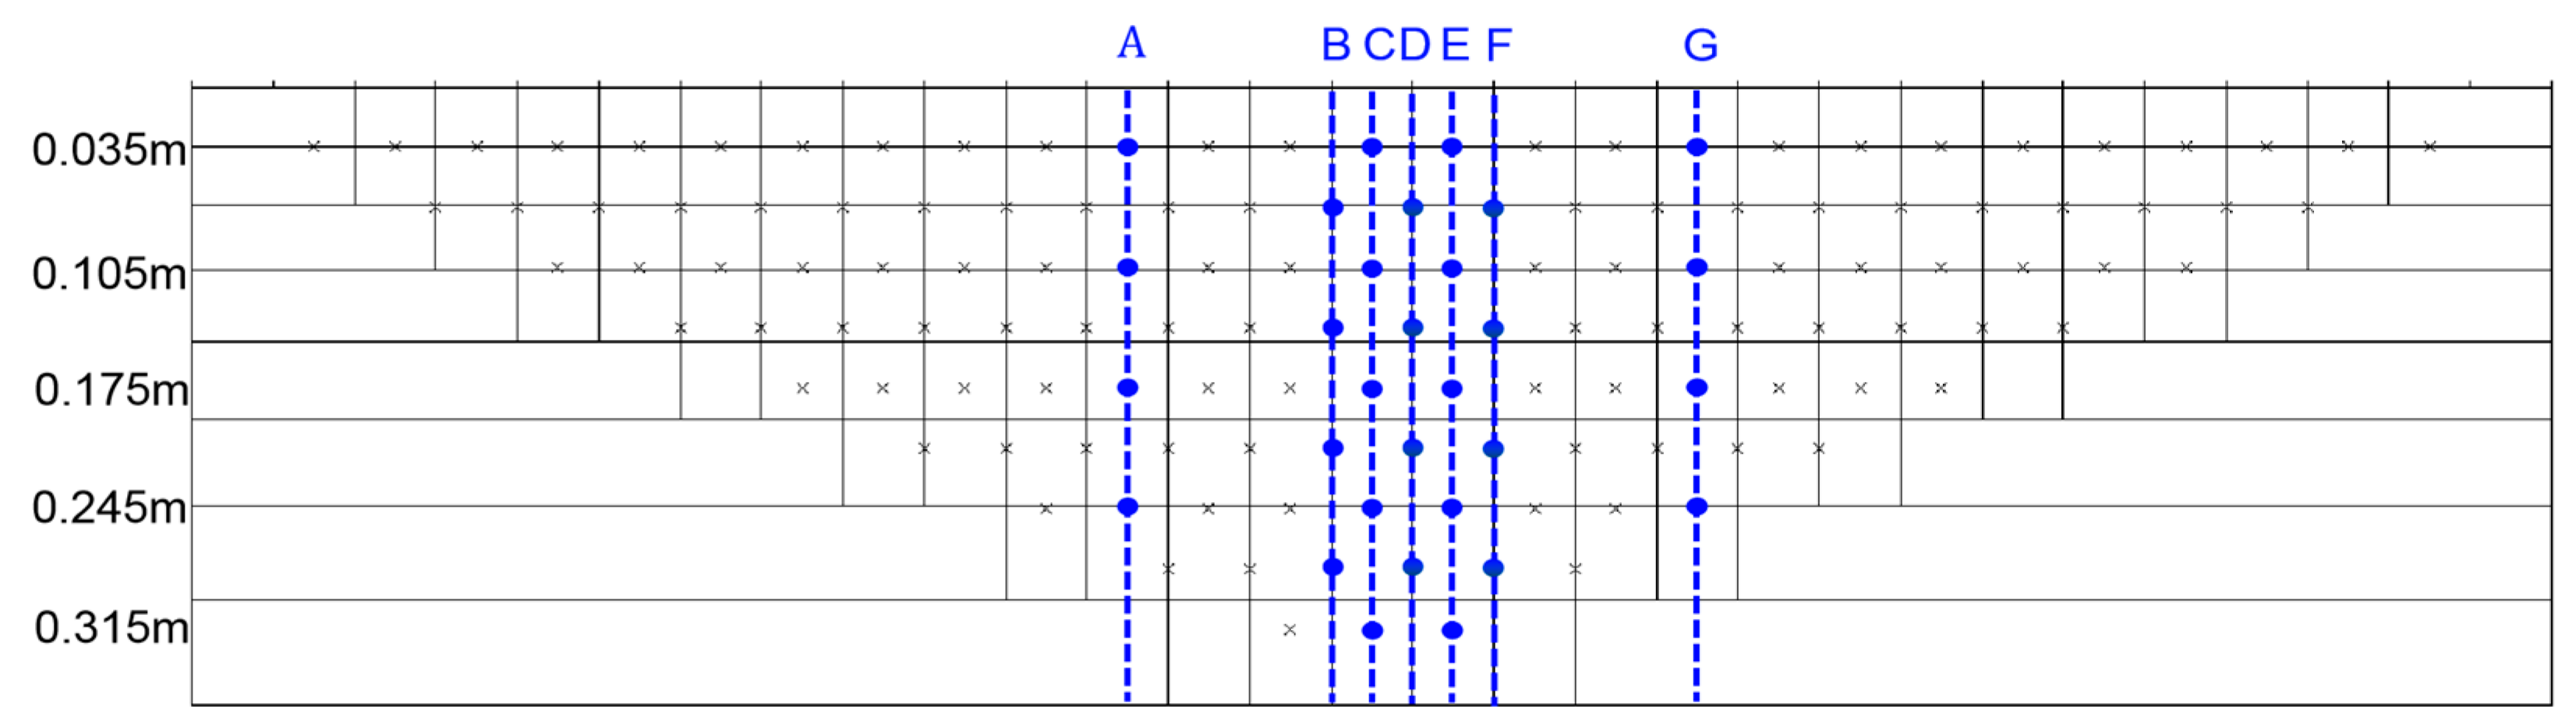
3.3. Resistivity Inversion Theory
4. Results and Analysis
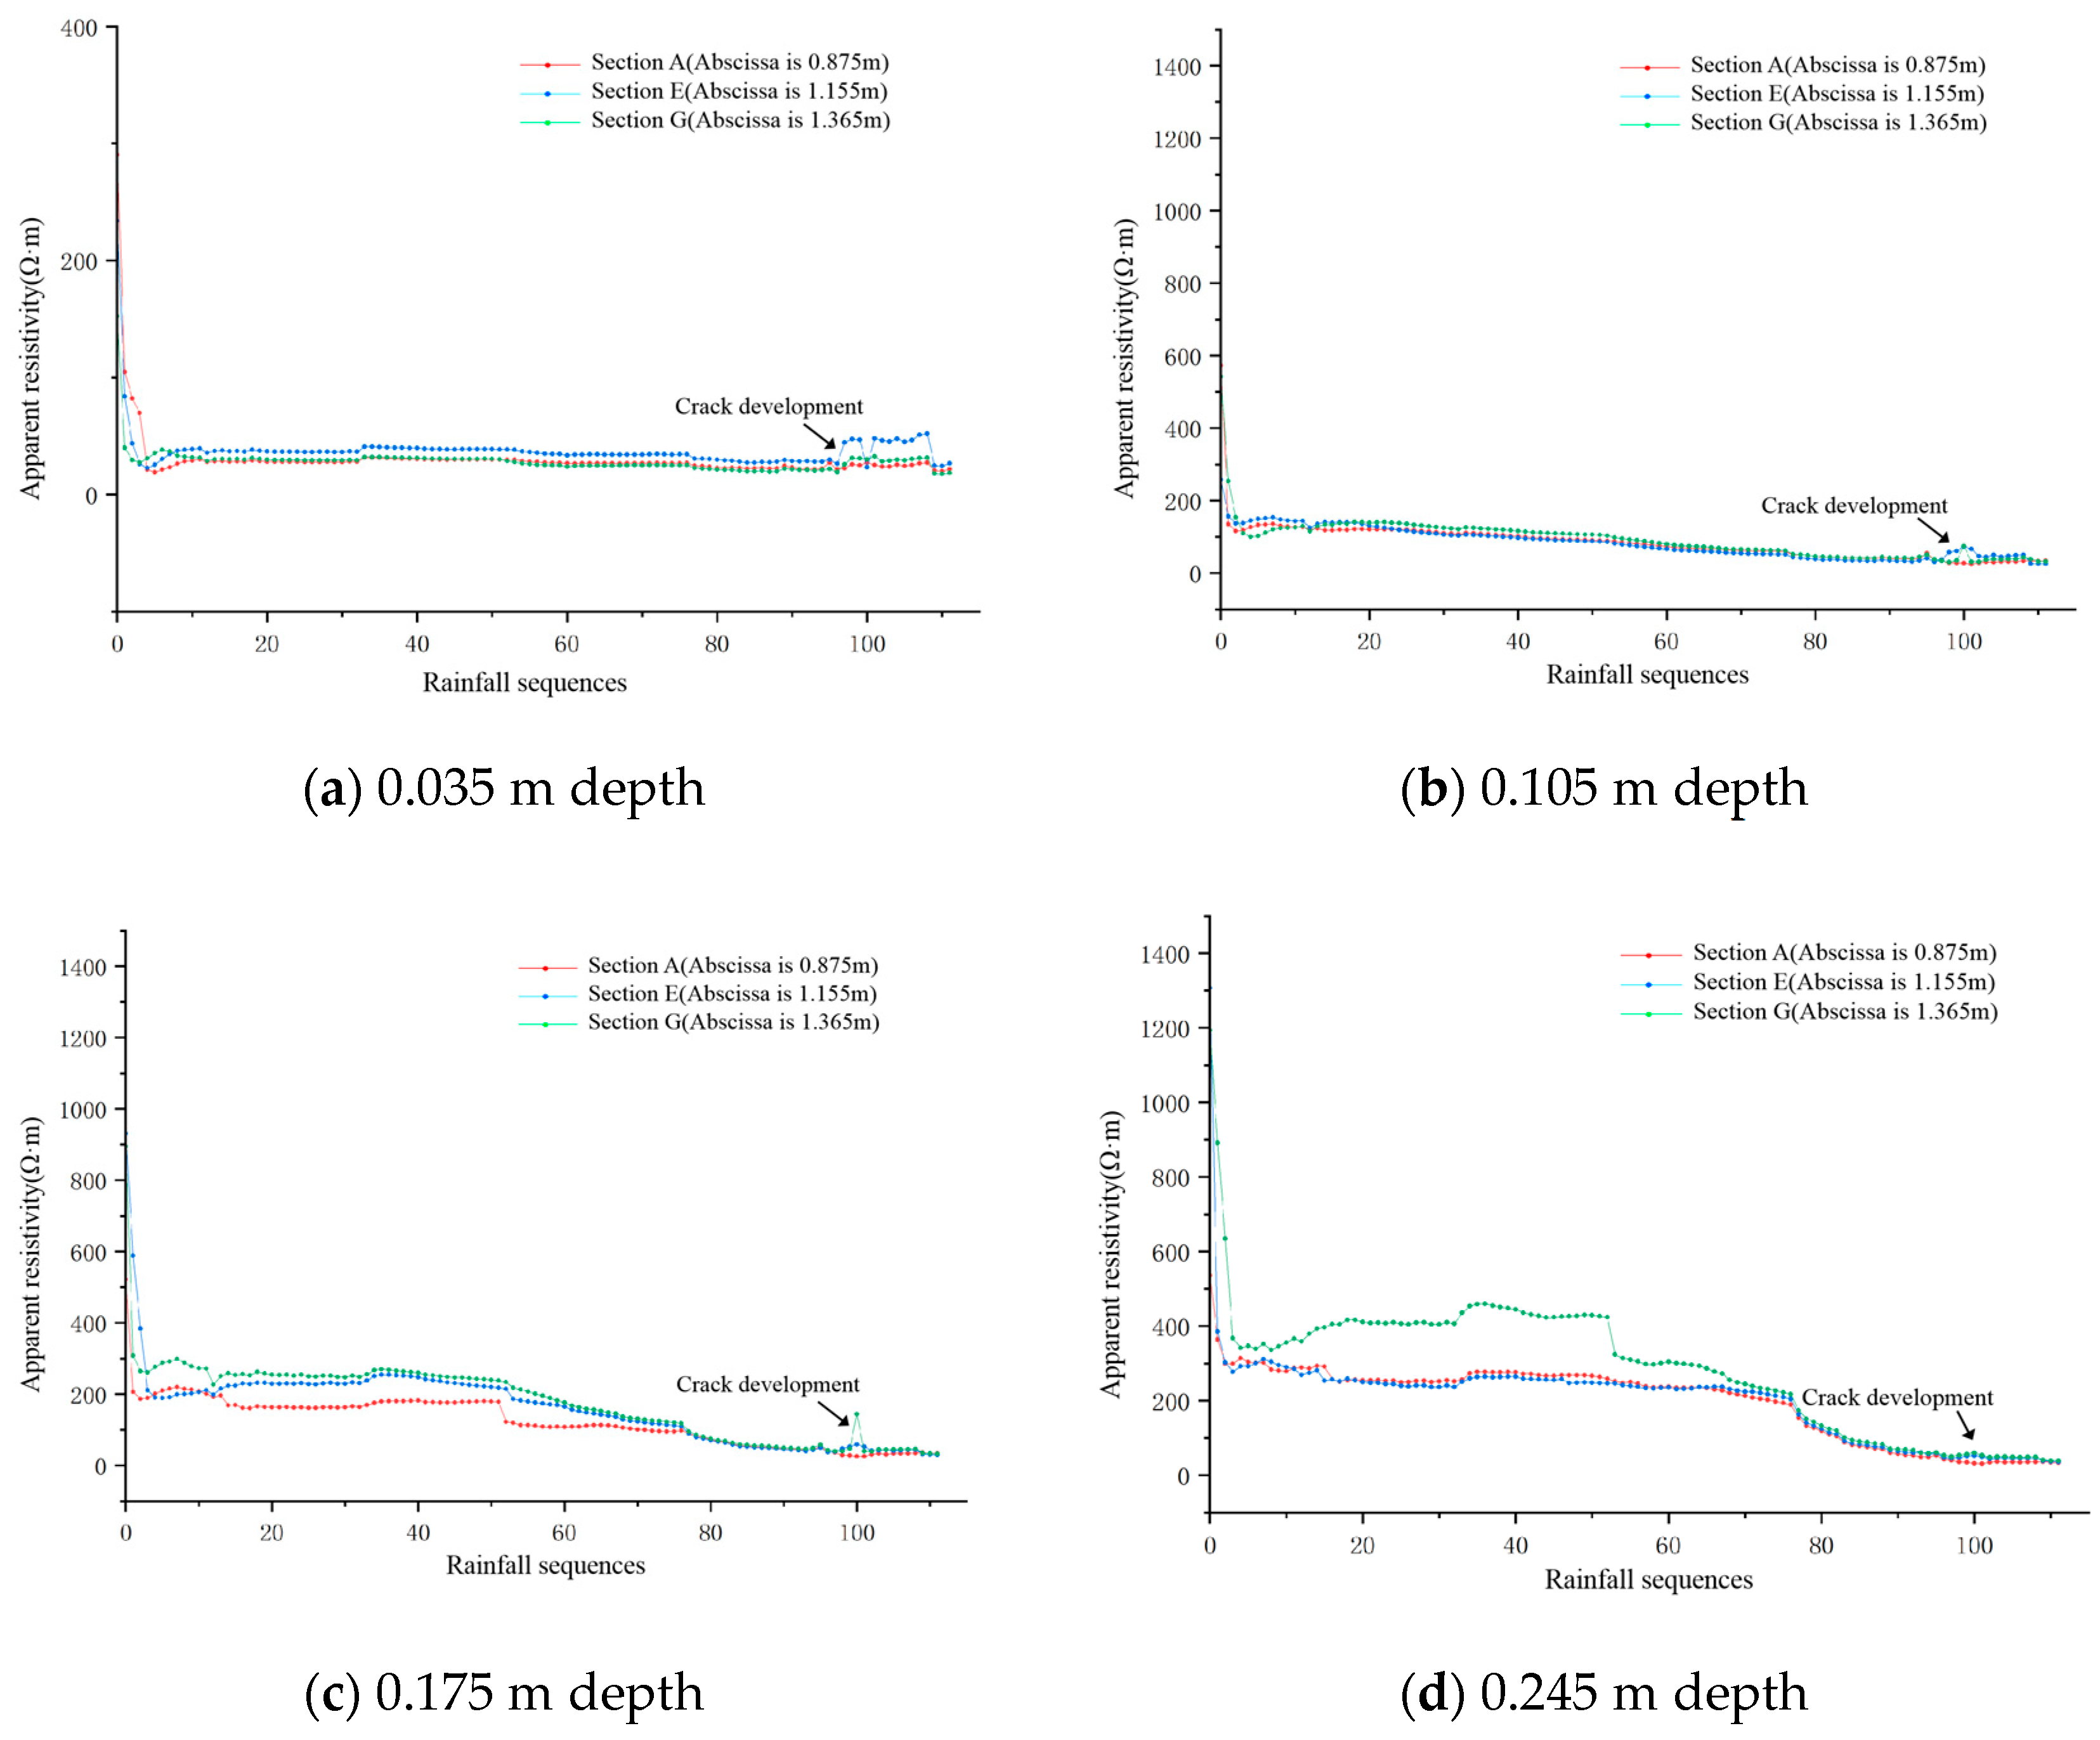
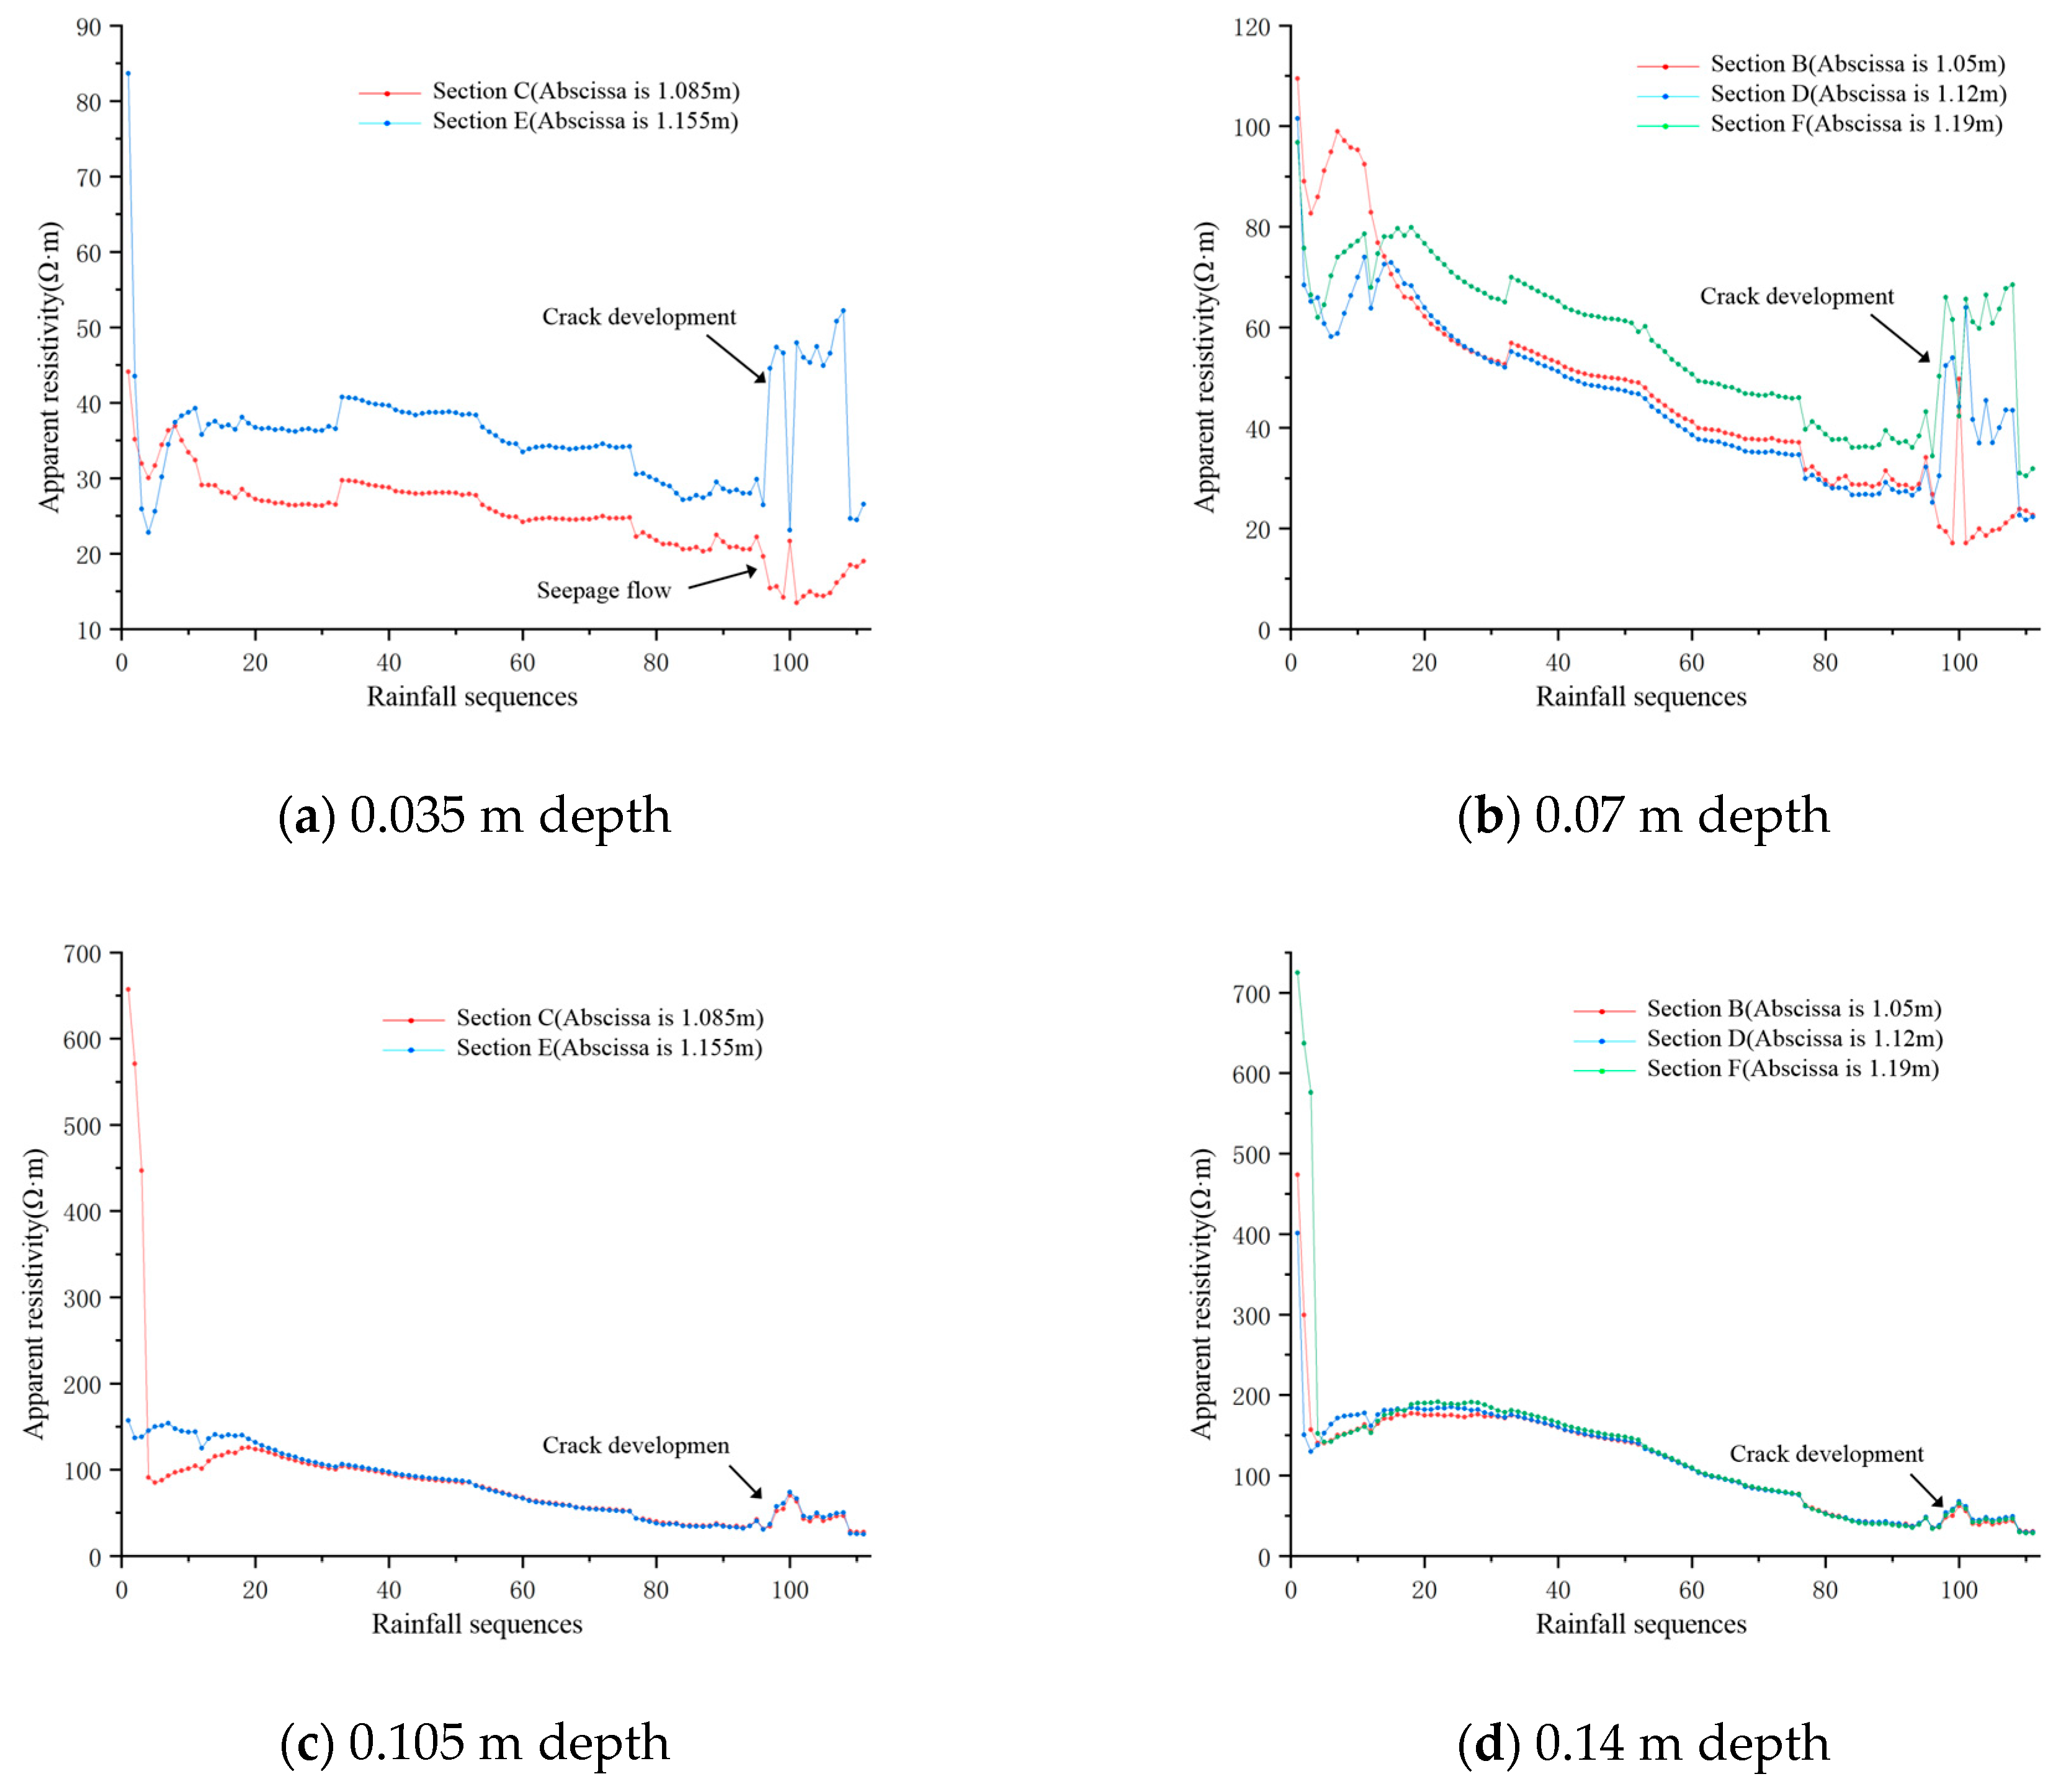
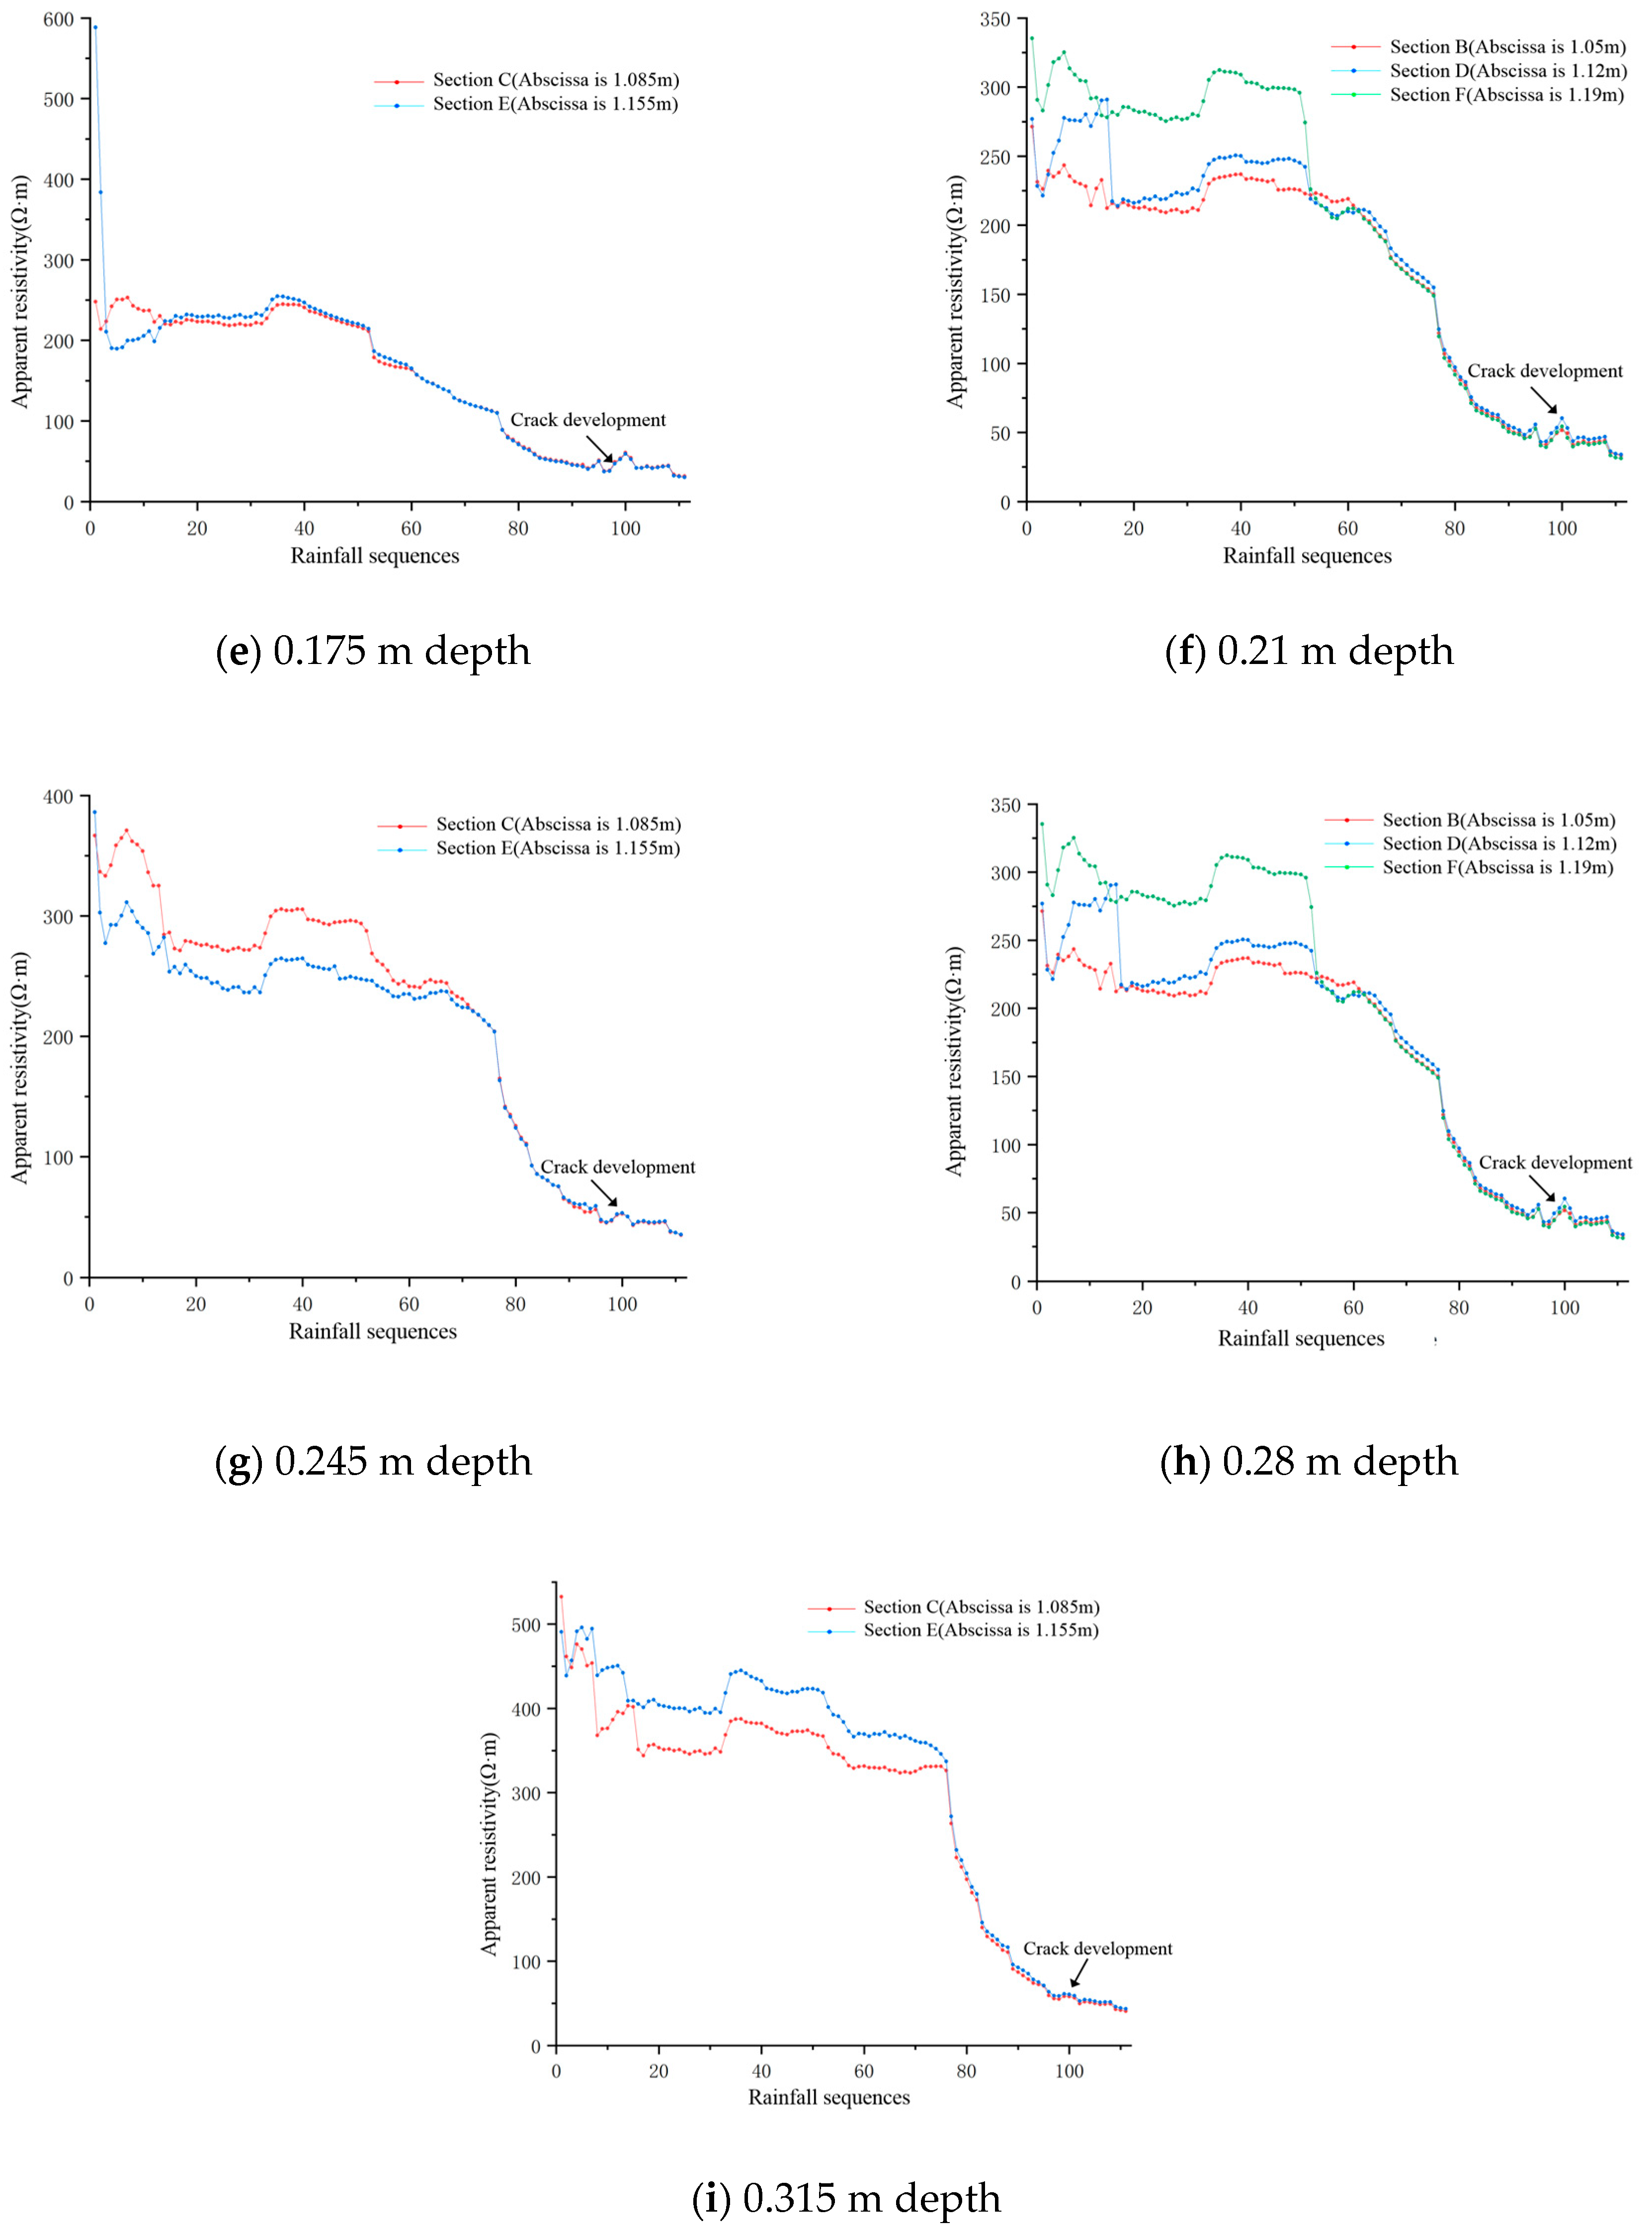
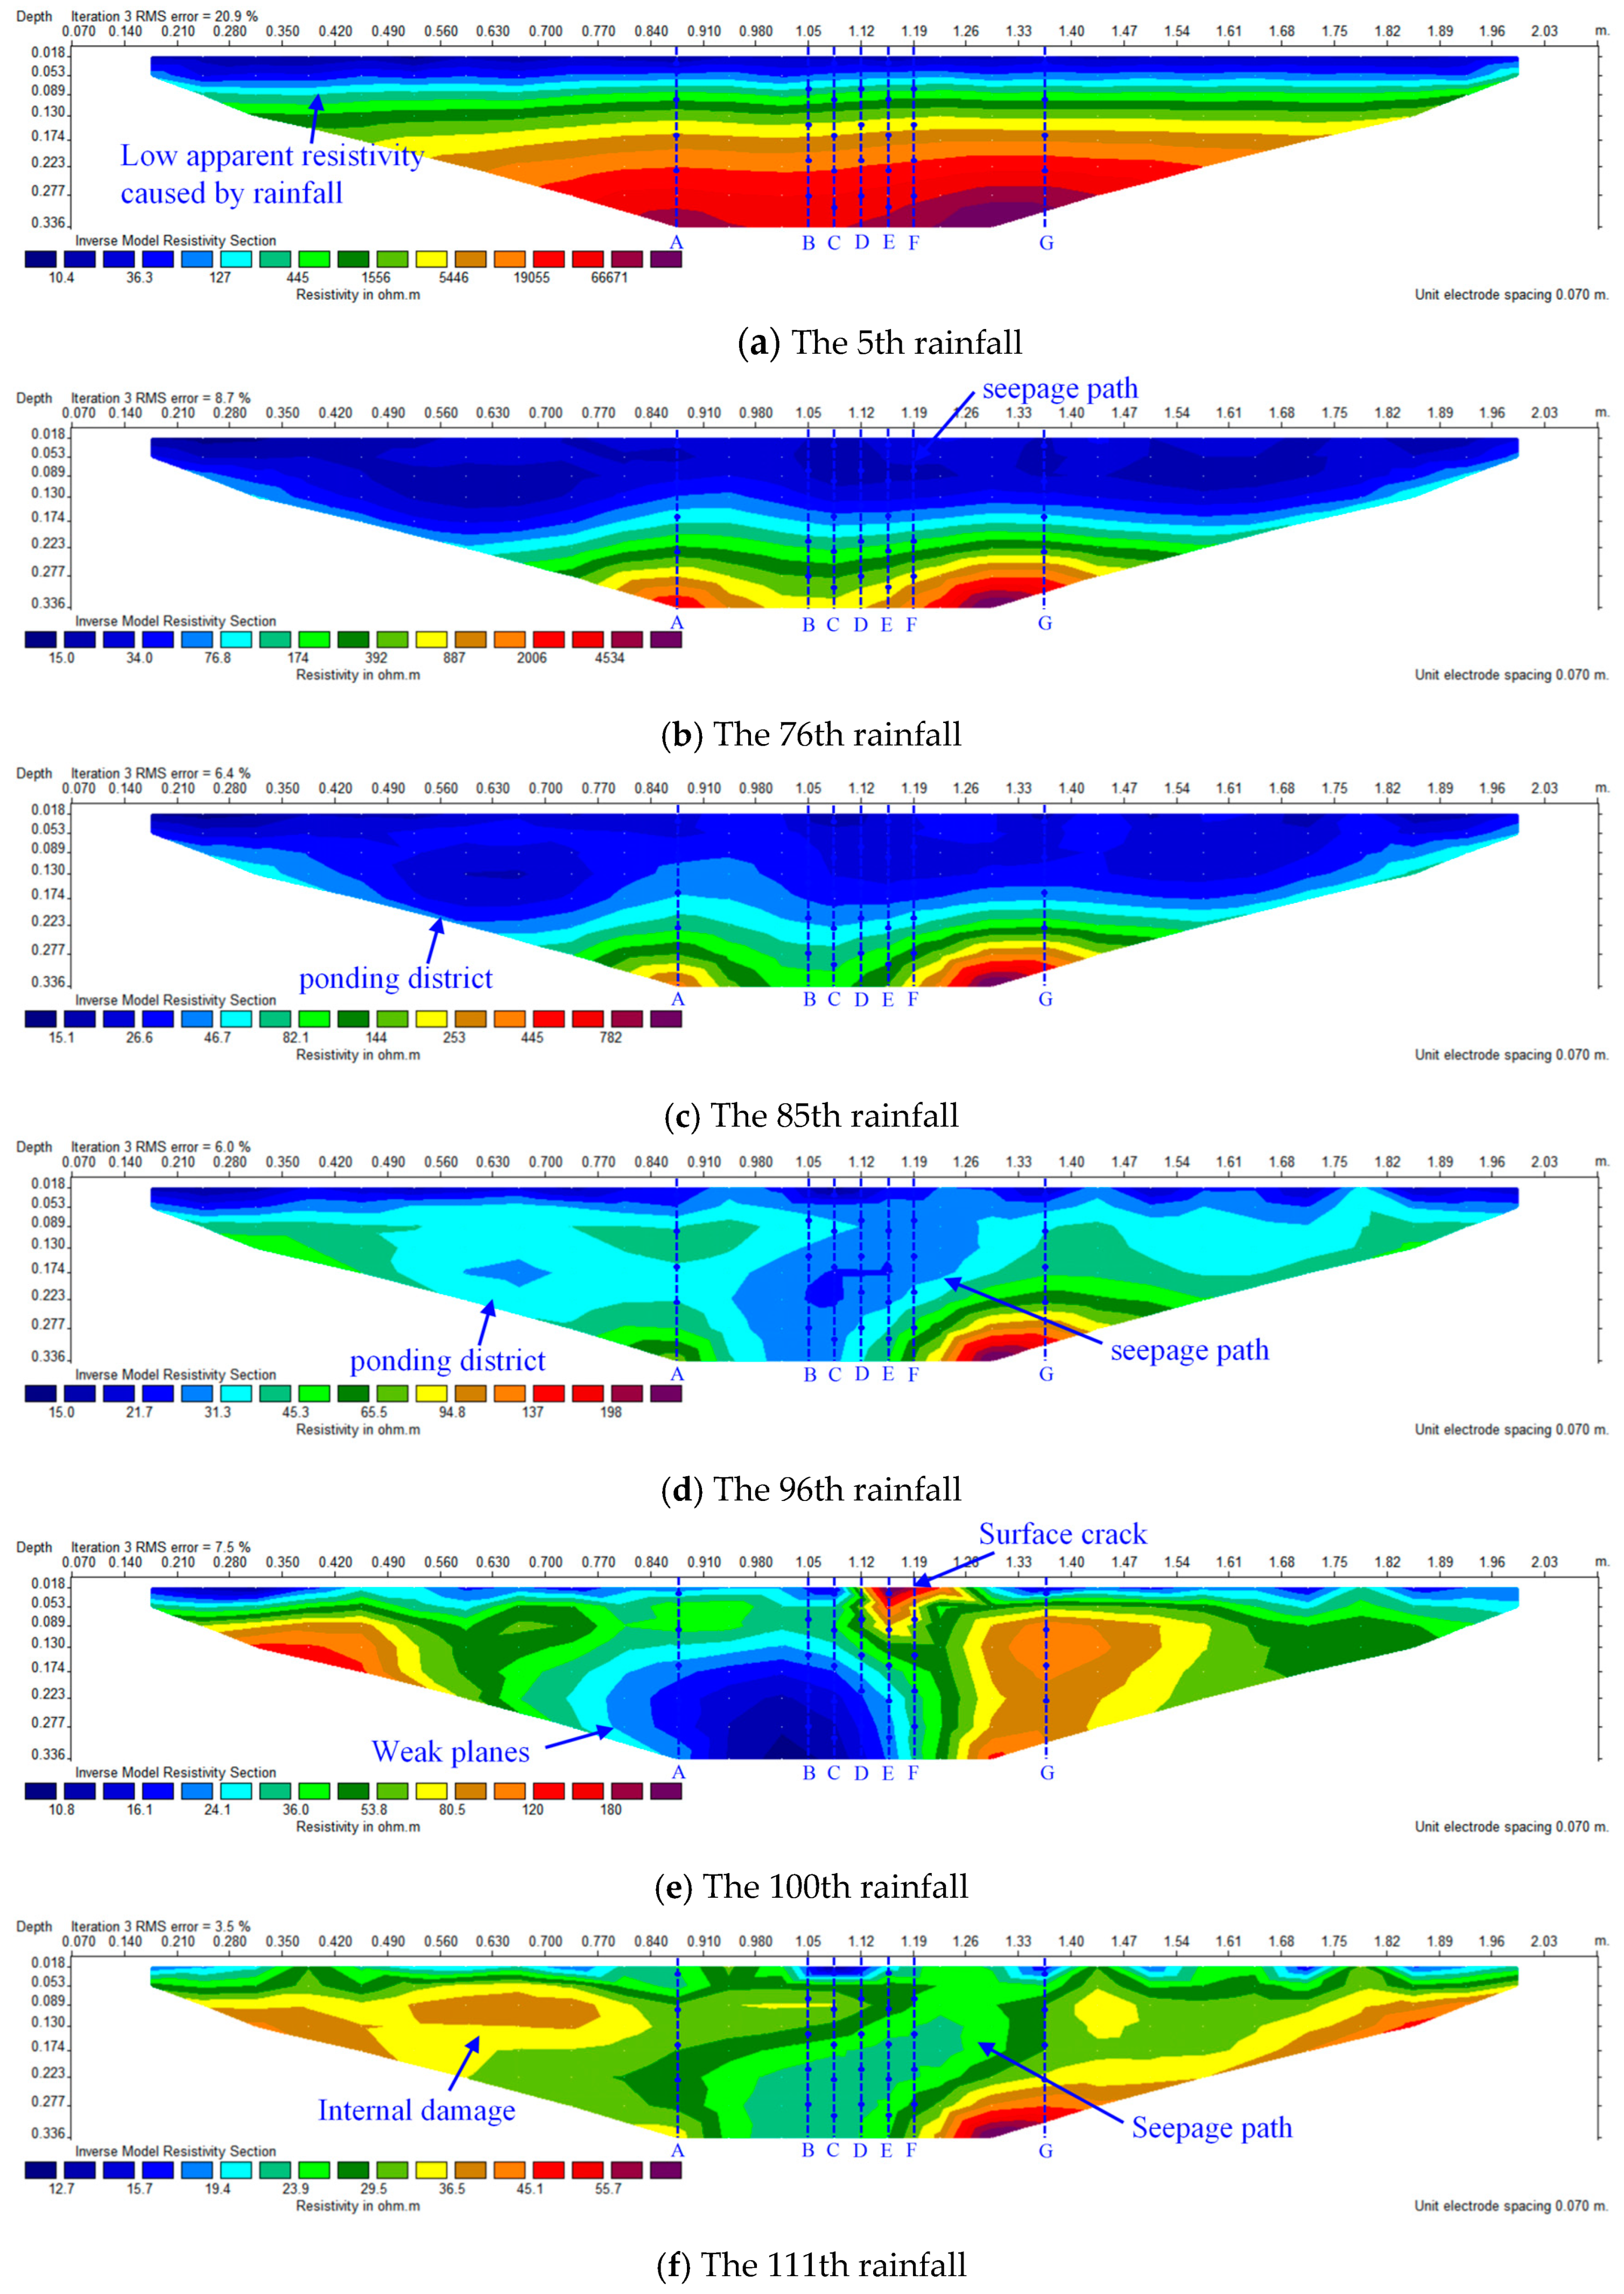
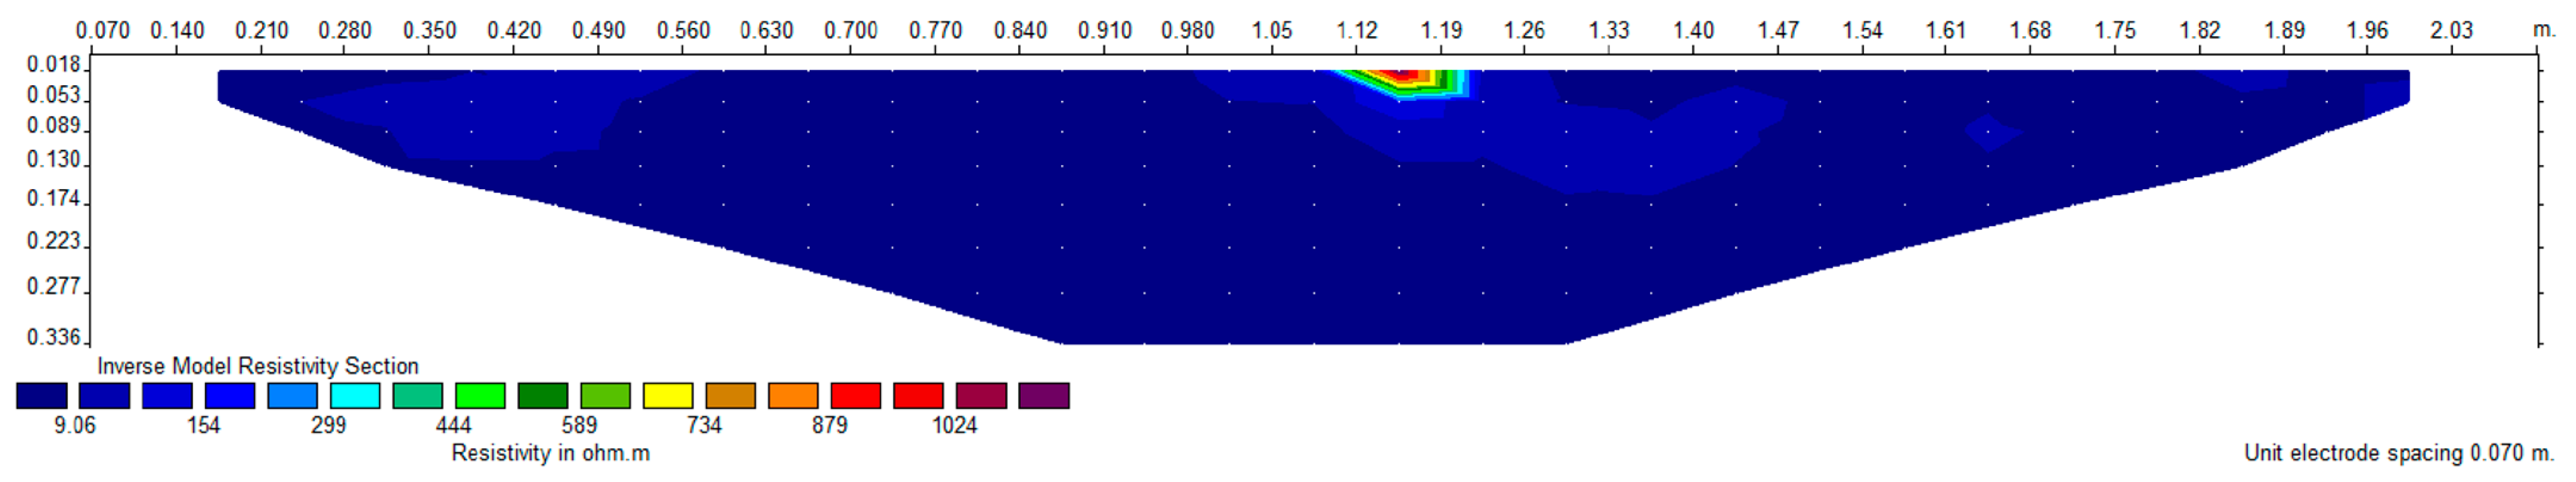
4.1. Geoelectric Field Characteristics under Disaster Source Evolution in the Survey Line Area
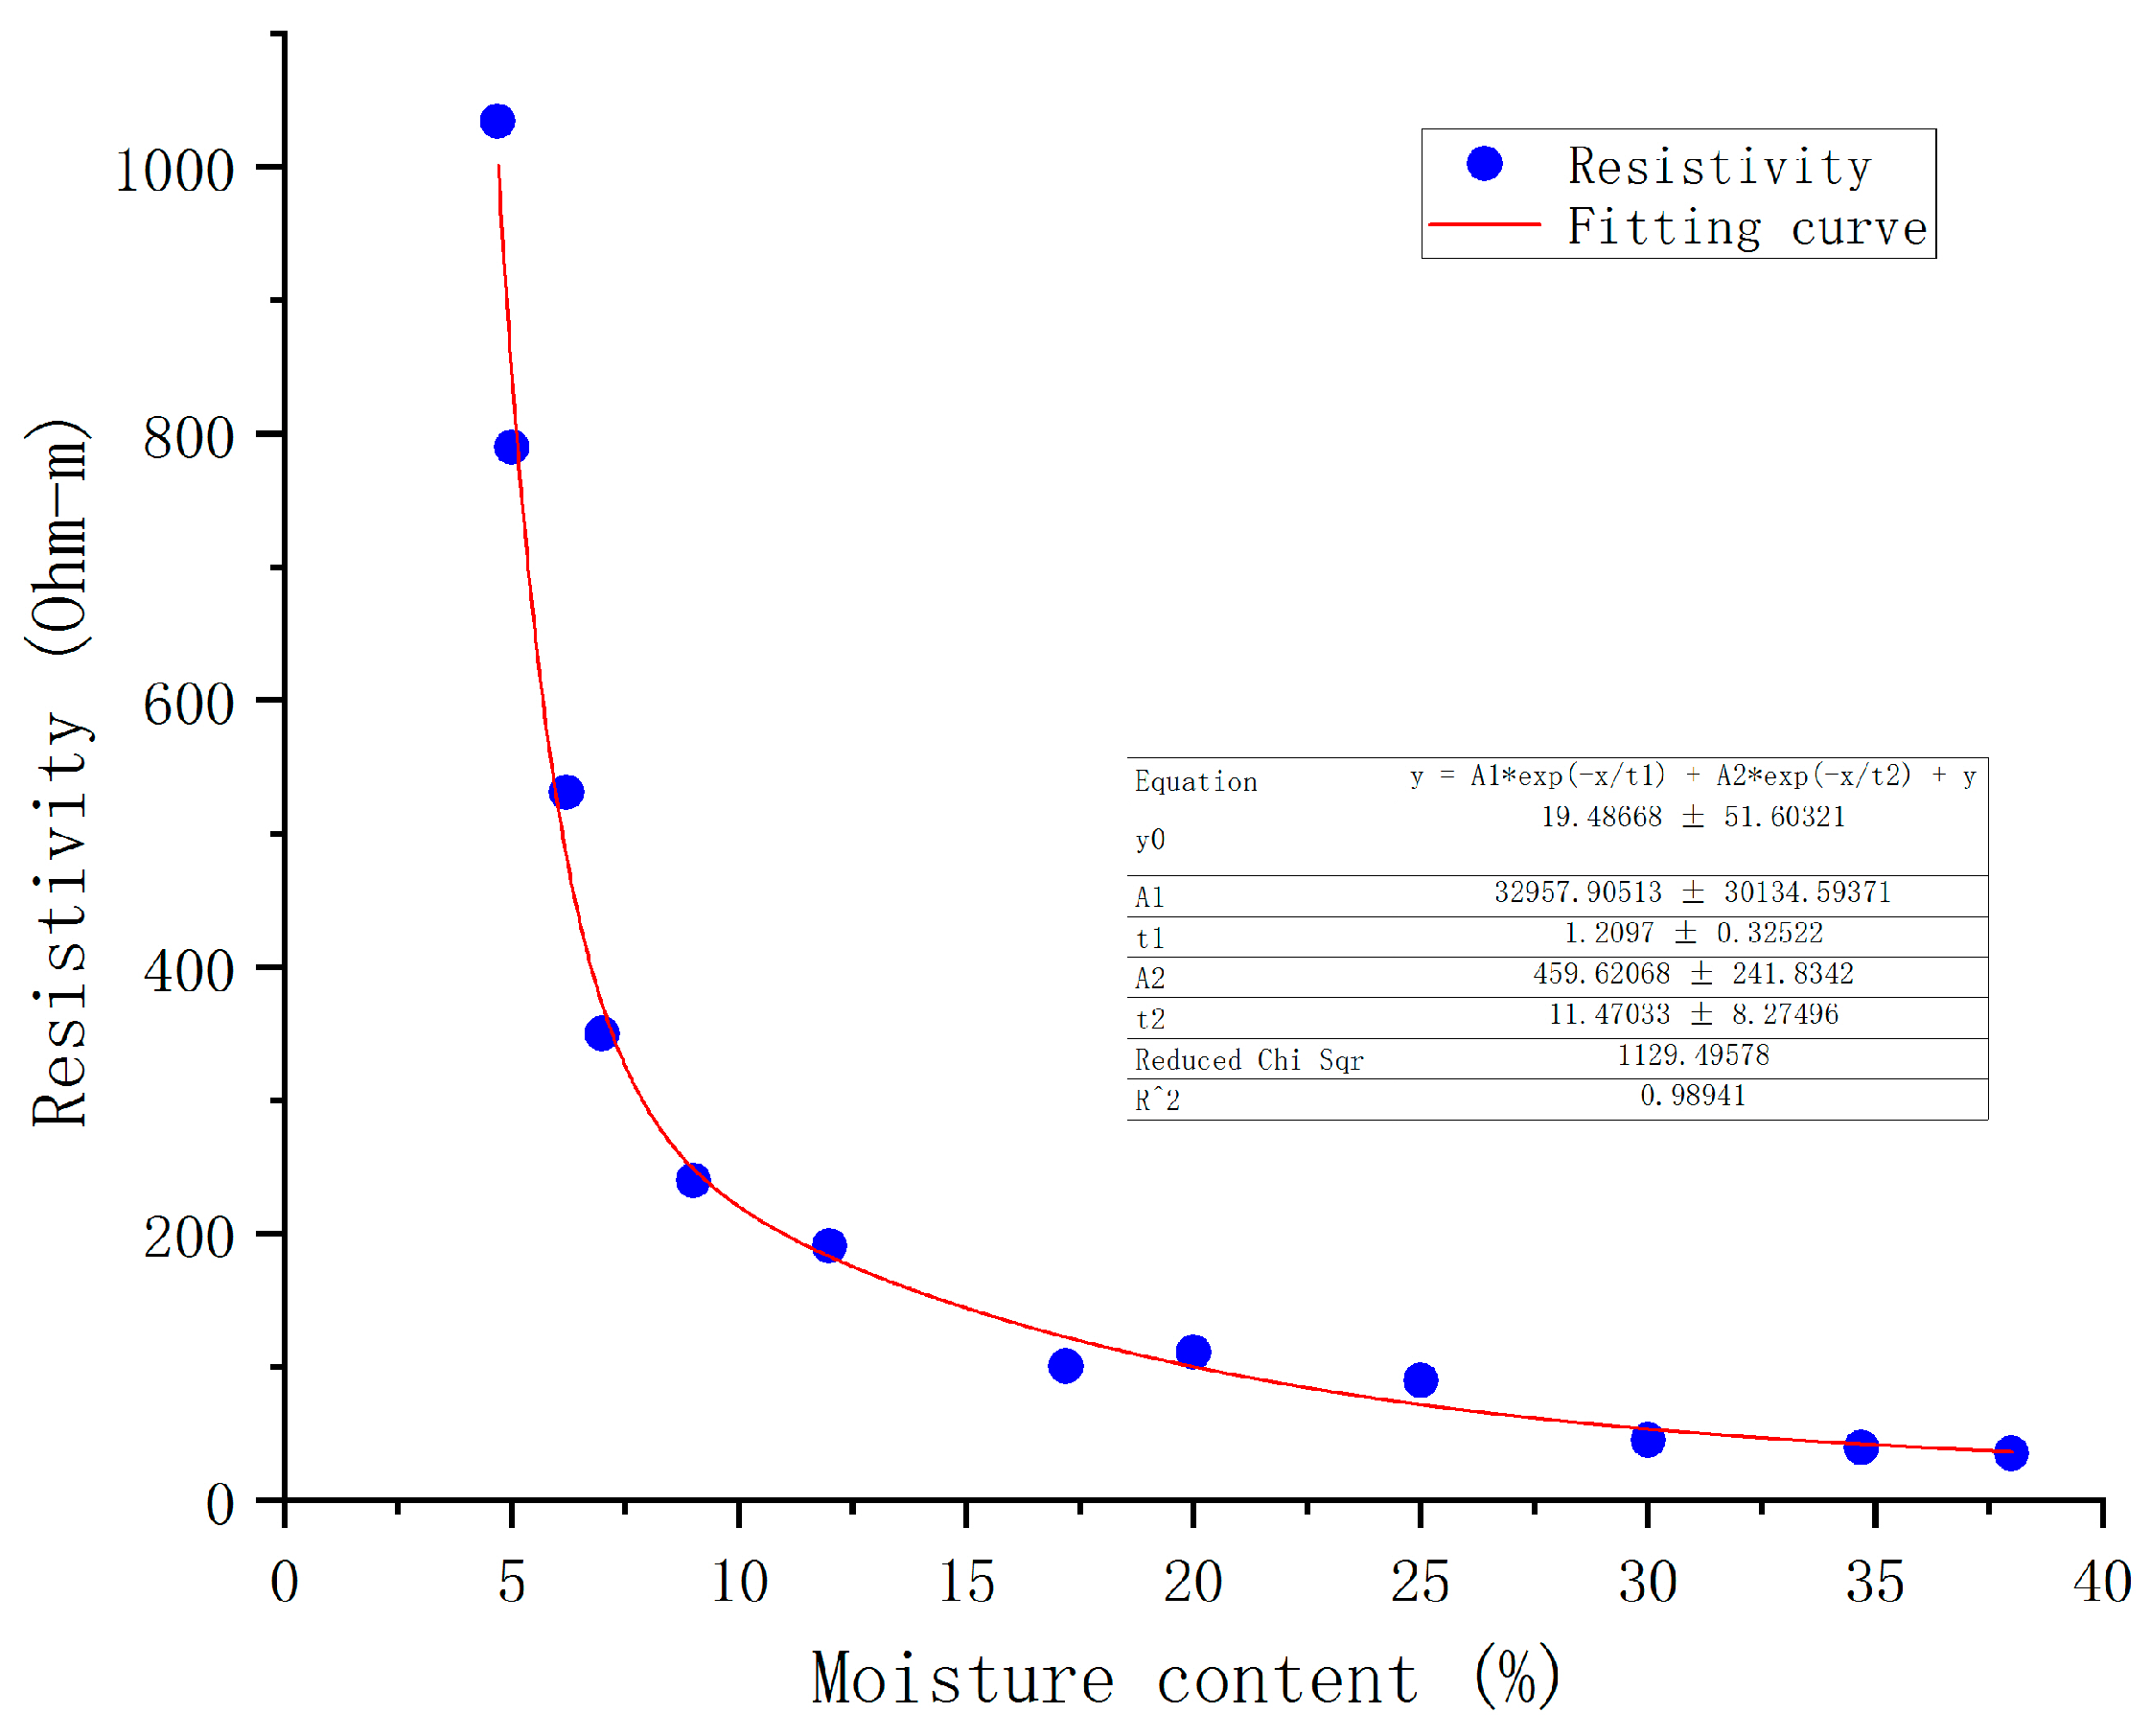
4.2. Relationship between the Apparent Resistivity and Water Content
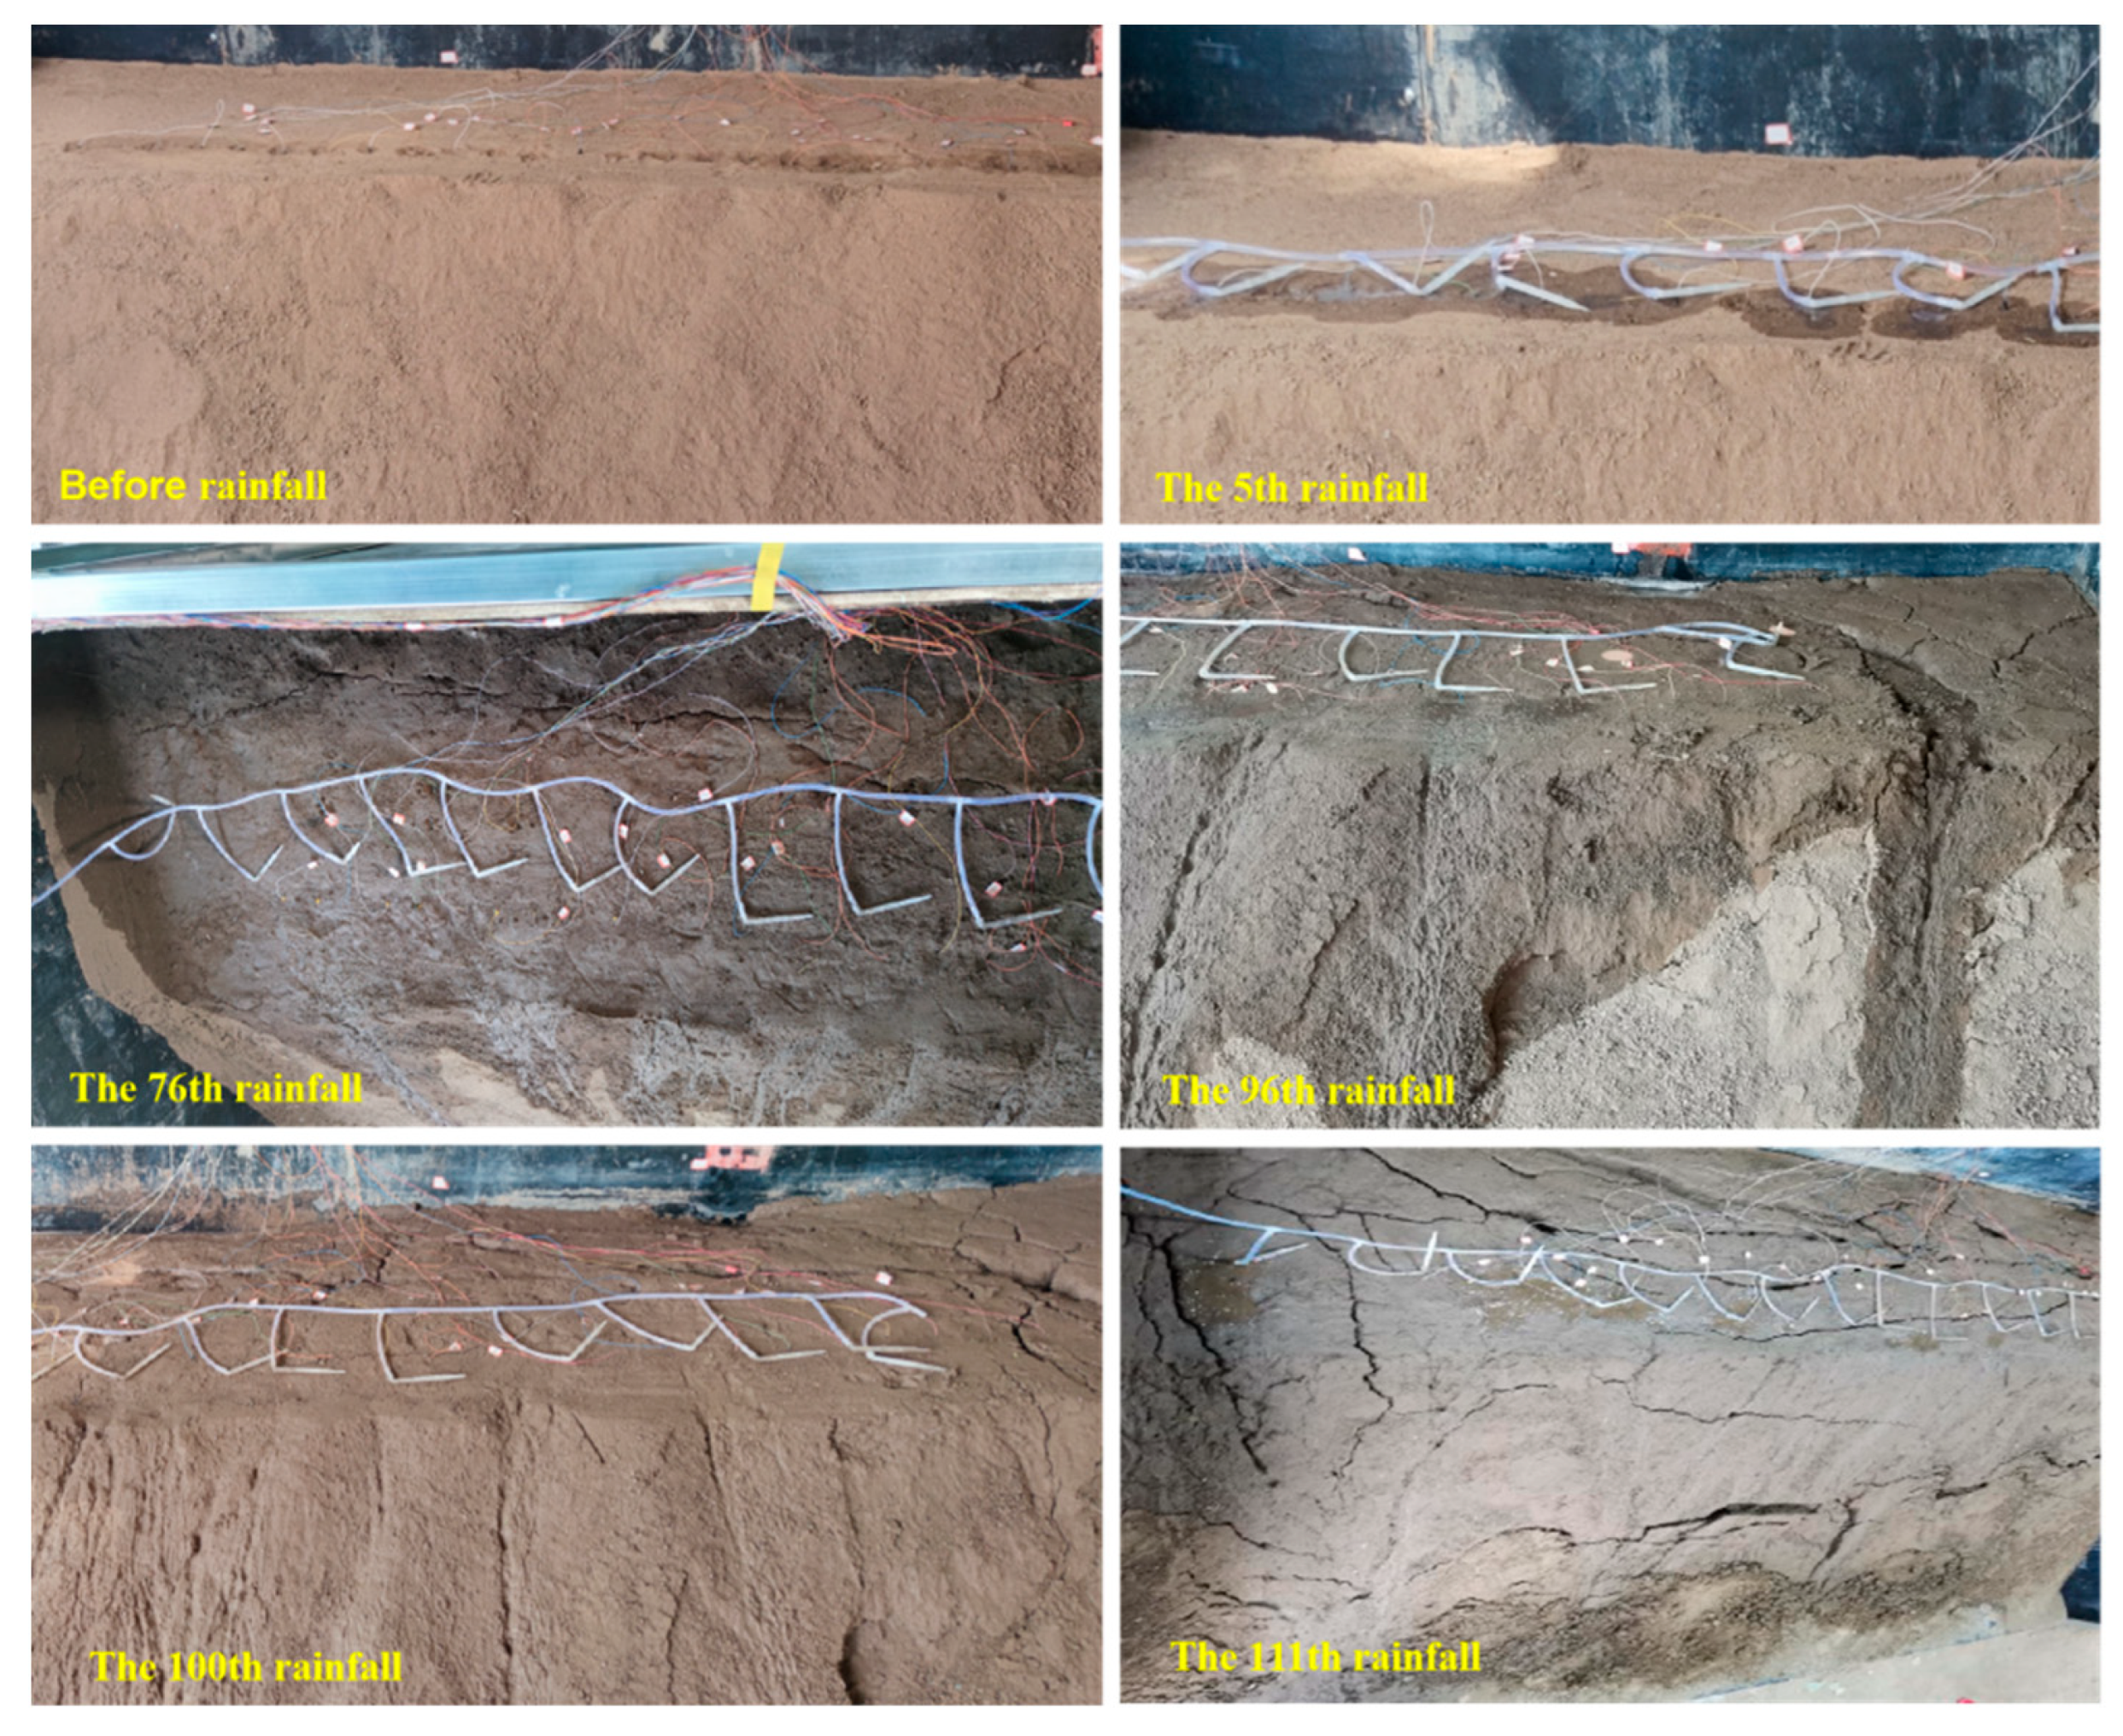
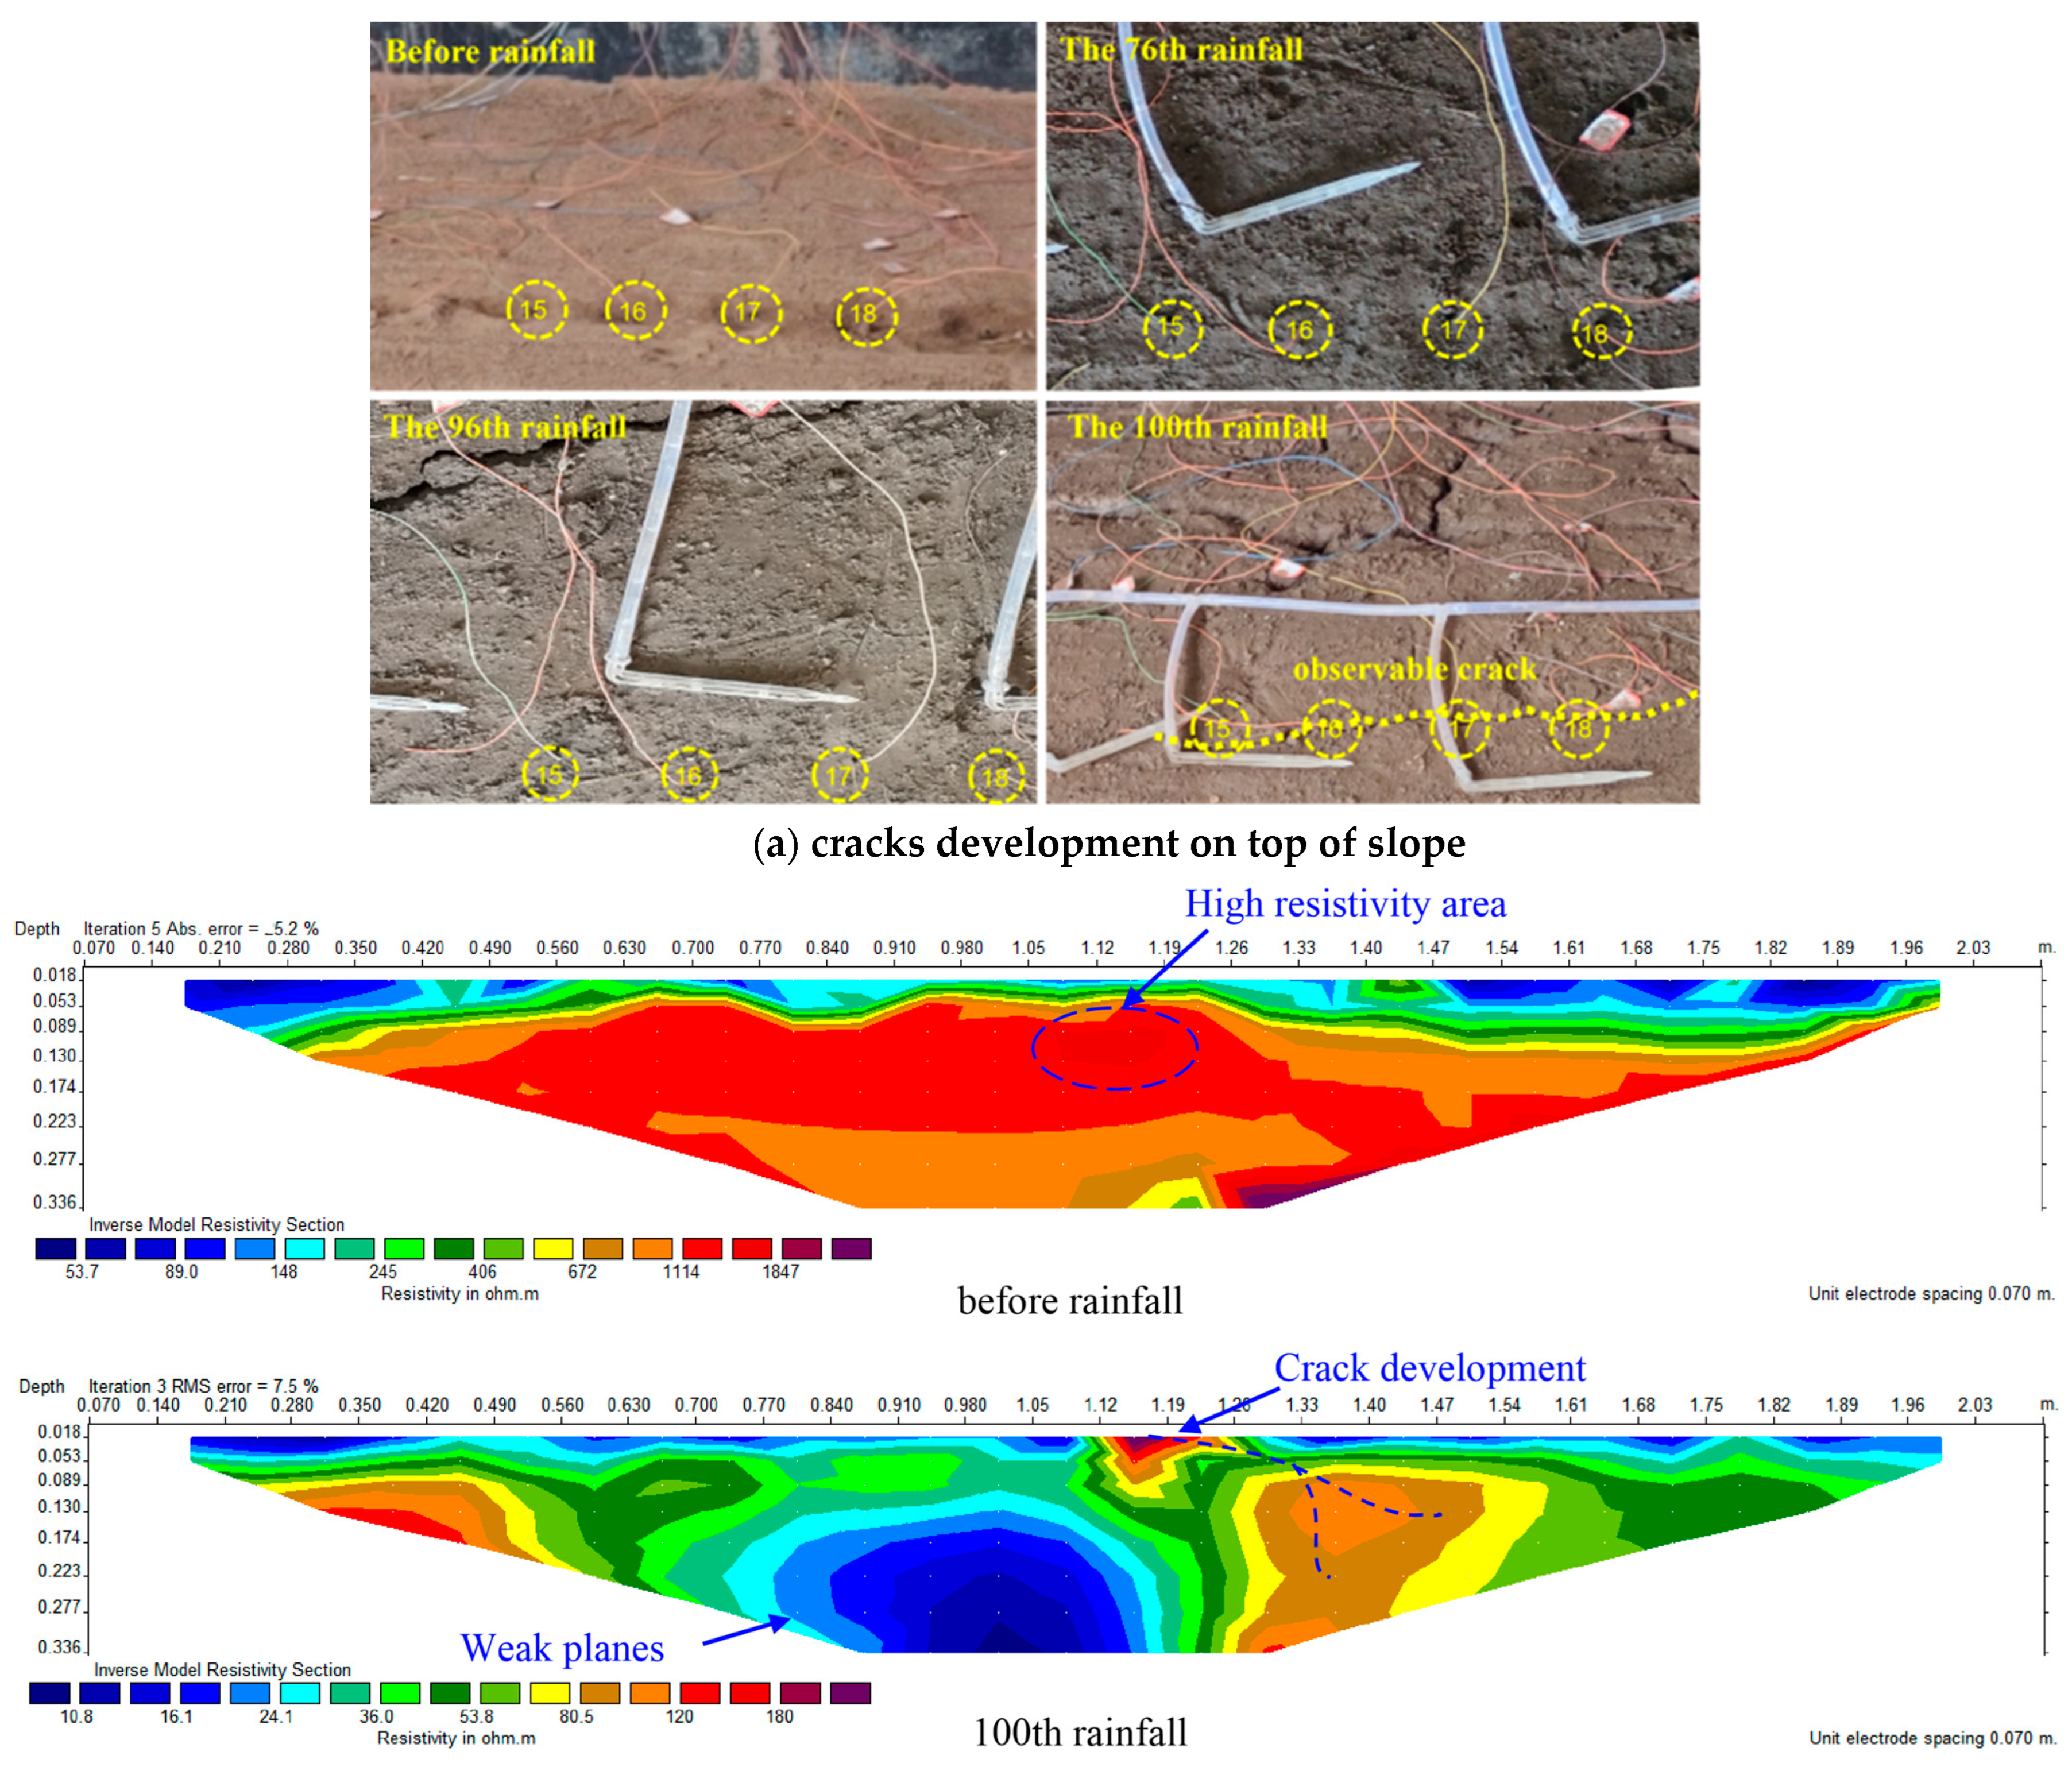
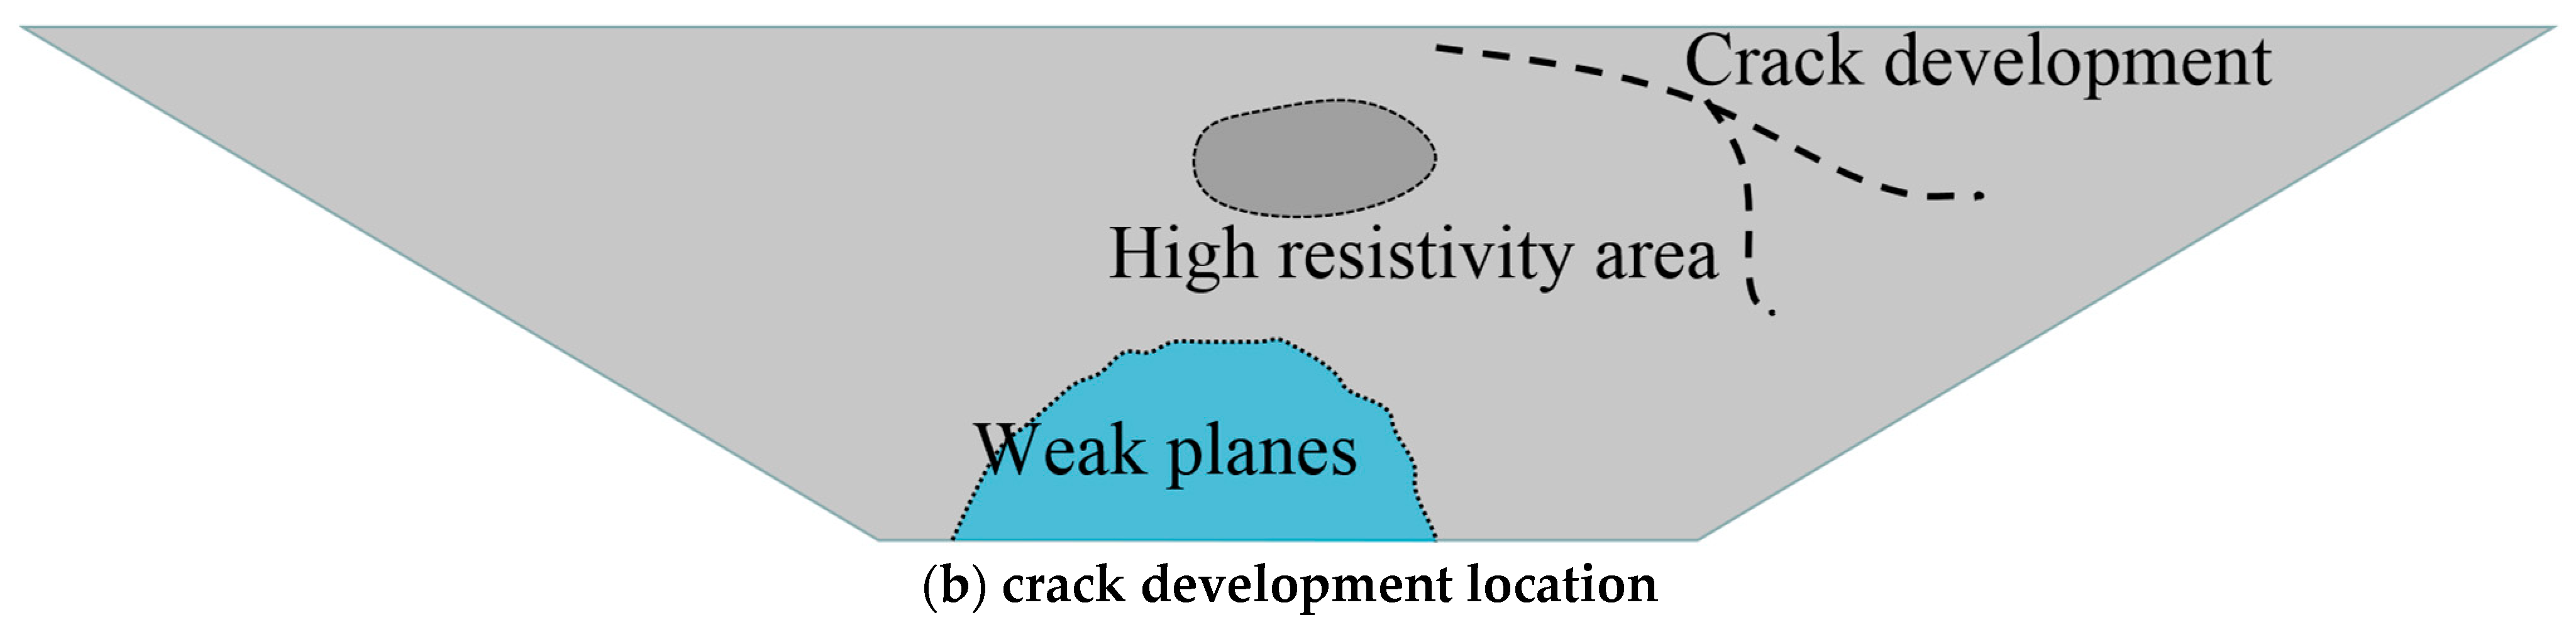
4.3. Development Trend of Disaster Sources in the Survey Line Area
5. Discussion
5.1. Geoelectric Field Response Mechanism of Disaster Source Development
5.2. Geoelectric Field Distribution Characteristics under Disaster Source Evolution
6. Conclusions
Author Contributions
Funding
Institutional Review Board Statement
Informed Consent Statement
Data Availability Statement
Conflicts of Interest
References
- Zhao, H.B.; Wei, Z.Q.; Luo, K. Stability and control measures of open—Pit mine dump slope under rainfall conditions. J. Coal. Sci. Technol. 2019, 47, 67–74. [Google Scholar]
- Bai, H.L.; Feng, W.K.; Yi, X.Y.; Fang, H.Y.; Hu, R. Group-occurring landslides and debris flows caused by the continuous heavy rainfall in June 2019 in Mibei village, Longchuan County, Guangdong Province, China. J. Nat. Hazards 2021, 108, 3181–3201. [Google Scholar] [CrossRef]
- Caracciolo, D.; Arnone, E.; Conti, F.L.; Noto, L.V. Exploiting historical rainfall and landslide data in a spatial database for the derivation of critical rainfall thresholds. J. Environ. Earth Sci. 2017, 76, 222. [Google Scholar] [CrossRef]
- Rodríguez-Pacheco, R.; Caparrós, A.V.; Alcolea, A.; Martínez-Pagán, P.; Martínez-Segura, M.A.; García-García, C.; Faz, Á.; Corral, I.; Roque, C.; Zarroca, M. Static Liquefaction Causes the Flow Failure of a Tailings Dam: A Case Study of El Descargador, Cartagena-La Unión Mining Region, SE Spain (October 1963). Minerals 2022, 12, 1488. [Google Scholar] [CrossRef]
- Damiano, E.; Greco, R.; Guida, A.; Olivares, L.; Picarelli, L. Investigation on rainwater infiltration into layered shallow covers in pyroclastic soils and its effect on slope stability. J. Eng. Geol. 2017, 220, 208–218. [Google Scholar] [CrossRef]
- Ma, J.Q.; Fu, H.Y.; Wang, G.Y.; Zeng, L.; Shi, Z.N. Seepage characteristics of layered soil slope under rainfall conditions. J. Cent. South Univ. Sci. Technol. 2018, 49, 464–471. [Google Scholar]
- Lazar, A.; Vižintin, G.; Beguš, T.; Vulić, M. The Use of Precise Survey Techniques to Find the Connection between Discontinuities and Surface Morphologic Features in the Laže Quarry in Slovenia. Minerals 2020, 10, 326. [Google Scholar] [CrossRef]
- Zhao, Z.H. Detection of Geological Disaster and Instability Risk Assessment of Open Pit High Slope; China University of Mining & Technology: Beijing, China, 2015. [Google Scholar]
- Liu, Y.; Xu, C.; Huang, B.; Chen, Z. Landslide displacement prediction based on multi-source data fusion and sensitivity states. J. Eng. Geol. 2020, 12, 112–128. [Google Scholar] [CrossRef]
- Kang, E.S.; Meng, H.D.; Zhao, Z.H.; He, T. Investigation on Factors Affecting Slope Instability in Open-pit Mines Based on Geophysical Prospecting Technology. J. Gold Sci. Technol. 2020, 28, 363–371. [Google Scholar]
- Liang, C.; Wu, Z.; Liu, X.; Xiong, Z.; Li, T. Analysis of shallow landslide mechanism of expansive soil slope under rainfall: A case study. J. Arab. J. Geosci. 2021, 14, 584. [Google Scholar] [CrossRef]
- Zhou, Z.; Zhang, J.M.; Ning, F.L.; Luo, Y.; Wang, J.L. Temporal and spatial characteristics of moisture migration and instability mechanism of cracked soil slope under rainfall infiltration. J. Traffic. Transp. Eng. 2020, 20, 107–119. [Google Scholar]
- Wang, L.; Li, G.; Chen, Y.; Tan, J.M.; Wang, S.M.; Guo, F. Field model test on failure mechanism of artificial cut-slope rainfall in Southern Jiangxi. J. Rock Soil Mech. 2021, 42, 846–854. [Google Scholar]
- Ismail, N.E.H.; Taib, S.H.; Abas, F.A.M. Slope monitoring: An application of time-lapse electrical resistivity imaging method in Bukit Antarabangsa, Kuala Lumpur. J. Environ. Earth Ences 2019, 78, 14. [Google Scholar] [CrossRef]
- Liu, T.F.; Nie, Y.X.; Hu, L.M.; Zhou, Q.Y.; Wen, Q.B. Model tests on moisture migration based on high-density electrical resistivity tomography method. J. Chin. J. Geotech. Eng. 2016, 38, 761–768. [Google Scholar]
- Yan, Y.J.; Yan, Y.S.; Zhao, G.Z.; Zhang, T.L.; Sun, Q. Study on moisture migration in natural slope using high-density electrical resistivity tomography method. J. Rock Soil Mech. 2019, 40, 2807–2814. [Google Scholar]
- Ou, Y.; Zhang, P.; Wang, W. Study on the evolution rule of land damage based on electrical resistivity imaging technology in mining face. J. Geotech. Geol. Eng. 2019, 37, 259–4268. [Google Scholar] [CrossRef]
- Li, X.W.; Zhou, H.X.; Che, A.L. Application of resistivity method in the study of damage accumulation of rock slope with weak intercalation. J. Eng. Geol. 2021, 776, 1–10. [Google Scholar]
- Fredlund, D.G. Unsaturated soil mechanics in engineering practice. J. Geotech. Geoenviron. 2006, 132, 286–321. [Google Scholar] [CrossRef]
- Liu, Y.; Hu, B.; Sheng, J.L.; Li, J.; Cui, K. Rainfall seepage characteristics of open-pit high slopes with gently-inclined soft interlayers. J. Hydro-Sci. Eng. 2021, 5, 67–75. [Google Scholar]
- Zhang, H.Y.; Wang, S.Y.; Zhao, T.Y.; Wang, Z.S. Determination of water content of saline soil with multi-electrode resistivity method. J. Hydrogeol. Eng. Geol. 2012, 39, 95–101. [Google Scholar]
- Du, P.H.; Yu, J.M.; Zhao, G.Z. Resistivity water Content Model of a Typical Loam Section. J. Water Resour. Archit. Eng. 2021, 19, 36–40. [Google Scholar]
- Wang, C.; Xu, Y.Q.; Gao, X.G. Electrical resistivity variation of compressed rock and damage evolution of overburden in coal mine goaf. J. Coal Eng. 2020, 52, 64–69. [Google Scholar]
- Jiang, W.L.; Liu, Y. Study on variation of electrical resistivity under uniaxial pressure environment for rocks. J. Geol. 2009, 33, 299–302. [Google Scholar]
- Li, S.C.; Xu, X.J.; Liu, Z.Y.; Yang, W.M.; Liu, B.; Zhang, X.; Wang, Z.C.; Nie, L.C.; Li, J.L.; Xu, L. Electrical resistivity and acoustic emission response characteristics and damage evolution of sandstone during whole process of uniaxial compression. J. Chin. J. Rock Mech. Eng. 2014, 33, 14–23. [Google Scholar] [CrossRef]
- Zhang, D.; Wang, X.T. Rapd least-squares inversion of 2-D apparent resistivity pseudosection. J. Comput. Tech. Geophys. Geochem. Explor. 1999, 21, 1–12. [Google Scholar]
- Sun, W.M.; Sun, D.L.; Li, W.Z.; Qi, Y.F.; Sun, N.Q. Technology of Detecting Dyke’s Hidden Danger Using Time-lapse High-density Resistivity Method. J. Yangtze River Sci. Res. Inst. 2019, 36, 157–160. [Google Scholar]
- Li, W.Z.; Sun, W.M.; Zhou, H.M. Research on time-shift high-density electrical method for detecting hidden dangers in dikes. J. Yangtze River 2019, 50, 113–118. [Google Scholar]
- Zhang, J.Z. Application of Time-lapse Resistivity Method on Refuse Dump Percolate Monitoring. J. Coal Geol. China 2019, 31, 80–85. [Google Scholar]
- Sun, J.G. Archie’s formula: Historical backgroundand earlier debates. J. Prog. Geophys. 2007, 22, 472–486. [Google Scholar]
- Morris, P.H.; Graham, J.; Williams, D.J. Cracking in drying soils. J. Can. Geotech. J. 1992, 29, 263–277. [Google Scholar] [CrossRef]
- Najm, M.A.; Mohtar, R.H.; Weiss, J.; Braudeau, E. Assessing internal stress evolution in unsaturated soils. J. Water Resour. Res. 2009, 45, W00C11. [Google Scholar]
- Xu, Q.L.; Tang, C.S.; Liu, C.L.; Zeng, H.; Lin, L.; Hu, Z.H. Review on soil desiccation cracking behavior and the mechanism related to fracture mechanics. J. Earth Sci. Environ. 2018, 40, 223–236. [Google Scholar]
- Xie, T.; Lu, J. Apparent resistivity anisotropic variations in cracked medium. Chin. J. Geophys. 2020, 63, 1675–1694. [Google Scholar]
- An, R.; Kong, L.W.; Bai, W.; Li, C.S. The resistivity damage model of residual under uniaxial load and the law of drying-wetting effects. J. Chin. J. Rock Mech. Eng. 2020, 39 (Suppl. S1), 3159–3167. [Google Scholar]
- Reynolds, J.M. An Introduction to Applied and Environmental Geophysics; John Wiley & Sons: Hoboken, NJ, USA, 2002; p. 796. ISBN 0-471-95555-8. [Google Scholar]
- Zhang, T.L.; Yan, Y.S.; Wu, J.B.; Sun, Q.; Zhu, Y.H. Study on Model between Water Content and Electrical Resistivity for Natural Slope of Silty Clay. J. Irrig. Drain. 2020, 39, 126–129. [Google Scholar]
- Mojid, M.A.; Cho, H. Wetting Solution and Electrical Double Layer Contributions to Bulk Electrical Conduc-tivity of Sand-Clay Mixtures. J. Vadose Zone J. 2008, 7, 972–980. [Google Scholar] [CrossRef]
- Fukue, M.; Minato, T.; Horibe, H.; Taya, N. The micro-structures of clay given by resistivity measurements. J. Eng. Geol. 1999, 54, 43–53. [Google Scholar] [CrossRef]
- Zhang, F.D.; Pan, B.Z. Application of three water model in reservoir log interpretation in Yaoyingtai oil field. J. Glob. Geol. 2009, 28, 226–232. [Google Scholar]
- Mo, X.W.; He, D.H.; Li, Z.B.; Wen, X.C.; Li, G.R. The application of three-water conduction model in the interpretation of low-resistivity reservoir. J. Chang. Univ. Sci. Technol. 2001, 31, 92–95. [Google Scholar]
- Zhang, L.H.; Pan, B.Z.; Li, Z.B.; Mo, X.W.; Xia, Z.L.; Xu, W.L. New three-water conduction model and its application in the evaluation of low porosity and low permeability reservoir. J. Pet. Geophys. Prospect. 2010, 45, 431–435. [Google Scholar]
- Archie, G.E. The electrical resistivity log as an aid in determining some reservoir characteristics. J. Trans. Am. Inst. Mech. Eng. 1942, 146, 54–62. [Google Scholar] [CrossRef]
- Liang, X.; Zou, C.C.; Mao, Z.Q.; Shi, Y.J.; Hu, X.X. Estimation of water saturation from nuclear magnetic resonance (NMR) and conventional logs in low permeability sandstone reservoirs. J. Pet. Sci. Eng. 2013, 108, 40–51. [Google Scholar]
- Zhang, L.H.; Pan, B.Z.; Li, N.; Mo, X.W.; Xia, Z.L.; Xu, W.L. Evaluation of low-porosity and low-permeability reservoirs based on the three-water model based reservoir classification method. J. Logging Technol. 2011, 35, 31–35. [Google Scholar]
- Fu, C.D.; Wang, A.Y. Improvement of new three-water model and determination of its parameters. J. Jilin Univ. Earth Sci. Ed. 2022, 52, 654–661. [Google Scholar]
- Wang, Y.M.; Pan, B.Z.; Li, M.; Zhang, L.H. Electrical and dielectric properties of three types of pore water and their frequency dispersion characteristics. J. Prog. Geophys. 2018, 33, 1989–1996. [Google Scholar]
- Ren, Y.; Jiang, X.Y.; Wu, C.H.; Meng, S.Y.; Zhao, Z.X. Experimental study on fissure properties and soil-water response of red clay slope under dry-wet cycle. J. Water Resour. Hydropower Eng. 2022, 53, 172–179. [Google Scholar]
- Tang, C.S.; Shi, B.; Cui, Y.J. Behaviors and mechanisms of desiccation cracking of soils. J. Chin. J. Geotech. Eng. 2018, 40, 1415–1423. [Google Scholar]
- Liu, Q.; Qiu, L.M.; Zu, Z.Y.; Luo, W.D.; Wei, S.Y.; Cheng, X.H.; Yin, S. Variation characteristics of apparent resistivity of fractured coal sample in loading process. J. Xi’an Univ. Sci. Technol. 2021, 41, 731–738. [Google Scholar]


| Sedimentation Coefficient (%) | Slope Angle (°) | Cohesive Forces (kPa) | Angle of Internal Friction (°) |
|---|---|---|---|
| 15 | 32 | 36.5 | 38.4 |
| Slope Parameters | Value |
|---|---|
| Length (m) | 3 |
| Width (m) | 2 |
| Height (m) | 0.7 |
| Width of slope top (m) | 0.75 |
| Slope angle (°) | 32 |
| Rainfall intensity (mm/min) | 0.21 |
| Type | Dry Density (g·cm−3) | Wet Density (g·cm−3) | Permeability Coefficient (cm·s) | Mass Ratio of Materials |
|---|---|---|---|---|
| Soil | 1.231 | 1.657 | 5 | |
| Sand | 1.339 | 1.725 | 3 | |
| Small grain stone | 1.347 | 1.949 | 1 | |
| Mixture | 1.295 | 1.836 | 4.06 × 10⁻⁵ |
| Number | Particle Size (d/mm) | Mass Fraction (%) |
|---|---|---|
| 1 | >2 | 3.1 |
| 2 | 2—1 | 8.7 |
| 3 | 1—0.5 | 27.8 |
| 4 | 0.5—0.125 | 26.7 |
| 5 | 0.125—0.075 | 32.5 |
| 6 | <0.075 | 4.3 |
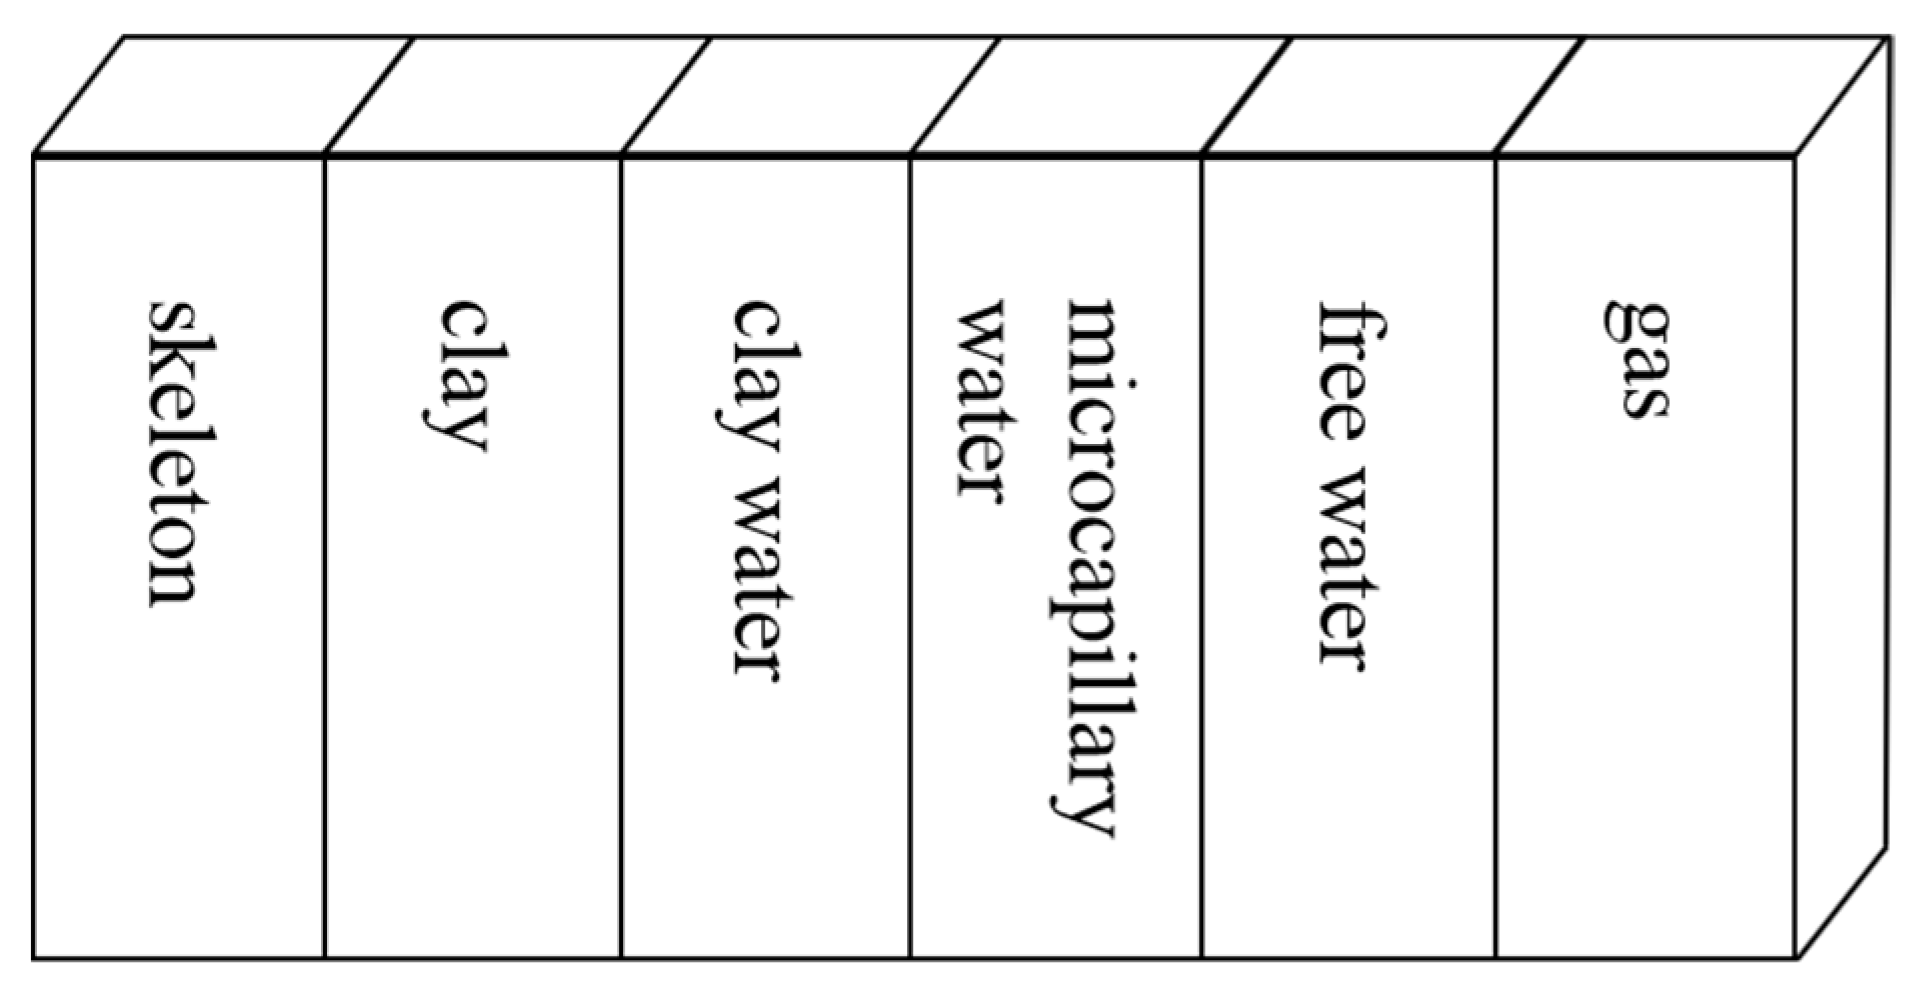
| Three Water Model | Rock | Soil |
|---|---|---|
| Free water | Gravity water | Gravity water |
| Clay water | Bound water on clay surface | Bound water |
| Microcapillary water | Capillary water and bound water on skeleton surface | Capillary water |
Disclaimer/Publisher’s Note: The statements, opinions and data contained in all publications are solely those of the individual author(s) and contributor(s) and not of MDPI and/or the editor(s). MDPI and/or the editor(s) disclaim responsibility for any injury to people or property resulting from any ideas, methods, instructions or products referred to in the content. |
© 2023 by the authors. Licensee MDPI, Basel, Switzerland. This article is an open access article distributed under the terms and conditions of the Creative Commons Attribution (CC BY) license (https://creativecommons.org/licenses/by/4.0/).
Share and Cite
Kang, E.; Meng, H.; Zhao, Z.; Zhao, Z. Distribution Characteristics of the Geoelectric Field in Waste Dump Slopes during the Evolution of Instability Sources under Rainfall Conditions. Appl. Sci. 2023, 13, 6459. https://doi.org/10.3390/app13116459
Kang E, Meng H, Zhao Z, Zhao Z. Distribution Characteristics of the Geoelectric Field in Waste Dump Slopes during the Evolution of Instability Sources under Rainfall Conditions. Applied Sciences. 2023; 13(11):6459. https://doi.org/10.3390/app13116459
Chicago/Turabian StyleKang, Ensheng, Haidong Meng, Zexi Zhao, and Zihao Zhao. 2023. "Distribution Characteristics of the Geoelectric Field in Waste Dump Slopes during the Evolution of Instability Sources under Rainfall Conditions" Applied Sciences 13, no. 11: 6459. https://doi.org/10.3390/app13116459