Article

An Integrated Approach for the Environmental Characterization of a Coastal Area in the Southern Atacama Desert

1
Centro de Investigaciones Costeras de la Universidad de Atacama (CIC-UDA), Av. Copayapu 485, Copiapó 1530000, Chile
2
Centro Regional de Investigación y Desarrollo Sustentable de Atacama (CRIDESAT), Universidad de Atacama, Av. Copayapu 485, Copiapó 1530000, Chile
3
Instituto de Investigaciones Científicas y Tecnológicas de la Universidad de Atacama (IDICTEC-UDA), Av. Copayapu 485, Copiapó 1530000, Chile
4
Departamento Biología y Geología, Física y Química Inorgánica, Universidad Rey Juan Carlos, Calle Tulipán s/n, 28933 Móstoles, Spain
5
Independent Researcher, Copiapó 1530000, Chile
6
SEREMI del Medio Ambiente Región de Atacama, Ministerio de Medio Ambiente, Gobierno de Chile, Calle Portales 830, Copiapó 1530358, Chile
*
Author to whom correspondence should be addressed.
Appl. Sci. 2023, 13(11), 6360; https://doi.org/10.3390/app13116360
Submission received: 23 March 2023 / Revised: 4 May 2023 / Accepted: 11 May 2023 / Published: 23 May 2023

Abstract

:
Desert areas in northern Chile are highly valuable ecosystems. While human activities are impacting the area in different ways, there are few environmental studies available. The current study analysed the ecological health status (water, sediment, biota) of a northern coastal area in the Atacama Region, including a national park (with a protected marine area), a tourist and benthic management area, and an industrial area. Results from the physical–chemical characterization and physiological state of organisms of ecological importance (macroalgae and microalgae) were integrated to determine pollution and toxic responses. The results identified high and moderate pollution levels for Bi, Ca, As, Ag and Cd in sediments. The As concentration in sediments is the leading environmental problem, with average values above the threshold effect level, associated with fine sediments. The stations showed increasing contamination and stress from north to south (national park > tourist and benthic management area > industrial area), associated with the proximity to the discharge of mining waste from the Salado River. The national park registered the poorest health status as demonstrated by high Cu bioaccumulation and high photosynthetic stress in the macroalgae and the lowest biomass concentration of the microalgae in water. The tourist and benthic management area demonstrated high As concentrations in sediments and Cd bioaccumulation. The industrial area was the least contaminated area, exhibiting lower photosynthetic stress and bioaccumulation.

1. Introduction

Desert areas have a low level of environmental monitoring worldwide, as they are remote and spread out over a wide area and are therefore difficult to access. One such area is in northern Chile, including the Atacama Desert in the Atacama region, which occupies 10% of the national territory and is home to 1.6% of the national population. Here, the coastal waters are affected by human activities, such as industrial development, ports, desalination plants and tourism, among others [1]. One of the most important economic sectors in northern Chile is the mining of gold, silver, molybdenum, iron and lithium, and above all the extraction of copper (30% of global production). This region is also known for its vineyards as well as the cultivation of olives and other fruit crops. Other pressures on these coastal areas are intensive aquaculture, marine resource extraction and tourism. Vast amounts of water are needed due to these activities, which requires the installation of desalination plants. The largest desalinization plant in Latin America (1200 L s−1 treated water, [2]) will be installed in this region. Hence, human actions have a direct and indirect impact on the marine environment [3]. Despite these intensive human pressures in this desert area, [1] there is a considerable scientific knowledge gap about whether and how contaminants affect the health status of marine ecosystems.
One of the easiest ways to achieve environmental assessment is biomonitoring. For instance, the use of organisms to test an ecosystem’s health status is an appealing tool for assessing pollution in aquatic ecosystems [4]. The target organisms are usually (semi-)sessile and can reflect the effects of the environment through biochemical, morphological or physiological responses. Bivalves, gastropods, lugworms, fish and macrophytes are commonly used. In the current study, a kelp of the genus Lessonia was selected as a target species because it is a suitable model for describing ecosystems. Lessonia berteroana is widely distributed on hard bottoms in northern Chile [5]. It is an economic and social resource species, common in the intertidal and shallow subtidal zone [6], and has been previously used for biomonitoring through bioaccumulation [7], abundance and morphometric features, fertility and sporophyte formation [8], and ecophysiological traits [9,10]. Microalga biomass is one of the most commonly used attributes in water quality monitoring studies, as it consistently responds to stressors [11] but also serves as an early warning system [12].
Integrating the environmental status (presence and abundance of contaminants) and biological responses of biota is often carried out using statistical tools. In particular, factor analysis allows the generated data to be grouped into new variables. The methodology is used in numerous areas of the world to determine the contamination and toxicity caused by different sources, using different target species and endpoints [13,14,15,16,17]. It is the main statistical method of research in the life sciences [18].
An earlier study [1] found that there was a lack of environmental studies and much data were obsolete for an adequate environmental assessment; these studies are the basis for creating national environmental legislation. The aim of the current study is to assess a sector of the Atacama Region at 26° S along a stretch of 80 km with an expected pollution gradient, where an industrial area, a tourism/fishing area and a national park are located. We analysed and integrated different matrices (sediment, water, macroalga tissue and phytoplankton) to determine the pollution level and the health status of this coastal environment.

2. Materials and Methods
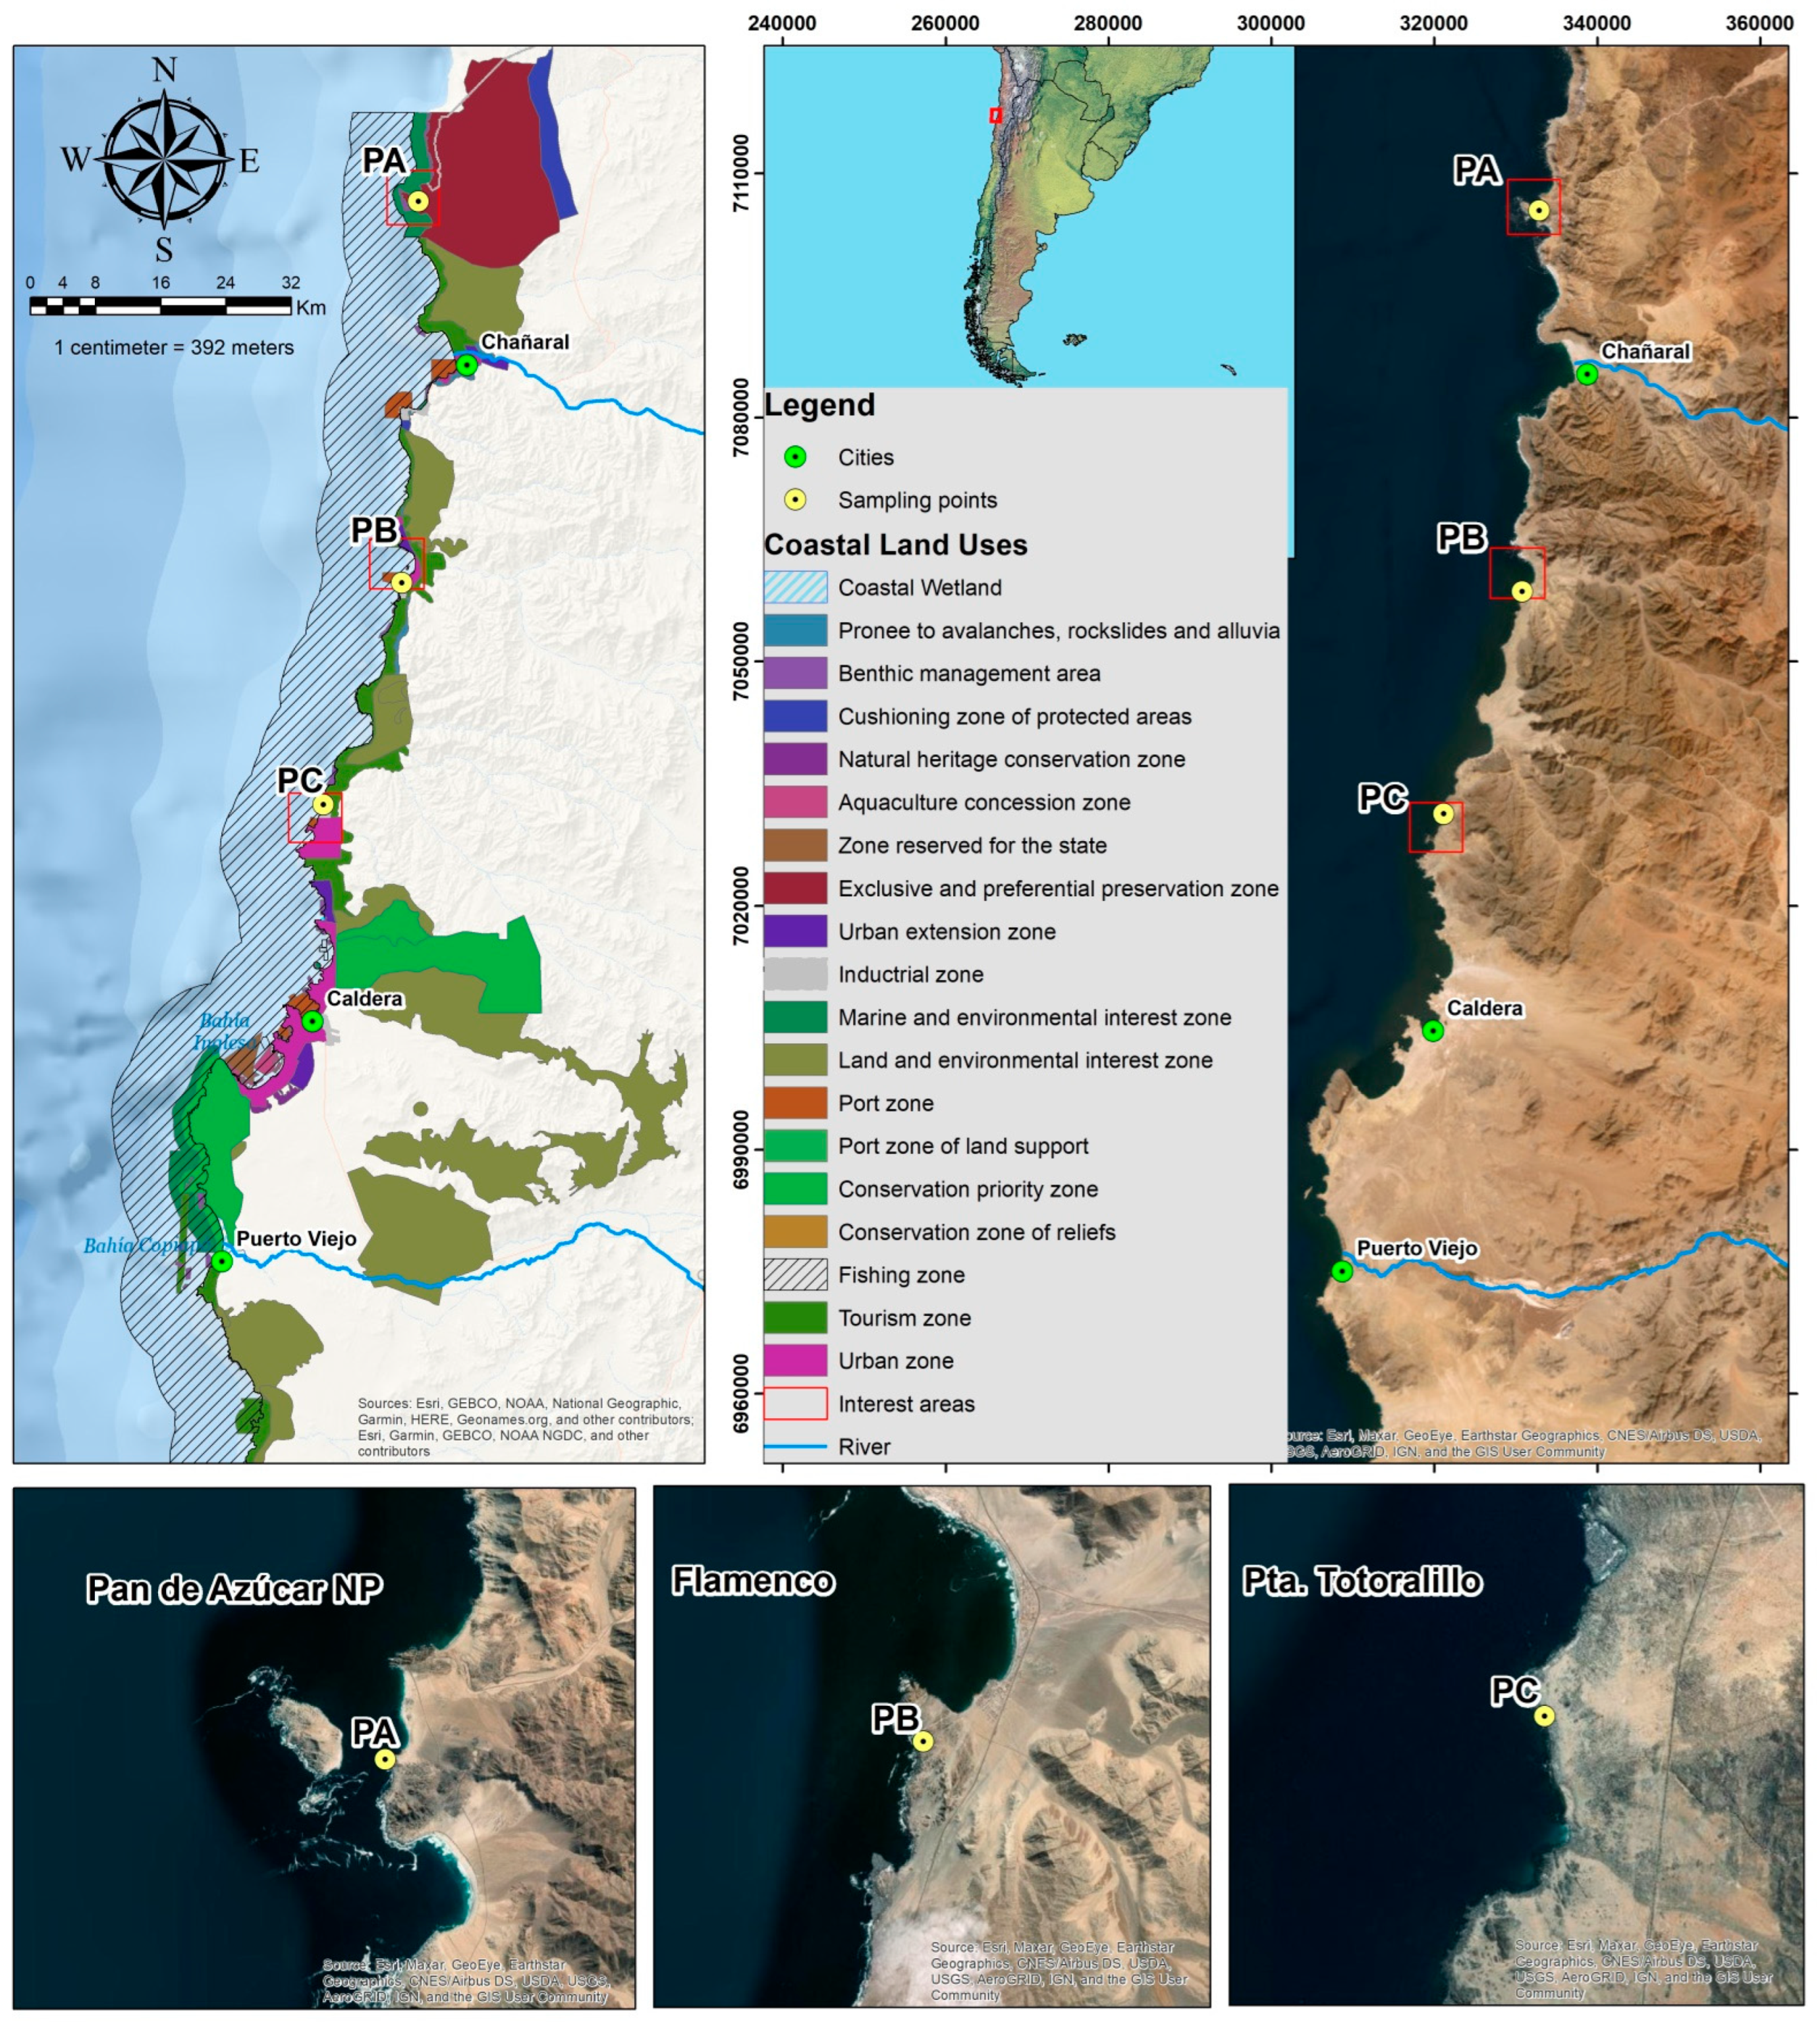
2.1. Sampling Sites

Sampling was carried out over three matrices (water, sediment and macroalgae) at three sites in the northern coastal area (26° S) of the Atacama Region (Figure 1). Pan de Azúcar (PA) National Park is located in the north of the Atacama Region, near a public access beach and campsite off Pan de Azúcar Island. It is a zone of marine and ecological interest, as well as an exclusive and preferential conservation zone, as this area is home to endemic species. Flamenco (PB) is a small fishing village, with a port for artisanal fishing and a benthos management area; it is considered an industrial zone but is also used for tourism. The last and most southern site is Punta Totoralillo (PC), where there is industrial area and an important port that exports mainly iron materials.
At each site, we measured the physical–chemical parameters (temperature—T, electrical conductivity—EC, redox potential—Eh, pH, and total dissolved solid—TDS) using a Hanna (HI98195) multi-parameter meter.
Water samples were collected (in triplicate) in sterile plastic bottles, filtered (0.22 µm), and acidified (pH < 2) for metal analyses. Water samples were collected in amber bottles for nutrient analysis. Some samples were collected for alkalinity analysis. An amount greater than one litre per site was used for chlorophyll determination. Sediment samples (triplicate) were collected from the upper layer (5 cm) from the intertidal area for grain size characterisation and multi-element analyses. Photosynthetic activity was determined in fronds of L. berteroana using a pulse-amplitude modulated fluorometer (Junior-PAM). Leaves of L. berteroana were sampled by hand at low tide for photosynthetic measurements. Additional fronds samples were preserved in the water from the collection site for transportation before further elemental analysis in the laboratory. All samples were refrigerated and transported to the laboratory in cold and dark conditions.

2.2. Chemical Analyses

The determination of carbonate and bicarbonate in the water was carried out with a titrimetric alkalinity test (MQUANT® Sigma-Aldrich, Schnelldorf, Germany). Grain size analysis was performed through sieve determination with Rotap instrumentation and following the standard classification [19]. Then, sediment samples were dried (40 ± 5 °C), sieved and homogenised. A subsample of 1 g was acid-digested (HNO3, H2O2, HCl) over a thermo-block (EPA 3051/3050). Fronds of L. berteroana were dried in an oven at 40 ± 5 °C and ground before acid digestion (HNO3conc, H2O2 and HClconc). Subsequently, the elemental analysis of water, sediment and alga extracts was carried out using atomic absorbance spectroscopy (AAS) and an inductively coupled plasma mass spectrometer (ICP-MS Agilent 7900) according to [20,21]. Certified reference standard materials were employed (SCL-22-598- Standard 2A Multi-element, and SCL-22-598- Standard 4 Multi-element) to certify the quality and accuracy of the analysis.

2.3. Photosynthetic Activity Determination

Photosynthetic measurements were taken with a pulse-amplitude modulated (PAM) chlorophyll fluorometer Junior-PAM (Walz GmbH, Effeltrich, Germany). After the samples were dark-adapted for 15 min, the maximum [Fv/Fm = (Fm − F0)/F0] quantum yields of photosystem II (PSII) were determined from the ground fluorescence (F0) in the presence of a weak measuring light (<1 µmol photons m−2 s−1) and maximum (Fm) fluorescence due to the application of a saturation light pulse (>9000 µmol photons m−2 s−1, 0.8 s). Samples were exposed to a series of increasing actinic light intensities (EAL) to determine the effective PSII-quantum yields [ΦPSII = (F’m − Ft)/F’m]. Every 30 s and before the intensity of the actinic light increased, a saturation pulse (>9000 µmol photons m−2 s−1, 0.8 s) was applied, and the corresponding terminal (Ft) and maximal (F’m) fluorescence yields were measured. The photosynthetic electron transport rates (ETR) were calculated as follows [22]:
ETR = ΦPSII × EAL × A × FII
where ΦPSII is the effective PSII-quantum yield, EAL is the actinic light intensity, A is the thallus absorptance and FII is the fraction of quanta absorbed by PSII (i.e., 0.8). The thallus absorptance A was measured using a cosine-corrected 2π PAR quantum sensor (Licor 192 SB; Li-COR Inc., Lincoln, Dearborn, MI, USA), and A was calculated as
A = 1 − (Et × E0−1) − R
where Et and E0 are the irradiances of the PAR-emitting light source used in the experiment, measured when the sensor was covered with one thallus of L. berteroana (transmitted light: Et) and remained uncovered (incident light: E0), respectively, and R is the reflectance (reflected fraction) of the thallus (i.e., 0.05). Values of ETR were plotted against the actinic light intensity (EAL), and the photosynthetic parameters (ETRmax, αETR, Ek) were determined by non-linear curve fitting of ETR-EAL curves after the model of [23]:
ETR = ETRmax × tanh (αETR × EAL ETRmax−1)
where ETRmax is the maximum ETR, tanh is the hyperbolic tangent function, EAL is the actinic light intensity and αETR is the initial slope of the ETR-EAL curve. The saturation irradiance for the photosynthetic electron transport (Ek) is the intercept between αETR and ETRmax (Ek = ETRmax αETR−1).

2.4. Chlorophyll Determination

The concentration of chlorophyll a (Chl-a) was determined in the collected water samples. Chl-a was extracted for 24 h in the dark in 90% acetone v/v, and data were calculated using the trichromatic equation of [24].

2.5. Data Treatment

The geoaccumulation index (Igeo; [25]) determined the degree of pollution in the collected sediments by comparison with the average of the upper crust concentrations [26].

2.6. Statistical Analyses

A one-way ANOVA (Kruskal–Wallis) followed by Dunn´s comparison test were applied to evaluate the differences in the concentrations of the elements in the sediments and algae, using the statistical program GraphPad Prism (version 5.03).
To determine the variable distribution of the environmental data (water n = 5, sediment n = 8) and algal responses (bioaccumulation n = 7, physiological responses n = 5), a multivariate factor analysis (FA) approach was applied following the methodology described in [14,27,28], with factor rotation using the varimax normalised procedure of the statistical package PAST3. A cut-off of 0.7 for the component loading was used to group the variables. The prevalence of the new factors per site was also calculated.

3. Results and Discussion

3.1. Water Chemistry

Samples from three matrices (water, sediment and biota) were collected in PA, PB and PC and analysed in the laboratory. The physical–chemical characterisation of water samples in the different stations is summarised in Table 1. Similar electrical conductivity (59 mS cm−1), salinity and total dissolved elements (29 ppt) were found in the water samples. The pH ranged between 7.53 and 7.68, and the redox potential was lower for PA (140 mV) than PB and PC (204 and 217 mV, respectively). The highest total alkalinity was found in PB (229 mg CaCO3), and the lowest in PC (185 mg CaCO3). The concentrations of a few elements (Fe, Ag, As, Pb, Mn) in water were below the detection limits (Supplementary Material Table S1) in the National Park (PA). The Cu concentration in water was highest in PA: 15 µg L−1 Cu, compared to 1.7 and 3.5 µg L−1 in PB and PC, respectively. The Cu concentration in PA was above the marine reference exposure limits of NOAA [29].

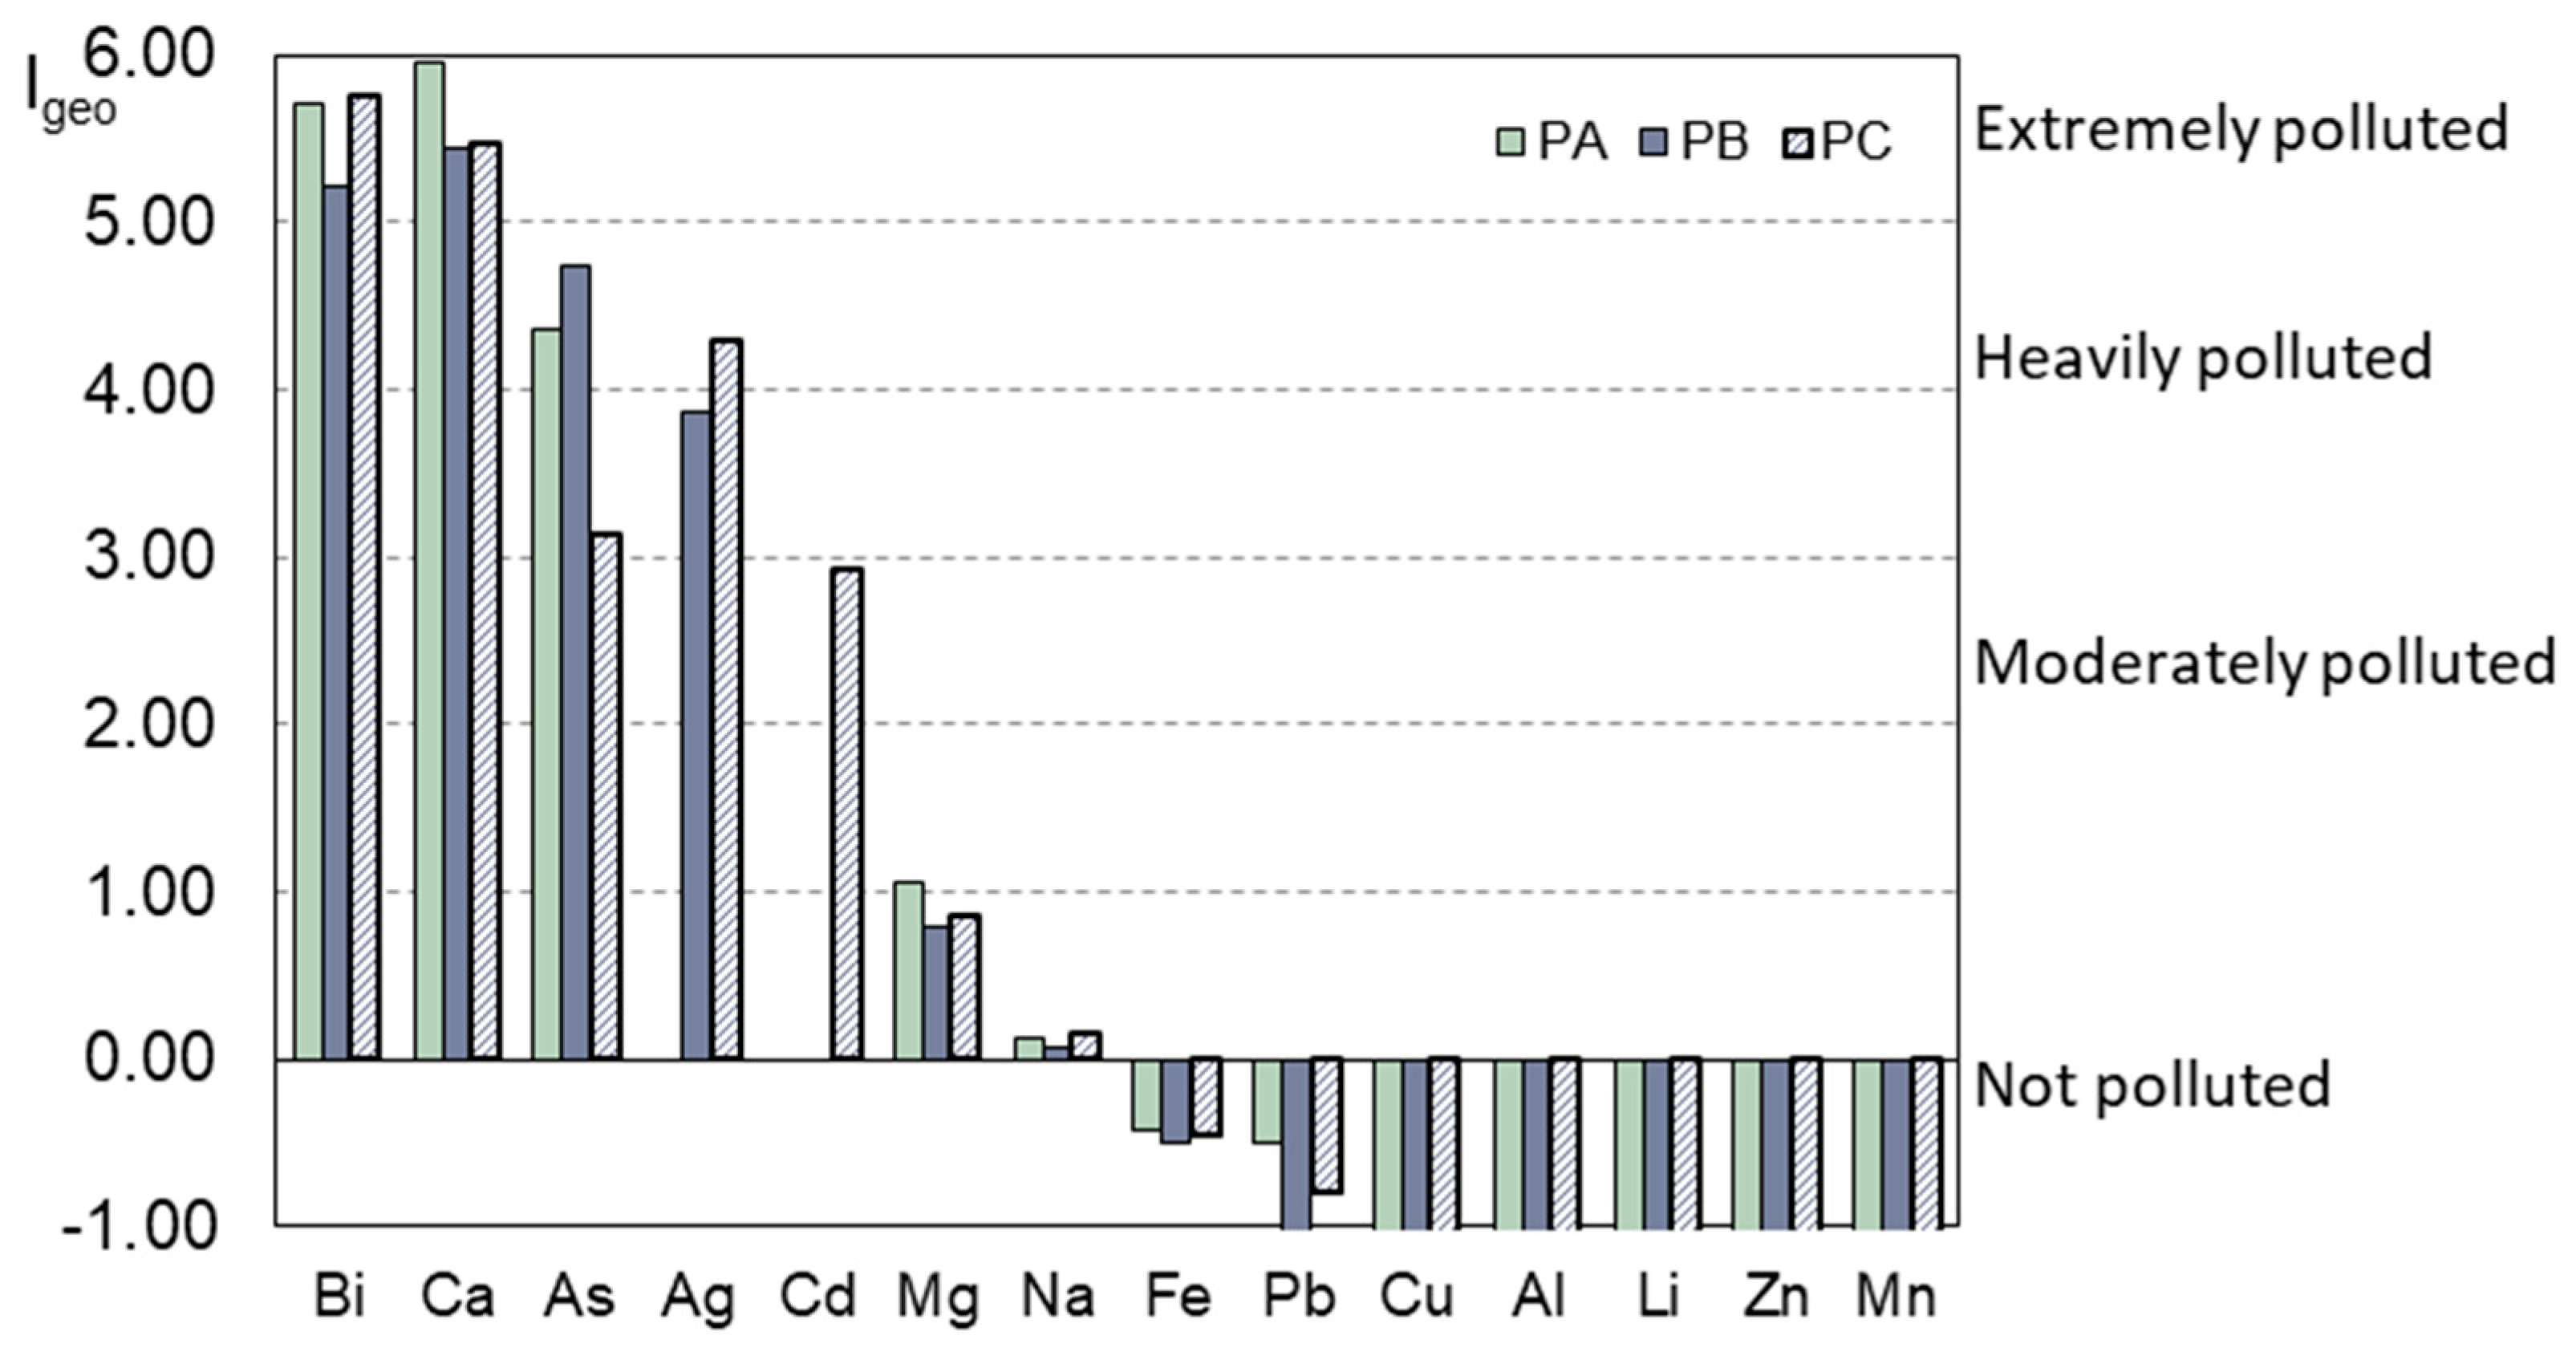
3.2. Sediment Characterisation

The grain size of sediment samples (SI, Figure S1) was predominantly coarse and very coarse sand (>60%). The least representative fractions were silt and mud (<0.23% for PA, <0.05% for PB and PC). The chemical composition of sediments in the different stations, plus average values and previous data collected, are summarised in Table 2. Cd concentration in sediments was below the detection limit for the northern stations, while 1.11 mg kg−1 was found in PC; this value was above the concentrations previously seen in the area (0.095 mg kg−1) (Table 2). Al concentration in sediments ranged between 1850 and 2247 mg kg−1; these concentrations were below values (4070 mg kg−1) previously reported in the area. Concentrations of Fe in sediments were similar to those found along the coast (3813 ± 271 mg kg−1). There was a significant accumulation of Cu in sediments from the National Park (PA, 9.31 mg kg−1), which surpassed the average concentration in the area (Table 2), although there is a massive accumulation in Chañaral from historical mining residue discharges (7.20–985 mg Cu kg−1) [30,31]. The Pb concentration in sediments varied in the study area, ranging between 7.67 and 27 mg kg−1: PA (21.30) > PC (17.17) > PB (10.66). Nevertheless, these are normal concentrations in the area; a previous study [30] found values from 1.57 to 51 mg Pb kg−1. The same tendency was found for As, where averaged concentrations (39.88 ± 18 mg kg−1) agreed with previous studies [32,33], who found concentrations between 38.10 and 117 mg kg−1. However, a significant difference (p < 0.05) was found between concentrations in sediments from PB (60.25 mg As kg−1) and PC (19.73 mg As kg−1). The concentrations of As surpassed the threshold effect levels (TEL), i.e., the concentrations had a certain probability of being toxic as tested through standard bioassays. The concentration of Zn in sediments from PC was significantly different (p < 0.05) for PA, but none of the concentrations surpassed the TEL values.
According to the calculated Igeo (Figure 2), the studied stations were classified from heavily to extremely polluted (Igeo > 4) by Bi and Ca, and moderately to heavily polluted (2 < Igeo< 4) by As, Ag and Cd. The study area was not polluted (Igeo < 1) for the rest of the studied elements (Mg, Na, Fe, Pb, Cu, Al, Li, Zn, Mn).

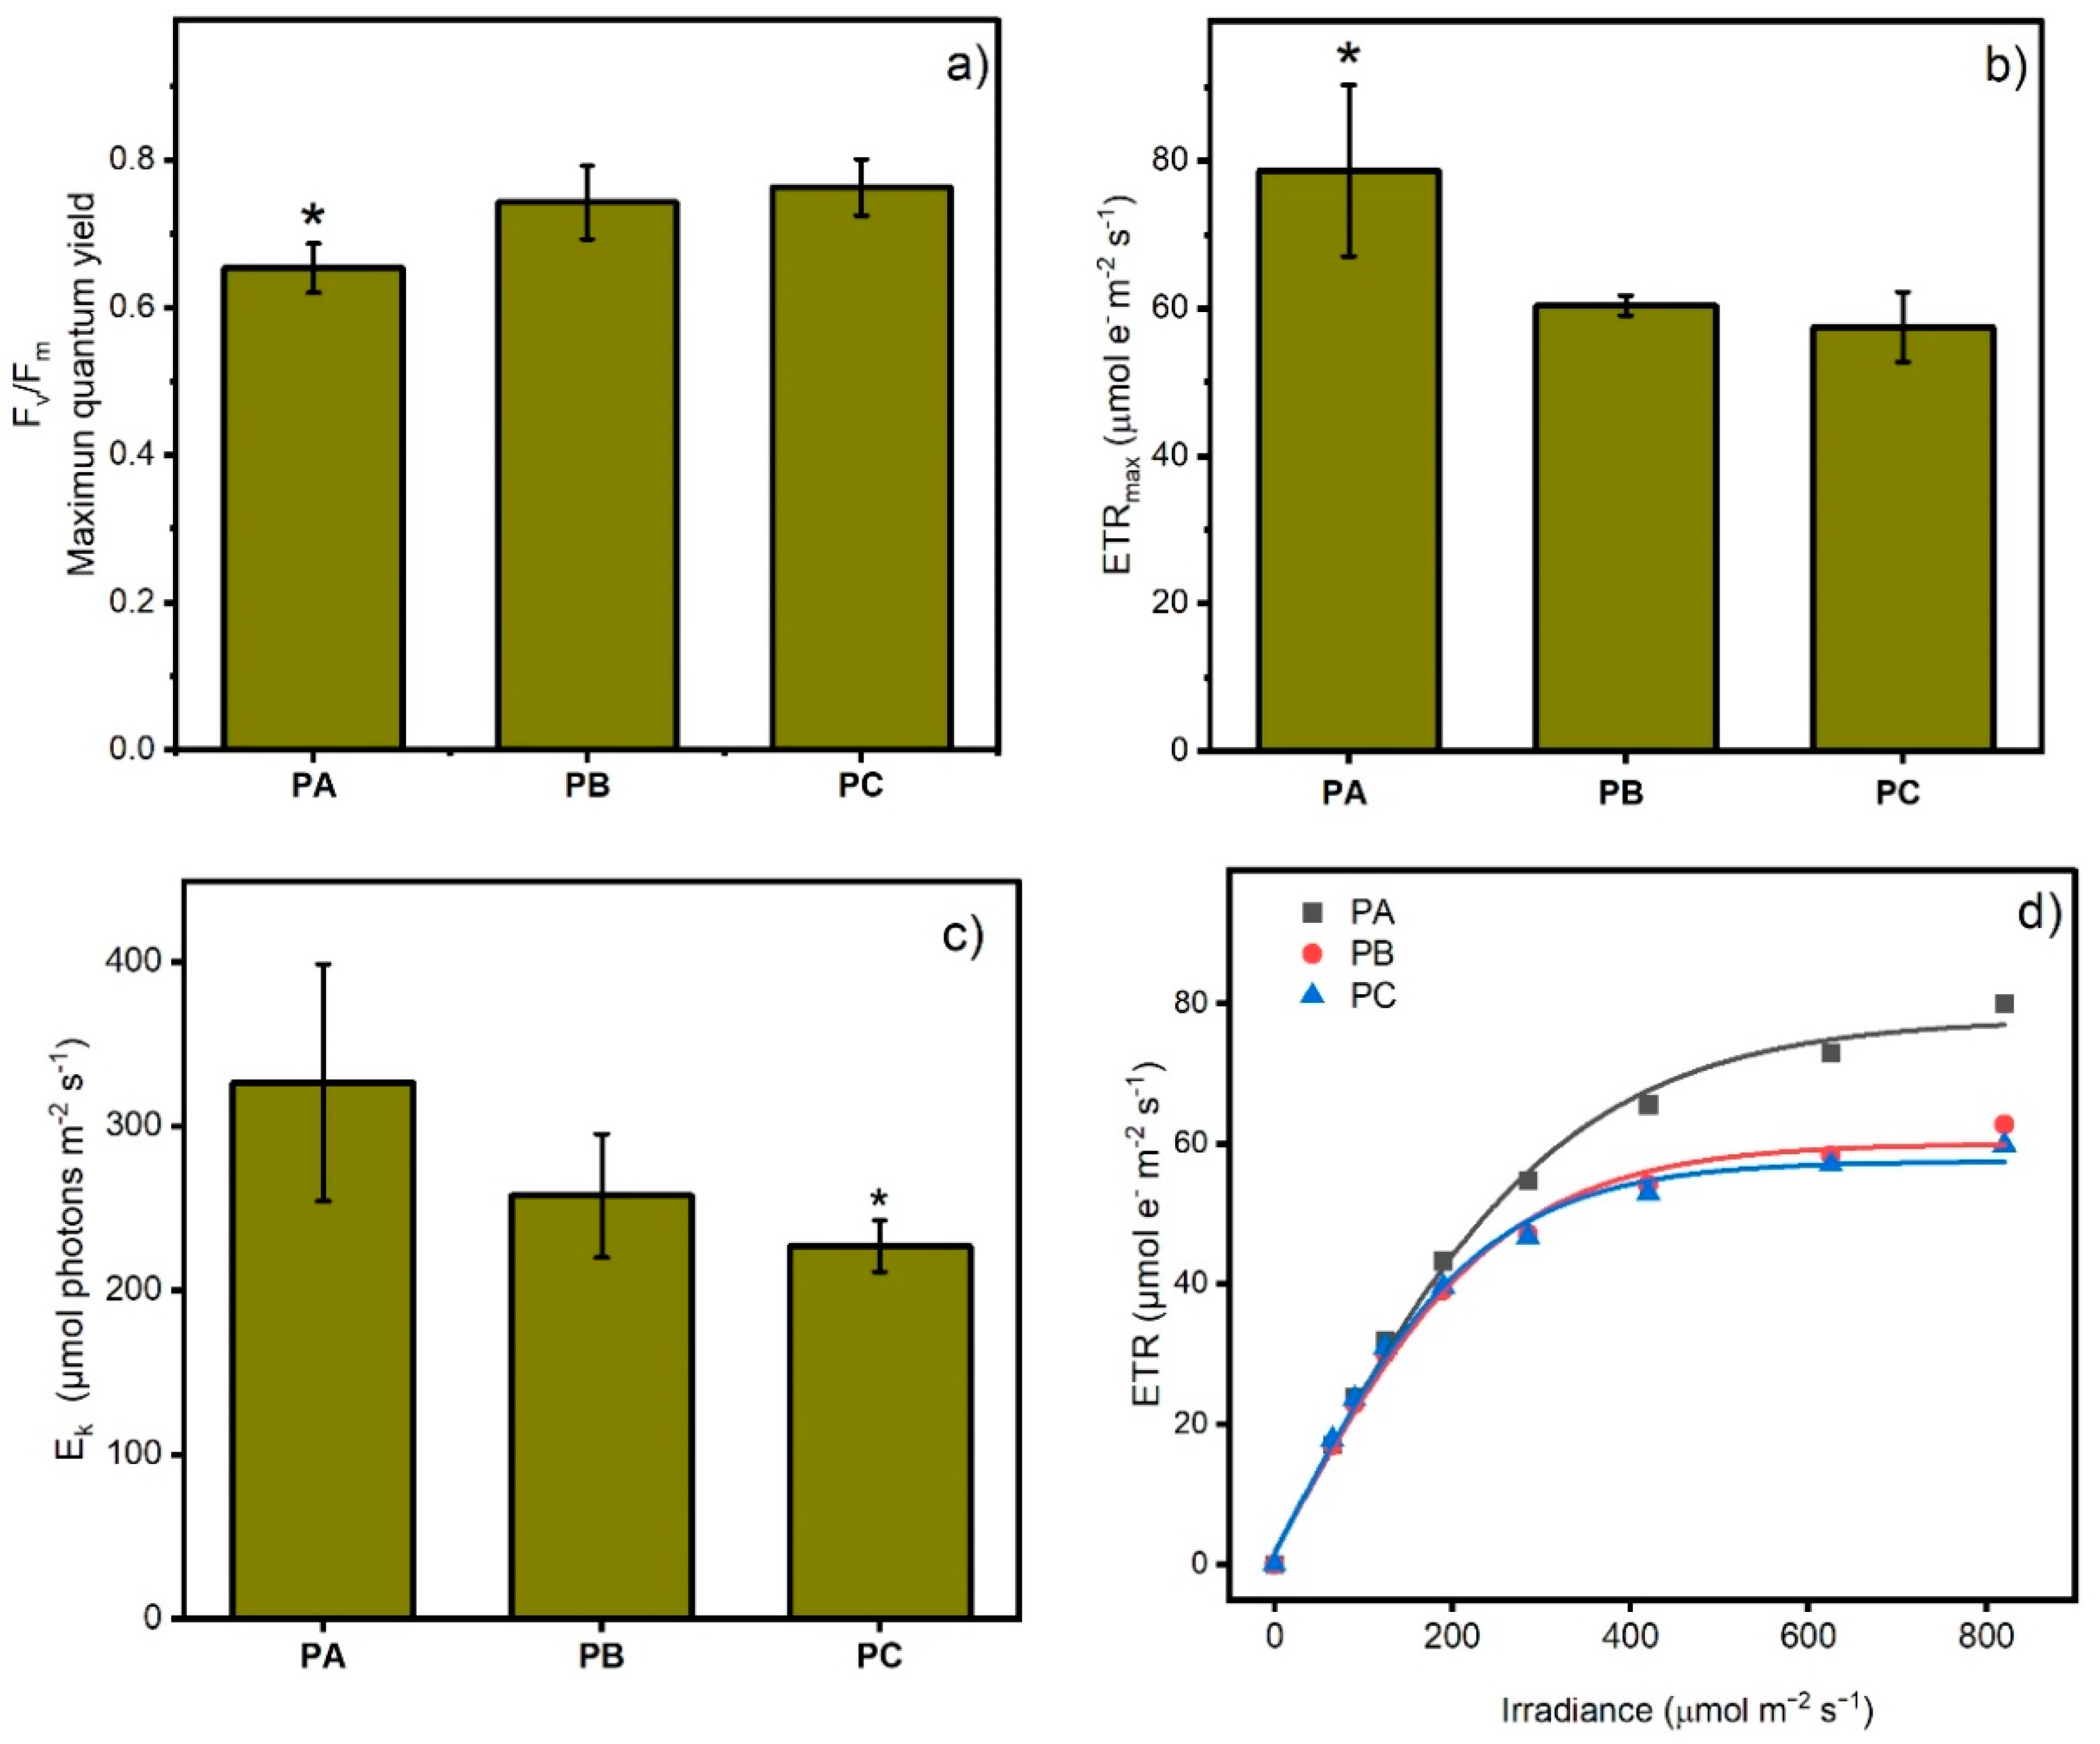
3.3. Algal Responses

The light curve and photosynthetic parameters of L. bertoreana showed latitudinal patterns for the study zone (Figure 3), with lower Fv/Fm values in PA and higher values towards PC. In contrast, ETRmax and EK presented the highest importance in PA and lower values in PB and PC. The PB and PC zones did not show significant differences in photosynthetic parameters with PC; however, their light curves were apparently different from that of PA.
The results of surface phytoplankton biomass measured as extractable Chl-a concentration (Table 3) showed an increase in chlorophyll concentration from the PA site to the PC site. The PA site showed the lowest average (p ≤ 0.05) surface chlorophyll relative to the PB and PC sites, which were not significantly different.

3.4. Bioaccumulation in Algal Tissue

Different bioaccumulation behaviour was observed in algae from the three stations. Some of the studied elements, such as Ag, Li and Mn, were found in low concentration in tissues of L. bertoreana. No significant differences were found in concentrations in tissues of most of the elements (Al, As, Bi, Ca, Mg, Pb and Zn) between the studied stations. Despite significant differences among As concentrations in sediments (Table 2), no significant difference was found in As concentration of algal tissue (Table 4). Significantly (p < 0.05) greater Cu, K and Na bioaccumulation were found in organisms from PA than from PC. Significant bioaccumulation of Fe was found in PB algae.

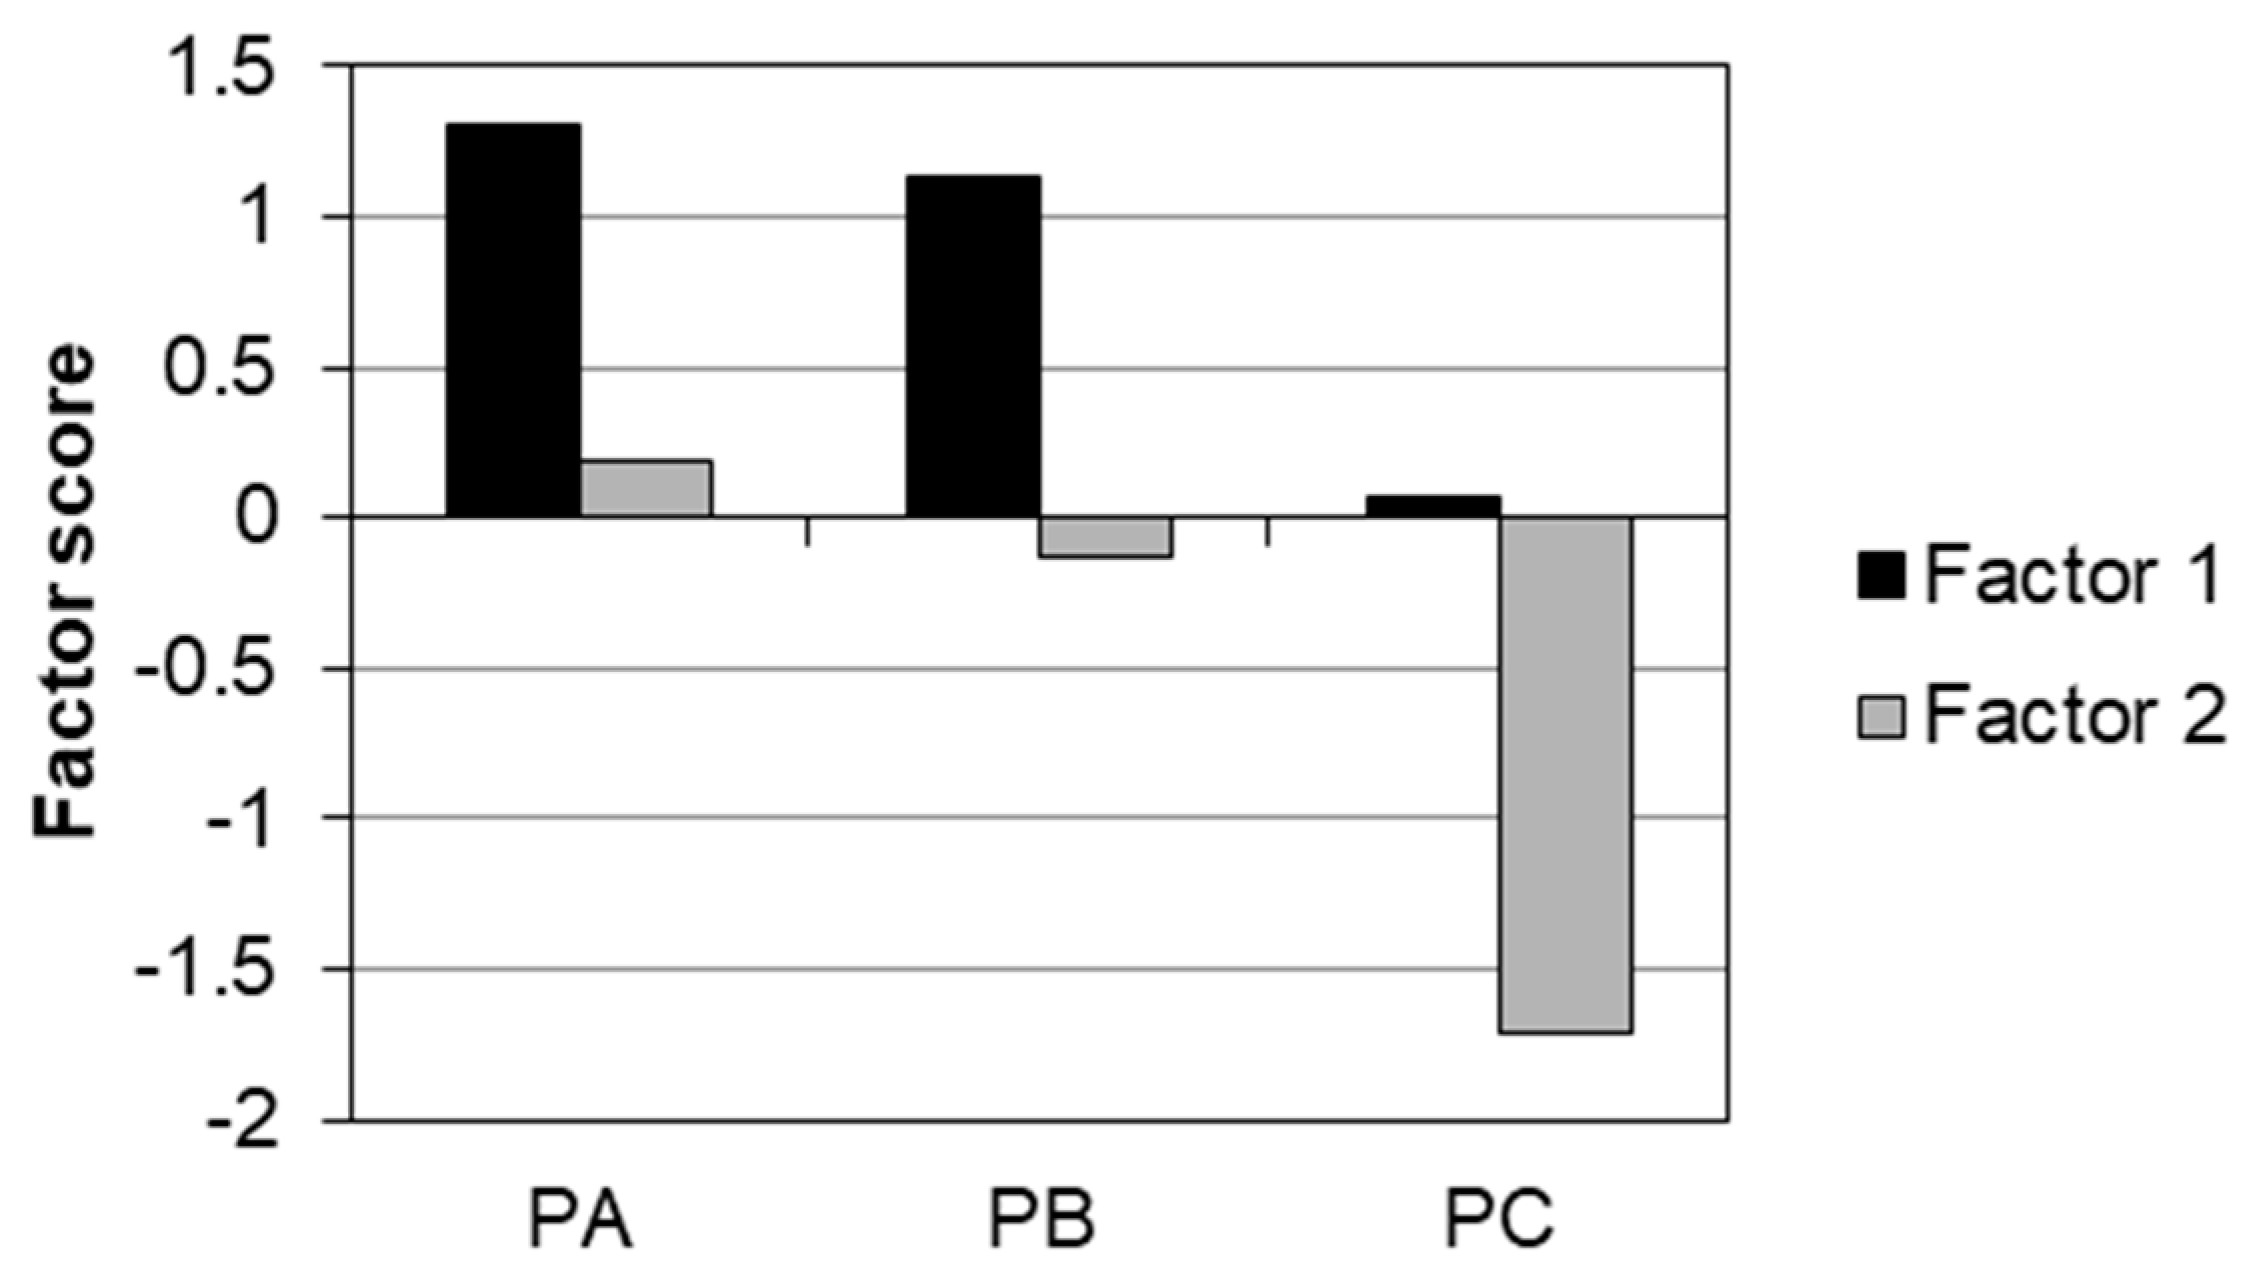
3.5. Multivariate Analysis Approach

Two principal factors were obtained from the FA (Table 5) run over the matrix of elements (Cu, Fe, Al, As, Pb, Zn) in water (W), sediments (S) and algae (A), percentage of fine sediments (fines) and the biological responses of the macroalga L. berteroana (ETR, Ek, α, Fv/Fm) and the microalga Chl-a. The relationship between the components and the factors is plotted as an estimated score per station in Figure 4.
Factor 1 accounted for 82.88% of the total variance, including environmental concentrations of As and its mobility in water, sediments and bioaccumulation, the effect over the microalga population, and the rest of the biological effects. It is also linked to contaminants associated with fine particulate matter of the sediment, As, Pb and Cd, and bioaccumulation of the elements (except Mn) with significant toxic effects. Therefore, Factor 1 is representative of PA and PB, and it is associated more with environmental degradation caused by As (Figure 4, Table 2), which is also reflected by As bioaccumulation in alga tissue and the biomass of microalgae (Table 4). The concentration of As in sediments from PB was eight times greater than the TEL value from the NOAA. However, the concentrations of other metals in alga tissues included in this factor, such as Fe, Cd, Mn and Zn, are also associated with the granulometry.
Factor 2, which accounted for 12.45% of the total variance, resulted in the combination of contamination by certain metals; only relations with the partition in the sediment of the Zn were included, as the rest had no influence (or minimum) with metal concentrations. There was a slight Cu accumulation, which is not appreciable compared to the bioaccumulation for the rest of the elements (except for Mn, which is not important from the point of view of contamination and the geochemical matrix). The biological effects were not significant in Factor 2. Therefore, Factor 2 is not associated with the toxicity of metals in water when there are negative values for PB and PC, and possibly also for PA, due to low values (Figure 4).
The PA site, at the northern border, is within the Pan de Azúcar National Park. Despite being a protected area, the results showed critical concentrations of Cu, Pb and Zn in sediments (Table 2), which might result from historical mining disposal in Chañaral Bay. The As concentration in sediments was also detected as dangerous in the area. These are responsible for most of the significant stress shown by the macroalgae, and contamination in the water is associated with the low chlorophyll activity of the phytoplankton (Table 3). PB is located in a tourism and fishing area, also influenced by components grouped in Factor 1; i.e., contamination of elements in sediments, such as As and Cu, reflects the specific stress on the physiology of L. bertoreana. Finally, PC is close to a factory; this site recorded low concentrations of toxic elements in water and sediments.
The superficial phytoplankton biomass measured as extractable chlorophyll-a in the three studied sites showed greater sensitivity to water contamination; thus, the biomass decreased with rising contamination. The PA biomass was significantly lower than PB and PC (Table 3). Although photosynthetic parameters of photoinhibition (Fv/Fm) of L. bertoreana showed the same pattern in terms of physiological responses, that is, the algae from PA appeared under higher stress than those from PB and PC, the ETRmax and the light saturation index were higher in PA and lower in PC. Due to their cell wall, these photosynthetic adaptations (Figure 3) and the high bioaccumulation capacity of these organisms (Table 4) allow them to survive in these conditions of environmental contamination without threshold. The stations serve as a pollution gradient from north to south; the possible pollution source is Chañaral Bay, due to the nature of the elemental contamination. This anthropogenic source was previously reported by [30]; the Cu tailing disposal in Chañaral, with an estimated mining discharge of 550 kg per year, is located at a beach between PA and PB [34]. Other previous studies detected Cu as responsible for chronic and sub-lethal effects and community distribution alterations [35], and different stress responses (antioxidant-induced) and bioaccumulation in molluscs promoted by Cu, As and Zn [36].
The consequences of contamination in marine environments, such as the physiological stress of algae or the distribution of phytoplankton, are just some environmental responses to the presence of harmful materials. Therefore, the need for a marine regulatory framework for coastal sediments in Chile [1] is also highlighted here. Furthermore, considering the different ecosystems in northern and southern Chile, the recommendation of international organizations to develop sediment quality guidelines for different regions is of utmost importance.

4. Conclusions

There is a large gap in available environmental data in the coastal area of the Atacama region. Even though the region serves as an excellent natural laboratory because of meteorological and oceanic dynamics (Humboldt Current, flooding, tsunamis, presence of wetlands and protected areas), historical and contemporary anthropogenic impacts have not yet been studied in detail. Waste discharges from mining activities for more than 50 years, through the Salado River, and the influence on the surrounding areas, such as Pan de Azucar National Park (PA) and, to a lesser extent, Flamenco Bay (PB), determines the contamination associated with each area studied. Thus, the results of the current study showed that the coastal sediments within a short stretch of 80 km are polluted by Bi, Ca, As, Ag and Cd. The average As concentration in the sediments (39.88 mg kg−1) was above the threshold effect level, with the highest concentrations found in PB (a tourist and benthic management area). The algal biomonitoring revealed a gradient of physiological stress from south to north, with PA (the national park), despite being an exclusive conservation zone, registering the poorest health status (greater Cu bioaccumulation in algae tissue, higher photosynthetic stress in macroalgae and lower biomass of microalgae). Although As concentrations were significantly higher in sediments from PB, an important amount of Cd was found in the leaves of L. bertoreana at this site. A significant concentration of toxic elements, such as As, Zn, Cu, Pb and Fe, were found in PC, but the results showed that these were not responsible for the toxicological effects in algal species. The current study highlights the need for further research, including more marine organisms and sites, as well as the application of national guidelines for the quality of marine sediments. Future research recommendations would also include oceanographic studies to determine marine currents´ influence.

Supplementary Materials

The following supporting information can be downloaded at: https://www.mdpi.com/article/10.3390/app13116360/s1, Figure S1: Granulometry results from accumulated retention per particle size for samples from (a) PA, (b) PB, (c) PC, (d) total; Figure S2: Grain-size sediment distribution of collected sediments samples (PA, PB, PC, n = 3); Table S1: Detection limit (DL) and quantification limit (QL) for water, sediment and algal samples from the current study.

Author Contributions

Conceptualisation, E.B. and E.C.; methodology, all authors; software, E.B., E.C. and Y.R.-L.; validation, all authors; formal analysis, E.B., E.C. and Y.R.-L.; investigation, all authors; resources, all authors; data curation, E.B., E.C., Y.R.-L. and A.G.; writing—original draft preparation, all authors; writing—review and editing, all authors; visualisation, E.B. and E.C.; supervision, E.B.; project administration, E.B.; funding acquisition, E.B. All authors have read and agreed to the published version of the manuscript.

Funding

This project was funded by the Agencia Nacional de Investigación y Desarrollo of Chile (ANID/FOVI 210060).

Institutional Review Board Statement

Not applicable.

Informed Consent Statement

Not applicable.

Data Availability Statement

Not applicable.

Acknowledgments

The authors are grateful for the project ATA20992 from MINEDUC. E. Bonnail is grateful for ANID/FONDECYT 11180015 and M. Abad is grateful for the M2616 Project and TSUARA Project M2615, funded by Universidad Rey Juan Carlos (Spain).

Conflicts of Interest

The authors declare no conflict of interest.

References

  1. Bonnail, E.; Diaz, A.; García, A.; Cruces, E.; Borrero-Santiago, A. Coastal uses and contaminants spread in the Desert coastal region of Atacama. Chemosphere 2022, 288, 132519. [Google Scholar] [CrossRef] [PubMed]
  2. ECONSA Chile. Empresa Concesionaria de Servicios Sanitarios, S.A. Ley de Transparencia Active. Available online: https://www.econssachile.cl/proyecto-pda/28-planta-desalinizadora-de-agua-de-mar-para-atacama (accessed on 15 March 2023).
  3. Campero, C.; Harris, L.M.; Kunz, N.C. De-politicising seawater desalination: Environmental Impact Assessments in the Atacama mining Region, Chile. Environ. Sci. Pollut. 2021, 120, 187–194. [Google Scholar] [CrossRef]
  4. Zhou, Q.; Zhang, J.; Fu, J.; Shi, J.; Jiang., G. Biomonitoring: An appealing tool for assessment of metal pollution in the aquatic ecosystem. Anal. Chim Acta. 2008, 606, 135–150. [Google Scholar] [CrossRef]
  5. Campos, L.; Berrios, F.; Oses, R.; González, A.; Bonnail, E. Unravelling Lessonia trabeculata management in coastal areas of the Atacama Region of northern Chile through a DPSIR approach: Insights for sustainable plans. Mar. Pol. 2021, 133, 104737. [Google Scholar] [CrossRef]
  6. Berrios, F.; González, J.E.; Campos, L.; Campbell, D.E.; Bonnail, E. Brown algae (Lessonia nigrescens, species complex) fisheries of northern Chile evaluated through the DPSIR approach: Social and economic impact of management strategies. Ocean Coast. Manag. 2022, 224, 106198. [Google Scholar] [CrossRef]
  7. Sáez, C.A.; Lobos, M.G.; Macaya, E.C.; Oliva, D.; Quiroz, W.; Brown, M.T. Variation in Patterns of Metal Accumulation in Thallus Parts of Lessonia trabeculata (Laminariales; Phaeophyceae): Implications for Biomonitoring. PLoS ONE 2012, 7, e50170. [Google Scholar] [CrossRef]
  8. Oyarzo-Miranda, C.; Latorre, N.; Meynard, A.; Rivas, J.; Bulboa, C.; Contreras-Porcia, L. Coastal pollution from the industrial park Quintero bay of central Chile: Effects on abundance, morphology, and development of the kelp Lessonia spicata (Phaeophyceae). PLoS ONE 2020, 15, e0240581. [Google Scholar] [CrossRef]
  9. Koch, K.; Thiel, M.; Tellier, F.; Hagen, W.; Graeve, M.; Tala, F.; Laeseke, P.; Bischof, K. Species separation within the Lessonia nigrescens complex (Phaeophyceae, Laminariales) is mirrored by ecophysiological traits. Bot. Mar. 2015, 58, 81–92. [Google Scholar] [CrossRef]
  10. Celis-Pla, P.S.; Trabal, A.; Navarrete, C.; Troncoso, M.; Moenne, F.; Zuñiga, A.; Figueroa, F.L.; Sáez, C.A. Daily changes on seasonal ecophysiological responses of the intertidal brown macroalga Lessonia spicata: Implications of climate change. Front. Plant Sci. 2022, 13, 3619. [Google Scholar] [CrossRef]
  11. Stevenson, J. Ecological assessments with algae: A review and synthesis. J. Phycol. 2014, 50, 437–461. [Google Scholar] [CrossRef]
  12. Torres, M.A.; Barros, M.P.; Campos, S.C.; Pinto, E.; Rajamani, S.; Sayre, R.T.; Colepicolo, P. Biochemical biomarkers in algae and marine pollution: A review. Ecotox. Environ. Saf. 2008, 71, 1–15. [Google Scholar] [CrossRef]
  13. Lu, X.; Liu, W.; Zhao, C.; Chen, C. Environmental assessment of heavy metal and natural radioactivity in soil around a coal-fired power plant in China. J. Radioanal. Nucl. Chem. 2013, 295, 1845–1854. [Google Scholar] [CrossRef]
  14. Cesar, A.; Lia, L.R.B.; Pereira, C.D.S.; Santos, A.R.; Cortez, F.S.; Choueri, R.B.; De Orte, M.R.; Rachid, B.R.F. Environmental assessment of dredged sediment in the major Latin American seaport (Santos, São Paulo—Brazil): An integrated approach. Sci. Total Environ. 2014, 497–498, 679–687. [Google Scholar] [CrossRef]
  15. Wang, J.; Fu, Z.; Qiao, H.; Liu, F. Assessment of eutrophication and water quality in the estuarine area of Lake Wuli, Lake Taihu, China. Sci. Total Environ. 2019, 650, 1392–1402. [Google Scholar] [CrossRef]
  16. Bonnail, E.; Riba, I.; de Seabra, A.A.; DelValls, T.A. Sediment quality assessment in the Guadalquivir River (SW, Spain) using caged Asian clams: A biomarker field approach. Sci. Total Environ. 2019, 650, 1996–2003. [Google Scholar] [CrossRef]
  17. Cunha Pasarelli, M.; Bonnail, E.; Cesar, A.; DelValls, T.A.; Riba, I. Integrative assessment of sediments affected by CO2 enrichment: A case study in the Bay of Santos—SP, Brazil. App. Sci. 2021, 11, 11603. [Google Scholar] [CrossRef]
  18. Kaplunovsky, A.S. Factor analysis in environmental studies. HAIT J. Sci. Eng. B 2005, 2, 54–94. [Google Scholar]
  19. Wentworth, C.K. A Scale of Grade and Class Terms for Clastic Sediments. J. Geol. 1922, 30, 377. [Google Scholar] [CrossRef]
  20. U.S. EPA. Method 3050B: Acid Digestion of Sediments, Sludges, and Soils; Revision 2; U.S. EPA: Washington, DC, USA, 1996. Available online: https://www.epa.gov/sites/production/files/2015-06/documents/epa-3050b.pdf (accessed on 15 September 2022).
  21. EPA 6010D; Method 6010D (SW-846): Inductively Coupled Plasma-Atomic Emission Spectrometry. Revision 4; U.S. EPA: Washington, DC, USA, 2014.
  22. Baker, N.R. Chlorophyll Fluorescence: A Probe of Photosynthesis In Vivo. Annu. Rev. Plant Biol. 2008, 59, 89–113. [Google Scholar] [CrossRef]
  23. Jassby, A.D.; Platt, T. Mathematical formulation of the relationship between photosynthesis and light for phytoplankton. Limnol. Oceanogr. 1976, 21, 540–547. [Google Scholar] [CrossRef]
  24. Jeffrey, S.W.; Humphrey, G.F. New spectrophotometric equations for determining chlorophylls a, b, c1 and c2 in higher plants, algae and natural phytoplankton. Biochemie und Physiologie der Pflanzen 1975, 167, 191–194. [Google Scholar] [CrossRef]
  25. Müller, G. Schwermetalle in den sedimenten des Rheins—Veränderungen seit 1971. Umschau 1979, 79, 778–783. [Google Scholar]
  26. McLennan, S.M. Relationships between the trace element composition of sedimentary rocks and upper continental crust. Geochem. Geophys. Geosyst. 2001, 2, 1021. [Google Scholar] [CrossRef]
  27. DelValls, T.A.; Chapman, P.M. Site-Specific sediment quality values for the Gulf of Cádiz (Spain) and San Francisco Bay (USA), using the sediment quality triad and the multivariate analysis. Cienc. Mar. 1998, 24, 313–336. [Google Scholar] [CrossRef]
  28. Bonnail, E.; Sarmiento, A.M.; DelValls, T.A. The use of a weight-of-evidence approach to address sediment quality in the Odiel River. Ecotox Environ. Saf. 2016, 133, 244–251. [Google Scholar] [CrossRef]
  29. Buchman, M.F. NOAA Screening Quick Reference Tables; NOAA OR&R Report 08-1; Office of Response and Restoration Division, National Oceanic and Atmospheric Administration: Seattle WA, USA, 2008; 34p. [Google Scholar]
  30. Ramirez, M.; Massolo, S.; Frache, R.; Correa, J. Metal speciation and environmental impact on sandy beaches due to El Salvador copper mine, Chile. Mar. Pollut. Bull. 2005, 50, 62–72. [Google Scholar] [CrossRef]
  31. Bonnail, E.; Cruz-Hernández, P.; Galleguillos, S.; Izquierdo, T.; Abad, M. Metal contamination in Chañaral Bay (North of Chile)/La contaminación metálica en la Bahía de Chañaral (norte de Chile): Retrospección, prospección y proyección. Geogaceta 2020, 67, 59–62. Available online: http://www.sociedadgeologica.es/archivos/geogacetas/geo67/Geo67_p59_62.pdf (accessed on 10 May 2022).
  32. Tapia, J.; González, R.; Townley, B.; Oliveros, V.; Álvarez, F.; Aguilar, G.; Menzies, A.; Calderón, M. Geology and geochemistry of the Atacama Desert. Antonie Van Leeuwenhoek 2018, 111, 1273–1291. [Google Scholar] [CrossRef] [PubMed]
  33. Tapia, J.; Davenport, J.; Townley, B.; Dorador, C.; Schneider, B.; Tolorza, V.; von Tümpling, W. Sources, enrichment, and redistribution of As, Cd, Cu, Li, Mo, and Sb in the Northern Atacama Region, Chile: Implications for arid watersheds affected by mining. J. Geochem. Explor. 2018, 185, 3–51. [Google Scholar] [CrossRef]
  34. Andrade, S.; Moffett, J.; Correa, J.A. Distribution of dissolved species and suspended particulate copper in an intertidal ecosystem affected by copper mine tailings in Northern Chile. Mar. Chem. 2006, 101, 203–212. [Google Scholar] [CrossRef]
  35. Jara, C.; Gaete, H.; Lobos, G.; Hidalgo, M.E. Oxidative stress in the mollusk Echinolittorina peruviana (Gasteropoda: Littorinidae, Lamarck, 1822) and trace metals in coastal sectors with mining activity. Ecotoxicology 2014, 23, 1099–1108. [Google Scholar] [CrossRef] [PubMed]
  36. Navarro, N.; Abad, M.; Izquierdo, T.; Bonnail, E. The arid coastal wetlands of northern Chile: Towards an integrated management of highly threatened systems. J. Mar. Sci. Eng. 2021, 9, 948. [Google Scholar] [CrossRef]
Figure 1. Location of the study area and the sampling stations along a coastal stretch of around 80 km: Pan de Azúcar National Park (PA), Flamenco (PB) and Punta Totoralillo (PC).
Applsci 13 06360 g001
Figure 2. Geoaccumulation index (Igeo) calculated for Ag, Al, As, Cu, Fe, Mn, Pb and Zn for the studied stations (PA, PB, PC).
Applsci 13 06360 g002
Figure 3. Changes in photosynthetic activity indicated by the maximum quantum yield (a) photosynthetic electron transport rate (b), light saturation index (c), and light curve (d). These Chl-a fluorescence parameters were calculated from the P-I light saturation curve in L. bertoreana of the different sampling areas. Data are presented as mean ± standard deviation (n = 5). Asterisks indicate significant differences (p ≤ 0.05).
Applsci 13 06360 g003
Figure 4. Scores of each factor for the sampling stations.
Applsci 13 06360 g004
Table 1. Physical–chemical parameters in the water at each sampled station (PA, PB, PC), average element concentration in seawater (N = 3) and marine reference exposure limits according to NOAA [29].
PAPBPCMarine Surface Water
(Acute/Chronic)
T°C15.6616.4315.02
pH 7.68 ± 0.017.65 ± 0.017.53 ± 0.005
Spsu39.84 ± 0.0339.60 ± 0.1439.93 ± 0.001
ECµS cm−159,431 ± 4059,093 ± 19459,580 ± 10
TDSppt29.7129.5429.79
EhmV140 ± 1.14204 ± 2.21217 ± 0.21
AlkmgCaCO3 L−1216 ± 32229 ± 67185 ± 17
Element concentrations
Agmg L−1bdlbdlbdl
Alµg L−1106670713
Asµg L−1bdl1.601.7569/36
Camg L−1377326371
Cdµg L−10.220.370.2140/8.8
Cuµg L−115.11.73.54.8/3.1
Kmg L−1359310355-/100
Liµg L−1130163166
Mgmg L−1120710161241
Mnµg L−1bdlbdl3.40
Namg L−19946872210,200
Pbµg L−1bdl8.340210/8.1
Znµg L−133.346.660.090/81
bdl: below detection limits.
Table 2. Element concentrations in sediments collected in the sampled stations (PA, PB, PC), descriptive statistics and median values found in the study area by the Marine Sediment Quality Atacama project (MASEQATA) and the TEL (lower threshold levels) values for the NOAA [29].
PAPBPCavsdMinMaxMASEQATATEL
Fines%0.230.050.05
Almg kg−11887204321512027152185022474070730
Agmg kg−1bdl1.091.461.240.620.701.950.59
Asmg kg−146.43 ab60.25 a19.73 b39.8818.6712.1066.701.377.24
Bimg kg−118.1312.7718.6716.528.803.7126.300.01
Cag kg−12791941992244218628814.60
Cdmg kg−1bdlbdl1.111.11 0.095680
Cumg kg−19.316.245.597.051.954.7410.309.1418.7
Femg kg−13887370538483813271351744084686
Kmg kg−111351172125211868610341362
Limg kg−12.742.122.382.370.382.023.11
Mgmg kg−14150343636343740353330242383811
Mnmg kg−143.5743.3344.3743.762.0940.0046.0055.11
Namg kg−1475545444795469819644024982
Pbmg kg−121.3010.6617.1715.766.167.6827.101.2730.24
Znmg kg−111.53 a8.18 ab7.58 b9.102.037.1413.007.78124
bdl: below detection limits. Different letters indicate significant differences (p < 0.05) by Dunn´s multiple comparison test. The absence of a letter means no significant difference.
Table 3. Chlorophyll a concentration of the upper stratum of the water column of three study sites (Asterisk indicates significant difference (p ≤ 0.05)).
StationChlorophyll a (µg mL−1)
PA0.006675 ± 0.0017 *
PB0.013502 ± 0.0047
PC0.016339 ± 0.0001
Table 4. Concentration of elements in the tissues of Lessonia berteroana in sampling stations PA, PB and PC.
PAPBPC
Agmg kg−10.10bdl0.20
Almg kg−13.333.673.00
Asmg kg−112.1015.926.32
Bimg kg−13.312.532.75
Camg kg−1308729522086
Cdmg kg−11.90 ab3.94 a1.68 b
Cumg kg−12.28 a1.28 ab0.69 b
Femg kg−16.10 ab7.47 b3.03 a
Kmg kg−114,787 a11,430 ab10,777 b
Limg kg−1bdlbdlbdl
Mgmg kg−1238921891588
Mnmg kg−10.800.800.35
Namg kg−18271 a7106 ab6209 b
Pbmg kg−11.801.456.25
Znmg kg−12.471.830.55
bdl: below detection limits. Different letters mean significant differences (p < 0.05) with Dunn´s multiple comparison test. Absence of letter means no significant difference.
Table 5. Sorted rotated factor loading (varimax normalised) of 25 variables on the two main factors. For interpretation, the loading cut-off < 0.7.
Factor 1Factor 2
%variance82.8812.45
Fines0.735
AsW0.817
PbW −0.977
ZnW −0.754
CuS −0.986
FeS −0.713
AsS0.904
PbS0.833
CdS0.957
MnS0.807
ZnS −0.981
CuA0.830
FeA0.894
AsA0.956
PbA0.950
CdA0.944
MnA −0.915
ZnA0.869
Fv/Fm0.963
ETR0.987
Ek0.812
α0.882
Chl-a0.894
Disclaimer/Publisher’s Note: The statements, opinions and data contained in all publications are solely those of the individual author(s) and contributor(s) and not of MDPI and/or the editor(s). MDPI and/or the editor(s) disclaim responsibility for any injury to people or property resulting from any ideas, methods, instructions or products referred to in the content.

