
The Test–Retest Reproducibility, Standard Error Measurement, and Smallest Real Difference of Dynamic Balance Tests in Chronic Stroke Survivors

Abstract
:1. Introduction
2. Materials and Methods
2.1. Participants
2.2. Procedures
2.3. Tests and Measurements
2.3.1. Figure 8 Walk Test (F8WT)
2.3.2. Four Square Step Test (FSST)
2.3.3. Step Test (ST)
2.4. Statistical Analysis
3. Results
4. Discussion
5. Conclusions
Funding
Institutional Review Board Statement
Informed Consent Statement
Data Availability Statement
Conflicts of Interest
References
- Stroke Rehabilitation: Guidelines for Exercise and Training to Optimize Motor Skill—ProQuest. Available online: https://www.proquest.com/openview/069b485e3f3c325820067a3b47122aad/1?pq-origsite=gscholar&cbl=40771 (accessed on 25 February 2023).
- Wang, C.-H.; Hsueh, I.-P.; Sheu, C.-F.; Hsieh, C.-L. Discriminative, Predictive, and Evaluative Properties of a Trunk Control Measure in Patients with Stroke. Phys. Ther. 2005, 85, 887–894. [Google Scholar] [CrossRef] [PubMed]
- Wee, J.Y.M.; Hopman, W.M. Stroke Impairment Predictors of Discharge Function, Length of Stay, and Discharge Destination in Stroke Rehabilitation. Am. J. Phys. Med. Rehabil. 2005, 84, 604–612. [Google Scholar] [CrossRef] [PubMed]
- de Vet, H.C.W.; Terwee, C.B.; Knol, D.L.; Bouter, L.M. When to Use Agreement versus Reliability Measures. J. Clin. Epidemiol. 2006, 59, 1033–1039. [Google Scholar] [CrossRef] [PubMed]
- Roebroeck, M.E.; Harlaar, J.; Lankhorst, G.J. The Application of Generalizability Theory to Reliability Assessment: An Illustration Using Isometric Force Measurements. Phys. Ther. 1993, 73, 386–395; discussion 396–401. [Google Scholar] [CrossRef] [PubMed]
- Patten, C.; Kothari, D.; Whitney, J.; Lexell, J.; Lum, P.S. Reliability and Responsiveness of Elbow Trajectory Tracking in Chronic Poststroke Hemiparesis. J. Rehabil. Res. Dev. 2003, 40, 487–500. [Google Scholar] [CrossRef]
- Beckerman, H.; Roebroeck, M.E.; Lankhorst, G.J.; Becher, J.G.; Bezemer, P.D.; Verbeek, A.L. Smallest Real Difference, a Link between Reproducibility and Responsiveness. Qual. Life Res. 2001, 10, 571–578. [Google Scholar] [CrossRef]
- Lexell, J.E.; Downham, D.Y. How to Assess the Reliability of Measurements in Rehabilitation. Am. J. Phys. Med. Rehabil. 2005, 84, 719–723. [Google Scholar] [CrossRef]
- Schreuders, T.A.R.; Roebroeck, M.E.; Goumans, J.; van Nieuwenhuijzen, J.F.; Stijnen, T.H.; Stam, H.J. Measurement Error in Grip and Pinch Force Measurements in Patients with Hand Injuries. Phys. Ther. 2003, 83, 806–815. [Google Scholar] [CrossRef]
- Schuck, P.; Zwingmann, C. The “smallest Real Difference” as a Measure of Sensitivity to Change: A Critical Analysis. Int. J. Rehabil. Res. 2003, 26, 85–91. [Google Scholar] [CrossRef]
- Chen, H.-M.; Hsieh, C.-L.; Lo, S.K.; Liaw, L.-J.; Chen, S.-M.; Lin, J.-H. The Test-Retest Reliability of 2 Mobility Performance Tests in Patients with Chronic Stroke. Neurorehabil. Neural Repair. 2007, 21, 347–352. [Google Scholar] [CrossRef]
- Hong, S.-J.; Goh, E.Y.; Chua, S.Y.; Ng, S.S. Reliability and Validity of Step Test Scores in Subjects with Chronic Stroke. Arch. Phys. Med. Rehabil. 2012, 93, 1065–1071. [Google Scholar] [CrossRef]
- Goh, E.Y.; Chua, S.Y.; Hong, S.-J.; Ng, S.S. Reliability and Concurrent Validity of Four Square Step Test Scores in Subjects with Chronic Stroke: A Pilot Study. Arch. Phys. Med. Rehabil. 2013, 94, 1306–1311. [Google Scholar] [CrossRef]
- Wong, S.S.T.; Yam, M.-S.; Ng, S.S.M. The Figure-of-Eight Walk Test: Reliability and Associations with Stroke-Specific Impairments. Disabil. Rehabil. 2013, 35, 1896–1902. [Google Scholar] [CrossRef]
- Hess, R.J.; Brach, J.S.; Piva, S.R.; Van Swearingen, J.M. Walking Skill Can Be Assessed in Older Adults: Validity of the Figure-of-8 Walk Test. Phys. Ther. 2010, 90, 89–99. [Google Scholar] [CrossRef]
- Dite, W.; Temple, V.A. A Clinical Test of Stepping and Change of Direction to Identify Multiple Falling Older Adults. Arch. Phys. Med. Rehabil. 2002, 83, 1566–1571. [Google Scholar] [CrossRef]
- Bland, J.M.; Altman, D.G. Statistical Methods for Assessing Agreement between Two Methods of Clinical Measurement. Lancet 1986, 1, 307–310. [Google Scholar] [CrossRef]
- Munro, B.H.; Aroian, K.J.; Dixon, J.K.; Duffy, M.E.; Jacobsen, B.S.; Norris, A.E.; Cote-Arsenault, D.; Badros, K.K.; Brancato, V.; Fish, A.F.; et al. Statistical Methods for Health Care Research, 5th ed.; Lippincott Williams & Wilkins: Philadelphia, PA, USA, 2004; ISBN 978-0-7817-4840-7. [Google Scholar]
- Atkinson, G.; Nevill, A.M. Statistical Methods for Assessing Measurement Error (Reliability) in Variables Relevant to Sports Medicine. Sport. Med. 1998, 26, 217–238. [Google Scholar] [CrossRef]
- Lu, W.-S.; Wang, C.-H.; Lin, J.-H.; Sheu, C.-F.; Hsieh, C.-L. The Minimal Detectable Change of the Simplified Stroke Rehabilitation Assessment of Movement Measure. J. Rehabil. Med. 2008, 40, 615–619. [Google Scholar] [CrossRef]
- Turk, R.; Notley, S.V.; Pickering, R.M.; Simpson, D.M.; Wright, P.A.; Burridge, J.H. Reliability and Sensitivity of a Wrist Rig to Measure Motor Control and Spasticity in Poststroke Hemiplegia. Neurorehabil. Neural Repair. 2008, 22, 684–696. [Google Scholar] [CrossRef]
- Smidt, N.; van der Windt, D.A.; Assendelft, W.J.; Mourits, A.J.; Devillé, W.L.; de Winter, A.F.; Bouter, L.M. Interobserver Reproducibility of the Assessment of Severity of Complaints, Grip Strength, and Pressure Pain Threshold in Patients with Lateral Epicondylitis. Arch. Phys. Med. Rehabil. 2002, 83, 1145–1150. [Google Scholar] [CrossRef]
- Harris, K.D.; Heer, D.M.; Roy, T.C.; Santos, D.M.; Whitman, J.M.; Wainner, R.S. Reliability of a Measurement of Neck Flexor Muscle Endurance. Phys. Ther. 2005, 85, 1349–1355. [Google Scholar] [CrossRef] [PubMed]
- Brennan, P.; Silman, A. Statistical Methods for Assessing Observer Variability in Clinical Measures. BMJ 1992, 304, 1491–1494. [Google Scholar] [CrossRef] [PubMed]
- Liaw, L.-J.; Hsieh, C.-L.; Hsu, M.-J.; Chen, H.-M.; Lin, J.-H.; Lo, S.-K. Test-Retest Reproducibility of Two Short-Form Balance Measures Used in Individuals with Stroke. Int. J. Rehabil. Res. 2012, 35, 256–262. [Google Scholar] [CrossRef] [PubMed]


| Basic Information | Mode (%) or Mean (Standard Deviation) |
|---|---|
| Sex (male/female) | 36 (69.2)/16 (30.8) |
| Age (year) | 60.67 (0.73) |
| Disease duration (months) | 28.65 (0.64) |
| Etiologic type (infarction/hemorrhage) | 33 (63.5)/19 (36.5) |
| Affected side (left/right) | 23 (44.2)/29 (55.8) |
| MMSE (score) | 26.06 (0.72) |
| Tests and Measures | Mean (SD) Median (Q1~Q3) Range (Min~Max) | Mean Difference (SD) | ICC (2,1) (95% CI) | SEM | SRD (SRD %) | p-Value | |
|---|---|---|---|---|---|---|---|
| 1st Test | 2nd Test | ||||||
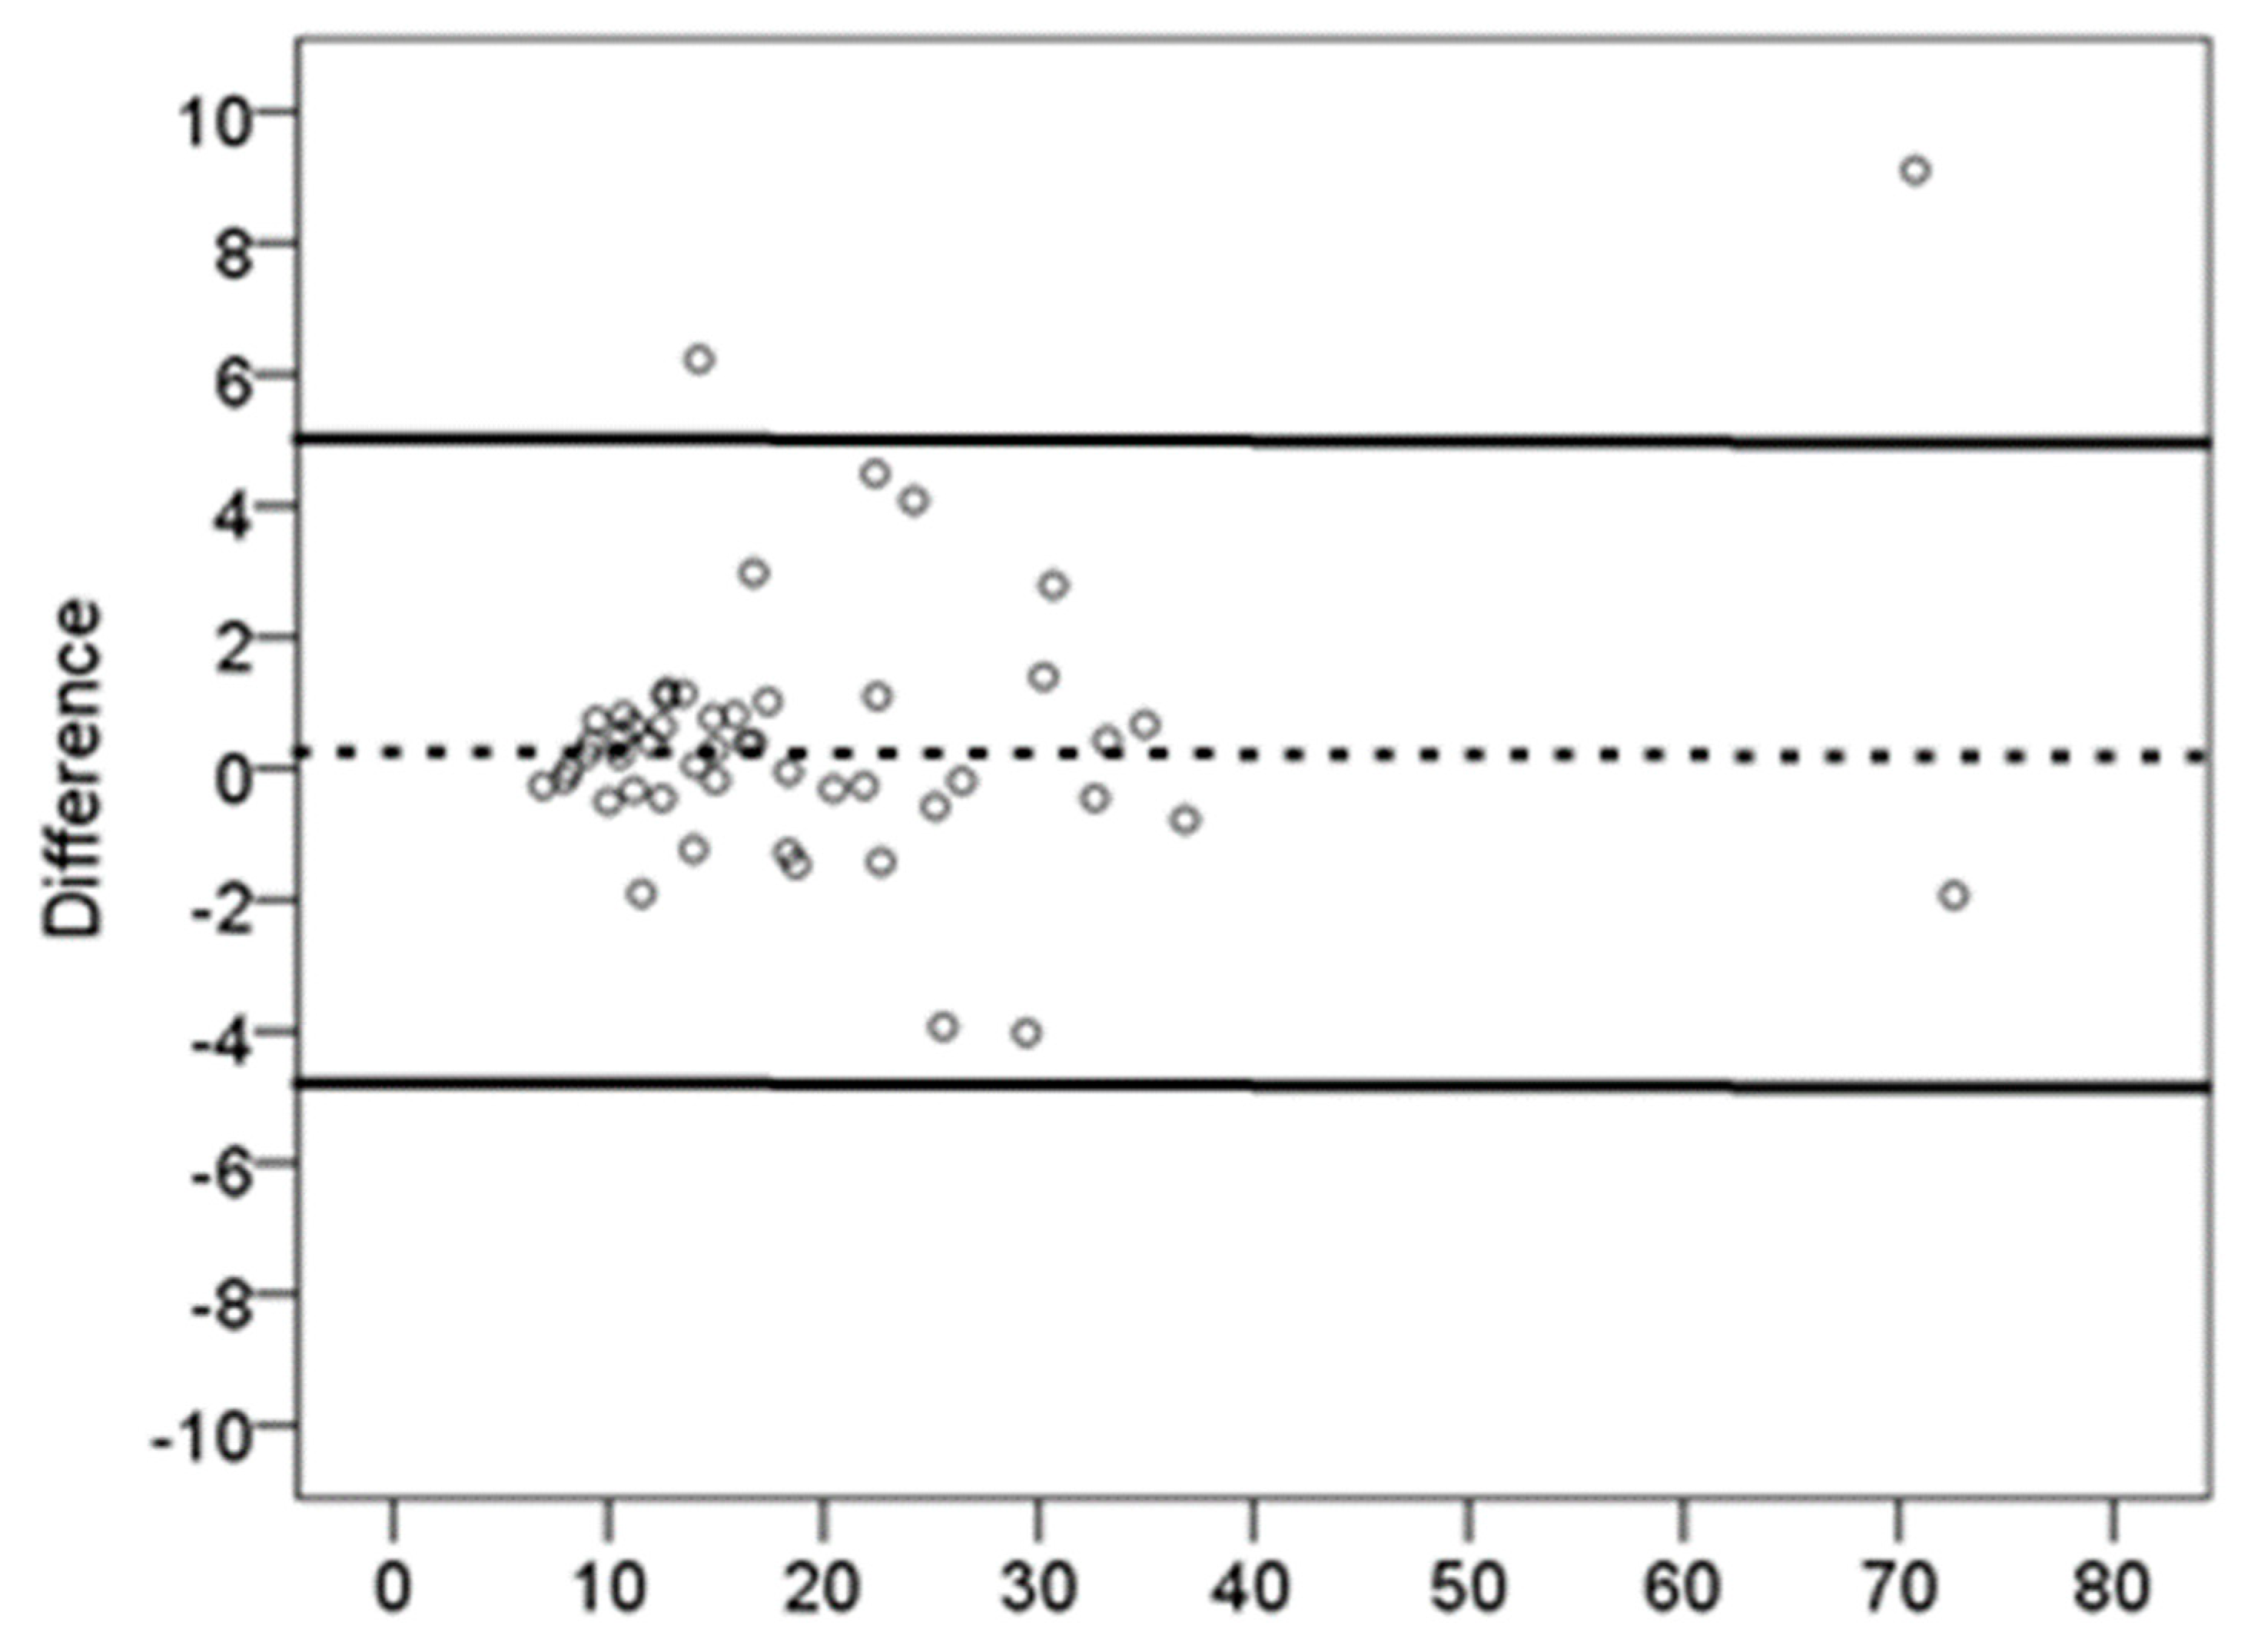
| F8WT (s) | 21.21 (15.70) 16.76 (11.65~24.85) 6.83~80.99 | 20.94 (16.10) 15.37 (11.45~24.97) 7.09~90.01 | 0.27 (2.48) | 0.98 (0.97~0.99) | 2.21 | 6.10 (28.9) | 0.43 |
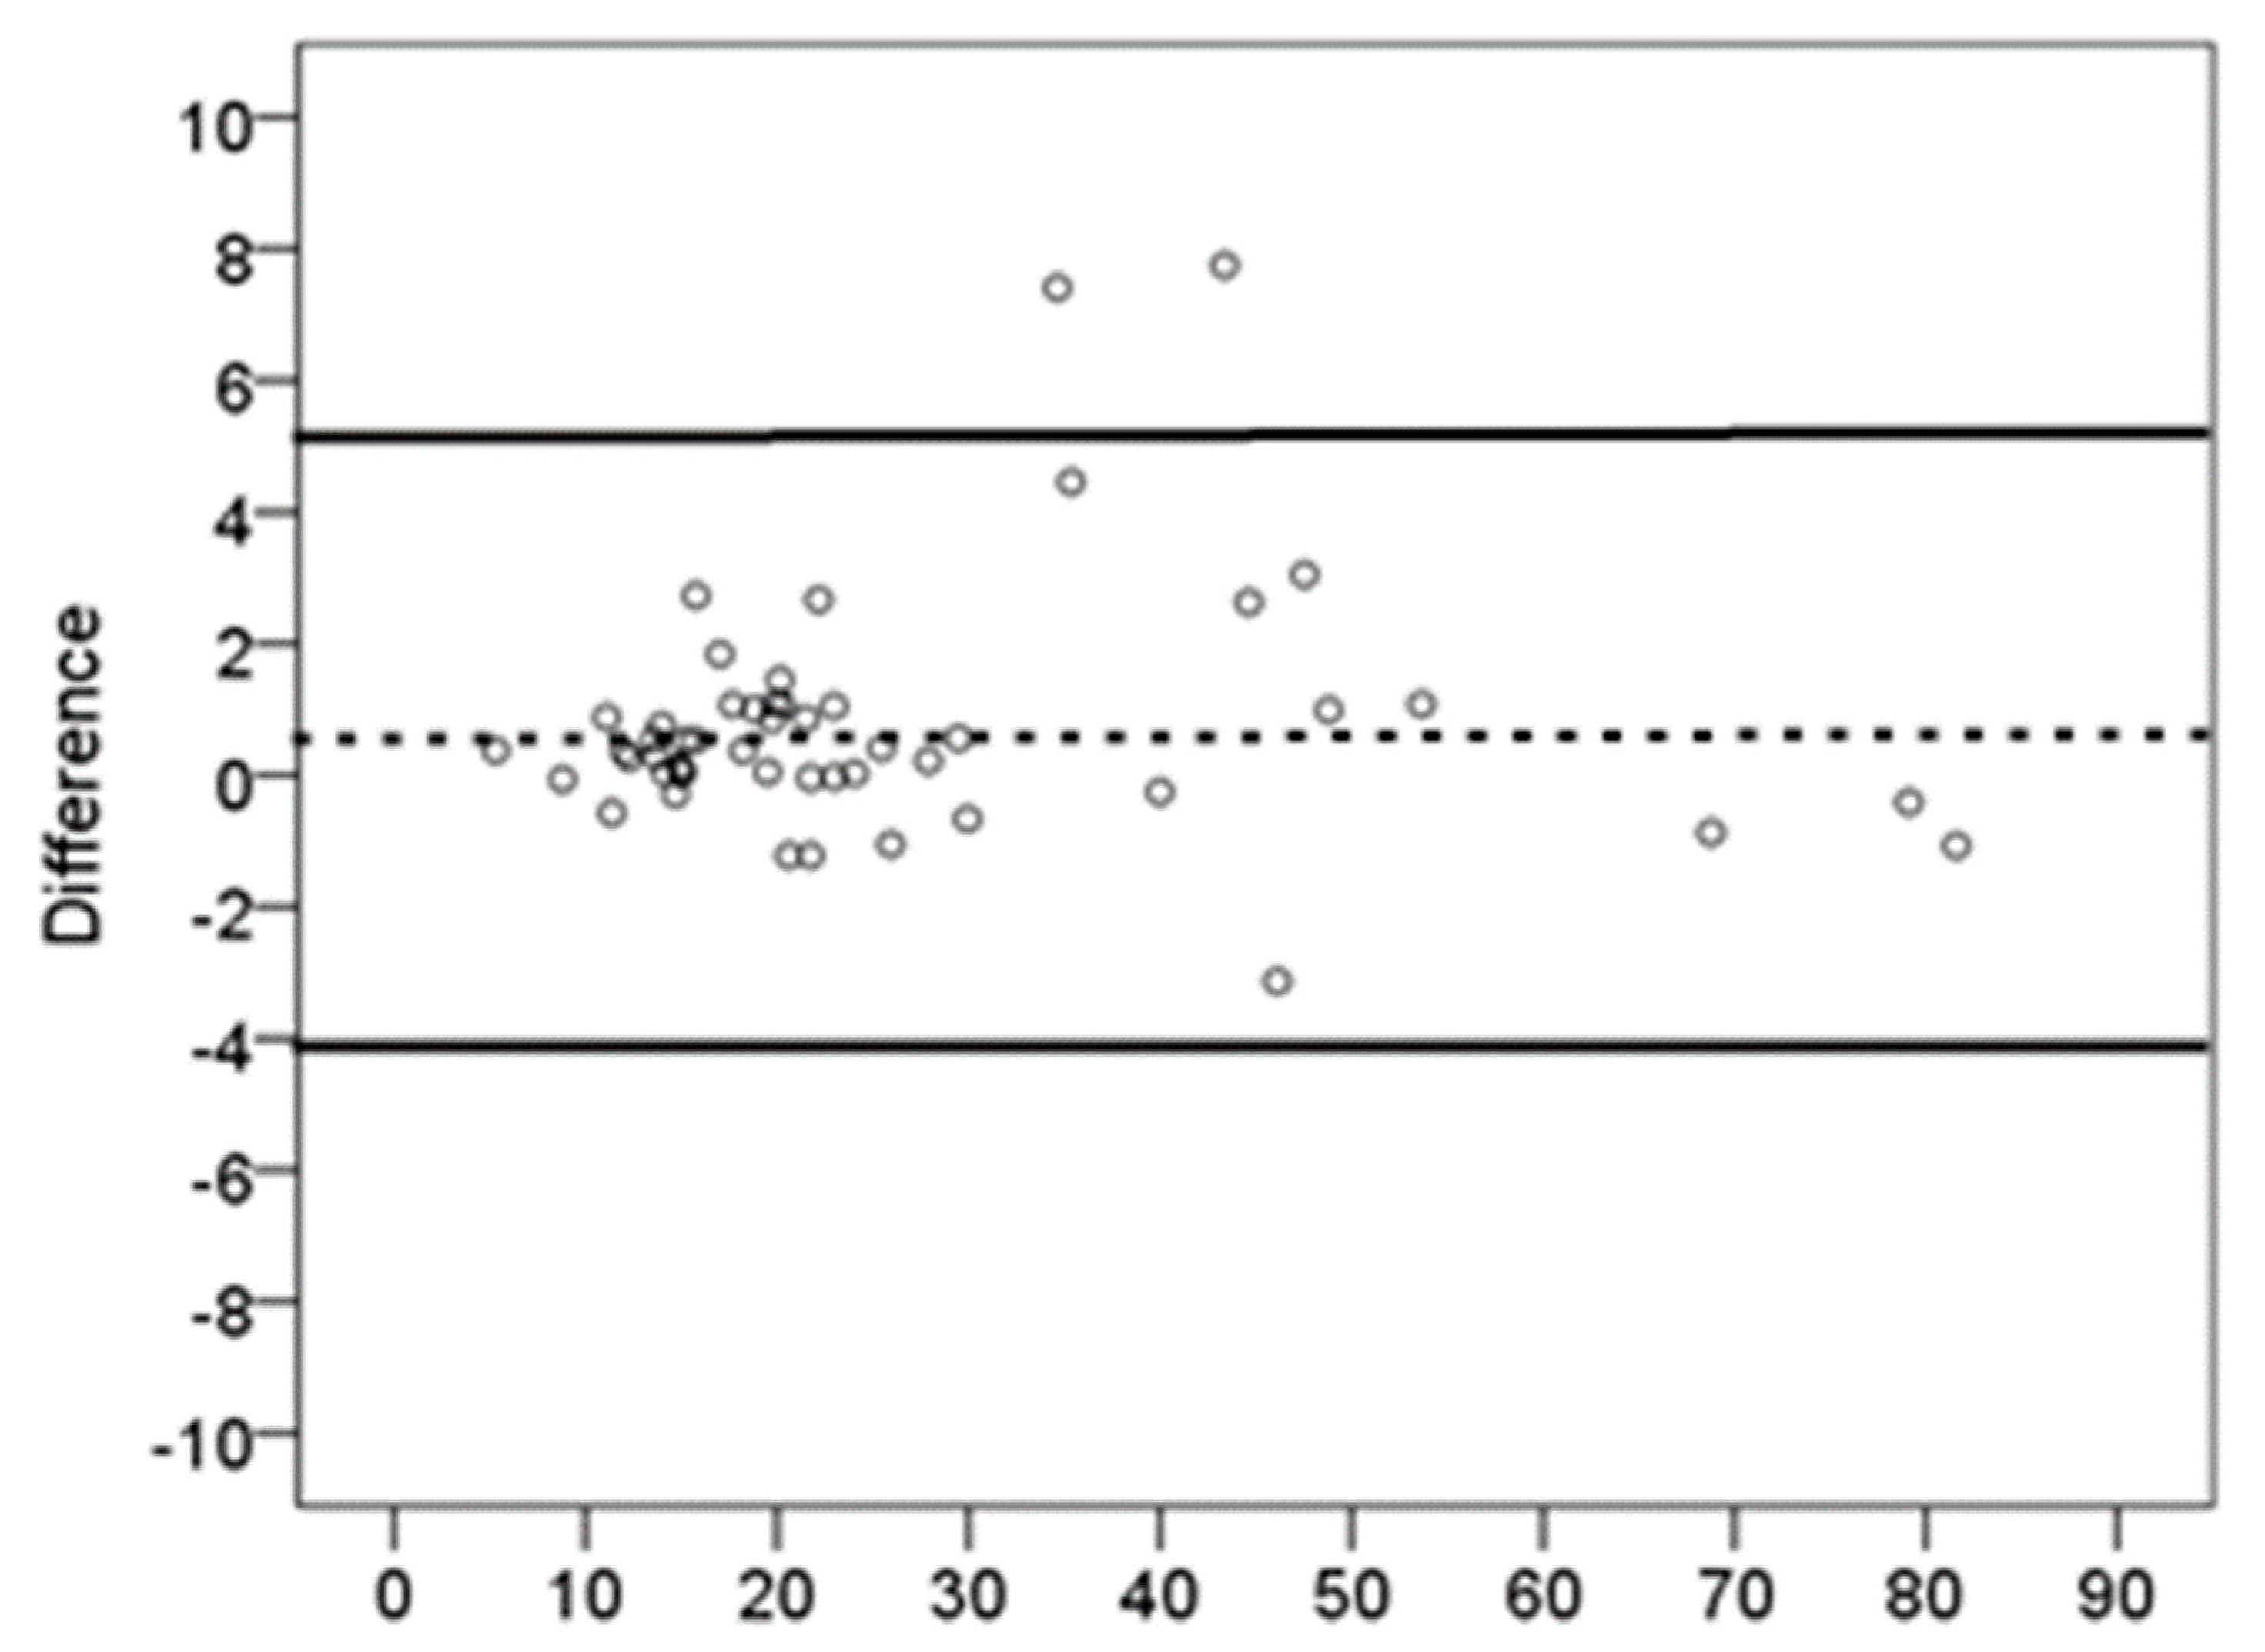
| FSST (s) | 28.52 (22.17) 20.84 (15.02~35.63) 5.50~130.01 | 27.97 (23.11) 20.29 (14.87~30.77) 5.12~140.07 | 0.54 (2.36) | 0.99 (0.99~0.99) | 2.25 | 6.21 (21.9) | 0.10 |
| ST (score) More affected side | 6.61 (2.66) 6.5 (4.25~9) 1~16 | 6.82 (6.50) 6.5 (5~8.75) 0~16 | −0.2 (0.91) | 0.95 (0.92~0.97) | 0.68 | 1.87 (27.82) | 0.12 |
| ST (score) Less affected side | 7.78 (2.66) 8 (6~9) 2~16 | 8.01 (2.77) 8.5 (6~9) 3~15 | −0.23 (0.98) | 0.93 (0.88~0.96) | 0.70 | 1.93 (24.43) | 0.09 |
Disclaimer/Publisher’s Note: The statements, opinions and data contained in all publications are solely those of the individual author(s) and contributor(s) and not of MDPI and/or the editor(s). MDPI and/or the editor(s) disclaim responsibility for any injury to people or property resulting from any ideas, methods, instructions or products referred to in the content. |
© 2023 by the authors. Licensee MDPI, Basel, Switzerland. This article is an open access article distributed under the terms and conditions of the Creative Commons Attribution (CC BY) license (https://creativecommons.org/licenses/by/4.0/).
Share and Cite
Lee, K.; Lee, G. The Test–Retest Reproducibility, Standard Error Measurement, and Smallest Real Difference of Dynamic Balance Tests in Chronic Stroke Survivors. Appl. Sci. 2023, 13, 6358. https://doi.org/10.3390/app13116358
Lee K, Lee G. The Test–Retest Reproducibility, Standard Error Measurement, and Smallest Real Difference of Dynamic Balance Tests in Chronic Stroke Survivors. Applied Sciences. 2023; 13(11):6358. https://doi.org/10.3390/app13116358
Chicago/Turabian StyleLee, Kyeongbong, and GyuChang Lee. 2023. "The Test–Retest Reproducibility, Standard Error Measurement, and Smallest Real Difference of Dynamic Balance Tests in Chronic Stroke Survivors" Applied Sciences 13, no. 11: 6358. https://doi.org/10.3390/app13116358