Article

Deep Image Clustering Based on Label Similarity and Maximizing Mutual Information across Views

1
School of Cyber Security and Computer, Hebei University, Baoding 071000, China
2
Hebei Machine Vision Engineering Research Center, Baoding 071000, China
*
Author to whom correspondence should be addressed.
Appl. Sci. 2023, 13(1), 674; https://doi.org/10.3390/app13010674
Submission received: 14 November 2022 / Revised: 27 December 2022 / Accepted: 28 December 2022 / Published: 3 January 2023
(This article belongs to the Special Issue Algorithms and Applications of Multi-View Information Clustering)

Abstract

:
Most existing deep image clustering methods use only class-level representations for clustering. However, the class-level representation alone is not sufficient to describe the differences between images belonging to the same cluster. This may lead to high intra-class representation differences, which will harm the clustering performance. To address this problem, this paper proposes a clustering model named Deep Image Clustering based on Label Similarity and Maximizing Mutual Information Across Views (DCSM). DCSM consists of a backbone network, class-level and instance-level mapping block. The class-level mapping block learns discriminative class-level features by selecting similar (dissimilar) pairs of samples. The proposed extended mutual information is to maximize the mutual information between features extracted from views that were obtained by using data augmentation on the same image and as a constraint on the instance-level mapping block. This forces the instance-level mapping block to capture high-level features that affect multiple views of the same image, thus reducing intra-class differences. Four representative datasets are selected for our experiments, and the results show that the proposed model is superior to the current advanced image clustering models.

1. Introduction

Clustering is one of the basic tasks in machine learning, computer vision and other fields. It aims to assign unlabeled samples to different clusters so that samples in the same cluster are similar to each other while samples in different clusters are as dissimilar as possible [1]. With the development of deep learning, the need for large-scale labeled datasets is a major obstacle to the application of deep learning in many scenarios. However, manually labeling these datasets is costly and time-consuming. To make better use of unlabeled data, unsupervised clustering has gradually attracted widespread attention. The main research directions of clustering at this stage can be divided into image, text [2], multi-view clustering [3,4] and so on. Among these data, the simplest and most intuitive feeling is image data. Traditional clustering methods, such as k-means [5], Gaussian mixture model [6], density peak clustering [7] and other methods are limited when they meet high-dimensional data, such as images. The reason is the failure of their similarity measures. With the help of fuzzy set theory and its extensions, such as intuitionistic fuzzy sets [8] and others, many novel similarity measures have emerged and made some progress compared to conventional similarity measures. However, a more intuitive solution attracts attention. These methods [9,10] map high-dimensional data into a low-dimensional representation space and perform clustering in the low-dimensional space. These low-dimensional representations are not informative enough, resulting in no significant improvement in the clustering performance. Therefore, image clustering is still a challenging task.
Deep learning has been gradually combined with computer vision. Due to the powerful representation extraction ability of deep neural networks, it has achieved success in the fields of classification [11,12], object recognition [13,14,15] and image retrieval [16]. Many scholars turn their attention to deep clustering [17]. Deep clustering refers to the process of automatically learning the data representations and guiding clustering through neural networks. Widely used network architecture includes Convolutional Neural Networks [12,18], Autoencoders [19] and Variational Autoencoders [20]. Following the success of Generative Adversarial Networks [21], many works [22,23,24,25] introduced the idea of GANs into representation learning and achieved good results. Combining neural networks with traditional clustering algorithms is an effective solution, which consists of two stages. In the first stage, the neural network captures the low-dimensional representations of the samples. In the second stage, the learned low-dimensional representations are served as the input for traditional clustering methods. Some progress has been made compared to traditional methods.
Recently, many unsupervised deep learning methods have been proposed to learn clustering. By introducing data augmentation, most of the latest methods look into deep clustering from the perspective that the original image and its transformation should share similar semantic clustering assignments [26,27,28]. These methods have achieved some progress on complex natural image datasets. However, the above methods have some limitations: (1) Since generative networks based on autoencoders require pixel-level reconstruction. It is easy to capture redundant image information, such as background, color and other trivial information; (2) These methods only learn class-level representation. However, the instance-level representation could be quite different even if they are assigned to the same cluster since the softmax function is only sensitive to the maximum value. In other words, class-level representation alone is not enough to describe the differences between images belonging to the same cluster.
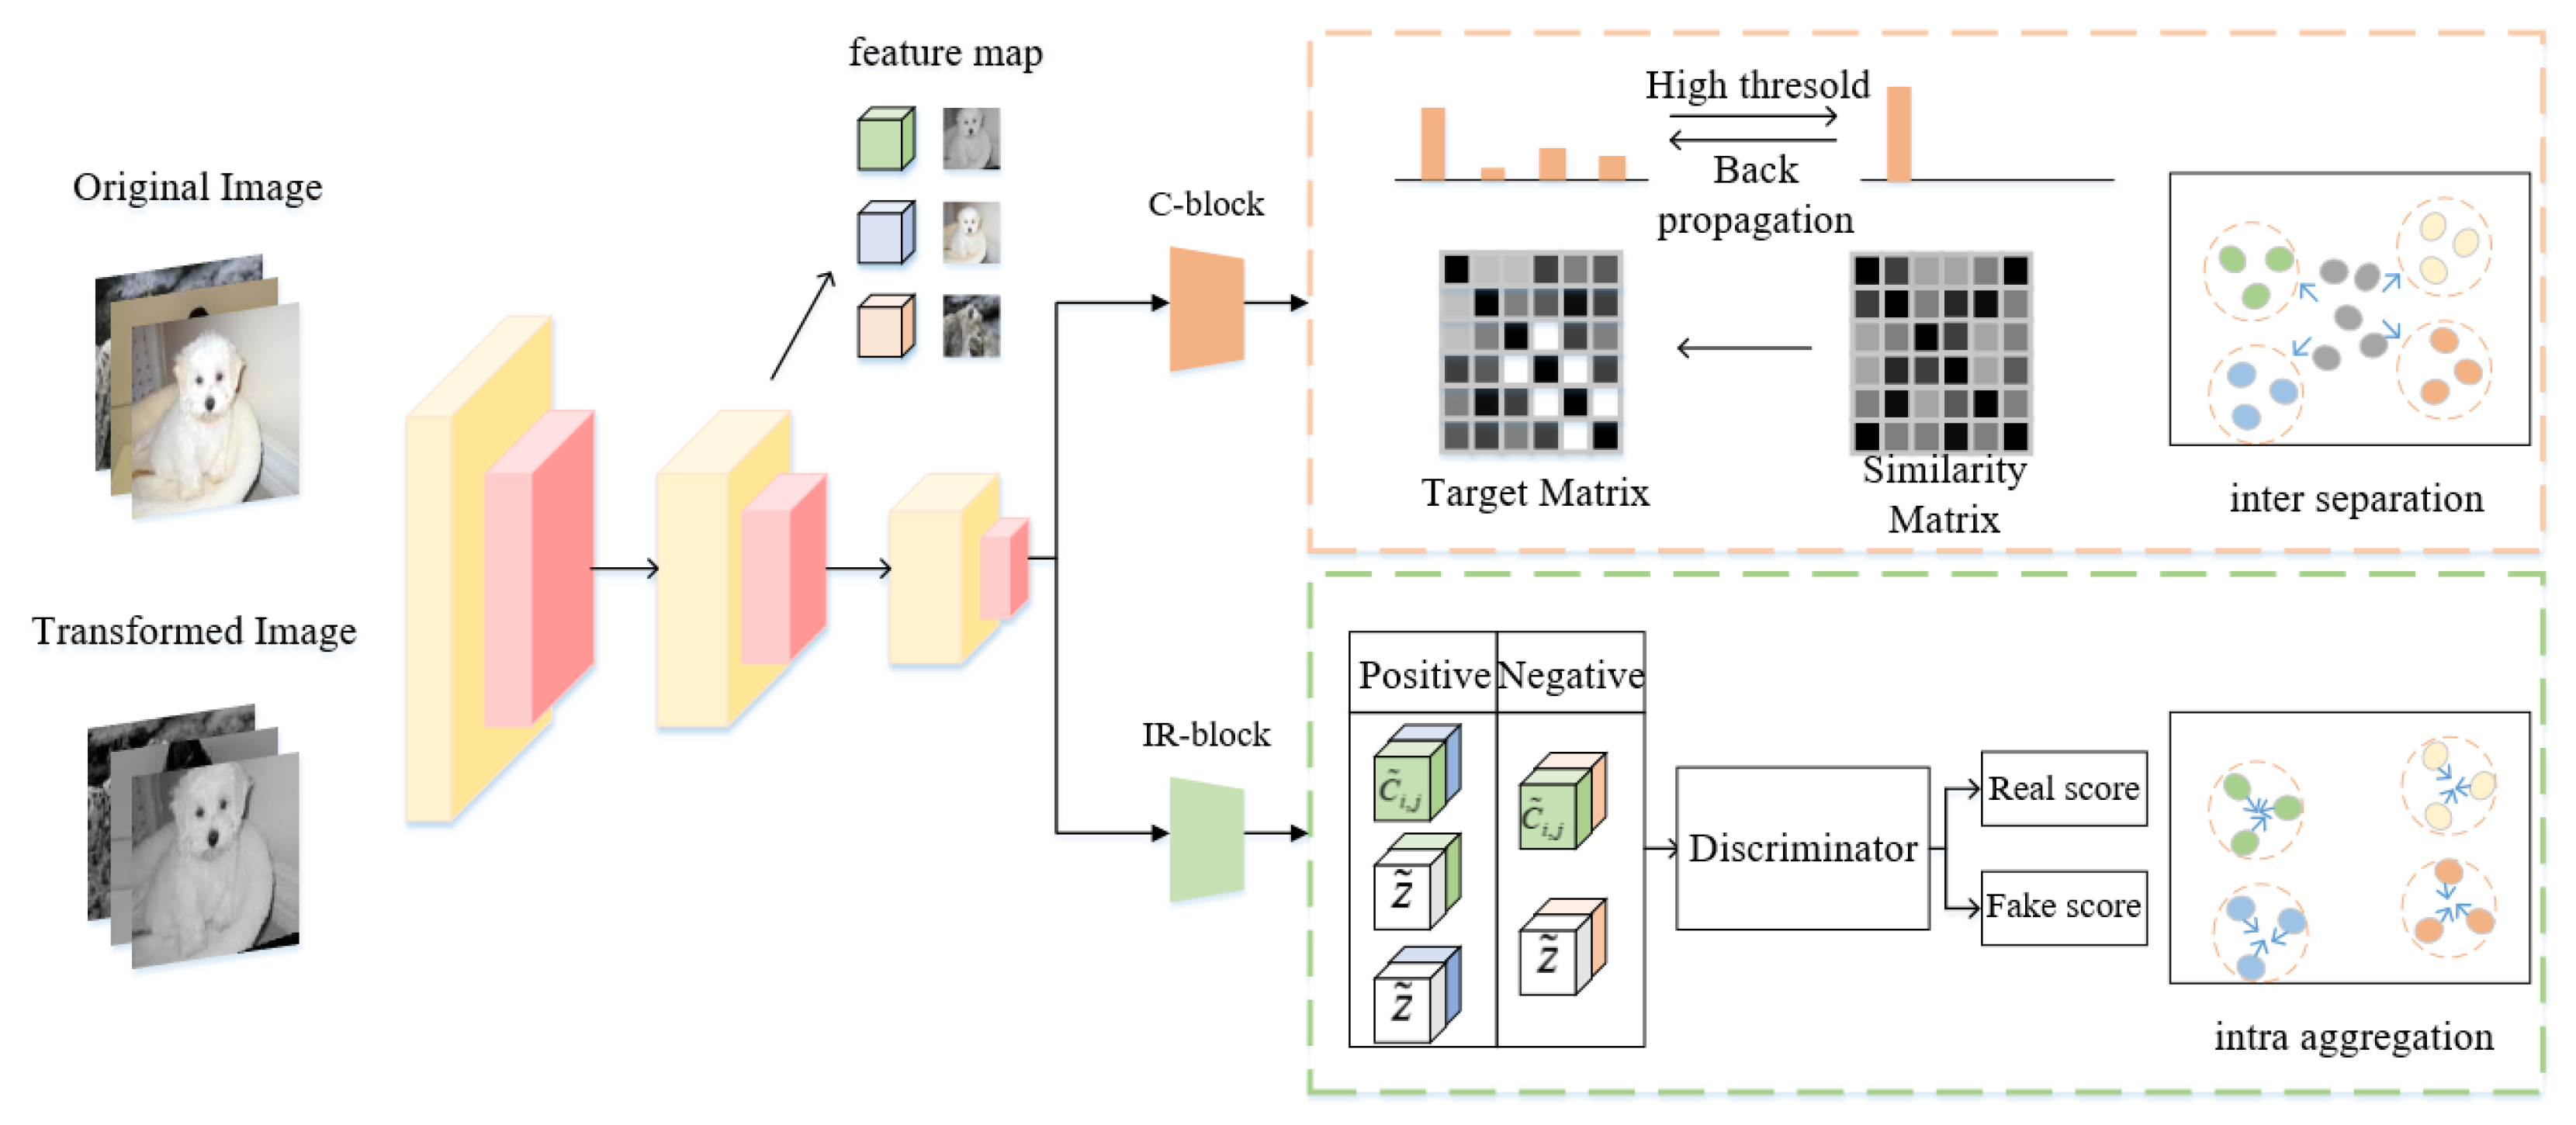
In order to solve the above limitations, this paper proposes a new image clustering model, DCSM. Based on the class-level mapping block (C-block), DCSM adds an instance-level mapping block (IR-block). The two blocks share the same backbone network, and the backbone network acts as an information transmission channel between the two blocks. First, the C-block learns discriminative class-level representation by selecting pairwise similar (dissimilar) samples. Second, errors will occur when constructing similar labels of sample pairs, so select high-confidence cluster-standard samples to correct network parameters because samples with high-confidence predictions are often already assigned to the proper cluster. Third, the proposed extended MI maximizes the MI between the global-local and local-local features of multiple views, forcing the IR block to capture the essential information. This can narrow the intra-class diversities in the representation feature space. Fourth, by introducing the theory of entropy maximization, the probability distribution of clusters is pushed closer to a uniform distribution to solve the trivial solution problem.
In summary, the major contributions of this paper are:
  • An end-to-end clustering network model is proposed to jointly learn representations and cluster assignments while preventing the network from falling into trivial solutions.
  • An extended MI method is proposed. It calculates the MI between features from multiple views of the same image, forcing the instance-level feature to capture invariant essential information and thus reducing the intra-class diversities in the representation feature space.
The rest of this paper is organized as follows. In Section 2, some related works on deep clustering and mutual information are outlined. Section 3 introduces the proposed method. Section 4 discusses the experimental results of DCSM, and Section 5 concludes our proposed method.

2. Related Work

2.1. Deep Clustering

In various deep architectures, one simple yet effective neural network is the autoencoder (AE). Therefore, many methods applied AE to extract features for clustering. For example, Yang et al. [29] applied AE to learn a K-means-friendly embedding representation. Fard et al. [30] proposed a Deep K-means approach using AE. Lv et al. [31] proposed a pseudo-label-based deep subspace clustering method. Diallo et al. [32] employed contractive autoencoder and self-augmentation techniques to develop deep clustering models suitable for document datasets. Ren et al. [33] proposed a deep density clustering framework by combining density clustering and AE. Since the convolutional neural network has demonstrated promising performance in image processing tasks, CNN has also been used in deep clustering. Yang et al. [34] used an RNN to implement aggregated clustering on the representations output by CNN and trained both networks in an end-to-end fashion. Sun et al. [35] combined active learning and deep clustering models to manually annotate uncertain and informative sample pairs and used these manually annotated samples to guide the training of CNN.
Different from the above methods using AE or CNN, another unsupervised deep architecture is generative models, such as GAN and VAE. Mukherjee et al. [24] designed the ClusterGAN-2 model to perform clustering in the latent space by optimizing GANs and cluster-specific losses. Wang et al. [25] utilized generated and raw data to train a feature extractor to learn efficient representations. Ntelemis et al. [36] introduced the Sobel operation before the discriminator to enhance the separability of learning features. Xu et al. [1] proposed a variational encoder deep clustering method based on MI maximization and derived a new generalization evidence lower bound.
It is also a good idea to directly design a specific clustering loss according to the desired clustering assumption. Xie et al. [37] use only one encoder when clustering, updating the encoder part of the AE by minimizing the KL divergence loss. Chang et al. [26] transformed the clustering problem into a binary discrimination problem by selecting pairs of similar and dissimilar samples to train the network. Wu et al. [27] mine and exploit associations between unlabeled data from three aspects to study category information, and introduce MI to further help learn more discriminative features. Xu et al. [28] learned cluster assignments by maximizing the mutual information of data to probabilistic features. Gansbeke et al. [38] generated pseudo-labels by mining nearest neighbors in the latent embedding space.

2.2. Mutual Information

Information theory has become an important tool for training deep neural networks. Mutual information quantifies the amount of information obtained by observing one random variable about another random variable. MINE [39] is an MI estimation technique for continuous variables that is scalable in the sample size, trained via backpropagation and is strongly consistent. DIM [40] adopts a simple alternative based on Jensen–Shannon divergence, which is an unbiased estimator that is insensitive to the number of negative samples. More importantly, DIM can also use the local structure of the input to improve the learned embedding representation ability and improve the quality of downstream tasks. RIM [41] introduces a regularization term that penalizes conditional models with complex decision boundaries to produce a reasonable clustering solution. Inspired by RIM, IMSAT [42] utilizes data augmentation to impose invariance on discrete representations by maximizing the mutual information between the data and its representations. IIC [28] constrains the output variables to be discrete variables and performs a simple and accurate mutual information calculation for the discrete variables.

3. Deep Image Clustering under Similarity and Mutual Information

The purpose of this paper is to cluster a set of N images X = { x i } i = 1 N into K classes by training a neural network without using any annotations. The neural network can be conceptually divided into two parts: a feature module that maps images to instance-level representations, z i = f r ( x i ; w r ) , and a clustering module that maps images to class-level representations, l i = f l r i , j ; w l , where w r and w l represent the trainable parameters of IR-block and C-block combined with the backbone network, respectively. This paper uses the output of the C-block to measure the similarity between samples driving the separation between clusters. The IR-block is constrained by the proposed extended mutual information, which captures the presence of a key object in the image to reduce the differences in intra-class feature representations. In addition, two tasks are designed to ensure the accuracy and stability of our model. They are fine-tuning the network using cluster-standard samples and maximizing the entropy loss. In the following subsections, this paper introduces each part in detail.

3.1. Clustering Module

The relationship of pairwise images is binary, i.e., similar or dissimilar. Based on such observations, the clustering task can be smoothly recast into a binary pairwise classification model [26]. It is natural to use the loss for the classification task instead of the clustering objective function:
m i n L D T ( w l ) = i = 1 n j = 1 n L ( r i , j , g ( x i , x j ; w l ) )
where L D T ( r i , j , g ( x i , x j ; w l ) ) represents the cross-entropy loss between the ground-truth similarity r i , j and the estimated similarity g ( x i , x j ; w l ) , and w l indicates the learnable parameter of the clustering module.
In Equation (1), the ground-truth similarity r i , j of samples x i and x j is unknown, and this problem needs to be solved. Previous methods used a high threshold to select pairwise similar (dissimilar) samples to assign r i , j , where r i , j = 1 indicates that samples x i and x j belong to the same cluster and r i , j = 0 otherwise [26,27]. Due to the existence of the threshold, the similarity relationship between pairwise samples does not satisfy transitivity, i.e., r i , j = 1 = r i , k r j , k = 1 .
This can lead to unstable network training. Different from the existing methods, this paper uses K-means as a flexible threshold selection strategy to construct r i , j :
r i , j = 1 , c i = c j   o r   i = j , 0 , o t h e r w i s e .
r i , j = 1 indicates that x i and x j belong to the same cluster c or the same sample, i = j , and r i , j = 0 otherwise. When pairwise samples belong to the same cluster, their similarity relationship must be transitive. The estimated similarity g ( x i , x j ; w l ) can be formulated as:
g x i , x j , w l = f l ( x i ; w l ) · f l ( x j ; w l ) = l i · l j s . t . i | | l i | | 2 = 1 , 0 l i h 1 , h = 1 , , k .
where f l is the clustering module, and the operator “·” represents the dot product between two label features. If the optimal value of Equation (1) is attained, the learned label features are k-diverse one-hot vectors ideally [26]. Images can be directly clustered based on the learned class-level representations.

3.2. Fine-Tuning through Cluster-Standard Samples

Pseudo-similar labels r i , j are obtained in Section 3.1 to learn discriminative features. However, errors in the construction of r i , j are inevitable. These false r i , j lead to predictions for which the network is less certain. It has been observed in experiments that samples with high-confidence predictions tend to be assigned to the proper cluster. It can be regarded as cluster-standard samples to fine-tune the network’s errors caused by incorrect r i , j . Cluster-standard samples are selected by setting a large threshold:
W i = 1 , p i j     t h r e s h o l d , 0 , o t h e r w i s e .
If the largest element p i j in the label feature l i is greater than the threshold, it can be regarded as a cluster-standard sample, W i = 1 ; otherwise, it is not, W i = 0 . Then, the clustering module can be fine-tuned in the backward pass by minimizing the following cross-entropy loss:
L F T = i = 1 N w i ( s i log ( l i ) + ( 1 s i ) log ( 1 l i )
where s i is the one-hot vector corresponding to label feature l i .

3.3. Extended Mutual Information

The discriminative class-level features have been obtained in the above section. In this section, by exploring the correlation between the features from multiple views of the same image, e.g., original and transformed images, the essential information in the image is learned, and the intra-class diversities in the instance-level representation feature space are also reduced. Maximizing MI between the complete input and the encoder output is not sufficient to learn useful representations [40]. The average MI between the global representation and the local features of the input plays a stronger role in improving the quality of representation than the global MI. Inspired by DIM, this paper only uses local MI and considers that KL divergence has no upper bound theoretically, so it is replaced by JS divergence (JSD) similar to f-gan [43]. The JSD version of MI is defined as:
M I ( f m a p , z ) = max E J [ s p ( T ( f m a p , Z ) ) ] E M [ s p ( T ( f m a p , Z ) ) ]
where f m a p corresponds to the local features (feature map), Z corresponds to the global feature (instance-level representation), s p is the softplus function and T is a discriminator trained to distinguish whether f m a p and Z are sampled from the joint distribution J or from the marginal distribution M. In this paper, only f m a p and Z belong to the same cluster and follow J; otherwise, they follow M. A pair of samples that satisfy the joint distribution is called a pair of positive samples; otherwise, a pair of negative samples.
In order to force the instance-level feature z to capture the essential information, our model extends DIM by introducing data augmentation techniques. Let x and x ˜ be the original and transformed samples, respectively, { C i , j ( x ) | i = 1 , 2 , , h ; j = 1 , 2 , , w } and { C ˜ i , j ( x ˜ ) | i = 1 , 2 , , h ; j = 1 , 2 , , w } correspond to their feature map. The negative samples of the feature map are all represented by the symbol C i , j . By concatenating C i , j and z to get a larger feature map as the input of the discriminator, the estimation of the global-local MI loss can be obtained by minimizing the following loss function:
L L M I ( z ˜ , C i , j ) = max I ( z ˜ , C i , j ) = min ( E J [ s p ( T ( z ˜ , C i , j ) ) ] E M [ s p ( T ( z ˜ , C i , j ) ) ] )
L L M I T ( z ˜ , C ˜ i , j ) = max I ( z ˜ , C ˜ i , j ) = min ( E J [ s p ( T ( z ˜ , C ˜ i , j ) ) ] E M [ s p ( T ( z ˜ , C i , j ) ) ] )
Meanwhile, not only the global-local MI is calculated. The original images and the augmented images’ intermediate layer features should also be related, and their MI should be as large as possible. The estimation of local-local MI loss can be obtained by minimizing the following loss function:
L L M I C ( C ˜ i , j , C i , j ) = max I ( C ˜ i , j , C i , j ) = min ( E J [ s p ( T ( C ˜ i , j , C i , j ) ) ] E M [ s p ( T ( C ˜ i , j , C i , j ) ) ] )
By maximizing the MI between features extracted from multiple views with the same information, it implies that the features need to capture high-level information with decisive influence, such as the existence of an object, so the extension of this paper is reasonable. Since DIM selects negative samples randomly, it is unreasonable to minimize the MI of pairwise samples when they belong to the same cluster. Therefore, in a similar way to DCCM, the positive and negative pairs of the same sample are selected according to the similarity of the sample pairs in this batch. Similar pairwise samples are regarded as positive pairs; otherwise, they are negative pairs. Maximizing MI between positive pairs promotes intra-class aggregation. Minimizing MI between negative pairs promotes inter-class separation. Based on the above-mentioned analysis and exploration, the final loss function is summarized as:
L M I = α L L M I + β L L M I T + δ L L M I C
where α , β and δ are constants to balance the contributions of different terms.

3.4. Maximize Entropy Loss

In deep clustering, it is easy to fall into a local optimal solution that assigns most samples into a minority of clusters. Inspired by GATCluster [44], this problem can be solved by introducing the technique of maximizing entropy, which can be formulated as:
L E = H ( q ) = i = 1 K q i log ( q i ) s . t . q k = 1 m i = 1 m l i k , k = 1 , , K
where l i k indicates the k-th element of l i , q k represents the frequency of the k-th cluster and H is entropy.
Then the overall objective function of DCSM can be formulated as:
L = ε L D T + L F T + L M I + λ L E
where ε and λ are constants to balance the contributions of different terms. Figure 1 shows the framework of the proposed DCSM model.

4. Experiments

In this section, the effectiveness of DCSM is demonstrated on four image datasets through experiments. Furthermore, five ablation experiments are performed to systematically and comprehensively analyze the developed DCSM model. All experiments are implemented on a PC machine installed in a 64-bit operating system with two Nvidia GeForce GTX 1080 Ti GPUs with 8-GB video memory.

4.1. Datasets

This paper selects four representative image datasets for clustering, including CIFAR10, MNIST, STL-10 and Imagenet10. As a common setting [29,35], for each dataset, the training and test sets are jointly used in our experiments. For clarity, Table 1 reports the details of each dataset, such as the number of categories, the number of samples and so on.

4.2. Evaluation Metrics

For a complete comparison, this paper employs three clustering metrics to evaluate the clustering performance, i.e., Normalized Mutual Information (NMI), Adjusted Rand Index (ARI) and clustering Accuracy (ACC). In addition, these metrics range in [0,1], and higher scores indicate better clustering results.

4.3. Experimental Settings

The backbone network architecture used in our model is VGG, and ReLU activation is used on all hidden layers. The reason why we use ReLU activation is that it overcomes the vanishing gradient problem, allowing models to learn faster and perform better. Both the class-level mapping block and the instance-level mapping block are fully connected networks, and their output layer dimensions are set to 10 and 30, respectively. For the local MI objective, the global representation is concatenated with the feature map at each location. A 1 × 1 convolutional discriminator is then used to score the pair. The network parameters are optimized using Adam [45], and the learning rate is set to 0.001. The batch size of STL10, ImageNet-10, Cifar10 and MNIST is all 32. The number of training repetitions for each batch of MNIST is 4, and the for rest of the datasets, it is 8. The small perturbations used in the experiments include rotation, shift, color adjustment and so on. The setting of the remaining three hyperparameters is given in Table 2.

4.4. Compared Methods

In the experiment, both traditional and deep learning-based methods are compared, including K-means, SC, AE, DAE, GAN, DECNN, VAE, DEC [37], JULE [34], DAC [26], DCCM [27], IIC [28], ICGAM [36] and EDCN [25]. DCSM-oc is a version of our model that uses only class-level map blocks.

4.5. Results and Analysis

In Table 3, the quantitative clustering results of the compared methods on four image datasets are orderly reported. From Table 3, our DCSM method consistently achieves superior performance on different datasets, which empirically signifies that DCSM is in a position to cluster data effectively. From further analysis, several tendencies can be observed in Table 3.
First, the performance of the clustering methods based on deep learning is generally superior to the traditional methods (e.g., K-means, SC). It shows that representation learning is more important than clustering techniques for unsupervised learning.
Second, the methods (e.g., DEC, DAC) of joint representation learning and cluster assignment outperform traditional methods and the representation-based clustering methods. It indicates that clustering and representation learning can promote each other and achieve better performance consequently.
Third, the performance of DCCM and IIC using the data augmentation technique is better than other algorithms. It means that the introduction of the data augmentation technique in unsupervised clustering can help the model to be optimized.
Besides of these common conclusions, our DCSM method outperforms methods that only use class-level representation (e.g., DCSM-oc, DCCM). It means that the clustering performance is related to both class-level representation and instance-level representation.
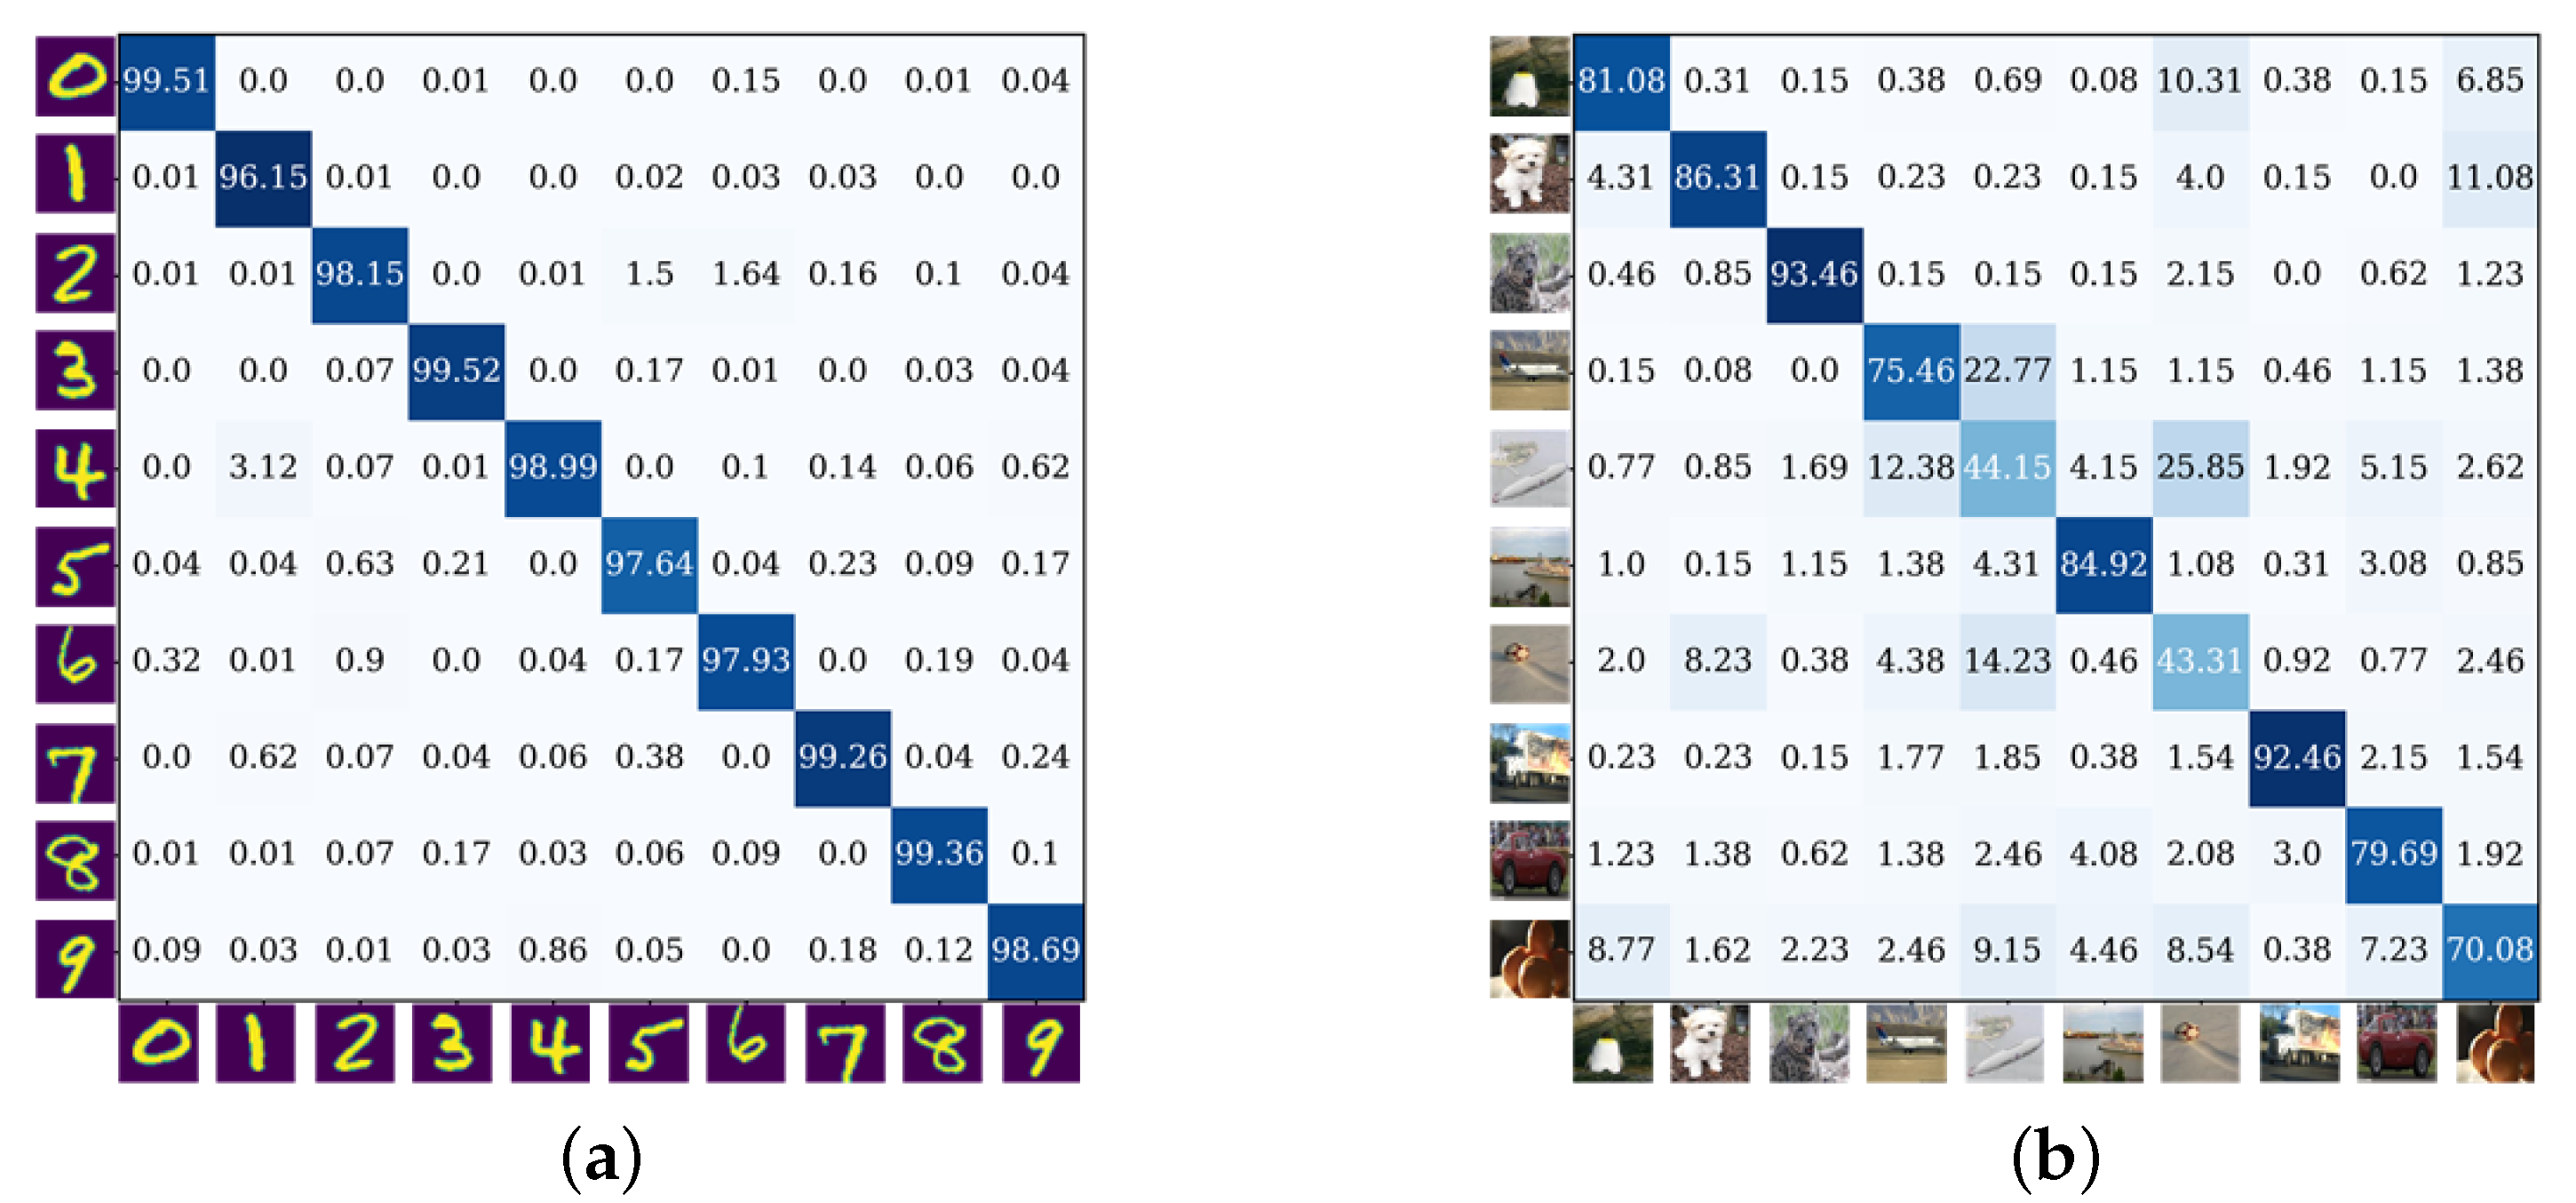
Figure 2 visualizes the confusion matrix on the MNIST and Imagenet10 datasets. 
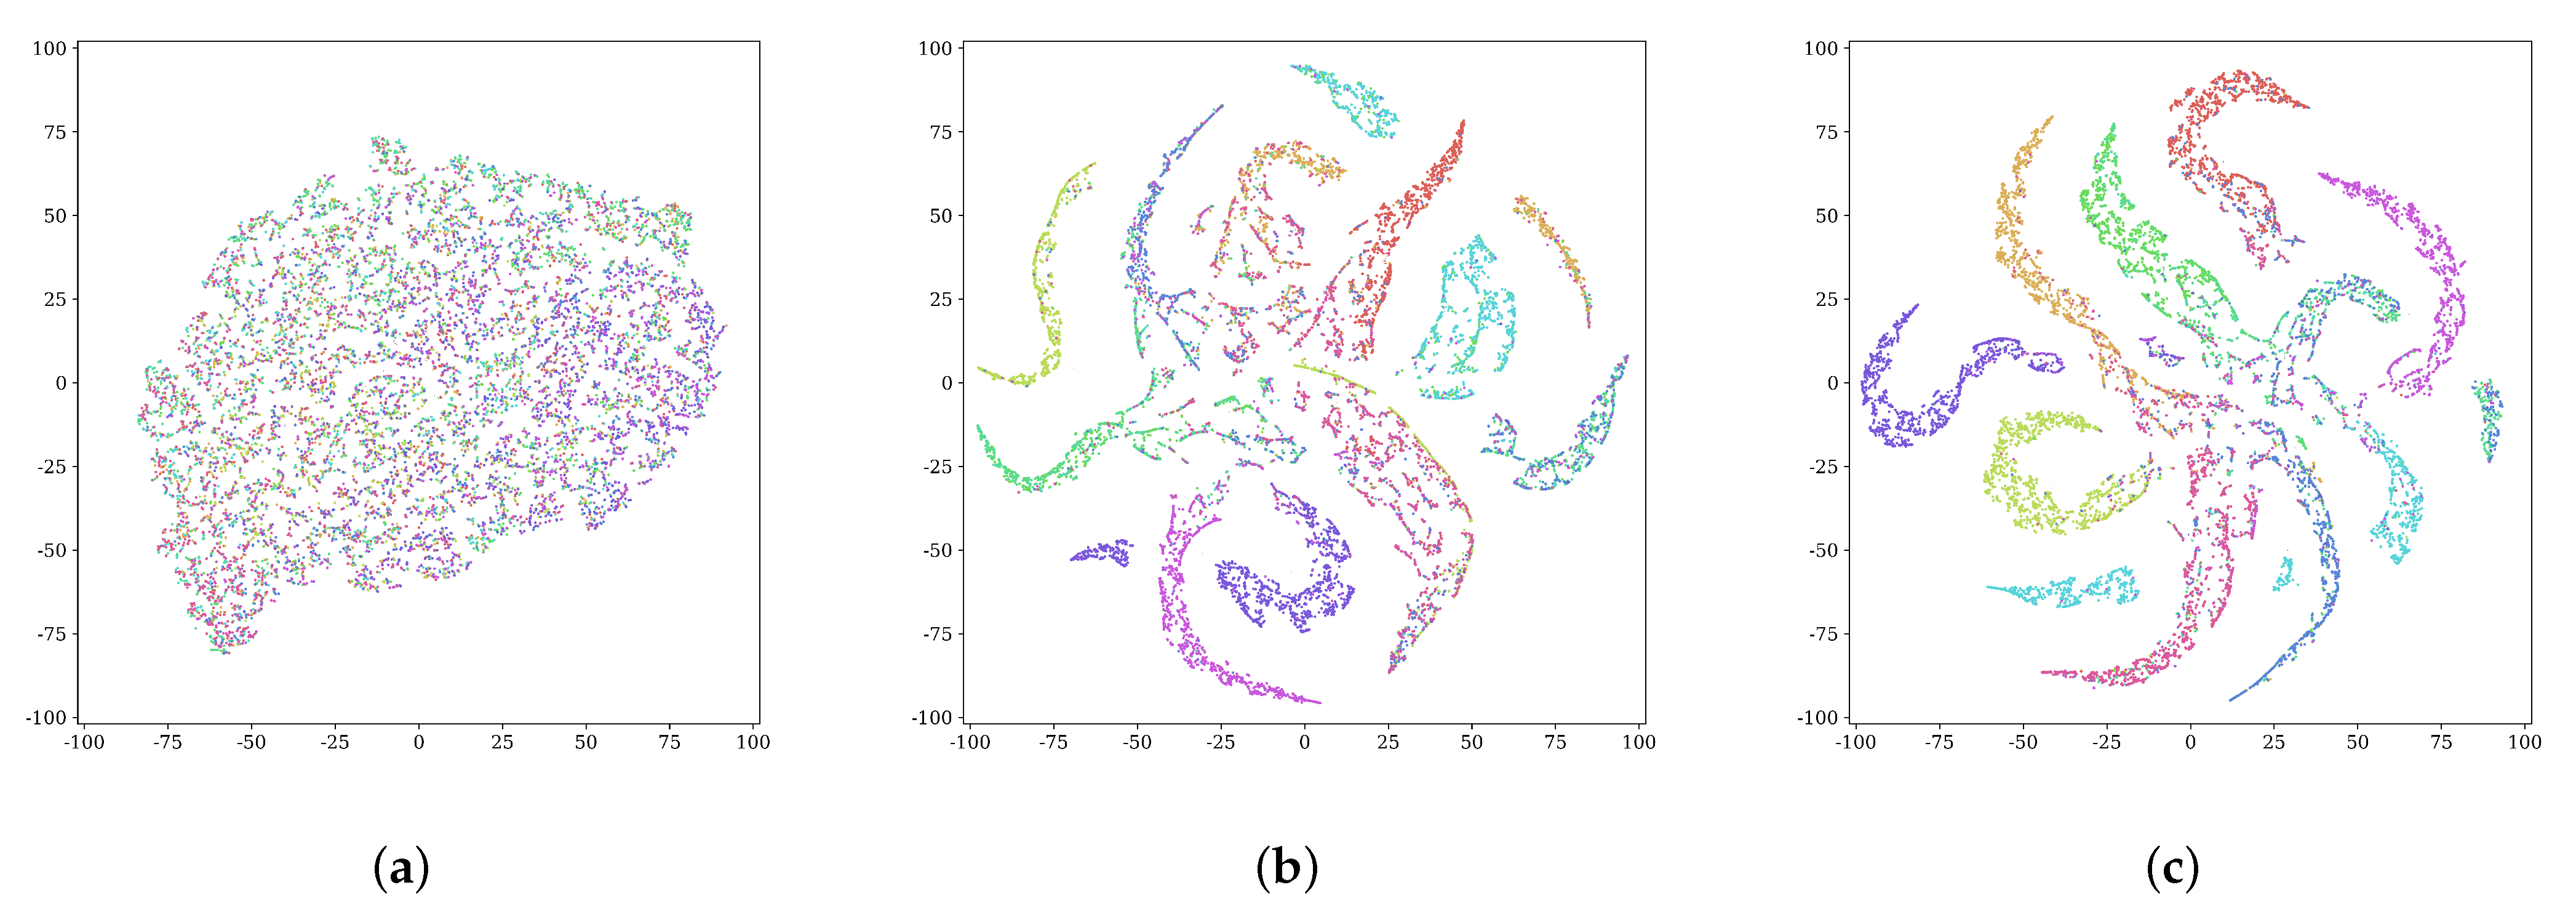
Figure 3 visualizes the class-level representations of the DCSM on the ImageNet10 datasets using t-SNE at the different training stages.

4.6. Ablation Study

In this section, to further verify the performance of our model, five additional ablation experiments are performed.
The influence of different strategies to construct r i , j . The r i , j constructed by the high threshold in DCCM and constructed by the K-means in this paper are used to guide the training of the two identical networks on Stl-10 datasets. The results are shown in Table 4. It can be seen that our strategy has enough advantages, indicating that K-means is a better alternative solution than the threshold.
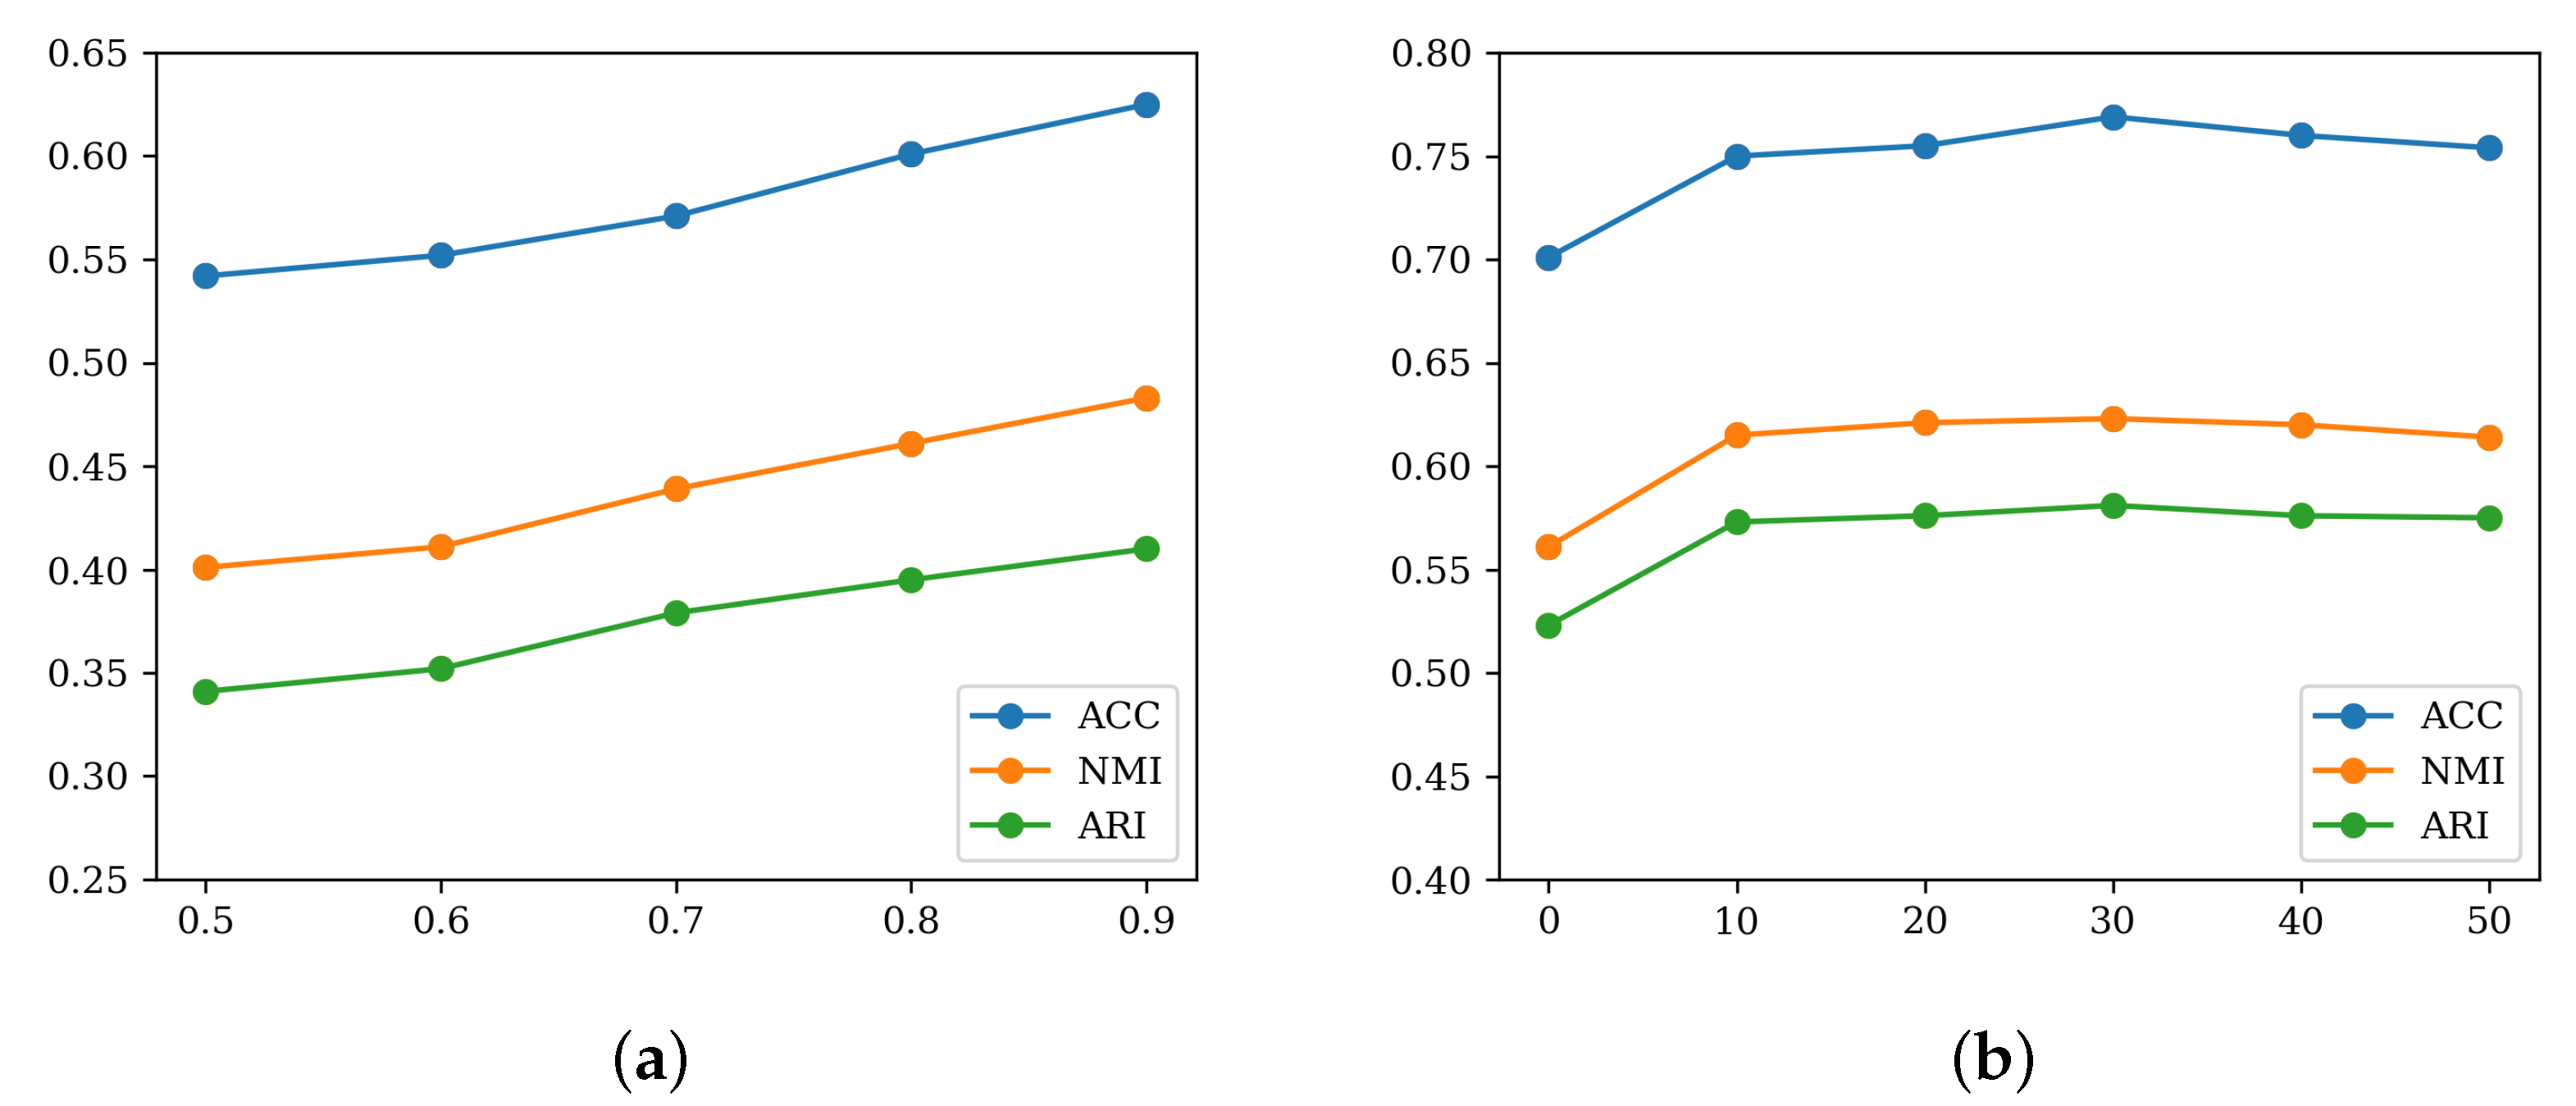
Impact of threshold. The clustering performance of STL-10 datasets under different thresholds in Equation (2) is displayed in Figure 4a. For STL-10, the clustering performance increases gradually as the threshold increases. It indicates that the correct rate of the selected cluster-standard samples is also gradually increasing.
The dimensional impact of z . As shown in Figure 4b, varying the dimension of z from 10 to 50 does not affect the clustering performance much. However, when the dimension of z becomes 0, which means that the network only learns class-level representations, the performance drops a lot. The reason is that class-level representation alone is not enough to describe the differences between images belonging to the same cluster. A good clustering model should assign data to clusters to keep inter-group similarity low while maintaining high intra-group similarity.
The sensitivity of the model to mutual information. For convenience, the mutual information loss L M I is divided into two parts: the global-local MI L Z C = L L M I + L L M I T and the local-local MI L L M I C . To comprehensively examine the effect of global-local and local-local MI on the clustering performance of the model, L M I was changed to L Z C and L L M I C , respectively. The experimental results are shown in Table 5. From the results, the two parts of MI have similar performances in improving the clustering performance. It also proves our proposed extended mutual information is reasonable.
The impact of each part. In the case of the combination of each part, the clustering performance is shown in Table 6. Due to the lack of L E loss, the network will have unstable results, so the maximum entropy loss is not removed in this part. It can be found that it is very effective to use cluster-standard samples to correct the network parameters.

5. Conclusions

This paper proposes an end-to-end clustering network model, DCSM, which aims to simultaneously reduce intra-class differences and improve inter-class separation. The proposed extended mutual information method achieves the purpose of reducing intra-class differences by further exploring the relationships between the original image features and transformed image features. Based on the pseudo-similar labels of sample pairs, DCSM encourages similar samples to move closer to each other and dissimilar samples to move away from each other to promote inter-class separation. The experiments demonstrate the advantages of our approach on four benchmark datasets. Future work will explore how to achieve more accurate pseudo-similar labels of sample pairs. This may include the use of contrastive learning or soft assignment methods to generate the pseudo-similar labels of sample pairs.

Author Contributions

Conceptualization, F.P. and K.L.; methodology, F.P.; software, F.P.; validation, F.P. and K.L.; formal analysis, F.P.; investigation, F.P.; resources, F.P.; data curation, F.P.; writing—original draft preparation, F.P.; writing—review and editing, F.P. and K.L.; visualization, F.P.; supervision, K.L. All authors have read and agreed to the published version of the manuscript.

Funding

Natural Science Foundation of Hebei Province (No. F2022201009); Hebei University High-level Scientific Research Foundation for the Introduction of Talent (No. 521100221029); Post-graduate’s Innovation Fund Project of Hebei University (No. HBU2022ss022).

Institutional Review Board Statement

Not applicable.

Informed Consent Statement

Not applicable.

Data Availability Statement

All datasets are publicly available.

Conflicts of Interest

The authors declare no conflict of interest.

References

  1. Xu, C.; Dai, Y.; Lin, R.; Shi, W. Deep clustering by maximizing mutual information in variational auto-encoder. Knowl.-Based Syst. 2020, 205, 106260. [Google Scholar] [CrossRef]
  2. Tang, X.; Dong, C.; Zhang, W. Contrastive Author-aware Text Clustering. Pattern Recognit. 2022, 130, 108787. [Google Scholar] [CrossRef]
  3. Jiang, G.; Peng, J.; Wang, H.; Ze, M.; Xian, F. Tensorial Multi-view Clustering via Low-rank Constrained High-order Graph Learning. IEEE Trans. Circuits Syst. Video Technol. 2022, 30, 5307–5318. [Google Scholar] [CrossRef]
  4. Wang, H.; Jiang, G.; Peng, J.; Ruo, D.; Xian, F. Towards Adaptive Consensus Graph: Multi-view Clustering via Graph Collaboration. IEEE Trans. Multimed. 2022, 10, 1–13. [Google Scholar] [CrossRef]
  5. MacQueen, J. Some methods for classification and analysis of multivariate observations. In Proceedings of the Fifth Berkeley Symposium on Mathematical Statistics and Probability, Los Angeles, CA, USA, 21 June–18 July 1967; Volume 1, pp. 281–297. [Google Scholar]
  6. Von Luxburg, U. A tutorial on spectral clustering. Stat. Comput. 2007, 17, 395–416. [Google Scholar] [CrossRef]
  7. Rodriguez, A.; Laio, A. Clustering by fast search and find of density peaks. Science 2014, 344, 1492–1496. [Google Scholar] [CrossRef] [Green Version]
  8. Ghareeb, A.; Rida, S.Z. Image quality measures based on intuitionistic fuzzy similarity and inclusion measures. J. Intell. Fuzzy Syst. 2018, 34, 4057–4065. [Google Scholar] [CrossRef]
  9. Xiao, Z.; Shi, Z.; Yong, L.; Ji, Z.; Li, Y.; Yue, F. Low-rank sparse subspace for spectral clustering. IEEE Trans. Knowl. Data Eng. 2018, 31, 1532–1543. [Google Scholar]
  10. Wang, H.; Wang, Y.; Zhang, Z.; Xian, F.; Li, Z.; Ming, X. Kernelized multiview subspace analysis by self-weighted learning. IEEE Trans. Multimed. 2020, 23, 3828–3840. [Google Scholar] [CrossRef]
  11. Ding, X.; Zhang, X.; Ma, N.; Jun, H.; Gui, D.; Jian, S. Repvgg: Making vgg-style convnets great again. In Proceedings of the IEEE/CVF Conference on Computer Vision and Pattern Recognition, Nashville, TN, USA, 20–25 June 2021; pp. 13733–13742. [Google Scholar]
  12. Kaur, P.; Harnal, S.; Tiwari, R.; Alharithi, F.S.; Almulihi, A.H.; Noya, I.D.; Goyal, N. A hybrid convolutional neural network model for diagnosis of COVID-19 using chest X-ray images. Int. J. Environ. Res. Public Health 2021, 18, 12191. [Google Scholar] [CrossRef]
  13. Hui, W.; Jin, P.; Guang, J.; Feng, X.; Xian, F. Discriminative feature and dictionary learning with part-aware model for vehicle re-identification. Neurocomputing 2021, 438, 55–62. [Google Scholar]
  14. Wang, H.; Peng, J.; Zhao, Y.; Fu, X. Multi-path deep cnns for fine-grained car recognition. IEEE Trans. Veh. Technol. 2020, 69, 10484–10493. [Google Scholar] [CrossRef]
  15. Wang, H.; Peng, J.; Chen, D.; Jiang, G.; Zhao, T.; Fu, X. Attribute-guided feature learning network for vehicle reidentification. IEEE Multimed. 2020, 27, 112–121. [Google Scholar] [CrossRef]
  16. Chugh, H.; Gupta, S.; Garg, M.; Gupta, D.; Mohamed, H.G.; Noya, I.D.; Singh, A.; Goyal, N. An Image Retrieval Framework Design Analysis Using Saliency Structure and Color Difference Histogram. Sustainability 2022, 14, 10357. [Google Scholar] [CrossRef]
  17. Min, E.; Guo, X.; Liu, Q.; Zhang, G.; Cui, J.; Long, J. A survey of clustering with deep learning: From the perspective of network architecture. IEEE Access 2018, 6, 39501–39514. [Google Scholar] [CrossRef]
  18. Simonyan, K.; Zisserman, A. Very deep convolutional networks for large-scale image recognition. arXiv 2014, arXiv:1409.1556. [Google Scholar]
  19. Hinton, G.E.; Salakhutdinov, R.R. Reducing the dimensionality of data with neural networks. Science 2006, 313, 504–507. [Google Scholar] [CrossRef] [Green Version]
  20. Kingma, D.P.; Welling, M. Auto-encoding variational bayes. arXiv 2013, arXiv:1312.6114. [Google Scholar]
  21. Goodfellow, I.; Pouget-Abadie, J.; Mirza, M.; Xu, B.; Warde, D.; Ozair, S. Generative adversarial networks. Commun. ACM 2020, 63, 139–144. [Google Scholar] [CrossRef]
  22. Yu, Y.; Zhou, W. Mixture of GANs for clustering. In Proceedings of the 27th International Joint Conference on Artificial Intelligence, Stockholm, Sweden, 13–19 July 2018; pp. 3047–3053. [Google Scholar]
  23. Ghasedi, K.; Wang, X.; Deng, C.; Huang, H. Balanced self-paced learning for generative adversarial clustering network. In Proceedings of the IEEE/CVF Conference on Computer Vision and Pattern Recognition, Long Beach, CA, USA, 16–17 June 2019; pp. 4391–4400. [Google Scholar]
  24. Mukherjee, S.; Asnani, H.; Lin, E.; Kannan, S. Clustergan: Latent space clustering in generative adversarial networks. In Proceedings of the AAAI Conference on Artificial Intelligence, Honolulu, HI, USA, 22 February–1 March 2019; pp. 4610–4617. [Google Scholar]
  25. Cao, W.; Zhang, Z.; Liu, C.; Li, R. Unsupervised discriminative feature learning via finding a clustering-friendly embedding space. Pattern Recognit. 2022, 129, 108768. [Google Scholar] [CrossRef]
  26. Chang, J.; Wang, L.; Meng, G.; Xiang, S.; Pan, C. Deep adaptive image clustering. In Proceedings of the IEEE International Conference on Computer Vision, Venice, Italy, 22–29 October 2017; pp. 5879–5887. [Google Scholar]
  27. Wu, J.; Long, K.; Wang, F.; Qian, C.; Li, C.; Lin, Z.; Zha, H. Deep comprehensive correlation mining for image clustering. In Proceedings of the IEEE/CVF International Conference on Computer Vision, Seoul, Republic of Korea, 27–28 October 2019; pp. 8150–8159. [Google Scholar]
  28. Xu, J.; Henriques, J.F.; Vedaldi, A. Invariant information clustering for unsupervised image classification and segmentation. In Proceedings of the IEEE/CVF International Conference on Computer Vision, Seoul, Republic of Korea, 27–28 October 2019; pp. 9865–9874. [Google Scholar]
  29. Yang, B.; Fu, X.; Sidiropoulos, N.D.; Hong, M. Towards k-means-friendly spaces: Simultaneous deep learning and clustering. In Proceedings of the International Conference on Machine Learning, PMLR, Sydney, Australia, 6–11 August 2017; pp. 3861–3870. [Google Scholar]
  30. Fard, M.M.; Thonet, T.; Gaussier, E. Deep k-means: Jointly clustering with k-means and learning representations. Pattern Recognit. Lett. 2020, 138, 185–192. [Google Scholar] [CrossRef]
  31. Lv, J.; Kang, Z.; Lu, X.; Xu, Z. Pseudo-supervised deep subspace clustering. IEEE Trans. Image Process. 2021, 30, 5252–5263. [Google Scholar] [CrossRef] [PubMed]
  32. Diallo, B.; Hu, J.; Li, T.; Khan, G.; Liang, X.; Zhao, Y. Deep embedding clustering based on contractive autoencoder. Neurocomputing 2021, 433, 96–107. [Google Scholar] [CrossRef]
  33. Ren, Y.; Wang, N.; Li, M.; Xu, Z. Deep density-based image clustering. Knowl.-Based Syst. 2020, 197, 105841. [Google Scholar] [CrossRef]
  34. Yang, J.; Parikh, D.; Batra, D. Joint unsupervised learning of deep representations and image clusters. In Proceedings of the IEEE Conference on Computer Vision and Pattern Recognition, Las Vegas, NV, USA, 27–30 June 2016; pp. 5147–5156. [Google Scholar]
  35. Sen, B.; Zhou, P.; Du, L.; Li, X. Active deep image clustering. Knowl.-Based Syst. 2022, 252, 109346. [Google Scholar] [CrossRef]
  36. Ntelemis, F.; Jin, Y.; Thomas, S.A. Image clustering using an augmented generative adversarial network and information maximization. IEEE Trans. Neural Netw. Learn. Syst. 2021, 33, 7461–7474. [Google Scholar] [CrossRef]
  37. Xie, J.; Girshick, R.; Farhadi, A. Unsupervised deep embedding for clustering analysis. In Proceedings of the International Conference on Machine Learning, New York, NY, USA, 20–22 June 2016; pp. 478–487. [Google Scholar]
  38. Van Gansbeke, W.; Vandenhende, S.; Georgoulis, S.; Proesmans, M.; Van Gool, L. Scan: Learning to classify images without labels. In Proceedings of the European Conference on Computer Vision, Glasgow, UK, 23–28 August 2020; Springer: Cham, Switzerland, 2020; pp. 268–285. [Google Scholar]
  39. Belghazi, M.I.; Baratin, A.; Rajeshwar, S.; Ozair, S.; Bengio, Y.; Courville, A.; Hjelm, D. Mutual information neural estimation. In Proceedings of the International Conference on Machine Learning, PMLR, Stockholm, Sweden, 10–15 July 2018; pp. 531–540. [Google Scholar]
  40. Hjelm, R.D.; Fedorov, A.; Lavoie-Marchildon, S.; Grewal, K.; Bachman, P.; Trischler, A.; Bengio, Y. Learning deep representations by mutual information estimation and maximization. arXiv 2018, arXiv:1808.06670. [Google Scholar]
  41. Krause, A.; Perona, P.; Gomes, R. Discriminative clustering by regularized information maximization. Adv. Neural Inf. Process. Syst. 2010, 23, 531–540. [Google Scholar]
  42. Hu, W.; Miyato, T.; Tokui, S.; Matsumoto, E.; Sugiyama, M. Learning discrete representations via information maximizing self-augmented training. In Proceedings of the International Conference on Machine Learning, PMLR, Sydney, Australia, 6–11 August 2017; pp. 1558–1567. [Google Scholar]
  43. Nowozin, S.; Cseke, B.; Tomioka, R. f-gan: Training generative neural samplers using variational divergence minimization. Adv. Neural Inf. Process. Syst. 2016, 29, 271–279. [Google Scholar]
  44. Niu, C.; Zhang, J.; Wang, G.; Liang, J. Gatcluster: Self-supervised gaussian-attention network for image clustering. In Proceedings of the European Conference on Computer Vision, Glasgow, UK, 23–28 August 2020; Springer: Cham, Switzerland, 2020; pp. 735–751. [Google Scholar]
  45. Kingma, D.P.; Ba, J. Adam: A method for stochastic optimization. In Proceedings of the International Conference on Learning Representations (ICLR), San Diego, CA, USA, 7–9 May 2015; pp. 1–15. [Google Scholar]
Figure 1. Model Overview. The original image and its transformed image are regarded as a pair of inputs to learn class-level (C-block) and instance-level (IR-block) representations using a shared deep neural network. The similarity matrix is generated from the class-level feature similarity relationship of the transformed images, and the target matrix is generated using K-means in the original image class-level feature space to guide the similarity matrix. Cluster standard samples are selected according to the threshold to modify the network parameters. The discriminator network estimates the mutual information of local-global and local-local representations, respectively.
Applsci 13 00674 g001
Figure 2. Confusion matrixes of the cluster results. (a,b) represent the clustering results on MNIST and Imagenet10 datasets, respectively.
Applsci 13 00674 g002
Figure 3. Visualization of the class−level representations for different training stages of the proposed DCSM on the Imagenet10 datasets. (a) Initial stage of DCSM, (b) Middle stage of DCSM and (c) Final stage of DCSM.
Applsci 13 00674 g003
Figure 4. Clustering performance under different thresholds and z. (a) Impact of threshold. (b) The dimensional impact of z.
Applsci 13 00674 g004
Table 1. Statistics of the Different Datasets.
DatasetsTraining SetsTest SetsCategoriesImage Size
CIFAR1050,00010,0001032 × 32 × 3
MNIST60,00010,0001028 × 28 × 1
STL-1013,000N/A1096 × 96 × 3
ImageNet-1013,000N/A10128 × 128 × 3
Table 2. Parameter Settings of the Different Datasets.
Datasets α β δ
CIFAR100.10.50.2
MNIST0.210.1
STL-100.110.1
ImageNet-100.310.3
Table 3. Clustering performance of different methods on four datasets. The best results are highlighted in bold.
MNISTCIFAR-10STL-10ImageNet-10
NMIACCARINMIACCARINMIACCARINMIACCARI
K-means0.5010.5720.3650.0870.2290.0490.1250.1920.0610.1190.2410.057
SC0.6620.6950.5210.1030.2470.0850.0980.1590.0480.1510.2740.076
AE0.7250.8120.6130.2390.3140.1690.2500.3030.1610.2100.3170.152
DAE0.7560.8310.6470.2510.2970.1630.2240.3020.1520.2060.3040.138
GAN0.7630.7360.8270.2650.3150.1760.2100.2980.1390.2250.3460.157
DeCNN0.7570.8170.6690.2400.2820.1740.2270.2990.1620.1860.3130.142
VAE0.8760.9450.8490.2450.2910.1670.2000.2820.1460.1930.3340.168
DEC0.7710.8430.7410.2570.3010.1610.2760.3590.1860.2820.3810.203
JULE0.9130.9640.9270.1920.2720.1380.1820.2770.1640.1750.3000.138
DAC0.9350.9770.9480.3960.5220.3060.3660.4700.2570.3940.5270.302
IIC-0.992--0.617--0.610----
DCCM0.9510.9820.9540.4960.6230.4080.3760.4820.2620.6080.7100.555
ICGAM-0.990--0.700--0.587----
EDCN0.9620.985-0.6030.544-0.3570.482----
DCSM-oc0.9500.9810.9590.4510.5890.3680.4310.5760.3420.5610.7010.523
DCSM0.9670.9940.9730.5050.6360.4130.4830.6250.4100.6230.7690.581
Table 4. The influence of different strategies on constructing r i , j .
MethodsACCNMIARI
OUR0.5290.4020.311
DCCM0.3910.2970.213
Table 5. The sensitivity of the model to mutual information.
STL-10ImageNet-10
NMIACCARINMIACCARI
L Z C 0.4640.6050.3870.5890.7360.542
L L M I C 0.4550.5960.3760.5830.7270.564
L Z C + L L M I C 0.4830.6250.4100.6230.7690.581
Table 6. The impact of each part.
STL-10ImageNet-10
NMIACCARINMIACCARI
L D T 0.4020.5290.3110.5010.6380.469
L D T + L F T 0.4310.5760.3420.5610.7010.523
L D T + L F T + L M I 0.4830.6250.4100.6230.7690.581
Disclaimer/Publisher’s Note: The statements, opinions and data contained in all publications are solely those of the individual author(s) and contributor(s) and not of MDPI and/or the editor(s). MDPI and/or the editor(s) disclaim responsibility for any injury to people or property resulting from any ideas, methods, instructions or products referred to in the content.

