Article

Isolation and Characterization of Biohydrogen-Producing Bacteria for Biohydrogen Fermentation Using Oil Palm Biomass-Based Carbon Source

by
Abdullah Amru Indera Luthfi
1,2,
Peer Mohamed Abdul
1,2,*,
Jamaliah Md Jahim
1,2,
Nurul Sakinah Engliman
3,
Nur Syakina Jamali
4,
Jian Ping Tan
5,
Shareena Fairuz Abdul Manaf
6,
Mohd Shaiful Sajab
1,2 and
Nurul Adela Bukhari
7
1
Department of Chemical and Process Engineering, Faculty of Engineering and Built Environment, Universiti Kebangsaan Malaysia, Bangi 43600, Selangor, Malaysia
2
Research Centre for Sustainable Process Technology (CESPRO), Faculty of Engineering and Built Environment, Universiti Kebangsaan Malaysia, Bangi 43600, Selangor, Malaysia
3
Department of Biochemical-Biotechnology Engineering, International Islamic University Malaysia (IIUM), Kuala Lumpur 50728, Kuala Lumpur, Malaysia
4
Department of Chemical and Environmental Engineering, Faculty of Engineering, Universiti Putra Malaysia, Serdang 43400, Selangor, Malaysia
5
School of Energy and Chemical Engineering, Xiamen University Malaysia, Jalan Sunsuria, Bandar Sunsuria, Sepang 43900, Selangor, Malaysia
6
School of Chemical Engineering, College of Engineering, Universiti Teknologi MARA, Shah Alam 40450, Selangor, Malaysia
7
Energy and Environment Unit, Engineering & Processing Research Division, Malaysian Palm Oil Board (MPOB), 6, Persiaran Institusi, Bandar Baru Bangi, Kajang 43000, Selangor, Malaysia
*
Author to whom correspondence should be addressed.
Appl. Sci. 2023, 13(1), 656; https://doi.org/10.3390/app13010656
Submission received: 29 November 2022 / Revised: 24 December 2022 / Accepted: 30 December 2022 / Published: 3 January 2023

Abstract

:
The effectiveness of biohydrogen conversion from biomass sources is governed by the selection of ideal biohydrogen-producing bacteria to achieve high and consistent production performance. The aim of this research was to isolate and identify a biohydrogen producer in local soil samples, as well as to evaluate its fermentability in biohydrogen production from oil palm empty fruit bunches (OPEFB). To this end, preliminary identification was performed using morphological, phenotype, biological, and 16s rRNA analyses. The fermentability of the isolate was further evaluated in a serum bottle and then in a 1.5 L anaerobic column bioreactor (ACBR) to investigate the potential for biohydrogen production using two OPEFB-based carbon sources: hydrolysate of ammonia fiber expansion (AFEX)-pretreated OPEFB and molasses from dilute acetic acid (DAA)-pretreated OPEFB. The isolated strain, Enterobacter sp. KBH 6958, was found to be capable of producing biohydrogen from various carbon sources via the pyruvate:ferredoxin oxidoreductase (PFOR) pathway. The cumulative conversion of AFEX OPEFB hydrolysate was 45% higher than that observed in DAA OPEFB molasses fermentation in the production of biohydrogen. The biohydrogen yield after fermenting AFEX OPEFB hydrolysate with Enterobacter sp. KBH 6958 was 1.55 mol H2/mol sugar, with a maximum productivity of 98.1 mL H2/h (4.01 mmol H2/L/h), whereas butyrate (10.6 mM), acetate (11.8 mM), and ethanol (4.56 mM) were found to be the major soluble metabolites. This study successfully demonstrated the biotechnological conversion of OPEFB into biohydrogen using a locally isolated strain, which not only solves environmental issues associated with the industry but may also offer a solution to the world’s energy insecurity.

1. Introduction

The role of biohydrogen-producing bacteria in the selection of fermentation feedstock, bioprocess design, and final biohydrogen production yield is critical from the biotechnological processing perspective. There are numerous reports in the literature on biohydrogen fermentation using both mixed and pure cultures of wild-type strains [1,2]. Accordingly, sludge, soil, wastewater, and compost have all been identified as natural habitats for such bacteria and have the potential to be excellent biocatalysts for biohydrogen fermentation [3]. Mixed cultures are generally preferred due to their ease of handling and the capability of utilizing a wider range of fermentation feedstocks. However, maintaining a stable biohydrogen-producing microbial community within mixed cultures remains a challenging task because of its dynamicity in evolving as fermentation operational parameters change [4]. Moreover, the threat of predominating non-hydrogen-producing bacteria such as methanogens, homoacetogens, and lactic acid bacteria must be taken into consideration when dealing with mixed cultures. A single culture of biohydrogen-producing bacterium, on the other hand, provides much-needed consistency in inoculum preparation, with higher, and consistent product yields. In order to minimize operational costs, the biohydrogen fermentation of a single culture inoculum must be performed without any medium sterilization [5,6].
Several anaerobic organisms have been identified as biohydrogen producers. In general, biohydrogen-producing bacteria are classified as either obligate anaerobes (such as Clostridia) or facultative anaerobes (e.g., Enteric bacteria) [7]. Obligate anaerobes are excellent biohydrogen producers, whereas facultative anaerobes have greater tolerance and durability when exposed to oxygen [8,9]. Clostridia sp. produces spores, so the first step in isolating bacterium from this genus is usually a pretreatment of inoculum. Pretreatment of inoculum, either chemically or thermally, results in an enrichment of spore-forming bacteria by removing potentially non-spore-forming biohydrogen producers [5,6,10]. Bacteria isolation procedures without seed inoculum pretreatment may result in a broader selection of biohydrogen producers. The ability to tolerate oxygen, on the other hand, is a major advantage of facultative anaerobes, such as Enterobactericeae, over obligate anaerobes, which simplifies process handling. Once oxygen is depleted in the fermentation medium, the enzyme activity involved in biohydrogen production can be rapidly restored. The genus can produce biohydrogen by metabolizing glucose via a mixed acid (primarily formic acid) or 2,3-butanediol fermentation pathway. Nevertheless, both types of bacterial genera have been shown to be capable of growing, consuming, and producing biohydrogen from a variety of waste and lignocellulosic materials, including oil palm biomass [11,12,13].
At the moment, Malaysia’s palm oil mills generate ca. 95 million tons of oil palm fresh fruit bunches. Fresh fruit bunches are steam-sterilized after collection to inhibit lipid degrading enzymes and microbial action. The bunch’s fruitlets are stripped, crushed, and digested for their oil content, leaving oil palm empty fruit bunches (OPEFB) as a major byproduct. Approximately 22–23% of the total mass of fresh fruit bunches, or nearly 20 million tons of solid biomass, is discharged as OPEFB. The OEPFB is composed of a main stalk (about 20–25% of total weight) and numerous spikelets with sharp spines at the tips. It is therefore critical to utilize OPEFB for purposes other than conventional mulching, soil conditioning, or pelletization for use as a fuel for boilers. These traditional methods are not sustainable because they either necessitate a large processing area or are harmful to the environment by emitting greenhouse gases into the atmosphere [14,15,16]. In this regard, creating value-added products from OPEFB generates additional profit, while at the same time addressing environmental issues.
Against this background, the primary aim of this research was to isolate and identify biohydrogen-producing bacterium from local soil samples. The goal of the isolation was to obtain a single colony of cells with the highest biohydrogen production using OPEFB-based carbon sources as the main fermentation feedstock. This bacterium was studied both morphologically and molecularly.

2. Materials and Methods

2.1. Soil Sample Collection and Raw Material Preparation

2.1.1. Soil Sample

Soil samples were collected around the lake near Fakulti Kejuruteraan dan Alam Bina, Universiti Kebangsaan Malaysia (UKM), and transported to the laboratory in a sealed plastic bag. The soil sample was then suspended in a sterile isotonic solution (0.85% sodium chloride). In order to ensure even mixing, the solution was vortexed thoroughly. After sedimentation and serial dilutions of up to 10−5, the supernatant was used as an inoculum for the subsequent isolation procedure.

2.1.2. Oil Palm Empty Fruit Bunches Preconditioning

The oil palm empty fruit bunches (OPEFB) used in this work was provided by Sime Darby East Oil Mills, Carey Island, Selangor, Malaysia. The fresh OPEFB sample was collected immediately after it was discarded from Sime Darby East Oil Mill’s shredding units. At the laboratory, OPEFB was washed with distilled water to eliminate the unwanted elements, and thereafter dried under the sun for a day, and then in a convection oven (Protech AB, Sweden) at 60 °C for 12 h to remove excess moisture. The moisture content of the samples was kept constant at 12–13%. The sample was further pulverized through a cutting mill (FRITSCH GmbH, Germany) with a 10 mm screen mesh.
Dilute acetic acid (DAA) pretreatment on the pulverized OPEFB was performed at Sime Darby Plantation Sdn. Bhd. pretreatment facility. This pretreatment process was carried out by Sime Darby in collaboration with Mitsui Engineering and Shipbuilding Co. Ltd. (Japan). In this study, the DAA pretreatment was chosen for treating OPEFB since the molasses generated from the facility was rich in dissolved sugars. This facilitates acid catalysed hydrolysis, hence leading to greater hemicellulose removal with low sugar decomposition products (furfurals and 5-hydroxylmethylfurfural). Moreover, the presence of acetic acid in the fermentation media is also theoretically favorable as this leads to higher biohydrogen evolution based on the metabolic pathway of biohydrogen-producing bacteria. Accordingly, raw OPEFB was soaked in 0.3% (w/v) acetic acid and loaded into the pretreatment vessel. The vessel was heated until 250 °C and maintained for 60 min. After the pretreatment, the slurry was pressed to separate the liquid molasses (labelled as DAA molasses). The pretreated DAA OPEFB was rinsed with distilled water and stored at −20 °C until further use.
Ammonia fiber expansion (AFEX) pretreatment of the pulverized OPEFB was conducted at the Biomass Conversion Research Laboratory of Michigan State University, USA using a method previously described elsewhere [17]. Samples containing 50% moisture (g moisture/g biomass) were charged into a 2 L bench-top high pressure Parr reactor (PARR Instrument, USA). The reactor was gradually loaded with liquid ammonia in a 1:1 (g ammonia: g biomass) ratio, and the reactor temperature was raised to 135 °C (~40 bar) for 45 min. The ammonia was allowed to evaporate after the pressure was released.
Enzymatic hydrolysis of the AFEX-pretreated OPEFB was performed at 50 °C, and pH 4.8, and shaken at 150 rpm. The glucan loading was set at 1% (w/v) in 30 mL tubular scintillation vials (Wheaton, IL, USA) with a working volume of 15 mL containing citrate buffer (0.05 M). Then, 17.7 µL of enzymes Cellic CTec2® (activity = 85.4 g protein/L) and 15.4 µL of Cellic HTec2® (activity = 65.2 g protein/L) (Novozymes, Denmark) were loaded to achieve 16.7 mg protein/g glucan. At the end of 48 h of enzymatic hydrolysis, the enzymatic reactions were halted by boiling denaturation within 10 min. The sugars thus produced were measured using high-performance liquid chromatography (HPLC) using established conditions, as described by Luthfi et al. [18]. While DAA OPEFB molasses is rich in soluble sugars, most of the sugars are made of pentose (xylose). By contrast, AFEX OPEFB’s enzymatic hydrolysate is relatively inhibitor-free and rich in hexose (glucose). The utilization of pentose-rich DAA OPEFB molasses and hexose-rich AFEX OPEFB hydrolysate as the fermentation substrate would create an attractive option for the development of biohydrogen commercialization.

2.2. Biohydrogen-Producing Bacterium Isolation

2.2.1. Isolation Medium

All isolation procedures were undertaken in a reinforced clostridial medium (RCM) broth and agar. The premixed RCM purchased from BD (USA) contains meat extract (10 g/L), peptone (5 g/L), yeast extract (3 g/L), glucose (5 g/L), starch (1 g/L), sodium chloride (5 g/L), sodium acetate (3 g/L), L-cysteine-chloride (0.5 g/L) and agar (0.5 g/L). The RCM broth was prepared by dissolving 38 g of RCM powder in 1 L of distilled water. The pH of the medium was set at 6.5. After autoclaving, the solution was dispensed into sterile 30-mL serum bottles. Each serum bottle was aseptically filled with 20 mL of RCM broth, capped with a butyl rubber stopper, and clamped with an aluminum cap. Nitrogen gas was sparged through the media for 5 min to achieve anaerobic conditions for the culture. The RCM serum bottles were then stored at 4 °C until further use.
The RCM agar was prepared by dissolving 38 g of RCM powder and 15 g of bacteriological agar (Oxoid, UK) in 1 L of distilled water. The medium was poured on disposable petri dishes evenly and allowed to solidify at room temperature. The petri dishes were wrapped with parafilm and kept at 4 °C until needed.

2.2.2. Isolation and Purification

The isolation procedure was carried out at a mesophilic temperature (37 °C) by repeated cycles of picking a single bacterial colony and streaking it on the agar plate. At the end of each bacteria streaking cycle, the biohydrogen production ability was monitored in a serum bottle broth. Only the highest biohydrogen-producing serum bottle was chosen for the next cycle of streaking. The cycle was repeated until one single pure culture was isolated. The detailed isolation and purification procedures were elaborated as follows.
The primary inoculum source was supernatant (bacterial cells) containing 0.85% sodium chloride solution. Initially, 2 mL of inoculum were transferred to five 20 mL of sterile RCM broth (in serum bottles). The inoculated serum bottles were incubated at 37 °C and 150 rpm for 72 h. Every 24 h, the biogas was collected with a disposable gas syringe and the biohydrogen composition was determined using gas chromatography (GC). After 72 h, only the serum bottle with the highest biohydrogen gas volume was kept, while the other serum bottles were discarded. Using the spread plate technique, 100 µL broth from the highest biohydrogen-producing serum bottle was transferred to the RCM agar plate and evenly spread on the agar with a sterile glass hockey stick. The agar plate was incubated at 37 °C for 24 h.
An individual bacterial colony with a different morphology was picked from the RCM agar plate using a sterile wire loop and used to inoculate fresh RCM broth until the cell turbidity (OD600) reached 1.0 ± 0.1 before being observed under a light microscope (Nikon Instruments, Japan). The inoculum was then incubated at 37 °C for 72 h. The cycles of RCM broth inoculation and RCM agar spreading were repeated until only one biohydrogen-producing colony was isolated. Only the RCM broth with the highest biohydrogen volume (~40–50 mL with 30% purity) was kept in each cycle.

2.3. Bacterial Characterization

2.3.1. Gram Staining

A pure culture of biohydrogen-producing bacterial colony on RCM agar was picked up with a sterile inoculation wire loop and smeared on a clean glass slide. Distilled water was dropped on top and the bacteria were fixed on the glass slide by passing it at an angle over a Bunsen burner flame until the water dried out. A few drops of crystal violet were used as a primary stain over the bacterial smear on the glass slide. After 1 min, the glass slide was rinsed with sterile distilled water. The glass slide was then treated with iodine solution, which acts as a mordant. After one minute, the iodine solution was rinsed with sterile distilled water. The slide was then rinsed briefly with 95% alcohol before being immediately rinsed with sterile distilled water. Finally, the bacteria on the slides were stained with safranin and incubated for 1 min before being rinsed with distilled water again [19]. The slide was dried before viewing it under a light microscope under oil immersion (Nikon Instruments, Japan).

2.3.2. BIOLOG

Pure cultures of isolated biohydrogen-producing bacterium were grown on RCM agar before being streaked onto brain heart infusion agar (BHI) (BD, USA) and incubated at 35 °C. The carbon source utilization pattern was examined using two distinct BIOLOG microplates. The first microplate (BIOLOG Inc., USA) was specifically designed for anaerobic bacterium identification, while the second microplate (BIOLOG Inc., USA) was specifically designed for aerobic bacterium identification. After 18 h, a single colony was picked from BHI agar with a sterile disposable cotton swap and emulsified in Gen III Inoculating Fluid A (BIOLOG Inc., USA). Another single bacterial colony was selected and emulsified in AN Inoculating Fluid. The Inoculating Fluid A was then dispensed into a 96-welled Gen III microplate, with 100 µL of Inoculating Fluid A in each well. Likewise, 100 µL of AN Inoculating Fluid was poured into each well of a 96-welled AN microplate. Anaerobic conditions were used for the AN microplate, while normal atmospheric conditions were used for the GEN III microplate. Both microplates’ incubation temperatures were kept constant at 35 °C. Both microplates were analysed using a GEN III MicroPlate reader after 24 h of incubation.

2.3.3. 16S rRNA Sequencing

Pure isolated bacterium samples were grown in RCM broth for 18 h at 37 °C. The broth was then centrifuged for 90 s at 15000 g to separate the supernatant from the bacterial pellets. The pure culture bacterial pellet provided the deoxyribonucleic acid (DNA) for the polymerase chain reaction (PCR).
(a)
Deoxyribonucleic Acid (DNA) Extraction
The DNA from bacterial pellets was extracted using Geneaid™ DNA isolation kit (Geneaid™, Taiwan) following the manufacturer’s recommended procedure. Firstly, 300 µL cell lysis buffer was added to the bacterial pellet in a 1.5 mL microcentrifuge tube. The mixture was vortexed homogenously and incubated at 60 °C for 15 min. Following that, 100 µL protein removal buffer was added to lysate and vortexed immediately for 15 s before centrifuging it at 15,000× g for 8 min. The supernatant was transferred to a fresh 1.5 mL microcentrifuge tube while the pellet was discarded. The extracted DNA was precipitated by adding 300 µL of isopropanol and thereafter gently mixed. The mixture was centrifuged at 15,000× g for 5 min and the supernatant was discarded. The pellets were washed with 70% (w/w) ethanol and centrifuged it at 15,000× g for another 5 min. Finally, the DNA was rehydrated by adding 100 µL of DNA hydration buffer and incubated it at 60 °C for 45 min.
(b)
Polymerase Chain Reaction (PCR)
The extracted DNA was used as a template for DNA amplification by polymerase chain reaction (PCR) using PCR Master Mix (1st BASE, Singapore). This PCR Master Mix is a premixed PCR cocktail that contains Taq DNA polymerase (0.06 U/µL), 400µM of each dNTPs, and 3mM MgCl2 in reaction buffer. Additionally, 10 µM of forward primer 8F (5′-AGAGTTTGATCCTGGCTCAG-3′), and 10 µM of reverse primer 1492R (5′-GGTTACCTTGTTACGACTT-3′) were purchased from 1st Base Sdn. Bhd. The PCR was started by adding 25 µL of PCR Master Mix, 2.5 µL of each primer, 5 µL of DNA template, and 15 µL of nuclease-free water in a PCR tube. PCR cycle was performed with an initial denaturation at 95 °C for 2 min, followed by 30 cycles of 95 °C for 30 s, annealing gradient from 55 to 72 °C for 1 min, extension of 72 °C for 1 min and a final extension of 72 °C for 10 min [8]. The PCR product was kept at 4 °C until further use.
(c)
PCR Product Purification
The PCR product was then purified using Gel/PCR DNA Fragments Extraction Kit (Geneaid™, Taiwan). Accordingly, 50 µL of PCR product was transferred into fresh 1.5 mL microcentrifuge tube. Then, 250 µL DF buffer was added to the tube and homogenously mixed. The mixture was then pipetted into DF column and centrifuged at 15,000× g for 4 min. The filtrate was discarded and 600 µL of wash buffer was added to the DF column and centrifuged again at 15,000× g for 2 min. After discarding the filtrate, DF column was placed in fresh 1.5 mL microcentrifuge tube and 25 µL elution buffers was added to it. The DF column was allowed to stand for 5 min before being centrifuged at 15,000× g for 4 min, and thereafter the purified PCR product was collected.
(d)
Agarose Gel Electrophoresis
Agarose gel was prepared by heating 1.2 g agarose powder (1st Base, Singapore) in 80 mL Tris Borate EDTA buffer (TBE) (1st Base, Singapore). The agarose solution was then cooled down at room temperature, and 5 µL of ethidium bromide was added to the solution. The mixture was then poured onto a gel plate with suitable gel comb. After the gel hardened, the comb was removed, leaving a row of wells. The gel was immersed in TBE buffer in the electrophoresis chamber (Bio-Rad, USA). The DNA sample (3 µL) was mixed with loading dye (1 µL) and pipetted into the agarose gel wells. One of the wells was loaded with DNA ladder. The chamber was then closed, and the gel electrophoresis was carried out at 100 V for 1 h. Finally, the gel was visualized under UV light using a UV transilluminator (Major Science, USA).
(e)
16S rRNA Nucleotide Analysis
The complete sequencing result was obtained from 1st Base Sdn. Bhd. The sequence was then analyzed by using the Basic Local Alignment Search Tool (BLAST) provided by the National Centre for Biotechnology Information (NCBI) through its website (http://blast.ncbi.nlm.nih.gov/Blast.cgi, accessed on 16 March 2022). The information obtained through BLAST was then used to construct phylogenetic tree using the neighbor-joining method with MEGA version 6.0.6 software (Molecular Evolutionary Genetics Analysis. Version 6.0.6. Pennsylvania State University PA, USA) [20].

2.3.4. Field Emission Scanning Electron Microscopy (FESEM)

A single colony of bacterium on the RCM agar was cut out using a sterile scalpel, and thereafter was dehydrated using a critical point dryer (Leica EM CPD 300, Leica Microsystems, Germany). Initially, the bacterial sample was pretreated with a series of increasing concentrations of ethanol i.e., 30%, 50%, 70%, 80%, 90%, and finally 100% (w/w) ethanol before being dehydrated for 90 min using a critical point dryer. Dehydrated bacterial samples were gold sputter-coated using an automatic RS sputter coater (Model Q150, Quorum Technologies, UK). Finally, using field emission scanning electron microscopy (FESEM), the bacterial sample was visualized (Supra 55 VP, Carl Zeiss, Germany).

2.4. Biohydrogen Fermentability Test in Serum Bottles

The isolated biohydrogen-producing bacterium was then used to test its fermentability in four different fermentation media with varying carbon sources. The four fermentation substrates were AFEX-pretreated OPEFB enzymatic hydrolysate, DAA-pretreated OPEFB molasses, synthetic defined media with glucose and xylose with 2:1 ratio and RCM without any modification. Accordingly, DAA OPEFB molasses is valuable to emulate the possible worst-case scenario for any OPEFB-pretreated samples due to a significant amount of dissolved furfural and serves as an opportunity to observe the abilities of locally isolated Enterobacter sp. KBH 6958 to grow in slightly unfavorable conditions. On the other hand, the initial total carbohydrate (TC) for other media was adjusted to 7 g/L and supplemented with 50 mM phosphate buffer, 3 g/L yeast extract, 3 g/L NaHCO3 and 0.5 g/L L-cysteine-HCl. Fermentability test was carried out in 50 mL serum bottles with 25 mL of working volume. The initial pH for both AFEX-pretreated hydrolysate and synthetic media was adjusted to 7.0 while the initial pH of DAA-pretreated OPEFB molasses was 9.0. The difference in initial pH is due to the furfural content in OPEFB molasses, which must be minimized to reduce the inhibition effect and a detailed explanation was described in previous work [13]. Next, nitrogen gas was sparged through the media for 5 min to create anaerobiosis for the fermentation. The isolated biohydrogen-producing bacterium was initially grown in RCM broth until the OD reached 1.0 ± 0.1 before inoculation. Each bottle containing medium was inoculated with 10% (v/v) inoculum. Bottles were capped, clamped, and incubated for 72 h at 37 °C and 150 rpm. The biogas produced was sampled using disposable syringes and its composition was analyzed using GC.
The metabolites in fermented broths from fermentability test were then analyzed using gas chromatography mass spectrophotometry (GCMS). The GCMS system (Bruker Scion SQ, USA) was equipped with 30 m Stabilwax® column (Restek®, USA) (0.25 mm ID, 0.25 µm df). The injection port temperature of GCMS was fixed at 200 °C and the initial oven temperature was maintained at 70 °C for 5 min, then raised to 180 °C at 6 °C/min and held for 5 min before ramped (10 °C/min) again to 195 °C and maintained for another 5 min. About 1 µL of filtered fermentation broth was used in each analysis.

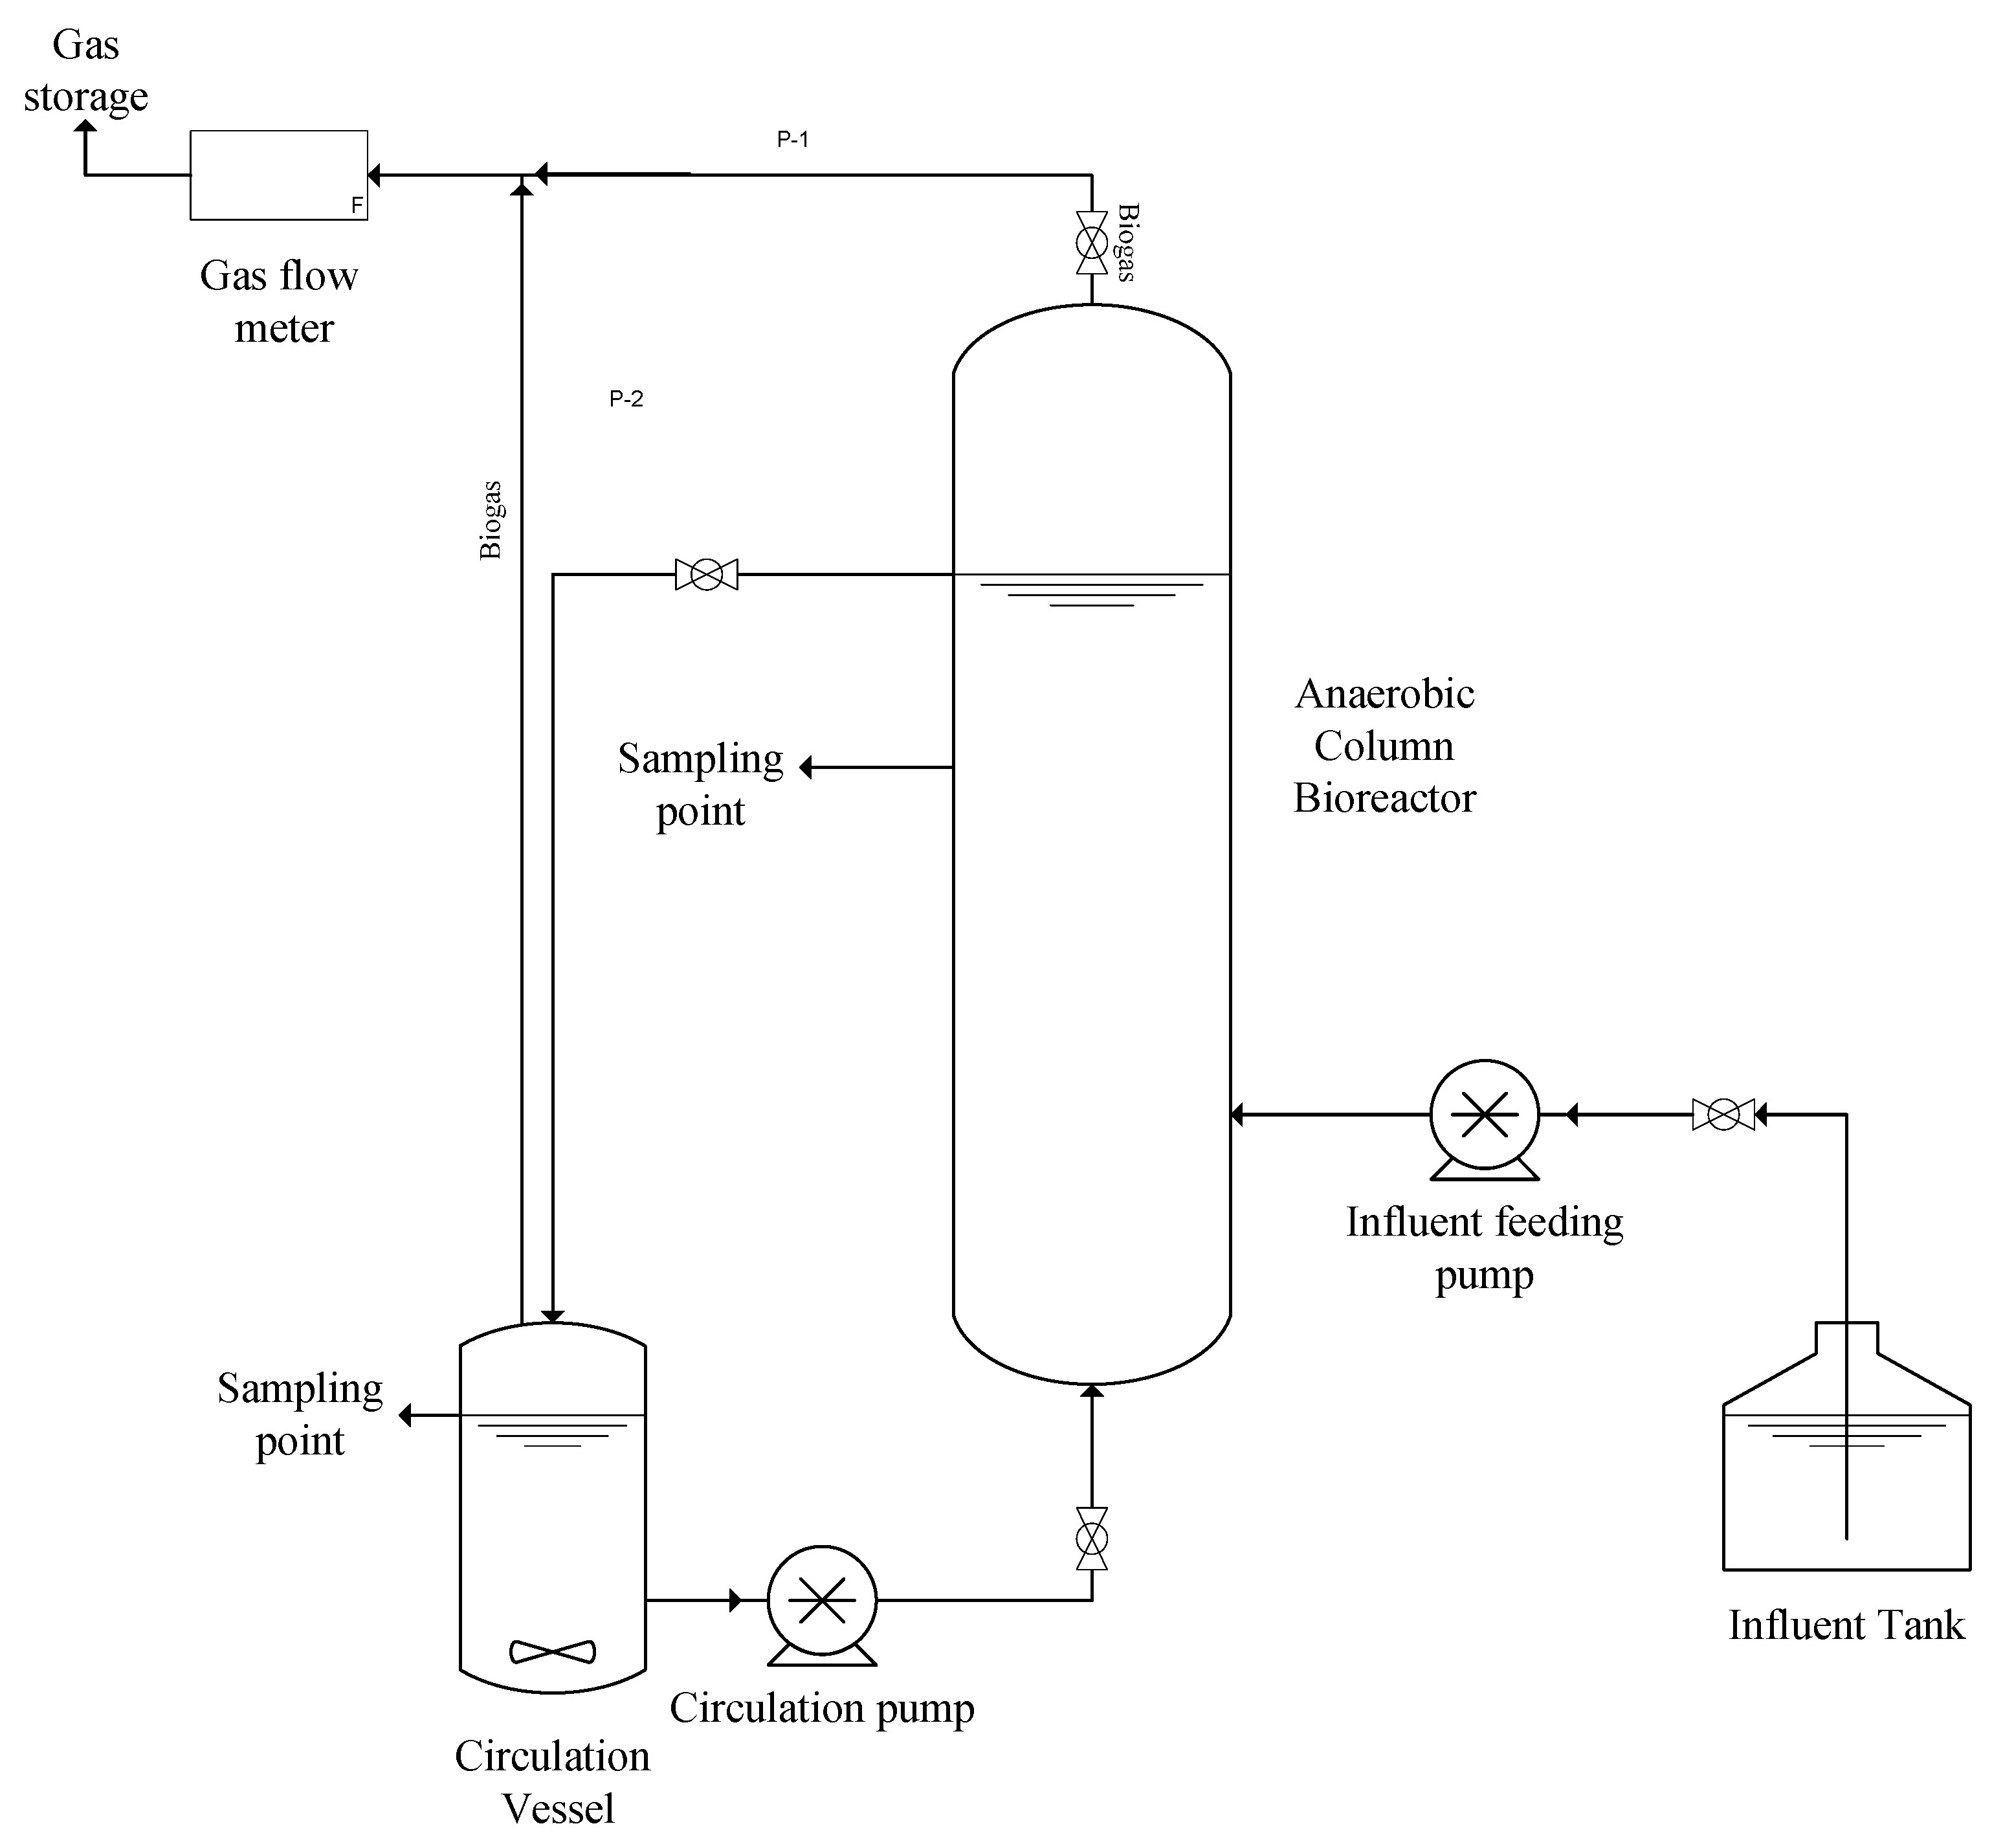
2.5. Biohydrogen Fermentation in 1.5 L Anaerobic Column Bioreactor (ACBR)

Two separate biohydrogen fermentation tests were carried out in a 1.5 L anaerobic column bioreactor (ACBR) as shown in Figure 1. A main bioreactor column was connected to a smaller circulation vessel equipped with magnetic stirrer. The main bioreactor column was double jacketed and the temperature was maintained at 37 °C. The medium spilled over from the main vessel into the circulation vessel. Using a peristaltic pump (Longer Pump, China), the medium was continuously circulated back to the main column at 10 mL/min. Milligascounter™ was used to quantify the biogas collected from both the main bioreactor column and the circulation vessel (Ritter, Germany).
The first batch biohydrogen fermentation test was carried out using AFEX OPEFB hydrolysate, while the second batch was conducted with DAA molasses as the carbon source. The initial total carbohydrates (TC) in both fermentations were fixed at 7.0 g/L using distilled water. Additional nutrients for bacterial growth consisting of K2HPO4.3H2O (1.5 g/L), KH2PO4 (0.75 g/L), NaHCO3 (3 g/L), L-cysteine-HCl (0.5 g/L), and yeast extract (3 g/L) were added in both tested carbon sources. The final pH of the fermentation media was adjusted to 7.0 for AFEX OPEFB hydrolysate, and initial pH of 9.0 was used in DAA molasses. Locally isolated bacterium, Enterobacter sp. KBH 6958, was cultivated in RCM until the OD reached 1.0 ± 0.1 before inoculation. About 150 mL of inoculum (Enterobacter sp. KBH 6958) was added into 1.35 L substrate (10% v/v inoculation), bringing the total fermentation volume to 1.5 L. For 10 min, nitrogen gas was sparged through the media to induce anaerobiosis in the culture. The biogas volume produced was measured using MilligascounterTM (Ritter, Germany), and the biogas composition was analyzed using GC. The metabolites were quantified using HPLC, and the total carbohydrate was colorimetrically determined using the phenol-sulphuric method [21].

3. Results and Discussion

3.1. Bacterial Characterization

3.1.1. Gram Staining

One final colony of biohydrogen-producing bacterium was isolated from UKM’s lake soil sample after several batches of repeated sub-culturing and isolation. The bacterium was first identified as KBH 6958. The isolate was facultatively anaerobic, so it could grow on RCM agar in normal atmospheric conditions [8]. However, biohydrogen production was only observed in anaerobic conditions, wherein the bacterial colony on RCM agar was mildly yellow, non-spore-forming, and mucoid after prolonged growth on the agar plate. A negative Gram-stained isolate KBH 6958 under 10X magnification using light microscope was observed (Figure S1). The isolate KBH 6958 appeared to be somewhat rod shaped and pink after Gram staining due to the counter stain safranin, and it was deduced that the isolate is a Gram-negative bacterium [8,22]. The bacterium did not retain the primary crystal violet color (purple) after the ethanol washing. Gram-negative bacterium typically has a thinner peptidoglycan layer on its cell wall [22].

3.1.2. BIOLOG

BIOLOG microplate system can be applied as one of bacteria identification tool, as well as to screen carbon source utilization pattern. BIOLOG exploits the principle of substrate utilization by coupling metabolic activity to a simultaneous reduction of a redox dye. The reduction of redox dye was measured colorimetrically within a 96 welled microplate. The substrate utilization spectrum was then compared with internal database for possible identification [23]. In this study, two distinctive BIOLOG microplates were used. Gen III microplate is designed to identify pure culture of aerobic Gram-negative and Gram-positive bacteria. Each Gen III microplate contains 23 wells of chemical sensitivity assays, 71 wells of carbon source utilization assays and 2 wells of control assays. AN microplate is designed for identification of a very wide range of anaerobic bacteria. Each AN microplate contained 95 discrete carbon source utilization assays and one well with water as negative control. The isolate reacted with each assay in order to provide metabolic and phenotypic fingerprint patterns of the microorganism in order to identify it at the species level.
However, due to system database limitations, some of the atypical isolates were not identified at the species level using this method, i.e., the system will not identify bacterial species that are not classified in the database. As a result, isolate KBH 6958, a new strain, was not identified directly from both Gen III and AN microplates. Based on the existing database, the closest bacterial similarities with KBH 6958 found from Gen III microplate and the AN microplate patterns were Enterobacter aerogenes and Clostridium aminovalericum, respectively. Isolate KBH 6958 definitely did not belong to genus Clostridirium, as the Clostridium was spore-forming, Gram-positive, and strictly anaerobic bacterium [10], whereas isolate KBH 6958 did not form spores, is Gram-negative and can grow in aerobic or facultative anaerobic conditions.
Nonetheless, this method was useful for rapid screening of a large amount of substrate for bacterial growth. Table 1 outlines the carbon source utilization pattern of isolate KBH 6958. The information is presented as a positive threshold value (0–100%), with a higher value indicating a more favorable carbon source for bacterial growth. This result can also be used to investigate the effects of different substrate structures and functional groups on its suitability as a carbon source for isolate KBH 6958.
Carbon sources on both microplates can be classified into six groups based on their functional group. The six groups were amine/amide, amino acid, carbohydrate, carboxylic acid, polymers, and other miscellaneous carbon sources. The substrate utilization patterns appeared random at first glance, with no discernible correlations with the respective substrate groups. The level of carbon utilization was determined by the individual substrate rather than the group type.
In general, common monosaccharides such as α-D-glucose, α-D-fructose, α-D-galactose, and α-D-lactose were very favorable to this isolate in both aerobic and anaerobic conditions (utilisation level nearly 100%). However, some carbon sources, such as α-ketobutyric acid and α-hydroxybutyric acid, were unable to sustain KBH 6958 growth because they were not utilised (the utilisation level was nearly 0%) in both plates.
These results also highlighted the difference of metabolism in aerobic and anaerobic conditions. In most of the carbon sources found in both Gen III and AN microplates, the availability of oxygen positively affects the level of substrate utilization. Both glycerol and formic acid were favourable in aerobic condition but not in anaerobic; hence, highlighting the significance of oxygen as an electron acceptor in determining the microbial metabolic pathway.
The effects of sugar methylation were also found to manipulate the level of carbon source uptake. Unlike α-D-glucose, 3-methyl-D-glucose was not favoured by isolate KBH 6958. Similarly, utilization of other methylated sugars such as β-methyl-D-galactose was significantly lower than its corresponding un-methylated structures.
Moreover, substance chirality plays an important role in determining the substrate for microbial growth as most of the enzymes in the system are substrate-specific [24]. The effects of substrate chirality can be observed in utilization of malic acid (AN microplate) and serine (Gen III microplate). In both cases, the substrate utilizations of L-structures (L-malic acid and L-serine) were significantly higher than its D-structures (D-malic acid and D-serine).
Carbon sources which were known to be intermediate during biohydrogen-producing bacterial metabolic pathway, tend to be utilized completely (almost 100% utilization). Glucose-6-phosphate and pyruvic acid were two important intermediate metabolites involved in Embden-Meyerhof pathway [25]. While citric, L-malic, succinic, and fumaric acids were essential intermediate metabolites during Krebs cycle [26]. Accordingly, KBH 6958 used 100% of the carbon sources thymidine and uridine because they were both standard nucleosides that make up nucleic acids. Acetic acid, formic acid, and propionic acid were common end metabolites found in anaerobic, dark biohydrogen fermentation, which explained why these carbon sources had lower carbon utilization levels [27,28].

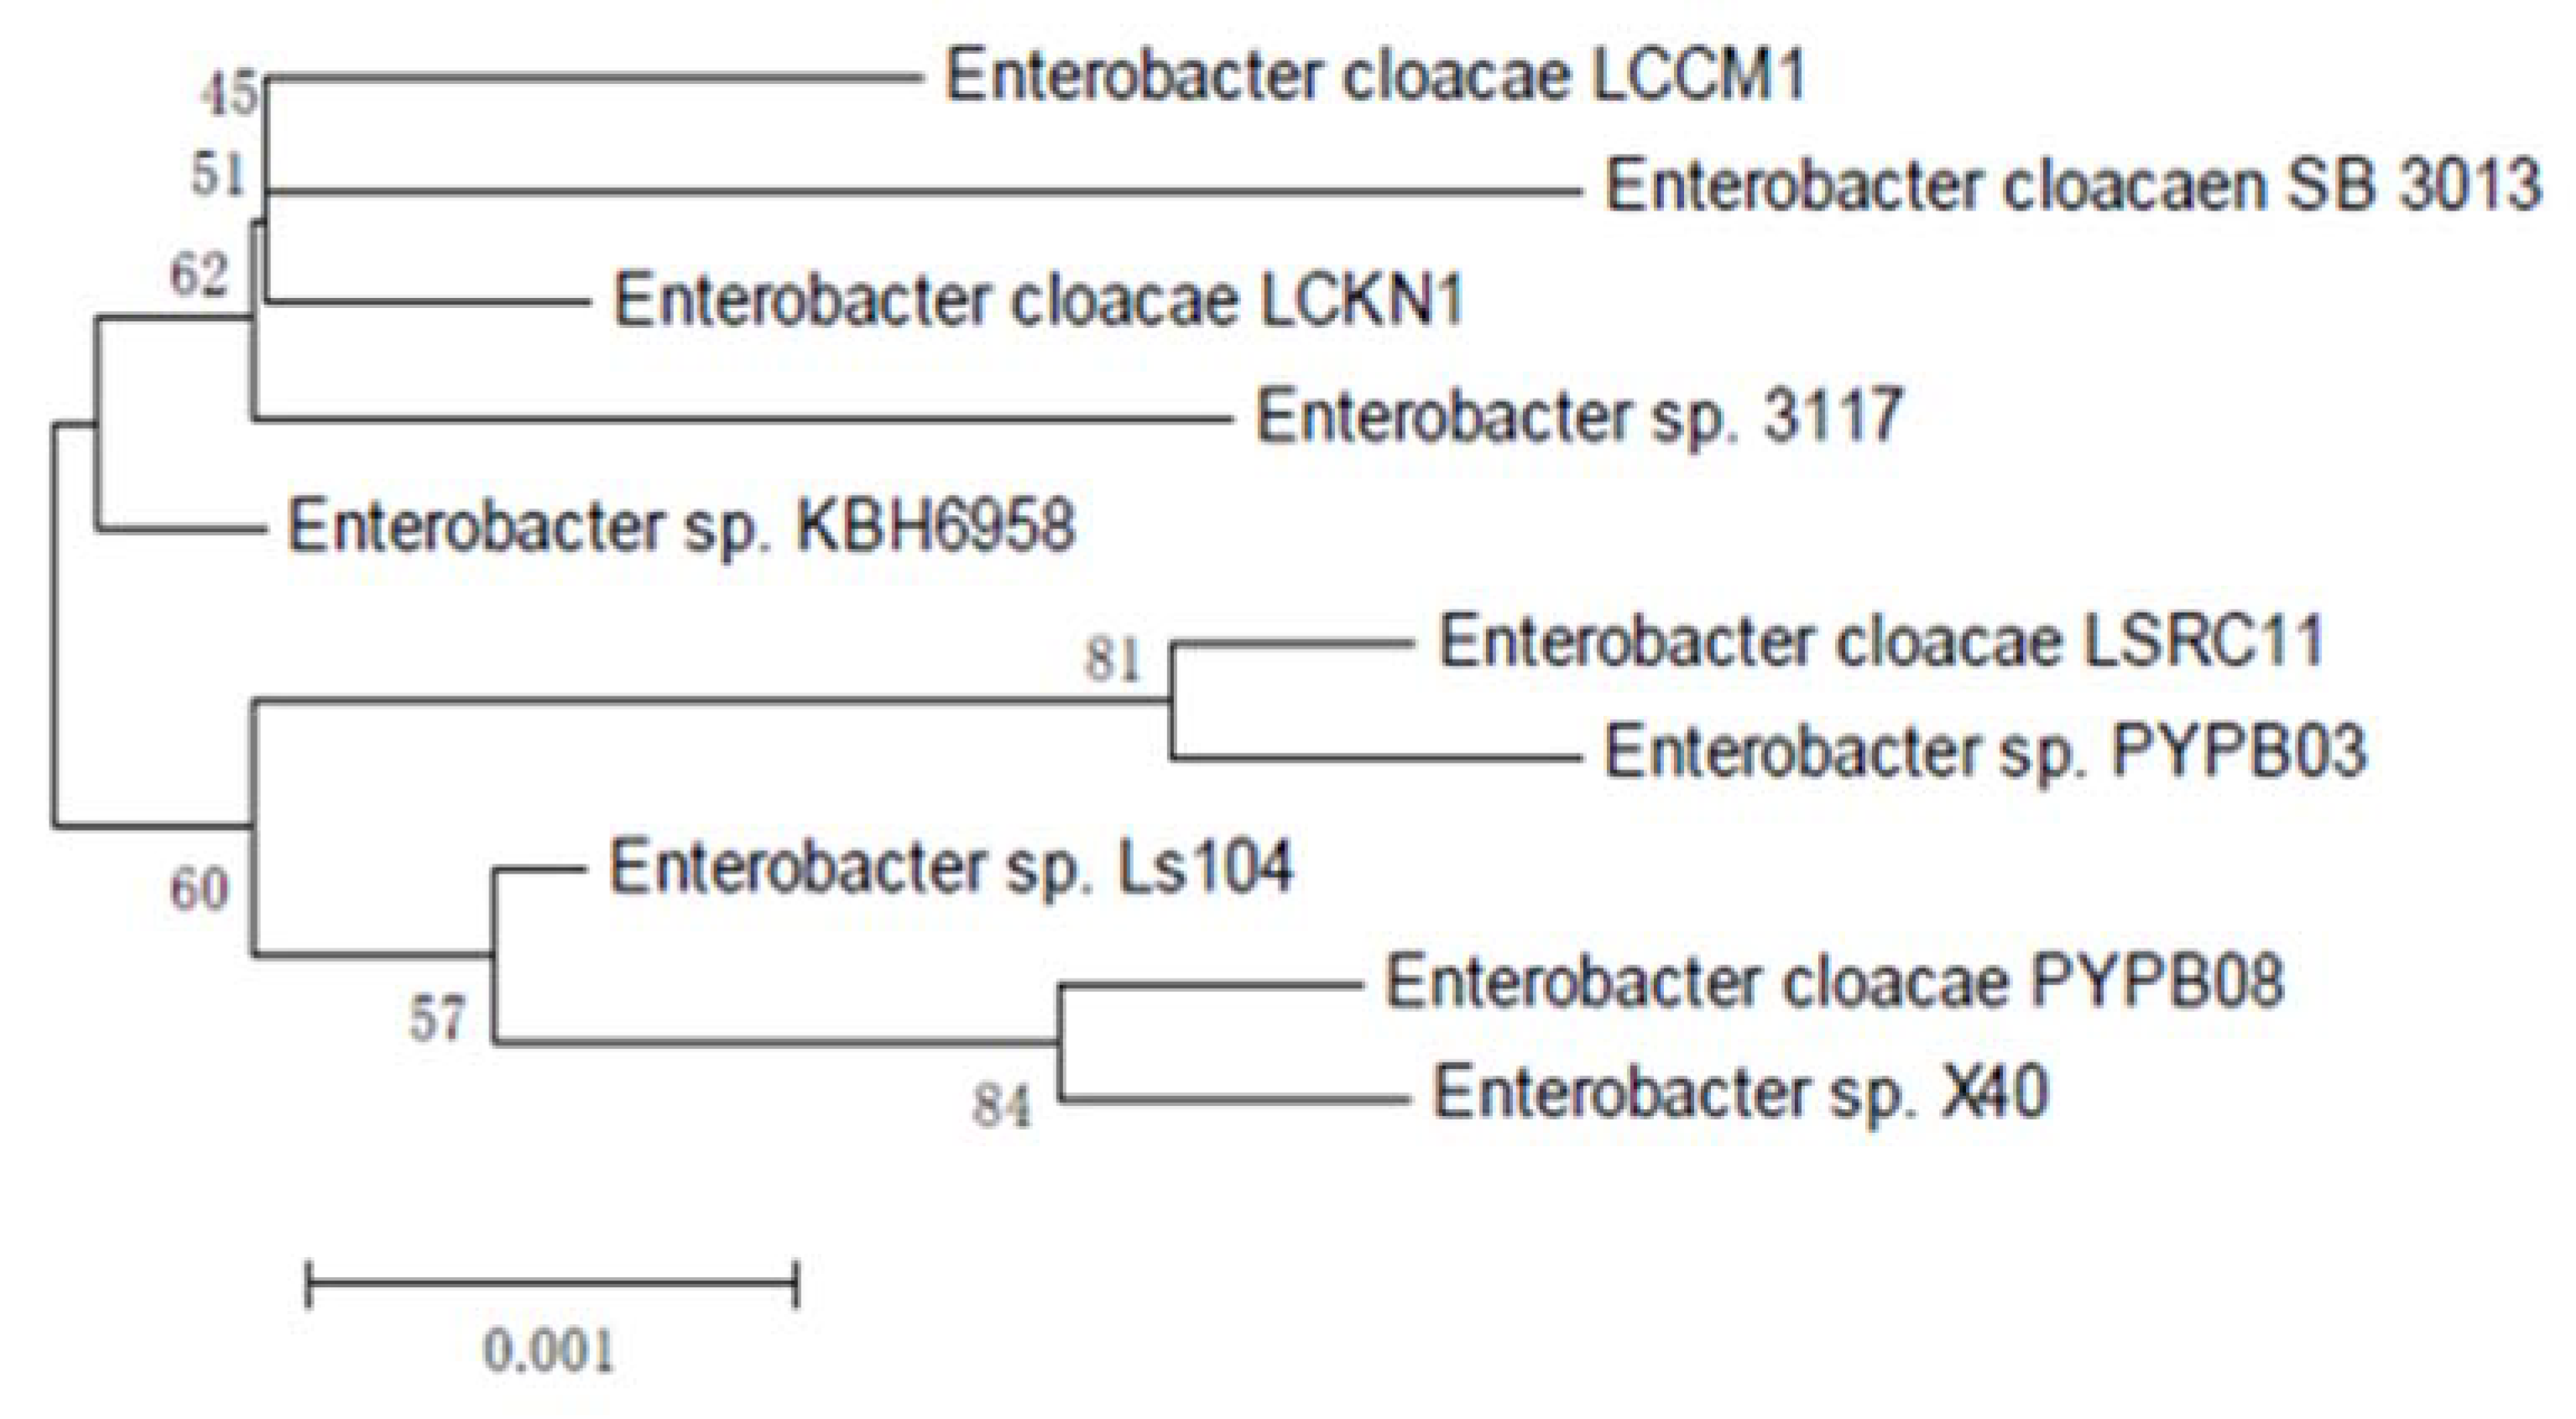
3.1.3. 16S rRNA Sequencing

16S rRNA bacterial identification is deemed a superior method for bacterial identification at the genus level as compared to other phenotype- and metabolic-based methods [23]. However, there have been reports of misidentification of bacteria at the species level [23]. The BLAST search against the GenBank database demonstrated that KBH 6958 isolate belongs to the order Enterobacteriales and the genus Enterobacter. Alignment of 16S rRNA gene sequence (1499 bp) of this isolate with existing reference sequences from GenBank database, demonstrated maximum homology of 99% with Enterobacter sp. 3117. Based on the multiple alignment results and phylogenetic tree shown in Figure 2, KBH 6958 isolate was identified as Enterobacter sp. KBH 6958. 16S rRNA gene sequence of Enterobacter sp. KBH 6958 was submitted in NCBI database under the accession number KM657475 (https://www.ncbi.nlm.nih.gov/nuccore/KM657475.1/, accessed on 23 December 2022).

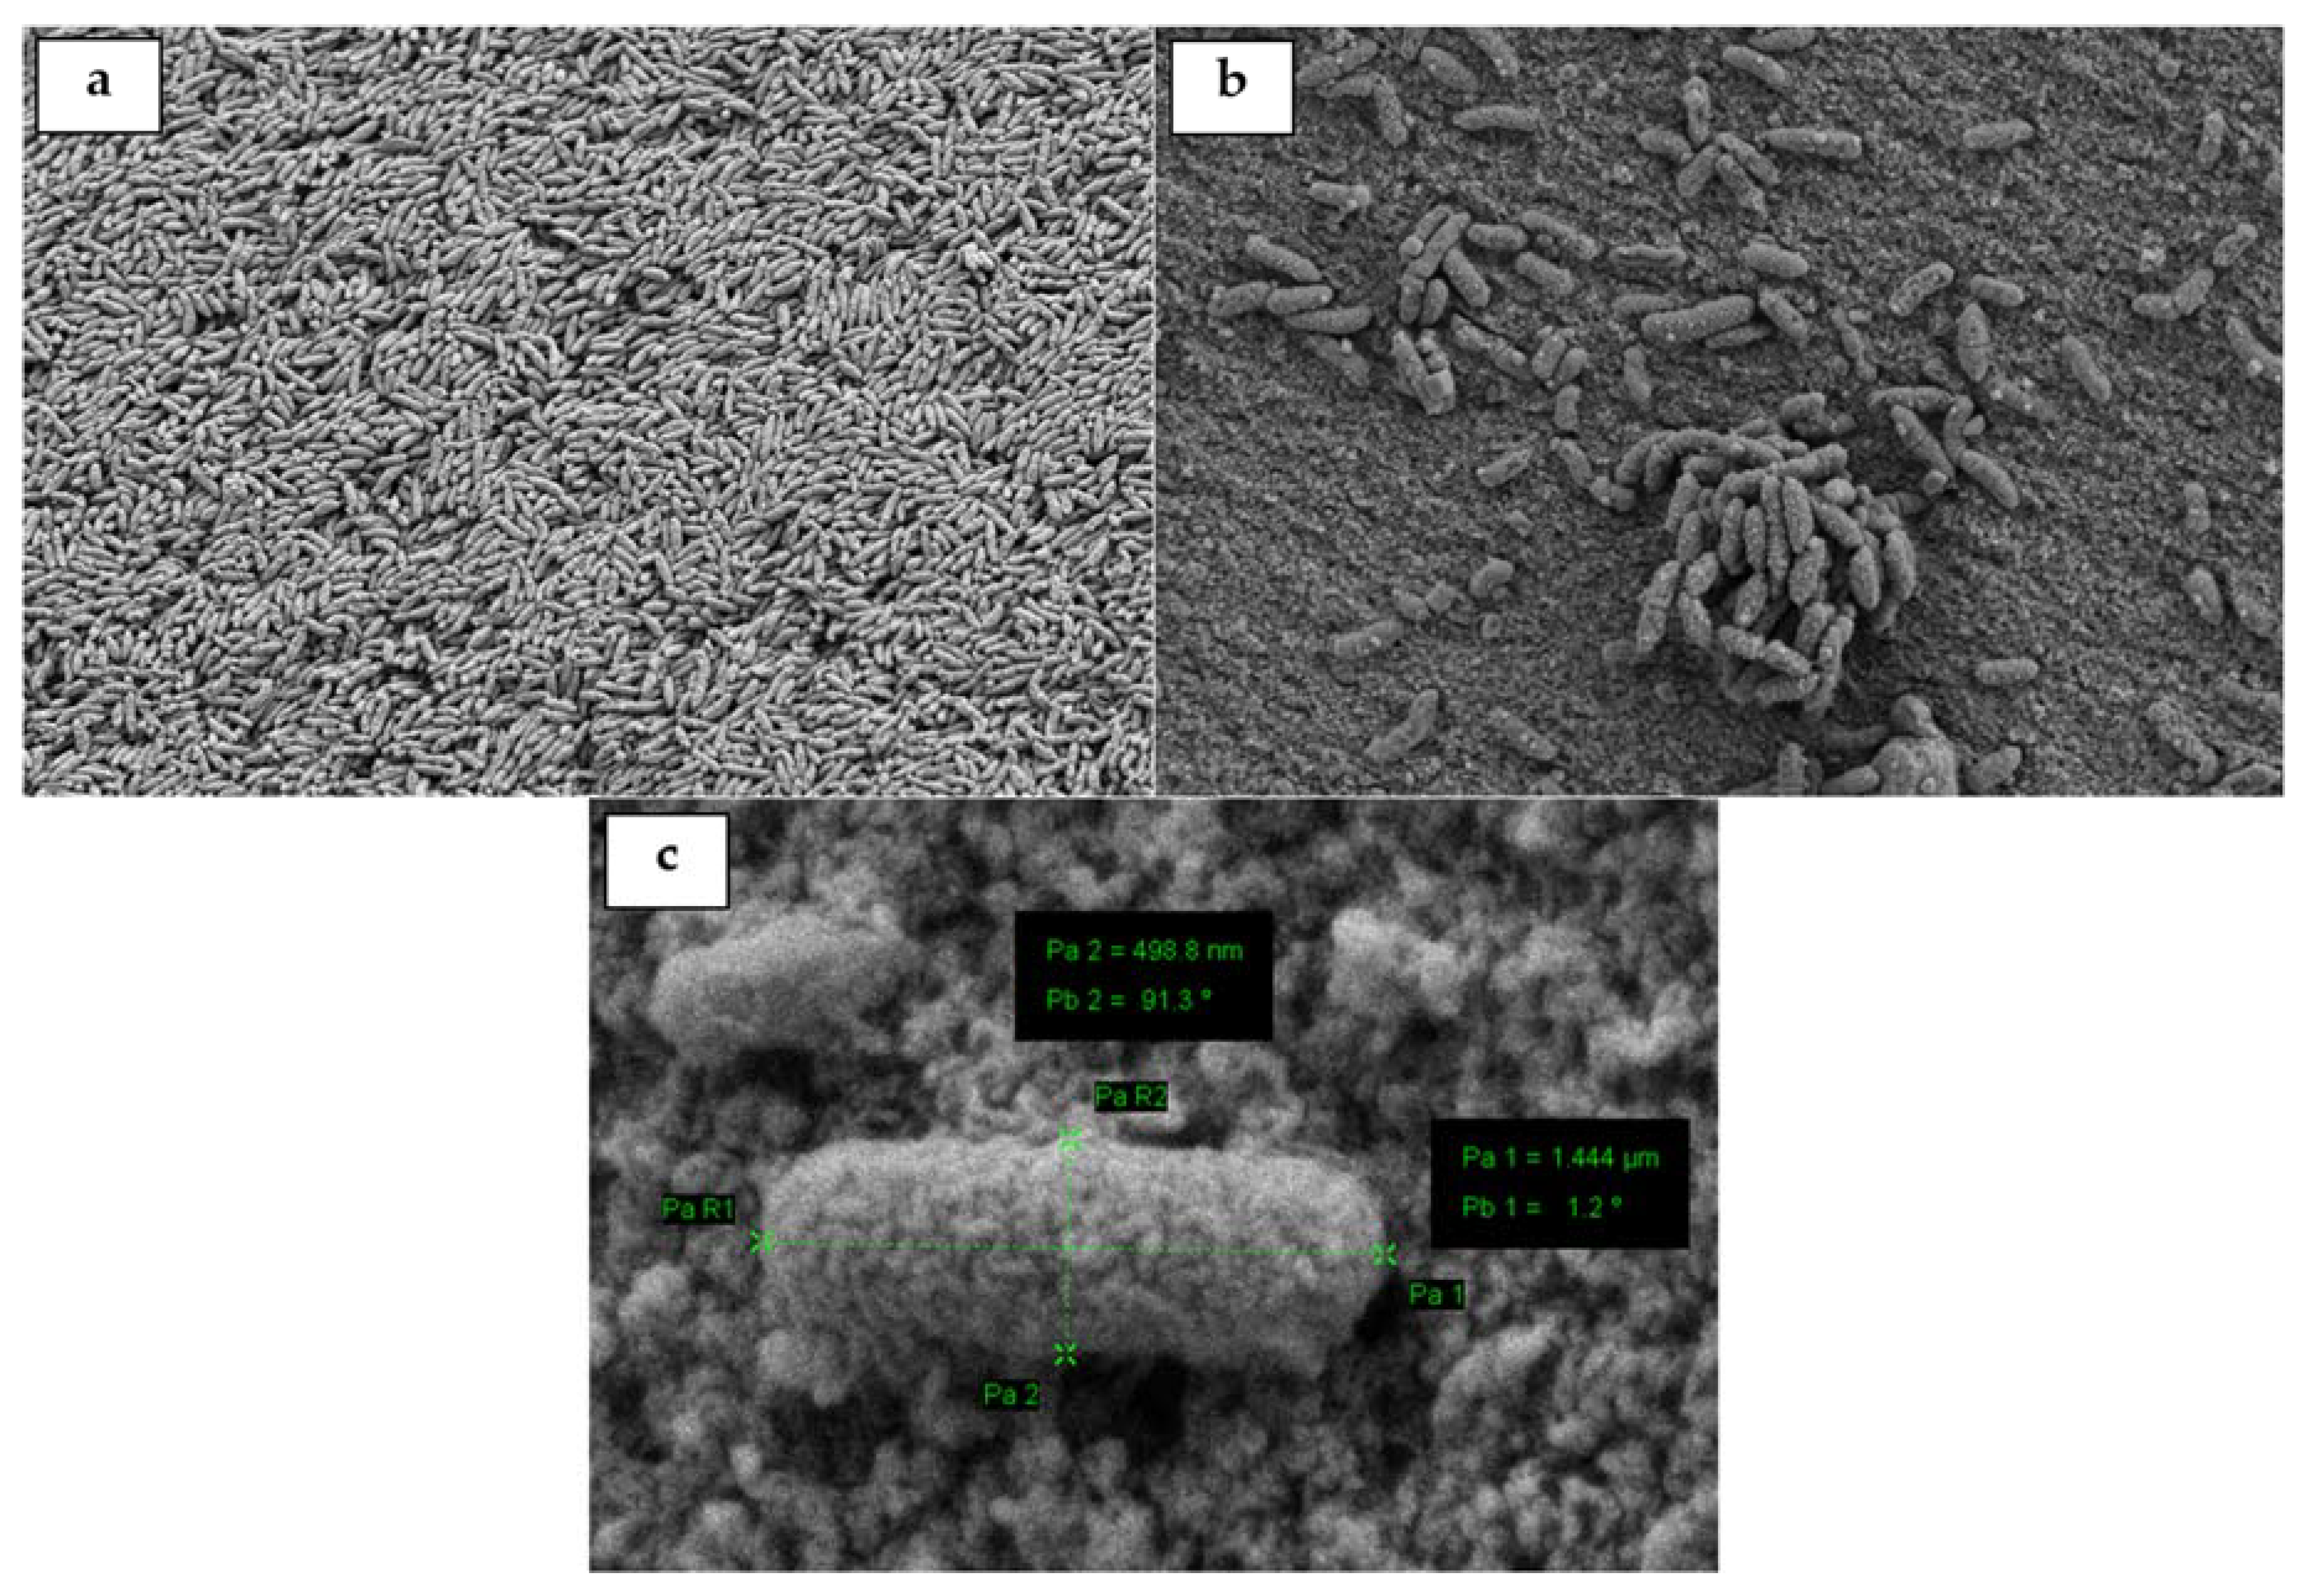
3.1.4. Field Emission Scanning Electron Microscopy (FESEM)

Figure 3 shows the micrograph of isolate Enterobacter sp. KBH 6958 under various magnifications. As with the observation under a light microscope, the cells visualized under FESEM were short-rod-shaped. The bacterium measured 1–2 µm in length and ~0.5 µm in width (Figure 3c), which was found to be comparable to other Enteric bacteria [29]. Under 5000× magnification (Figure 3b), the cells were observed to be interconnected through nano-linkages. Anaerobic biohydrogen fermentation bacteria were known to secrete extracellular polymeric substances interconnecting bacteria within the colony [1]. These nano-linkages appeared to be sticky, which could be the possible explanation of mucoid colonies after prolonged growth on agar plate. The stickiness of these nano-linkages potentially promotes bacterial aggregation and enhances biofilm formation [1,30].

3.2. Metabolite Analysis

Isolated Enterobacter sp. KBH 6958 was then used as inoculum for biohydrogen production using four different fermentation media. Dark anaerobic biohydrogen fermentation is usually accompanied by the production of organic acids [27,28]. The type of organic acids accumulated is highly dependent on biohydrogen-producing strains and their biochemical pathways. Two major biohydrogen-producing biochemical pathways are pyruvate:ferredoxin oxidoreductase (PFOR) pathway and the pyruvate formate lyase (PFL) pathway. The major acids accumulated through the PFOR pathway are acetic acid and/or butyric acid, whereas formic acid is produced through PFL pathway [9].
While almost all biohydrogen-producing Clostridia accumulate acetic and/or butyric acid as end products, the literature reports on final organic acids accumulated in Enterobacter were not unanimous. Researchers has reported that formate-hydrogen lyase enzymes found in Enteric bacteria catalyzed the biohydrogen evolution through PFL pathway [9]. Irina et al. reported that biohydrogen fermentation using Enterobacter cloacae KBH3 isolated from termites’ gut accumulated both formic and lactic acid as the final metabolites [8]. There are an equal number of published reports citing Enteric bacteria, such as Enterobacter cloacae IIT-BT 08 and Enterobacter aerogenes, that produce butyric acid, acetic acid and ethanol as their main fermentative products, which has similar traits as Clostridia [10,31,32]. In order to understand the metabolic pathway of this isolate, Enterobacter sp. KBH 6958, the fermented medium was analyzed qualitatively using GCMS. The final metabolites detected in all substrate media are summarized in Table 2.
At the end of fermentability test, the highest biohydrogen potential of 50.6 mmol/L was observed when AFEX-pretreated OPEFB hydrolysate was used, whereas, the lowest biohydrogen potential of 35.3 mmol/L was observed with DAA molasses. Lower biohydrogen potential from DAA OPEFB molasses was expected due to the furfural content, which was not found in other fermentation media. Furthermore, the sugars in DAA molasses were mostly xylose-based oligosaccharides, whereas other media were rich in monosaccharides (glucose). Alternatively, AFEX-pretreated hydrolysate contained almost no inhibitors coupled with other nutrients originating from OPEFB structures.
Through the GCMS results, it was clearly demonstrated that isolate Enterobacter sp. KBH 6958 produced biohydrogen through PFOR pathway. This conclusion was made because neither formic acid nor lactic acid was detected in any of the four different fermentation media, which is in agreement with previous studies [33,34]. Acetic acid, butyric acid and ethanol were detected in all the fermented samples.
Moreover, propionic acid was observed in both RCM and DAA OPEFB molasses medium indicating higher fermentation stress, possibly due to the higher biohydrogen and NADH evolution rates [35]. In these two media, isolate Enterobacter sp. KBH 6958 produced 2, 3-butanediol. The production of 2, 3-butanediol resulted in lower biohydrogen potential, as demonstrated by Ito et al. [31]. Acetamide was discovered in the AFEX-fermented OPEFB hydrolysate. The residual ammonia in the AFEX-treated OPEFB may react with acetic acid to form acetamide. Similarly, the presence of furan compounds in DAA molasses as a result of sugar degradation during the OPEFB pretreatment resulted in the detection of 2-furan methanol compounds.

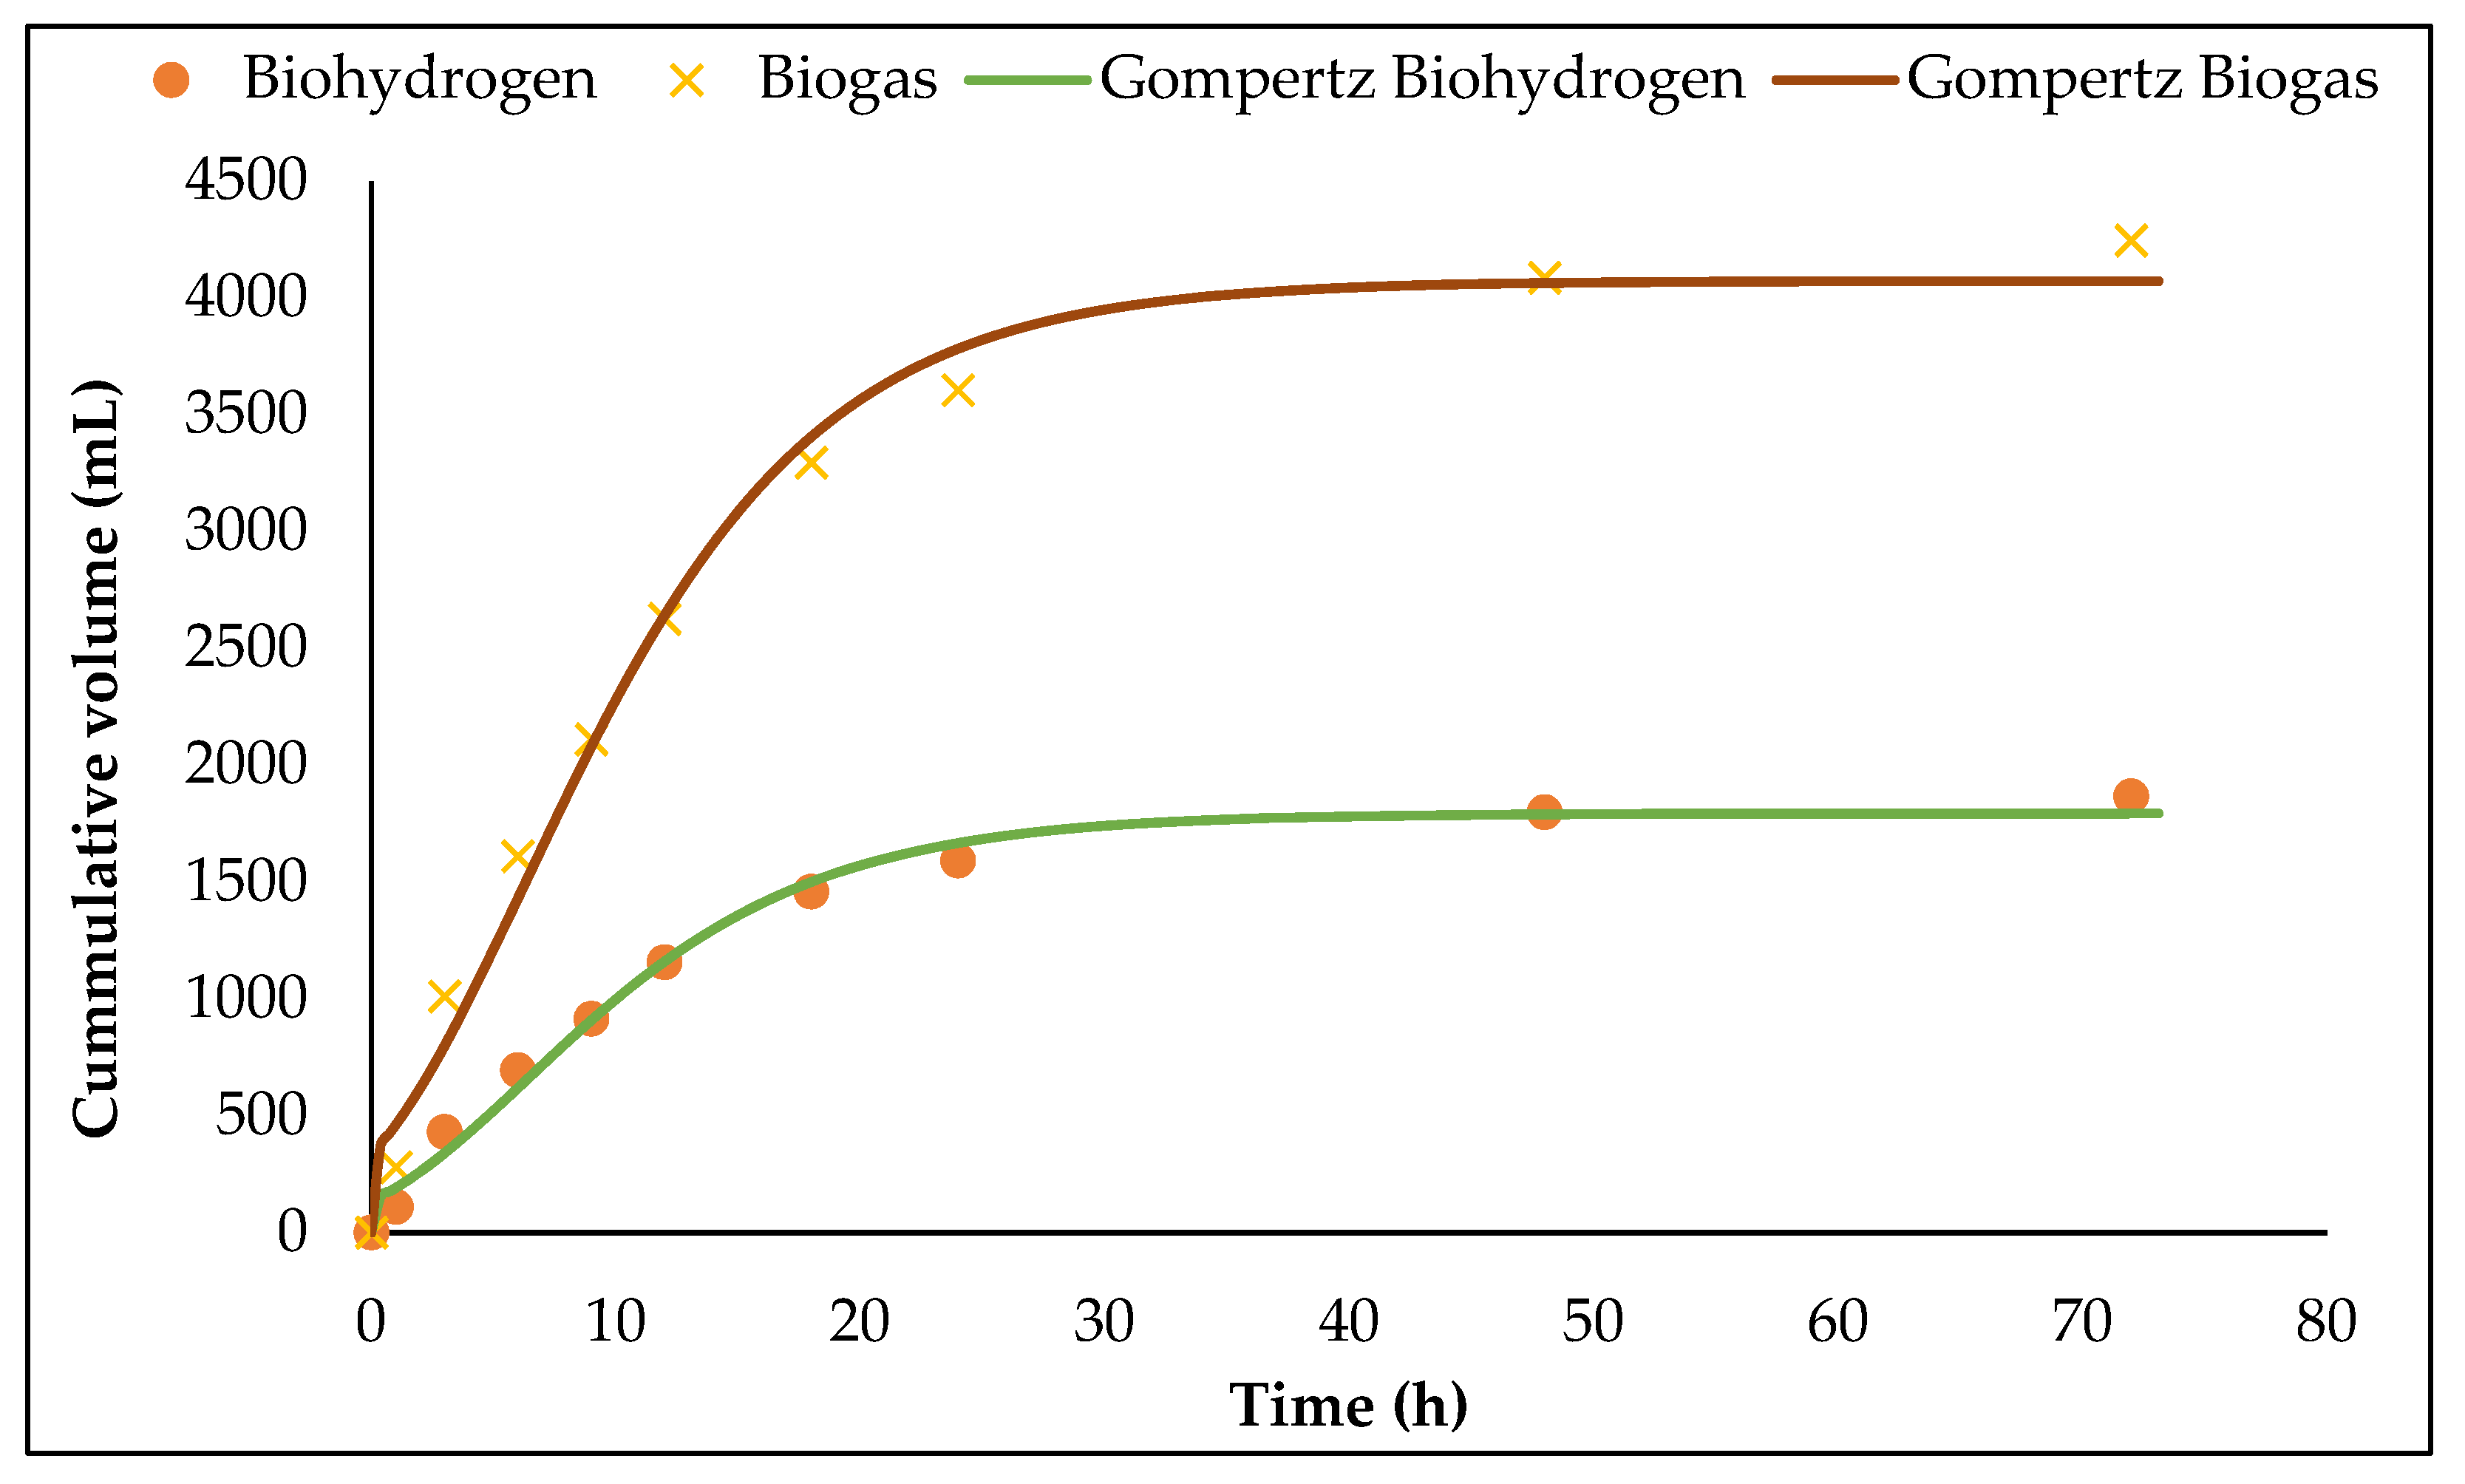
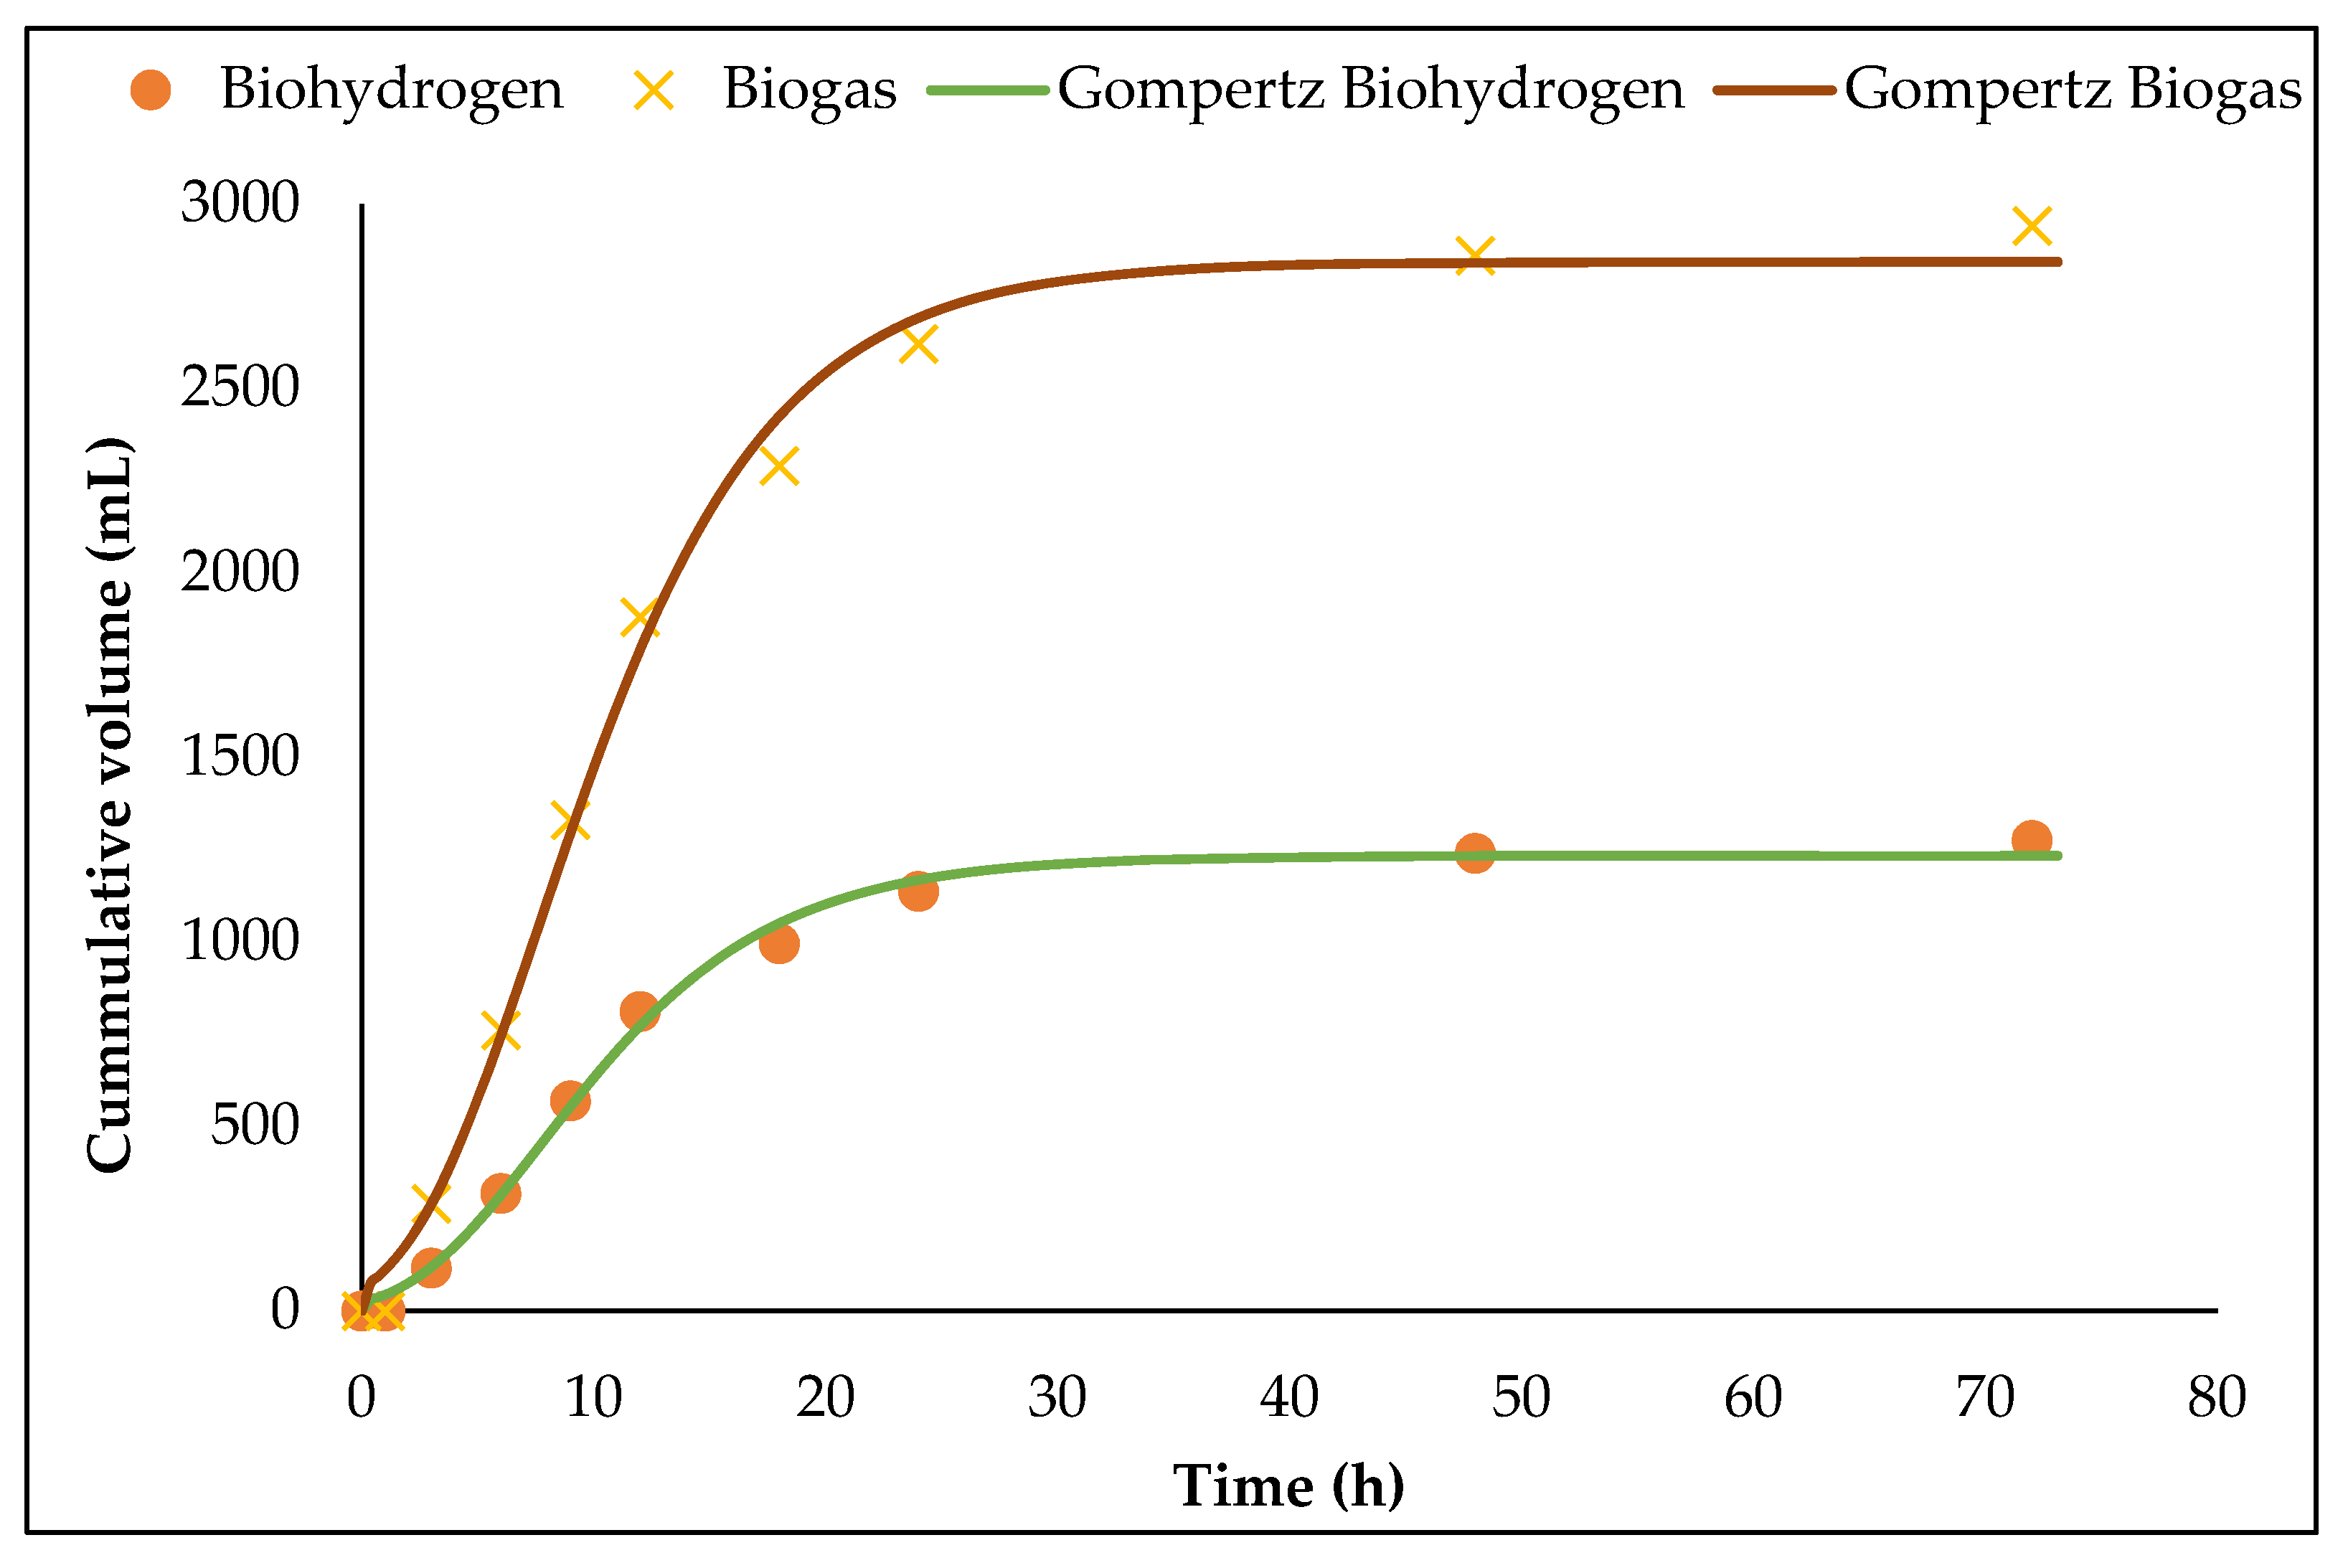
3.3. Biohydrogen Fermentation in 1.5 L ACBR

In order to further assess the performance and ability of isolated Enterobacter sp. KBH 6958 as biohydrogen producer, the strain was used to ferment two different OPEFB-based carbon sources. The first carbon source used was AFEX OPEFB enzymatic hydrolysate and the second carbon source used was DAA OPEFB molasses. AFEX OPEFB hydrolysate was the enzymatic hydrolysate resulting from AFEX pretreatment, whereas DAA OPEFB molasses was the liquid discarded during the pretreatment of OPEFB using dilute acetic acid. Due to the difference of lignocellulosic pretreatment mechanism, the sugar composition of AFEX OPEFB hydrolysate greatly differs from DAA OPEFB molasses. The sugar composition and other soluble compounds found in both media after adjusting initial substrate concentration and pH prior to the batch fermentations in 1.5 L ACBR are summarized in Table 3.
The final pH recorded after 72 h of fermentation with AFEX OPEFB hydrolysate was 4.67 ± 0.2. The AFEX OPEFB hydrolysate contained approximately 84.3% sugar, resulting in a final monosaccharide concentration of 0.55 g/L and 0.39 g/L of glucose and xylose, respectively. The biogas samples were collected at predetermined times, and the biohydrogen content in all samples ranged between 40 and 45%. The biogas and biohydrogen gas production profiles were fitted in the Gompertz model, which is widely used to study biogas and biohydrogen production from a variety of substrates due to its excellent ability to provide a good fit to model biohydrogen production during fermentation (R2 ≥ 0.96) [36]. The lag phase profile, biohydrogen production potential, and maximum production rate can be determined empirically to fit well with experimentally measured biohydrogen evolution data. As illustrated in Figure 4, the biogas production was observed within the first few hours of fermentation, indicating a very short lag phase in product formation. The AFEX OPEFB hydrolysate afforded a total of 1866 ± 50 mL (50.9 mmol/L) biohydrogen gas at the end of fermentation. The maximum biohydrogen productivity (Rmax) was estimated to be 98.1 mL H2/h (4.01 mmol H2/L/h), with a very short lag phase time of 32 min. The biohydrogen yield was 1.55 mol of H2/mol sugar, with the final concentrations of major metabolites amounting to 10.6, 11.8, and 4.56 mmol/L of butyric acid, acetic acid, and ethanol, respectively, while no propionic acid accumulation was evident in the current investigation. The butyric-to-acetic acid ratio (B/A) in this study was 0.89, as is likewise reflected in the form of higher acetic acid compared to butyric acid formation.
After 72 h of biohydrogen fermentation with DAA molasses, a total of 2940 ± 50 mL biogas was produced, while the total cumulative biohydrogen gas produced was 1275 ± 50 mL. It was also observed that the pH fell from 9.10 to 5.1 ± 0.2, and approximately 73% of the total sugar was depleted. While the initial pH was observed to be around 9, biohydrogen production only began to accelerate when the pH fell to around 6.6 ± 0.3, which coincides to those reported optimum pH for Enterobacter sp. [8,31,32]. The time-course profile of biohydrogen production was fitted to the Gompertz model and is depicted in Figure 5. Based on the Gompertz computation, the maximum biohydrogen production rate, Rmax, was 81.1 mL H2/h (3.07 mmol H2/L/h), the lag time was 2.14 h, and the biohydrogen yield was 1.19 mol H2/mol sugar.
The soluble metabolite products (SMP) found at the end of batch fermentation with DAA OPEFB molasses were butyric acid, acetic acid, and ethanol with concentrations of 8.64, 6.01, and 8.04 mmol/L, respectively. The butyric acid-to-acetic acid ratio (B/A) was 1.44, indicating that butyrate-type acidogenesis is the predominant pathway in this fermentation. Higher B/A ratio, lower biohydrogen yield, and the presence of ethanol and propionic acid (2.43 mmol/L) in the fermentation broth suggested that the potential of hydrogen production from OPEFB molasses has yet to be fully realised.
As can be seen in Table 3, both media represented two extremes of fermentation medium conditions for biohydrogen production potential. Earlier biohydrogen production tests in serum bottles clearly demonstrated that AFEX OPEFB hydrolysate had the highest biohydrogen potential when used as the carbon source, while DAA OPEFB molasses had the lowest biohydrogen potential. AFEX OPEFB hydrolysate was found to be a more favorable medium for biohydrogen production because it was rich in glucose (hexose) and contained no sugar-degraded compounds, such as furfural and HMF. DAA molasses, on the other hand, represented the other extreme of a less favorable medium for microbial growth due to the significant amount of furfural. Furthermore, the major soluble sugars found in DAA molasses were made of pentose and oligosaccharides. The maximum theoretical biohydrogen yield from pentose with butyric acid as major metabolite was 1.67 mol H2/mol pentose, which is lower than maximum theoretical biohydrogen yield of 2.0 mol H2/mol hexose with butyric acid as major metabolite [37,38]. Hence, a pentose enriched media will theoretically yield lower biohydrogen gas as compared with hexose-enriched media.
As for the performance of both carbon sources’ utilization, the biohydrogen yields in the current study were lower than that reported by Ito et al. [31], who attained up to 1.8 mol H2/mol glucose using mutant Enterobacter aerogenes IIU-101. Harun et al. [8] reported 1.8 mol H2/mol glucose yield in batch biohydrogen fermentation using Enterobacter cloacae KBH3. In both cases, however, the researchers used refined, synthetic glucose-enriched medium, as opposed to the complex media, i.e., AFEX OPEFB hydrolysate and DAA molasses used in this study. Nonetheless, as stated by previous researchers, one possible strategy for increasing biohydrogen production from biomass is through the genetic recombination of microbes and decoupling microbial growth from product formation [39].

4. Conclusions

In this work, a novel strain of biohydrogen-producing KBH 6958 was locally isolated from UKM’s lake soil sample. Based on morphological, phenotype, BIOLOG and 16s rRNA analyses, isolate KBH 6958 was identified as Enterobacter sp. KBH 6958 (GenBank no. KM657475), which was capable of producing biohydrogen from a variety of carbon sources. Locally isolated Enterobacter sp. KBH 6958 was able to consume sugars in both AFEX OPEFB hydrolysate and DAA OPEFB molasses and convert them to biohydrogen gas through butyric-acetic acid pathway. As anticipated, the cumulative biohydrogen production from AFEX OPEFB hydrolysate was nearly 45% higher than that observed in DAA OPEFB molasses fermentation. After fermenting AFEX OPEFB hydrolysate with Enterobacter sp. KBH 6958, the biohydrogen yield was found to be 1.55 mol /mol, whereas the biohydrogen yield from DAA OPEFB molasses was 1.19 mol /mol. Acetic acid was found to be the dominant metabolite in AFEX OPEFB hydrolysate, whereas butyric acid was found to be the dominant metabolite in DAA OPEFB molasses. The ability of Enterobacter sp. KBH 6958 to survive and produce biohydrogen from DAA OPEFB molasses was equally important aspect to be considered, as this is an important indicator of the isolate’s ability to grow in medium contaminated with sugar-degraded compounds. As a result, a furfural-tolerant isolate Enterobacter sp. KBH 6958 is highly advantageous in the production of biohydrogen from OPEFB and other pretreated lignocellulose materials.

Supplementary Materials

The following supporting information can be downloaded at: https://www.mdpi.com/article/10.3390/app13010656/s1, Figure S1: Negative gram-stained isolate KBH 6958 under 10× magnification using light microscope.

Author Contributions

A.A.I.L.: Conceptualization, Investigation, Methodology, Writing. P.M.A.: Resources, Data curation, Writing, Supervision. J.M.J.: Writing—review and editing, Supervision, Funding acquisition. N.S.E.: Investigation, Visualization. N.S.J.: Investigation, Writing—review and editing. J.P.T.: Writing—Review and editing. S.F.A.M.: Writing—Review and editing. M.S.S.: Investigation, Visualization. N.A.B.: Investigation, Visualization. All authors have read and agreed to the published version of the manuscript.

Funding

This research was funded by UKM-YSD Chair for Sustainability, UKM-YSD-2021-005 on a project entitled “Native enriched inoculum for consolidated bioprocessing of biohydrogen production from AFEX pre-treated OPEFB”.

Institutional Review Board Statement

Not applicable.

Informed Consent Statement

Not applicable.

Data Availability Statement

Not applicable.

Conflicts of Interest

The authors declare no conflict of interest.

References

  1. Lutpi, N.A.; Jahim, J.M.; Mumtaz, T.; Abdul, P.M.; Mohd Nor, M.T. Physicochemical characteristics of attached biofilm on granular activated carbon for thermophilic biohydrogen production. RSC Adv. 2015, 5, 19382–19392. [Google Scholar] [CrossRef]
  2. Trchounian, K.; Sawers, R.G.; Trchounian, A. Improving biohydrogen productivity by microbial dark-and photo-fermentations: Novel data and future approaches. Renew. Sustain. Energy Rev. 2017, 80, 1201–1216. [Google Scholar] [CrossRef]
  3. Hawkes, F.; Dinsdale, R.; Hawkes, D.; Hussy, I. Sustainable fermentative hydrogen production: Challenges for process optimisation. Int. J. Hydrogen Energy 2002, 27, 1339–1347. [Google Scholar] [CrossRef]
  4. Kotay, S.M.; Das, D. Biohydrogen as a renewable energy resource—Prospects and potentials. Int. J. Hydrogen Energy 2008, 33, 258–263. [Google Scholar]
  5. Kapdan, I.K.; Kargi, F. Bio-hydrogen production from waste materials. Enz. Microb. Technol. 2006, 38, 569–582. [Google Scholar] [CrossRef]
  6. Ntaikou, I.; Antonopoulou, G.; Lyberatos, G. Biohydrogen production from biomass and wastes via dark fermentation: A review. Waste Biomass Valor. 2010, 1, 21–39. [Google Scholar] [CrossRef]
  7. Wang, J.; Yin, Y. Principle and application of different pretreatment methods for enriching hydrogen-producing bacteria from mixed cultures. Int. J. Hydrogen Energy 2017, 42, 4804–4823. [Google Scholar] [CrossRef]
  8. Harun, I.; Jahim, J.M.; Anuar, N.; Hassan, O. Hydrogen production performance by Enterobacter cloacae KBH3 isolated from termite guts. Int. J. Hydrogen Energy 2012, 37, 15052–15061. [Google Scholar] [CrossRef]
  9. Hallenbeck, P.C.; Abo-Hashesh, M.; Ghosh, D. Strategies for improving biological hydrogen production. Bioresour. Technol. 2012, 110, 1–9. [Google Scholar] [CrossRef] [PubMed]
  10. Sinha, P.; Pandey, A. An evaluative report and challenges for fermentative biohydrogen production. Int. J. Hydrogen Energy 2011, 36, 7460–7478. [Google Scholar] [CrossRef]
  11. Yasin, N.H.M.; Fukuzaki, M.; Maeda, T.; Miyazaki, T.; Hakiman Che Maail, C.M.; Ariffin, H.; Wood, T.K. Biohydrogen production from oil palm frond juice and sewage sludge by a metabolically engineered Escherichia coli strain. Int. J. Hydrogen Energy 2013, 38, 10277–10283. [Google Scholar] [CrossRef]
  12. Norfadilah, N.; Raheem, A.; Harun, R. Bio-hydrogen production from palm oil mill effluent (POME): A preliminary study. Int. J. Hydrogen Energy 2016, 41, 11960–11964. [Google Scholar] [CrossRef]
  13. Abdul, P.M.; Jahim, J.M.; Harun, S.; Markom, M.; Hassan, O.; Mohammad, A.W.; Asis, A.J. Biohydrogen production from pentose-rich oil palm empty fruit bunch molasses: A first trial. Int. J. Hydrogen Energy 2013, 38, 15693–15699. [Google Scholar] [CrossRef]
  14. MPOB. Fresh Fruit Bunch (FFB) Received by Mill for the Month of December 2014. Available online: http://bepi.mpob.gov.my/index.php/statistics/sectoral-status/127-sectoral-status-2014/674-ffb-received-by-mill-2014.html (accessed on 6 July 2015).
  15. Rahman, S.H.A.; Choudhury, J.P.; Ahmad, A.L.; Kamaruddin, A.H. Optimization studies on acid hydrolysis of oil palm empty fruit bunch fiber for production of xylose. Bioresour. Technol. 2007, 98, 554–559. [Google Scholar] [CrossRef] [PubMed]
  16. Prasertsan, S.; Prasertsan, P. Biomass residues from palm oil mills in Thailand: An overview on quantity and potential usage. Biomass Bioenerg. 1996, 11, 387–395. [Google Scholar] [CrossRef]
  17. Lau, M.J.; Lau, M.W.; Gunawan, C.; Dale, B.E. Ammonia fiber expansion (AFEX) pretreatment, enzymatic hydrolysis, and fermentation on empty palm fruit bunch fiber (EPFBF) for cellulosic ethanol production. Appl. Biochem. Biotechnol. 2010, 162, 1847–1857. [Google Scholar] [CrossRef]
  18. Luthfi, A.A.I.; Jahim, J.M.; Harun, S.; Tan, J.P.; Mohammad, A.W. Biorefinery approach towards greener succinic acid production from oil palm frond bagasse. Proc. Biochem. 2016, 51, 1527–1537. [Google Scholar] [CrossRef]
  19. Yuan, Y.; Zhou, Z.; Jiao, Y.; Li, C.; Zheng, Y.; Lin, Y.; Xiao, J.; Chen, Z.; Cao, P. Histological identification of Propionibacterium acnes in nonpyogenic degenerated intervertebral discs. BioMed Res. Int. 2017, 2017, 6192935. [Google Scholar] [CrossRef] [PubMed] [Green Version]
  20. Tamura, K.; Stecher, G.; Peterson, D.; Filipski, A.; Kumar, S. MEGA6: Molecular Evolutionary Genetics Analysis Version 6.0. Molec. Biol. Evol. 2013, 30, 2725–2729. [Google Scholar] [CrossRef] [Green Version]
  21. Mecozzi, M. Estimation of total carbohydrate amount in environmental samples by the phenol–sulphuric acid method assisted by multivariate calibration. Chemom. Intell. Lab. Syst. 2005, 79, 84–90. [Google Scholar] [CrossRef]
  22. Turner, R.D.; Hurd, A.F.; Cadby, A.; Hobbs, J.K.; Foster, S.J. Cell wall elongation mode in Gram-negative bacteria is determined by peptidoglycan architecture. Nat. Commun. 2013, 4, 1469. [Google Scholar] [CrossRef] [PubMed]
  23. Wragg, P.; Randall, L.; Whatmore, A.M. Comparison of Biolog GEN III MicroStation semi-automated bacterial identification system with matrix-assisted laser desorption ionization-time of flight mass spectrometry and 16S ribosomal RNA gene sequencing for the identification of bacteria of veterinary interest. J. Microbiol. Methods 2014, 105, 16–21. [Google Scholar] [PubMed] [Green Version]
  24. Goswami, A.; Stewart, J. Organic Synthesis Using Biocatalysis; Academic Press: Cambridge, MA, USA, 2015. [Google Scholar]
  25. Sundara Sekar, B.; Seol, E.; Park, S. Co-production of hydrogen and ethanol from glucose in Escherichia coli by activation of pentose-phosphate pathway through deletion of phosphoglucose isomerase (pgi) and overexpression of glucose-6-phosphate dehydrogenase (zwf) and 6-phosphogluconate dehydrogenase (gnd). Biotechnol. biofuel. 2017, 10, 85. [Google Scholar]
  26. Rahim, N.A.; Indera Luthfi, A.A.; Abdul, P.M.; Jahim, J.M.; Bukhari, N.A. Towards Sustainable Production of Bio-based Lactic Acid via a Bio-based Technical Route: Recent Developments and the Use of Palm Kernel Cakes in the Bioconversion. BioResources 2022, 17, 3781–3809. [Google Scholar] [CrossRef]
  27. de Amorim, E.L.C.; Sader, L.T.; Silva, E.L. Effect of substrate concentration on dark fermentation hydrogen production using an anaerobic fluidized bed reactor. Appl. Biochem. Biotechnol. 2012, 166, 1248–1263. [Google Scholar] [CrossRef] [PubMed]
  28. Bundhoo, M.Z.; Mohee, R. Inhibition of dark fermentative bio-hydrogen production: A review. Int. J. Hydrogen Energy 2016, 41, 6713–6733. [Google Scholar] [CrossRef]
  29. Public Health. Identification of Enterobacteriaceae. 2015, Volume 16, pp. 1–34. Available online: https://assets.publishing.service.gov.uk/government/uploads/system/uploads/attachment_data/file/423601/ID_16i4.pdf (accessed on 23 December 2022).
  30. Luthfi, A.A.I.; Jahim, J.M.; Harun, S.; Tan, J.P.; Mohammad, A.W. Potential use of coconut shell activated carbon as an immobilisation carrier for high conversion of succinic acid from oil palm frond hydrolysate. RSC Adv. 2017, 7, 49480–49489. [Google Scholar] [CrossRef] [Green Version]
  31. Ito, T.; Nakashimada, Y.; Kakizono, T.; Nishio, N. High-yield production of hydrogen by Enterobacter aerogenes mutants with decreased α-acetolactate synthase activity. J. Biosci. Bioeng. 2004, 97, 227–232. [Google Scholar] [CrossRef]
  32. Khanna, N.; Kotay, S.M.; Gilbert, J.J.; Das, D. Improvement of biohydrogen production by Enterobacter cloacae IIT-BT 08 under regulated pH. J. Biotechnol. 2011, 152, 9–15. [Google Scholar] [CrossRef]
  33. Hasibar, B.; Ergal, İ.; Moser, S.; Bochmann, G.; Simon, K.-M.R.; Fuchs, W. Increasing biohydrogen production with the use of a co-culture inside a microbial electrolysis cell. Biochem. Eng. J. 2020, 164, 107802. [Google Scholar] [CrossRef]
  34. Sikora, A.; Błaszczyk, M.; Jurkowski, M.; Zielenkiewicz, U. Lactic Acid Bacteria in hydrogen-Producing Consortia: On Purpose or by Coincidence? INTECH Open Science Open Minds: London, UK, 2013. [Google Scholar]
  35. Sivagurunathan, P.; Sen, B.; Lin, C.-Y. Overcoming propionic acid inhibition of hydrogen fermentation by temperature shift strategy. Int. J. Hydrogen Energy 2014, 39, 19232–19241. [Google Scholar] [CrossRef]
  36. Lin, C.-Y.; Lay, C. Effects of carbonate and phosphate concentrations on hydrogen production using anaerobic sewage sludge microflora. Int. J. Hydrogen Energy 2004, 29, 275–281. [Google Scholar] [CrossRef]
  37. Khamtib, S.; Reungsang, A. Biohydrogen production from xylose by Thermoanaerobacterium thermosaccharolyticum KKU19 isolated from hot spring sediment. Int. J. Hydrogen Energy 2012, 37, 12219–12228. [Google Scholar] [CrossRef]
  38. Lin, C.-Y.; Lay, C.-H.; Sen, B.; Chu, C.-Y.; Kumar, G.; Chen, C.-C.; Chang, J.-S. Fermentative hydrogen production from wastewaters: A review and prognosis. Int. J. Hydrogen Energy 2012, 37, 15632–15642. [Google Scholar] [CrossRef]
  39. Singh, R.; White, D.; Blum, P. Mutant microorganisms and methods of making and using. U.S. Patent 11,332,763, 2022. [Google Scholar]
Figure 1. 1.5 L anaerobic column bioreactor (ACBR) set up for biohydrogen fermentation.
Applsci 13 00656 g001
Figure 2. Phylogenetic dendrogram constructed using the neighbor-joining method based on 16s rRNA sequences indicating the position of isolate KBH 6958 among closely related members of the genus Enterobacter. The numbers at the nodes indicate the levels of bootstrap support percentages of 1000 replicates.
Applsci 13 00656 g002
Figure 3. FESEM image of isolate KBH 6958 at (a) magnification of 2000×; (b) magnification of 5000× showing nano-interlinkages among the bacteria; and (c) magnification of 10,000× showing individual bacterium.
Applsci 13 00656 g003
Figure 4. The cumulative biogas and biohydrogen produced from fermentation of AFEX OPEFB hydrolysate in 1.5 L ACBR fitted in the Gompertz equation.
Applsci 13 00656 g004
Figure 5. Gompertz curve fitting graph of biogas and biohydrogen evolved at initial pH 9 and substrate level 7.0 g/L of DAA Molasses in 1.5 L ACBR.
Applsci 13 00656 g005
Table 1. Carbon source utilization pattern of isolate KBH 6958 using BIOLOG AN and GEN III plates.
TypeSubstrateANGen IIITypeSubstrateANGen III
Amine/AmideAlaninamide78N/ACarbohydrateSucrose10087
GlucuronamideN/A85D-Trehalose10081
Succinamic Acid0N/A Turanose8887
Amino AcidL-Alanine10093Carboxylic acidD-Galacturonic acid10093
L-Alanyl-L- Glutamine100N/AD-Gluconic acid10094
L-Alanyl-L-histidine66N/AGlucuronic AcidN/A93
L-Alanyl-L-threonine100N/AD-Glucosaminic acid0N/A
L-ArginineN/A78Acetic acid3887
L-Asparagine78N/AFormic acid082
D-Aspartic AcidN/A73Fumaric acid78N/A
L-HistidineN/A89Glyoxylic acid0N/A
L-Glutamic acid8293α-Hydroxybutyric acid013
L-Glutamine100N/Aβ-Hydroxybutyric acid2488
Glycyl-L-aspartic acid72N/AItaconic acid0N/A
Glycyl-L-glutamine100N/Aα-Ketobutyric acid02
Glycyl-L-methionine0N/Aα-Ketovaleric acid0N/A
Glycyl-L-proline10094α-Ketoglutaric acidN/A60
L-Methionine0N/AD,L-Lactic acid60N/A
L-Phenylalanine0N/AL-Lactic acid10094
L-pyroglutamic acidN/A79D-Malic acid068
D-SerineN/A10L-Malic acid10095
L-Serine10094Propionic acid05
L-Threonine0N/APyruvic acid100N/A
L-Valine0N/AD-Saccharic acid10094
L-Valine + L-aspartic acid100N/ASuccinic acid100N/A
CarbohydrateN-Acetyl-D-galactosamine044m-Tartaric acid100N/A
N-Acetyl-D-glucosamine10094Mucic AcidN/A93
N-Acetyl-D-mannosamine10094Quinic AcidN/A68
Adonitol0N/ACitric AcidN/A94
D-Arabitol067Acetoacetic AcidN/A55
Arbutin82N/AMiscellaneousAmygdalin0N/A
D-Cellobiose10092Glycerol2487
Dulcitol16N/AD,L-α-Glycerol phosphate100N/A
Erythritol0N/AGlucose-1-phosphate100N/A
D-Fructose10085Glucose-6-phosphate10095
D-FucoseN/A45Frucose-6-phosphateN/A93
L-Fucose067D-Salicin7885
D-Galactose10084D,L-Lactic acid methyl ester078
Gentiobiose7888Pyruvic acid methyl ester10089
α-D-Glucose10090Succinic acid mono-methyl ester56N/A
m-Inositol6093Urocanic acid100N/A
α-D-Lactose100862′-Deoxy adenosine100N/A
Lactulose58N/AInosine8092
Maltose10083Thymidine100N/A
Maltotriose100N/AUridine100N/A
D-Mannitol10087Thymidine-5′-monophosphate24N/A
D-Mannose10086Uridine-5′-monophosphate78N/A
D-Melezitose0N/AN-Acetyl Neuraminic AcidN/A18
D-Melibiose10086L-Galactonic Acid LactoneN/A94
3-Methyl-D-glucose3239p-Hydroxy-Phenylacetic AcidN/A92
α-Methyl-D-galactose44N/ABromo-Succinic AcidN/A92
β-Methyl-D-galactose24N/ATween 40N/A51
α-Methyl-D-glucoside24N/Aγ-Amino-Butryric AcidN/A10
β-Methyl-D-glucoside10085Polymerα-Cyclodextrin0N/A
Palatinose100N/Aβ-Cyclodextrin0N/A
D-Raffinose10087Dextrin10084
L-Rhamnose7889GelatinN/A69
D-Sorbitol10091PectinN/A82
Stachyose10088
N/A—Not available.
Table 2. Qualitative analysis of metabolites after biohydrogen fermentability test using various fermentation media.
MediumMetabolitesBiohydrogen Potential (mmol/L)
Butyric AcidAcetic AcidPropionic AcidLactic AcidFormic AcidEthanol2,3-butandiolOther
RCM+++++Ethyl isopropyl ether45.6 ± 4.9
Glucose and xylose+++46.1 ± 3.5
AFEX OPEFB hydrolysate+++Acetamide
Ethyl isopropyl ether
50.6 ± 5.3
DAA OPEFB molasses+++++2-furan methanol,
Ethyl isopropyl ether
35.3 ± 3.7
+ Metabolite detected; − Metabolite not detected.
Table 3. Summary of major sugar and soluble compounds in AFEX OPEFB hydrolysate and DAA OPEFB molasses.
Soluble CompoundsAFEX OPEFB HydrolysateDAA OPEFB Molasses
Initial Total Carbohydrates7.1 ± 0.17.1 ± 0.1
Oligosaccharide:
Glucann.d.0.6 ± 0.1
Xylann.d.2.9 ± 0.1
Monosaccharide:
Glucose4.5 ± 0.20.2 ± 0.1
Xylose2.3 ± 0.13.2 ± 0.1
Furfuraln.d.0.51 ± 0.11
n.d. Not detected.
Disclaimer/Publisher’s Note: The statements, opinions and data contained in all publications are solely those of the individual author(s) and contributor(s) and not of MDPI and/or the editor(s). MDPI and/or the editor(s) disclaim responsibility for any injury to people or property resulting from any ideas, methods, instructions or products referred to in the content.

