Article

Optical Behavior of Nile Red in Organic and Aqueous Media Environments

1
Department of Biosciences and Territory (DiBT), University of Molise, Contrada Lappone, 86090 Pesche, Italy
2
Department of Agricultural, Environmental and Food Sciences (DiAAA), University of Molise, via F. De Sanctis, 86100 Campobasso, Italy
3
Department of Medicine and Health Sciences “V. Tiberio”, University of Molise, via F. De Sanctis, 86100 Campobasso, Italy
*
Author to whom correspondence should be addressed.
Appl. Sci. 2023, 13(1), 638; https://doi.org/10.3390/app13010638
Submission received: 12 December 2022 / Revised: 29 December 2022 / Accepted: 30 December 2022 / Published: 3 January 2023
(This article belongs to the Section Applied Physics General)

Abstract

:
A simple model is proposed to calculate the dimerization constant of a dye in non-aqueous solvents. Alkan-1ols of the formula H–(CH2)n–OH are used to study the spectroscopic behavior of Nile Red dye. The number n varied from 1 to 8 to modulate the medium hydrophobicity. Generally, Nile red is used to localize lipid droplets within cells. This molecule is non-fluorescent in water and other polar solvents but undergoes fluorescence enhancement and large absorption and emission blue shifts in non-polar environments. The calculated equilibrium constants suggest that the aggregation process is solvent-assisted. The absorption and fluorescence emission spectra reveal a marked red shift, which is studied by breaking the wavelength of the maximum band into two terms, showing the contribution of the solvent and the effect of the dye concentration. Both contributions were investigated as a function of the number n, and it was found that alkan-1ols with large n tend to aggregate and produce a smaller red shift. Conversely, it was also noticed that short-chain alkan-1ols stabilize the excited state of the dye via H-bond and the red shift increases. The hydrophilicity of the medium was found to be modulated by adding pure water, in a controlled way, to the binary systems dye–H–(CH2)n–OH (n = 1–8). The quantification of solvent hydrophilicity is described with the ratio R = water moles/alcohol moles. From this investigation, we realized that the absorption spectra values are strictly connected with the R parameter. In this context, we realized that fluorescence emission spectra allow us to determine the adjustable parameters.

1. Introduction

Nile Red (9-diethylamino-5-benzo[a]phenoxazine-5-one, NR) is a polar dye consisting of an electron donor (diethylamino group) and an electron with a drawing aromatic system connected by a flexible single bond [1]. It exhibits a change in its electronic emission as a function of the local polarity of its surroundings. These molecule fluorescence properties in the presence of organic solvents were previously determined, resulting in very soluble and strong fluorescence in organic solvents, and these properties were properly exploited for biochemical applications [2,3].
Due to its sensitivity to the local environment, NR has been advantageously applied to probe the local polarity in the study of various heterogeneous systems, including micelles [4], reverse micelles [5], dendrimers [6,7,8], liposomes [9,10], proteins [11,12], and ionic liquids [13]. Furthermore, NR in solution self-associates owing to strong intermolecular van der Waals attractive forces between molecules. The formation of supramolecular structures is generally observed in aqueous solutions, and many studies have been devoted to their characterization and properties. In the literature, there is an enormous quantity of information concerning the forces taking part in the interactions between molecules mediated by different environments connected with biological and medical applications, such as, for example, liposome systems [14,15,16,17,18,19]. It was recently demonstrated that alkan-1ol solvents are significantly more polar than expected based on the measured H-bonding properties of “monomer” alkan-1ols in diluted solution [20]. This prompted us to consider the aggregation process of NR in an alcoholic solution.
Generally, Nile Red is used to localize lipid droplets within cells. This molecule is non-fluorescent in water and other polar solvents but undergoes fluorescence enhancement and large absorption and emission blue shifts in nonpolar environments. Hydrophobic and hydrophilic solvents contribute two major intermolecular forces between hydrophobic nonpolar and hydrophilic polar sites, referring to guest molecules. Nile Red is an uncharged hydrophobic molecule whose fluorescence is strongly influenced by the polarity of its environment, and its position as a function of its distribution represents an important tool for sensing applications.
This research aims to obtain a deeper insight into the dye–alcohol and dye–dye interactions of NR to elucidate the role of hydrophobic interactions and to correlate the spectroscopic behavior of NR to the alcohol structure. For this purpose, the UV-Vis absorption and fluorescence emission spectra of NR in alkan-1ol H–(CH2)n–OH were studied both as functions of n and of NR concentration. Furthermore, the hydrophilicity of the medium was increased by adding water and monitoring the spectra of the NR-alkan-1ol-water ternary systems.

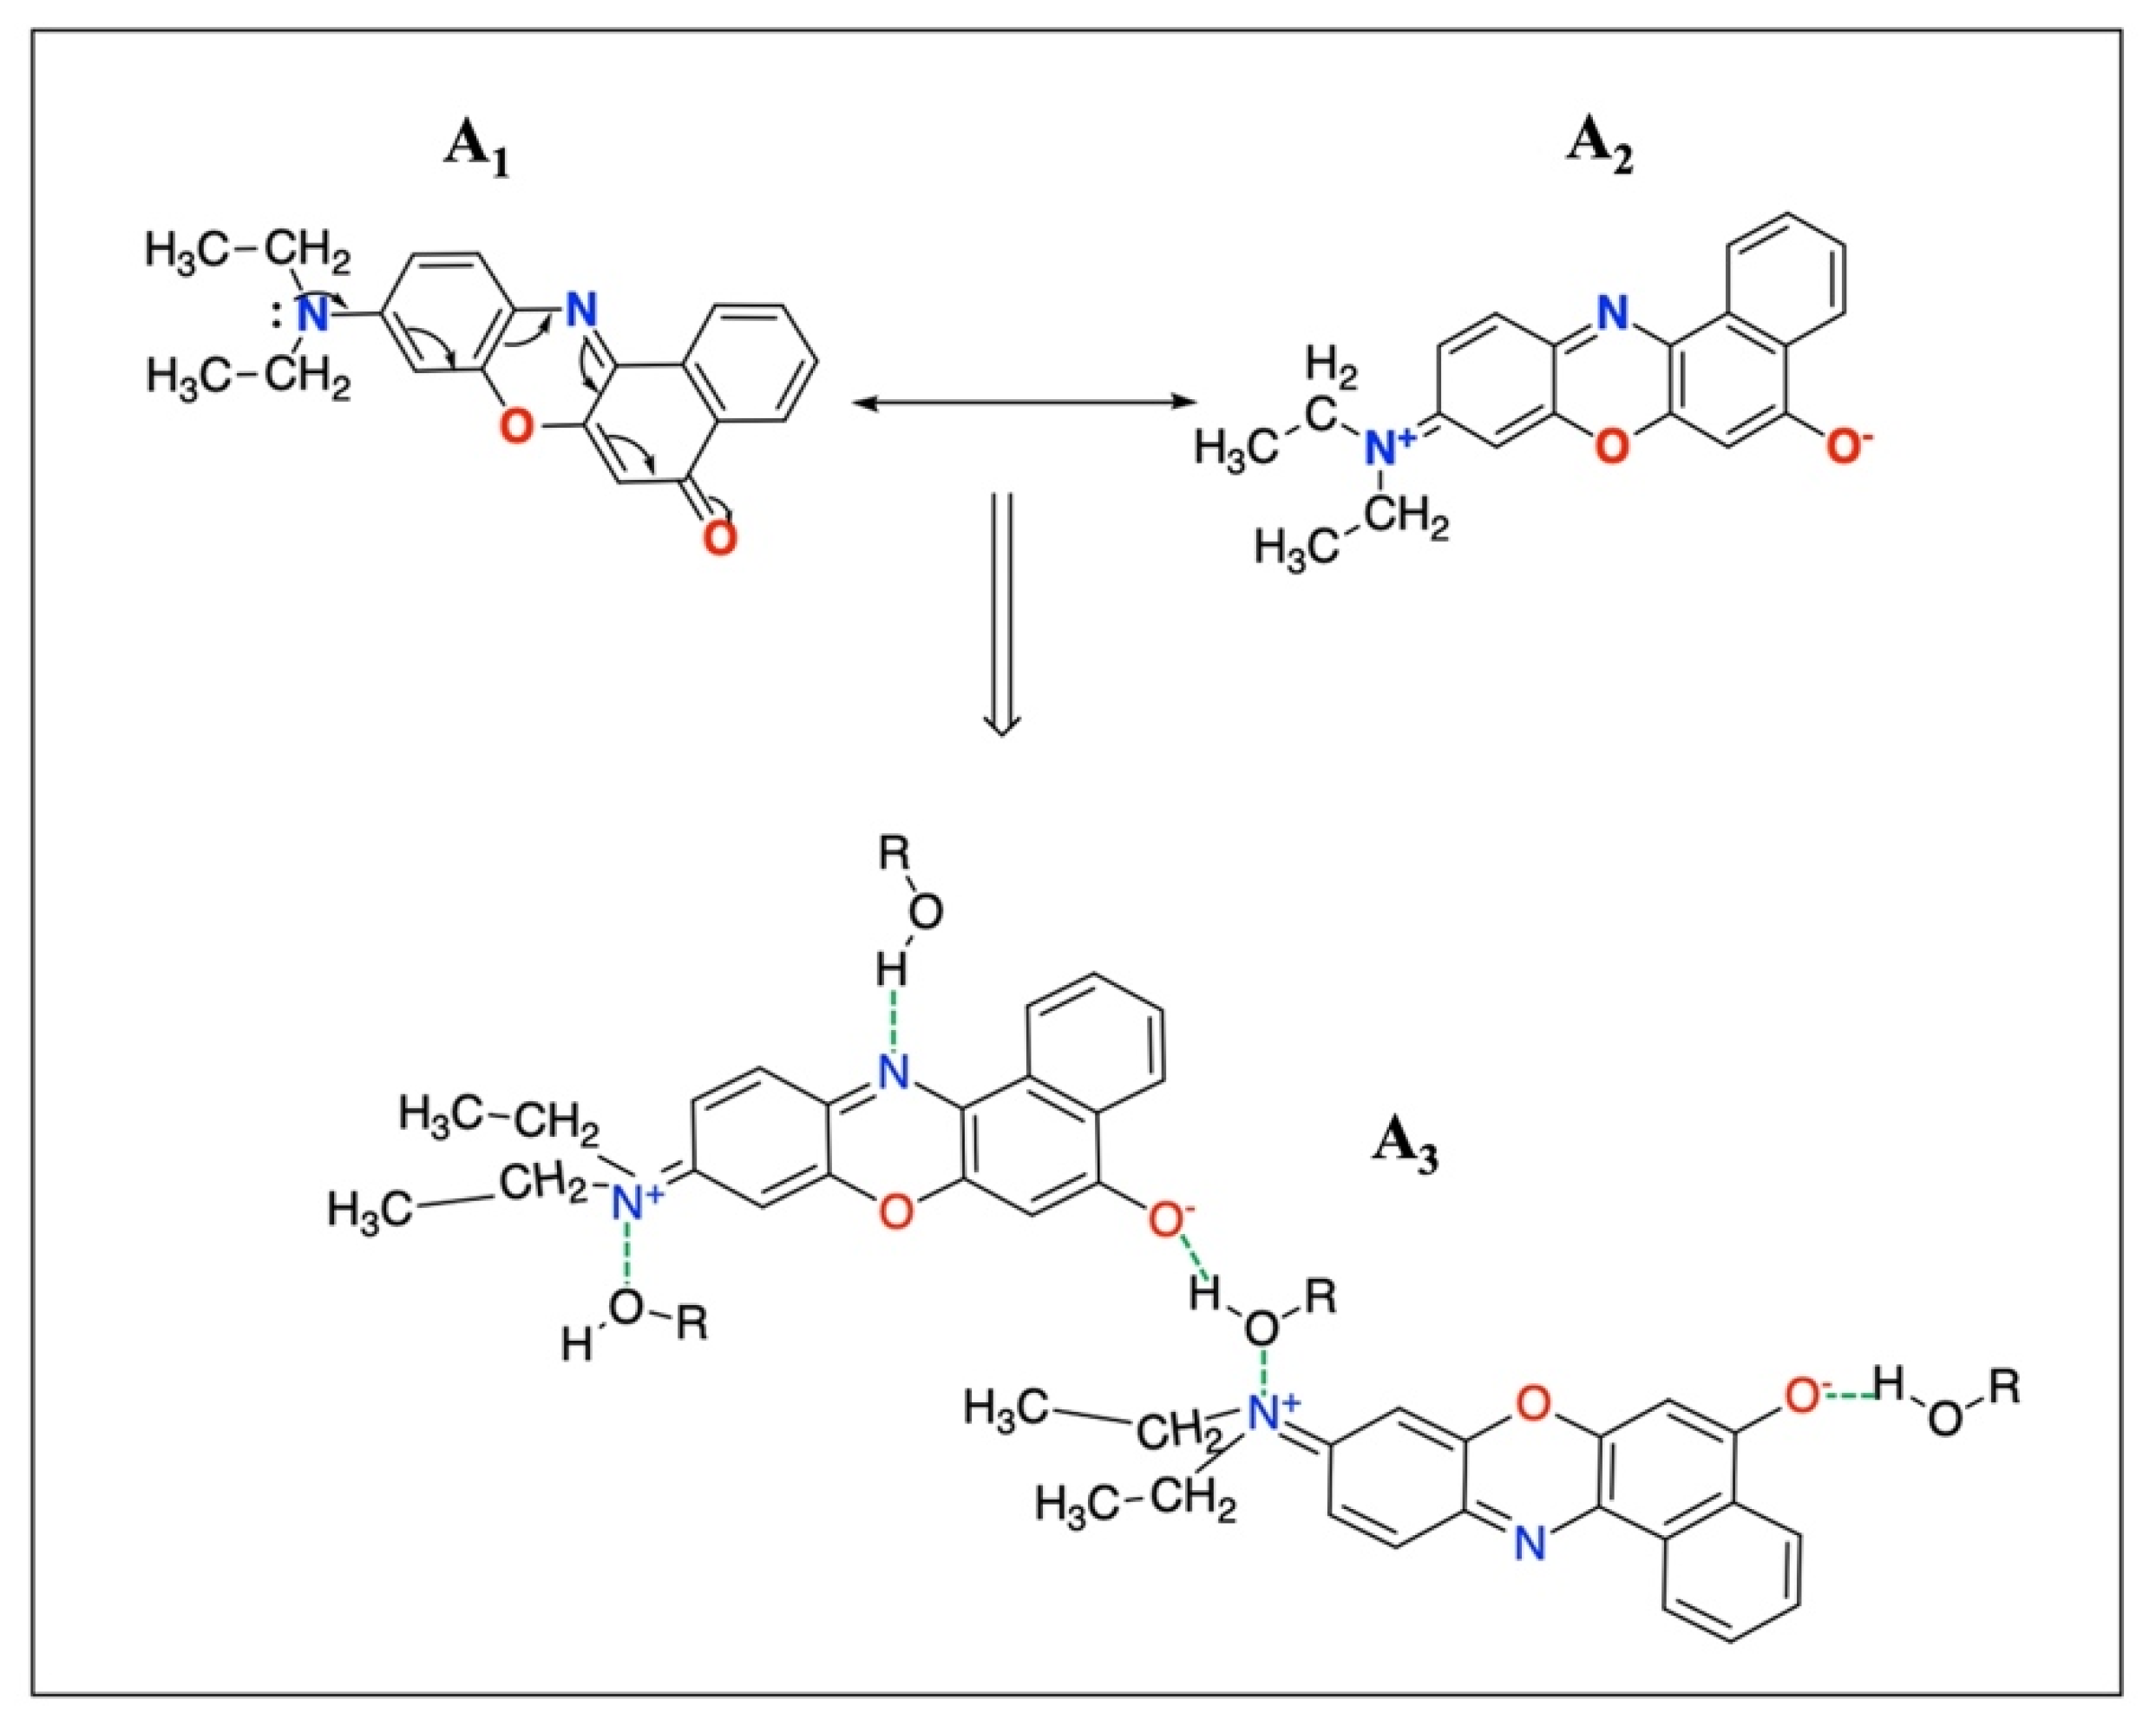
2. Theoretical Aspects

The absorbance of a dye depends both on the wavelength of the incident light, λ , and on its mole fraction, x D , i.e., A = A ( λ , x D ) . Such a function is mathematically complex, so that the molecular properties of the liquid solutions of dyes are investigated by monitoring only the peak of maximum intensity as the dye concentration varies. We point out that a single experimental point hardly captures the structure-related, and for this reason, we introduced the integral absorbance [21], defined as follows:
A ¯ = λ 1 λ 2 A ( λ , x D ) d λ
where [ λ 1 , λ 2 ] is the wavelength interval of the absorption band under investigation. The complexity of a dye absorption spectrum can be interpreted in terms of association and solvation. By the former, we refer to the tendency of the dye to form polymers. By solvation we refer to the tendency of the dye to form complexes with solvent molecules. The ability of a dye molecule to solvate or associate is closely related to its electronic structure. Hence, the absorption spectrum of the dye, experimentally recorded, is the superposition of these two effects, i.e.,
A ¯ = A ¯ ( 1 ) ε 1 + A ¯ ( 2 ) ε 2
where A ¯ ( 1 )   and A ¯ ( 2 ) are the contributions to the absorption spectrum due to the dye–solvent (state (1)) and dye–dye (state (2)) interactions, respectively, while ε 1 and ε 2 are the fractions of dye molecules that are in states (1) or (2), respectively.
Only dye molecules absorb the light, so that the mole fraction of adsorbent molecules in states (1) and (2) are:
ε 1 = x 1 x D ,       ε 2 = 1 ε 1
Substitution of Equation (3) into Equation (2) results in:
A ¯ = A ¯ ( 2 ) + Δ ( 1 , 2 ) x 1 x D
where:
Δ ( 1 , 2 ) = A ¯ ( 1 ) A ¯ ( 2 )
In order to obtain the function x 1 ( x D ) ,   we stress that as the dye concentration varies, drastic variations in aqueous solutions are observed. Such changes have been interpreted in terms of multiple dye molecule associations interacting through the electron system of π -electron orbital system of the aromatic rings, stacking in a sandwich-like mode [22,23,24]. On the contrary, in no aqueous medium, very limited changes are shown by the absorption spectra. Indeed, even in the most concentrated solutions, the monomer dye species prevails, and the only relevant equilibrium is the dimerization,
2 D   D 2
The equilibrium constant of this equilibrium is expressed in a thermodynamically consistent way for liquid-phase reactions [25]. Activities should be used rather than concentrations [26]. Nonetheless, we use a mole fraction-based equilibrium constant in the present work. The mole fraction-based equilibrium constant:
K x = x 2 x 1 2
is related to the activity-based equilibrium constant K by:
K = K x K γ
where K γ is defined analogous to K x , but with the corresponding activity coefficients. The thermodynamic theory yields that K is independent of the composition, while K x is, in general, composition dependent. Nevertheless, for very diluted solutions, K γ   1 so that the equilibrium is completely characterized by:
K x   K
On the other hand, the total dye mole fraction is connected to x 1 e x 2 by:
x D = x 1 + 2 x 2 = x 1 + 2 K x 1 2
where Equations (7) and (8) have been used.
Differentiating Equation (10), we have:
d x 1 d x D = 1 1 + 4 K x 1
In very dilute solutions, parameters A ¯ ( 1 ) and A ¯ ( 2 ) are independent of the dye concentration; therefore, taking the derivative of Equation (2) with respect to x D and making use of Equation (11) results in:
d A ¯ d x D = Δ ( 1 , 2 ) d ε 1 d x D = ( 2 K ) Δ ( 1 , 2 ) ( 1 + 4 K x 1 ) ( 1 + 2 K x 1 ) 2
Multiplication of Equation (12) by x D yields:
d A ¯ d ϕ = Δ ( 1 , 2 ) ( 1 1 + 4 K x 1 1 1 + 2 K x 1 )
where, for the sake of simplicity, we set ϕ = ln x .
The presence of the minus sign in the parenthesis of Equation (13) implies that the function A ¯ ( x D ) has an inflection point (ip). Indeed, at the ip:
d 2 A ¯ d ϕ 2 = Δ ( 1 , 2 ) ( 4 K ( 1 + 4 K x 1 ) 2 + 2 K ( 1 + 2 K x 1 ) 2 ) ( 1 1 + 4 K x 1 ) x D = 0
which is satisfied for:
( K x 1 ) i p = 2 4
Correspondingly:
( d A ¯ d ϕ ) i p = ( 3 +   2 2 ) Δ ( 1 , 2 ) ,   ( x 1 x D ) i p = 2 1
From Equation (10) one notes that x D 0     x 1 0 ,   therefore:
lim x D 0 d A ¯ d x D = lim x 1 0 d A ¯ d x 1 = 2 K Δ ( 1 , 2 )
where Equation (12) has been used.
In principle, Equations (15) and (16) allow us to theoretically determine the parameters K , Δ ( 1 , 2 ) , and A ¯ ( 2 ) and reproduce the experimental curve A ¯ ( x D ) . However, in dilute systems, the inflection point is reached about the time that the dye concentration is very high. Thus, the slope at the inflection point is uncertain. Accordingly, we suggest an alternative procedure to calculate these parameters. To do this, we multiply Equation (11) by K and put y = K x 1 the results in:
2 y 2 + y K x D = 0
This equation is quickly solved by:
y = K x 1 = 1 + 1 + 8 K x D 4
Substitution of Equation (19) into Equation (10) yields:
A ¯ = A ¯ ( 2 ) + 2 Δ ( 1 , 2 ) 1 + 1 + 8 K x D
This equation contains only the experimental variable xD and three adjustable parameters, A ¯ 2 , Δ ( 1 , 2 ) , and K , which are calculated as follows. Although Δ ( 1 , 2 ) and ( x 1 ) i p cannot be accurately determined by Equation (16), their estimates are used as a starting point in the non-linear Levenberg–Marquardt procedure for obtaining K by Equation (20). In this way, the model is rapidly convergent to the experimental curve.

3. Materials and Methods

3.1. Chemicals

NR was a Sigma Aldrich bioreagent (purity 98.0%) for fluorescence investigations, and it was used as received. The alkan-1ols with the chemical structure H–(CH2)n–OH (n = 1–8) were Sigma-Aldrich products. Their purity was assessed by the company to be greater than 98–99%, and they were used without further purification. The absorption and fluorescence spectra of NR gave no indication of dye impurities. The water used was from a Milli-Q filtration system (Merck Millipore, Milan, Italy).

3.2. Preparation of the Samples

For the binary systems, the solutions were prepared by weighing 5 mg of NR dye (318.37 gmol−1) dissolved in 10 mL of the different alkan-1ols H–(CH2)n–OH (n = 1–8). Starting from the stock concentration solution, different NR-diluted solutions ranging from 0.785–160 μ M were prepared for the adsorption measurements, while for the fluorescence emission measurements the NR dilutions were between 0.262–16 μ M. For the ternary systems, 10 μ L of ultrapure water was added to a single concentration of NR-alkan-1ols H–(CH2)n–OH (n = 1–8) binary solution (1 mL), directly in the cuvette, and stirred before carrying out the different absorption and fluorescence emission measurements.

3.3. Absorption Measurements

Absorption spectra were recorded using a Cary 100-Varian UV-Vis equipped with thermostatted cells. Liquid mixtures were placed in rectangular quartz cells of 1 cm path length, and absorption spectra were recorded at 20.0 ± 0.5 °C in the 200–800 nm wavelength region.

3.4. Fluorescence Measurements

Steady-state fluorescence measurements were performed with a Varian-fluorimeter at 20.0 ± 0.5 °C. All concentration dependence was measured under constant experimental conditions. In particular, the excitation and emission slit widths were 5 mm, and the bandwidth of the monochromator was 20 nm. The fluorescence spectra of NR were recorded with λ e x = 450 nm, corresponding to the maximum of the long-wavelength band of the dye.

4. Results and Discussion

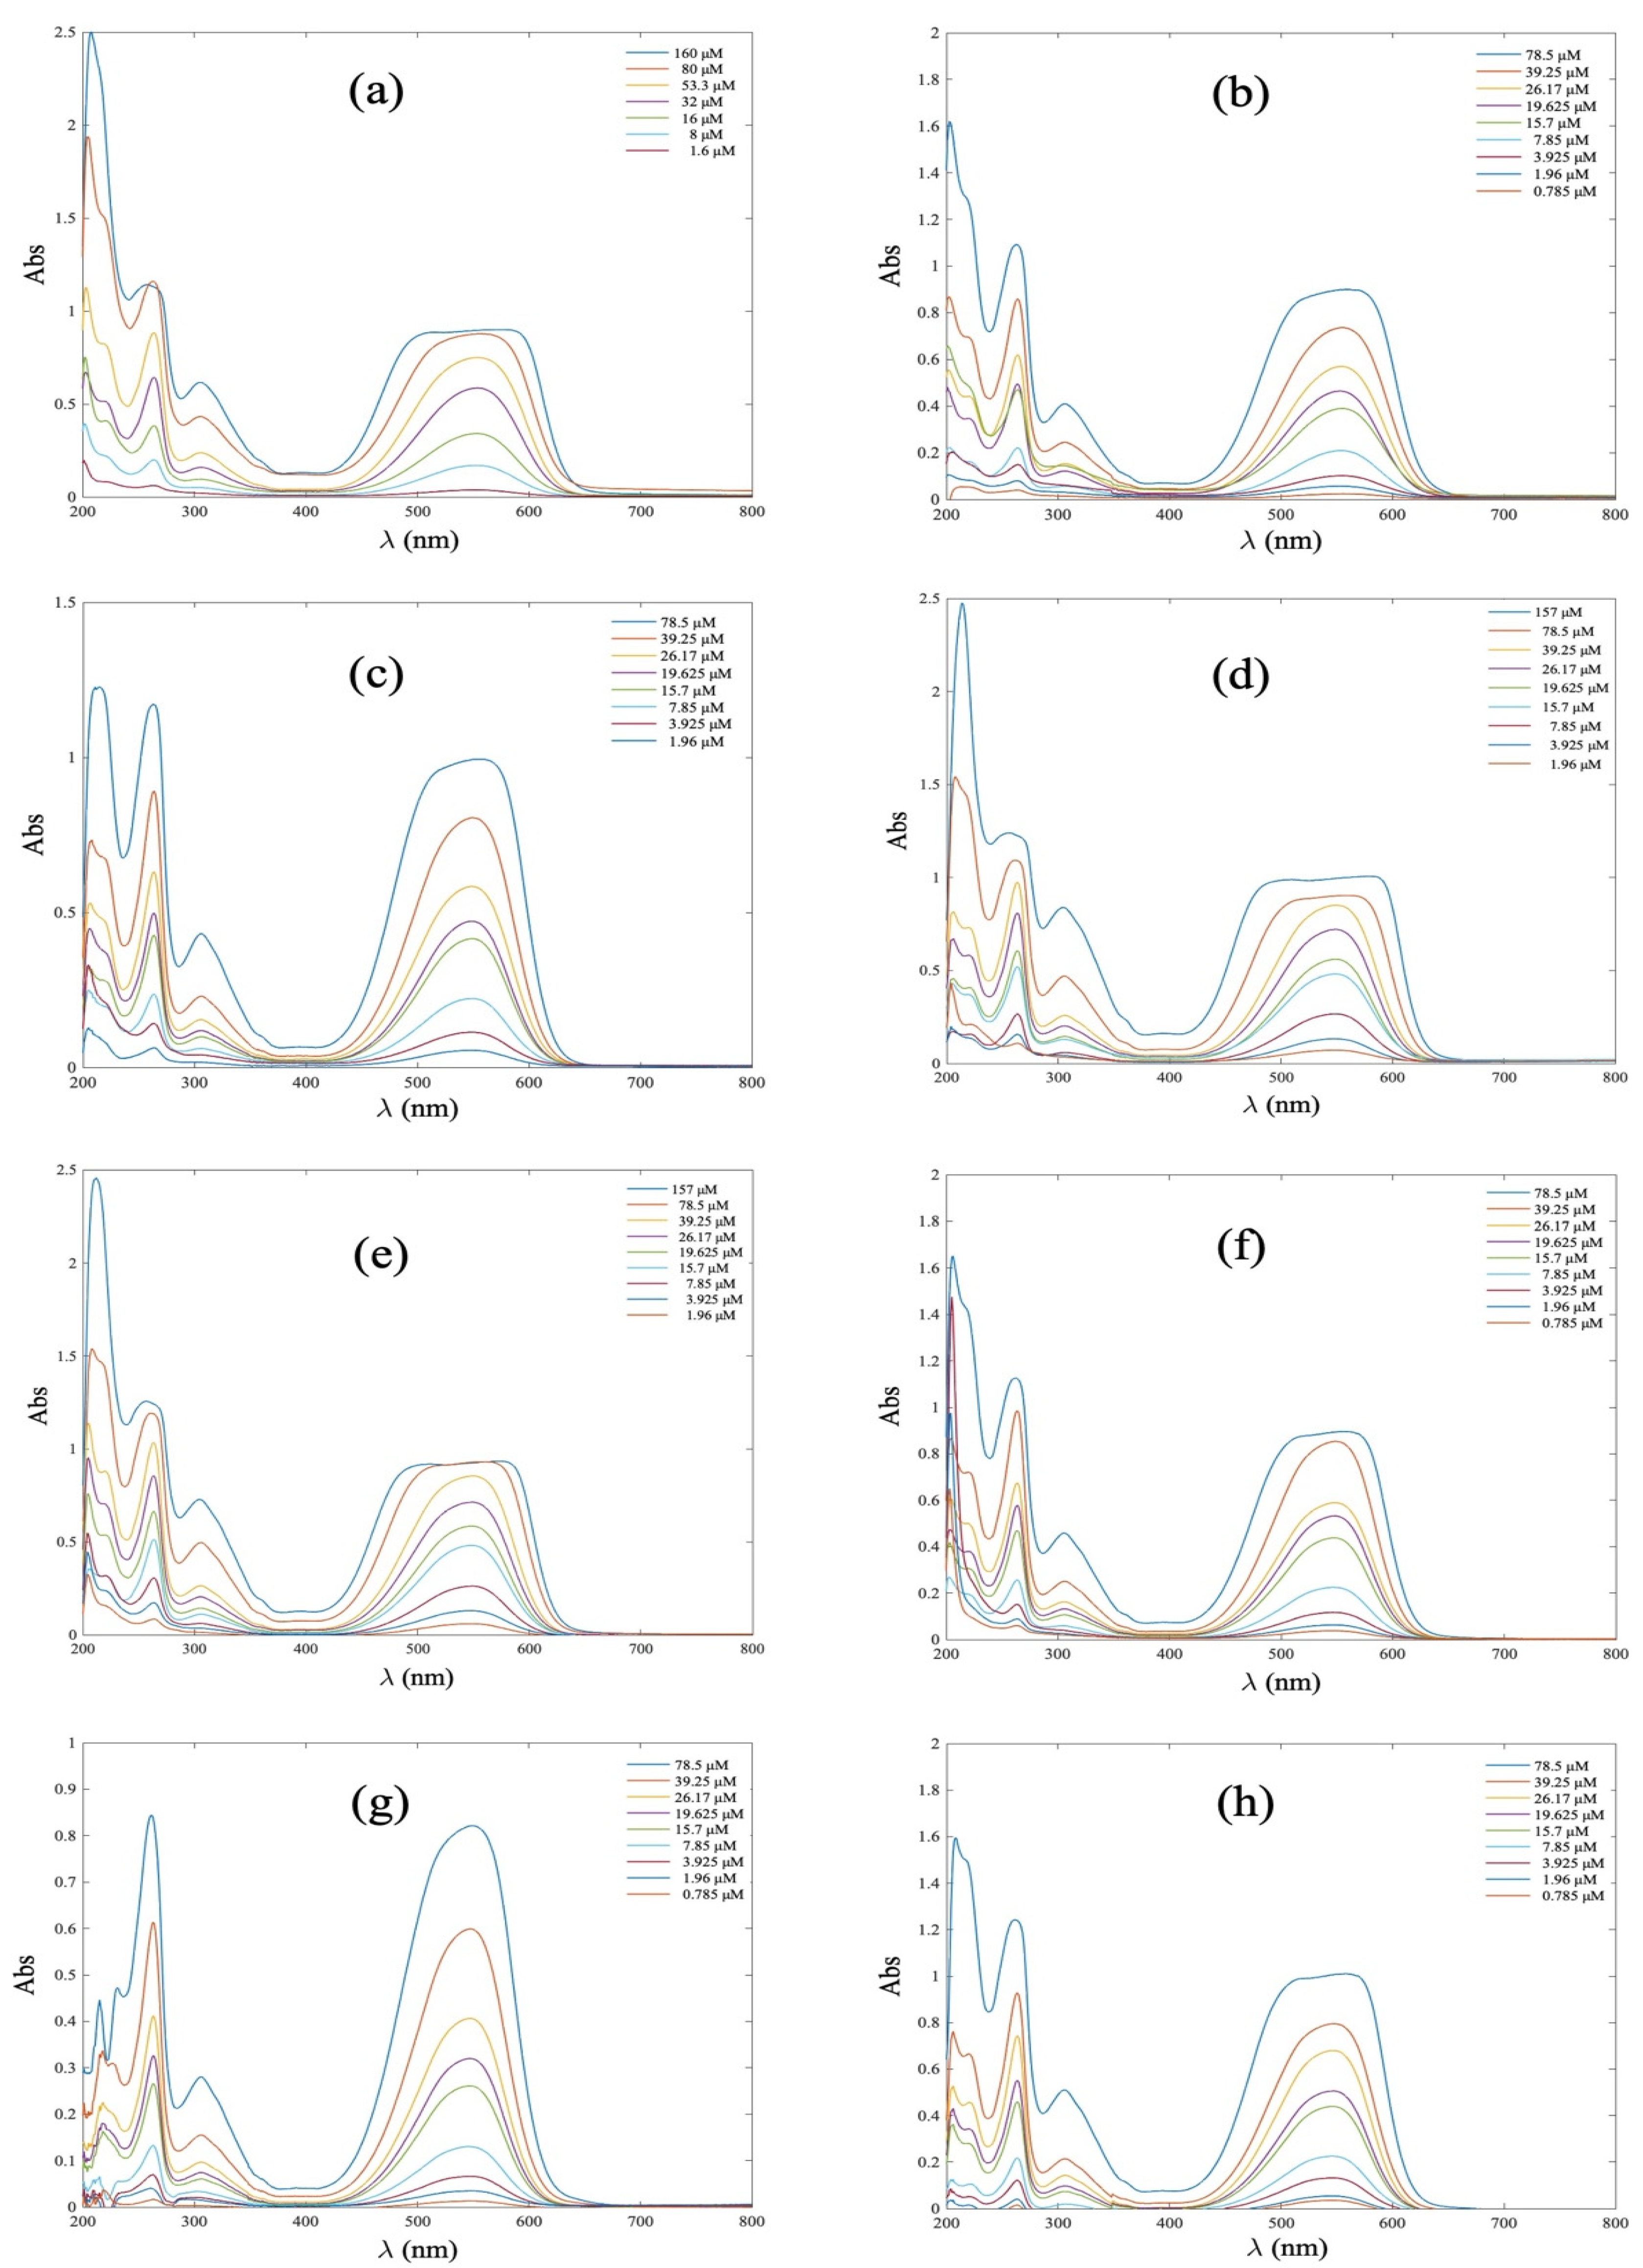
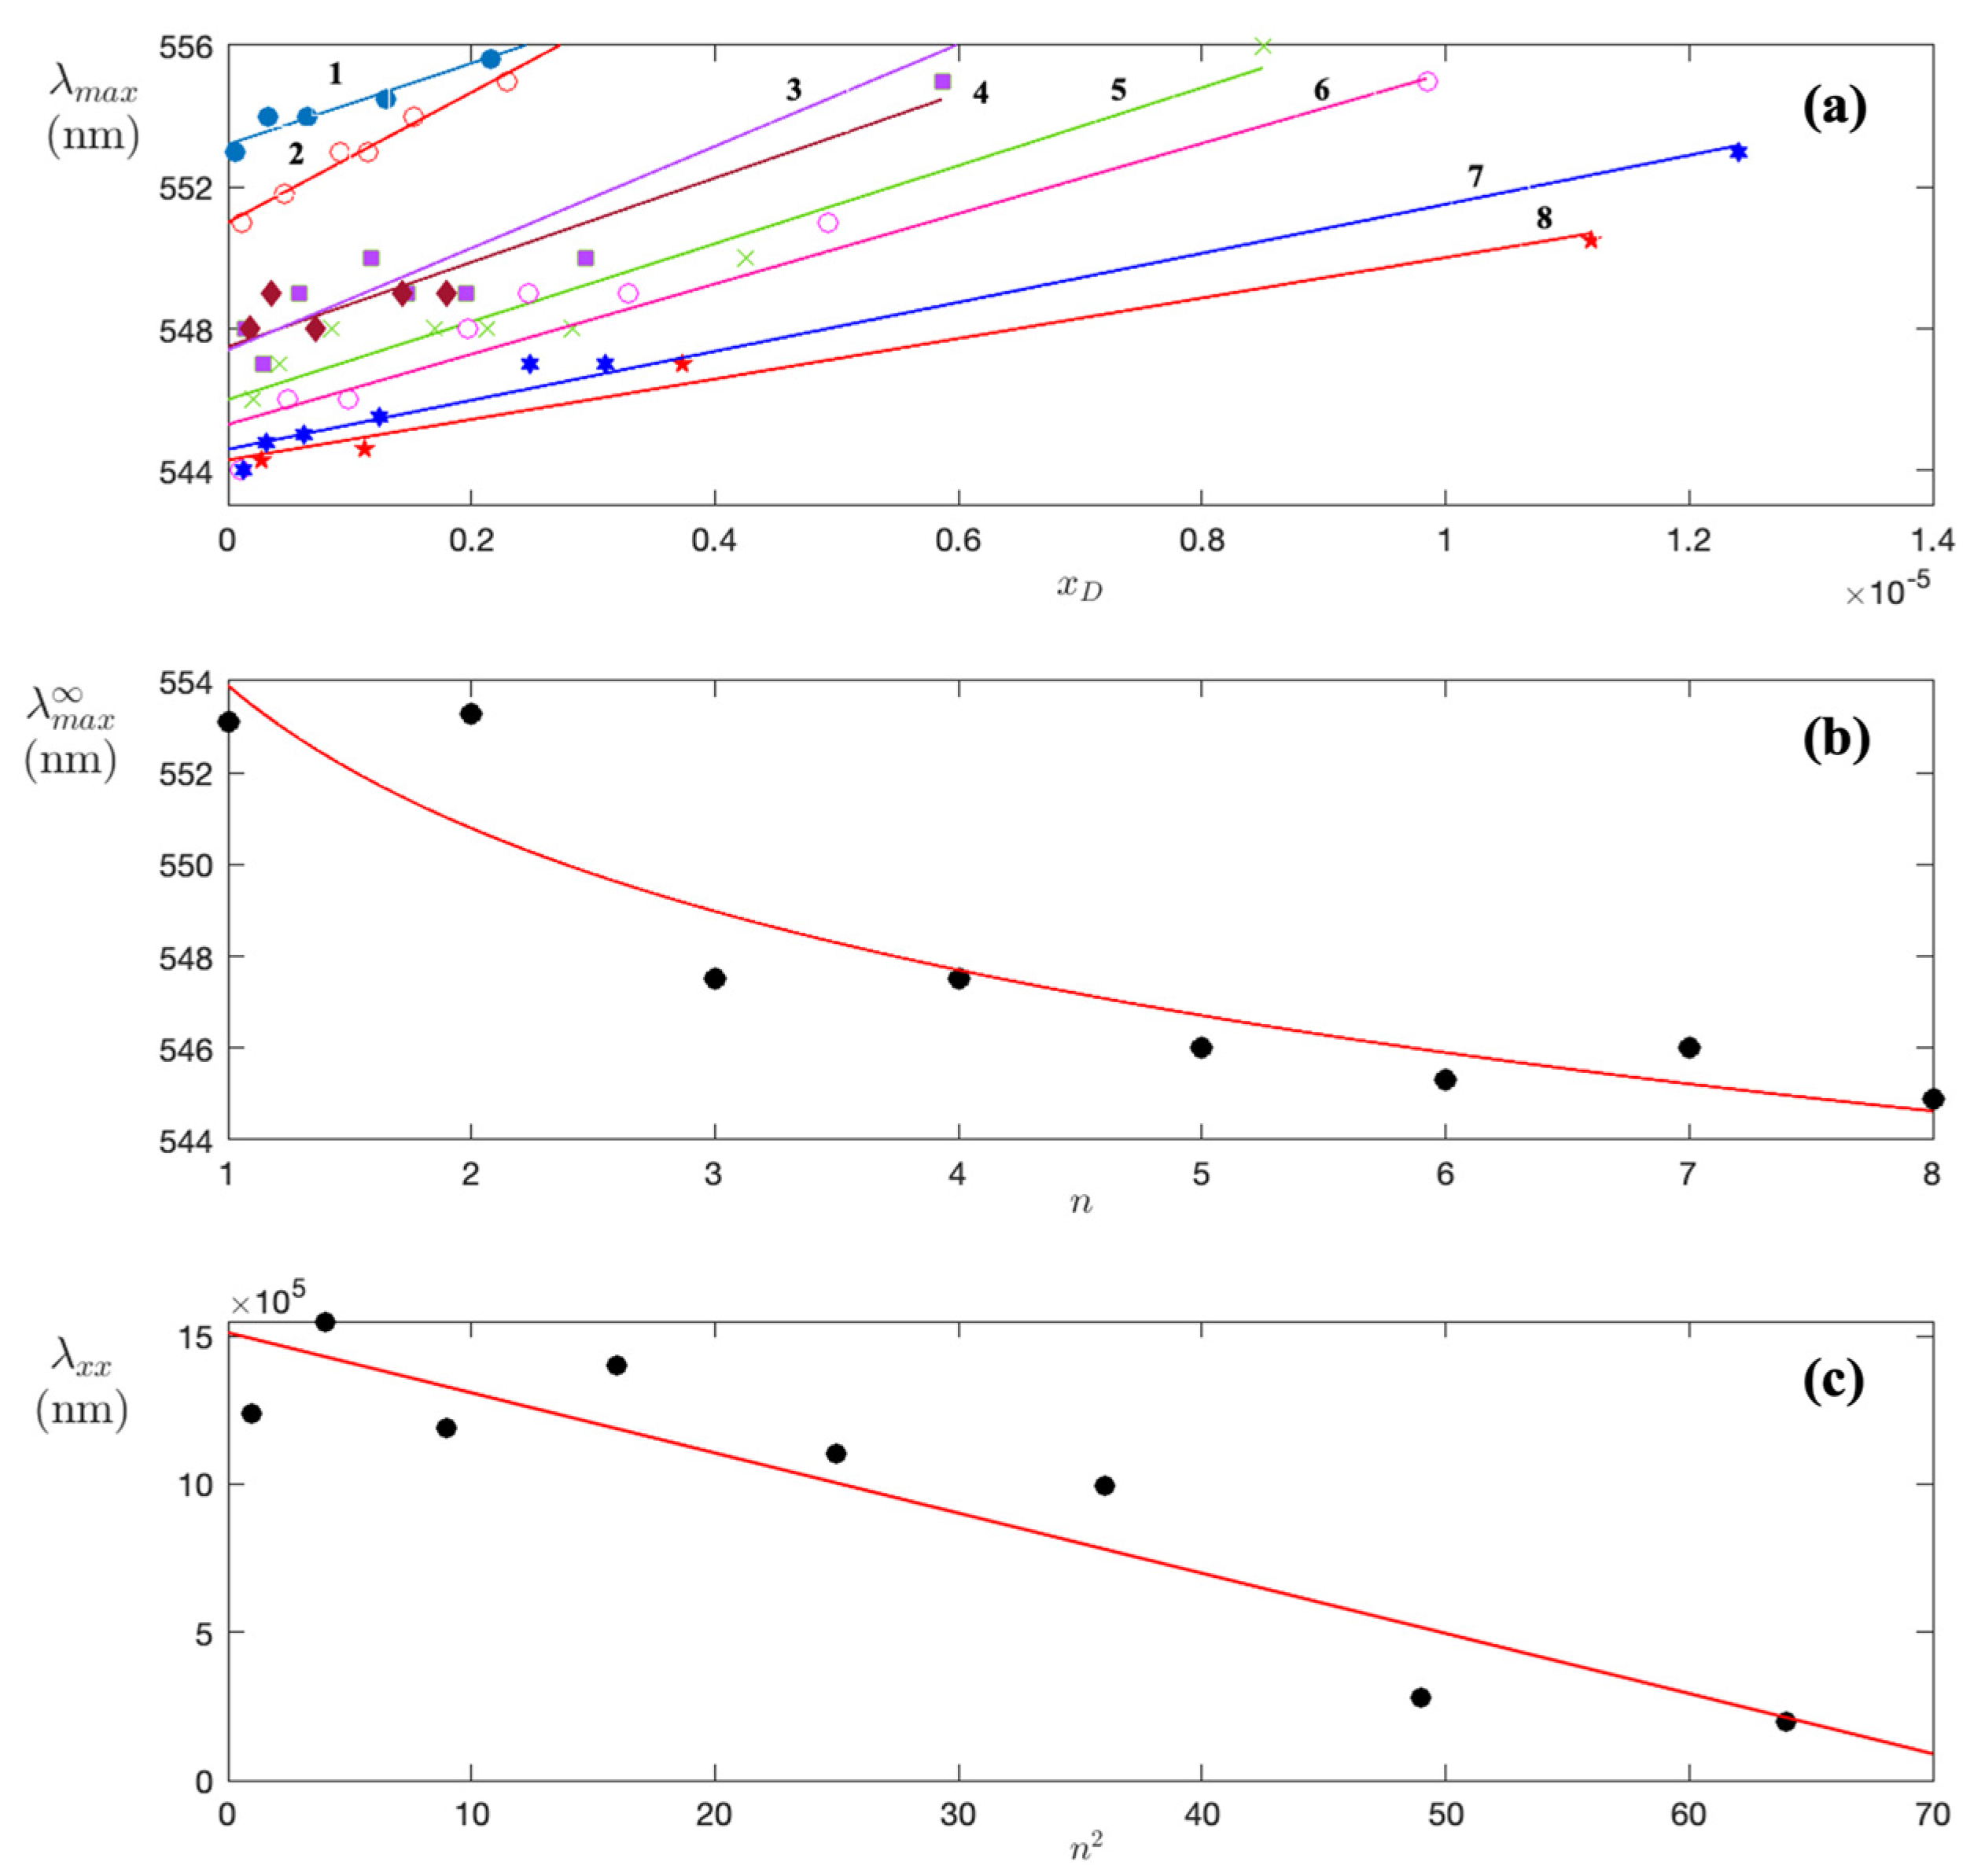
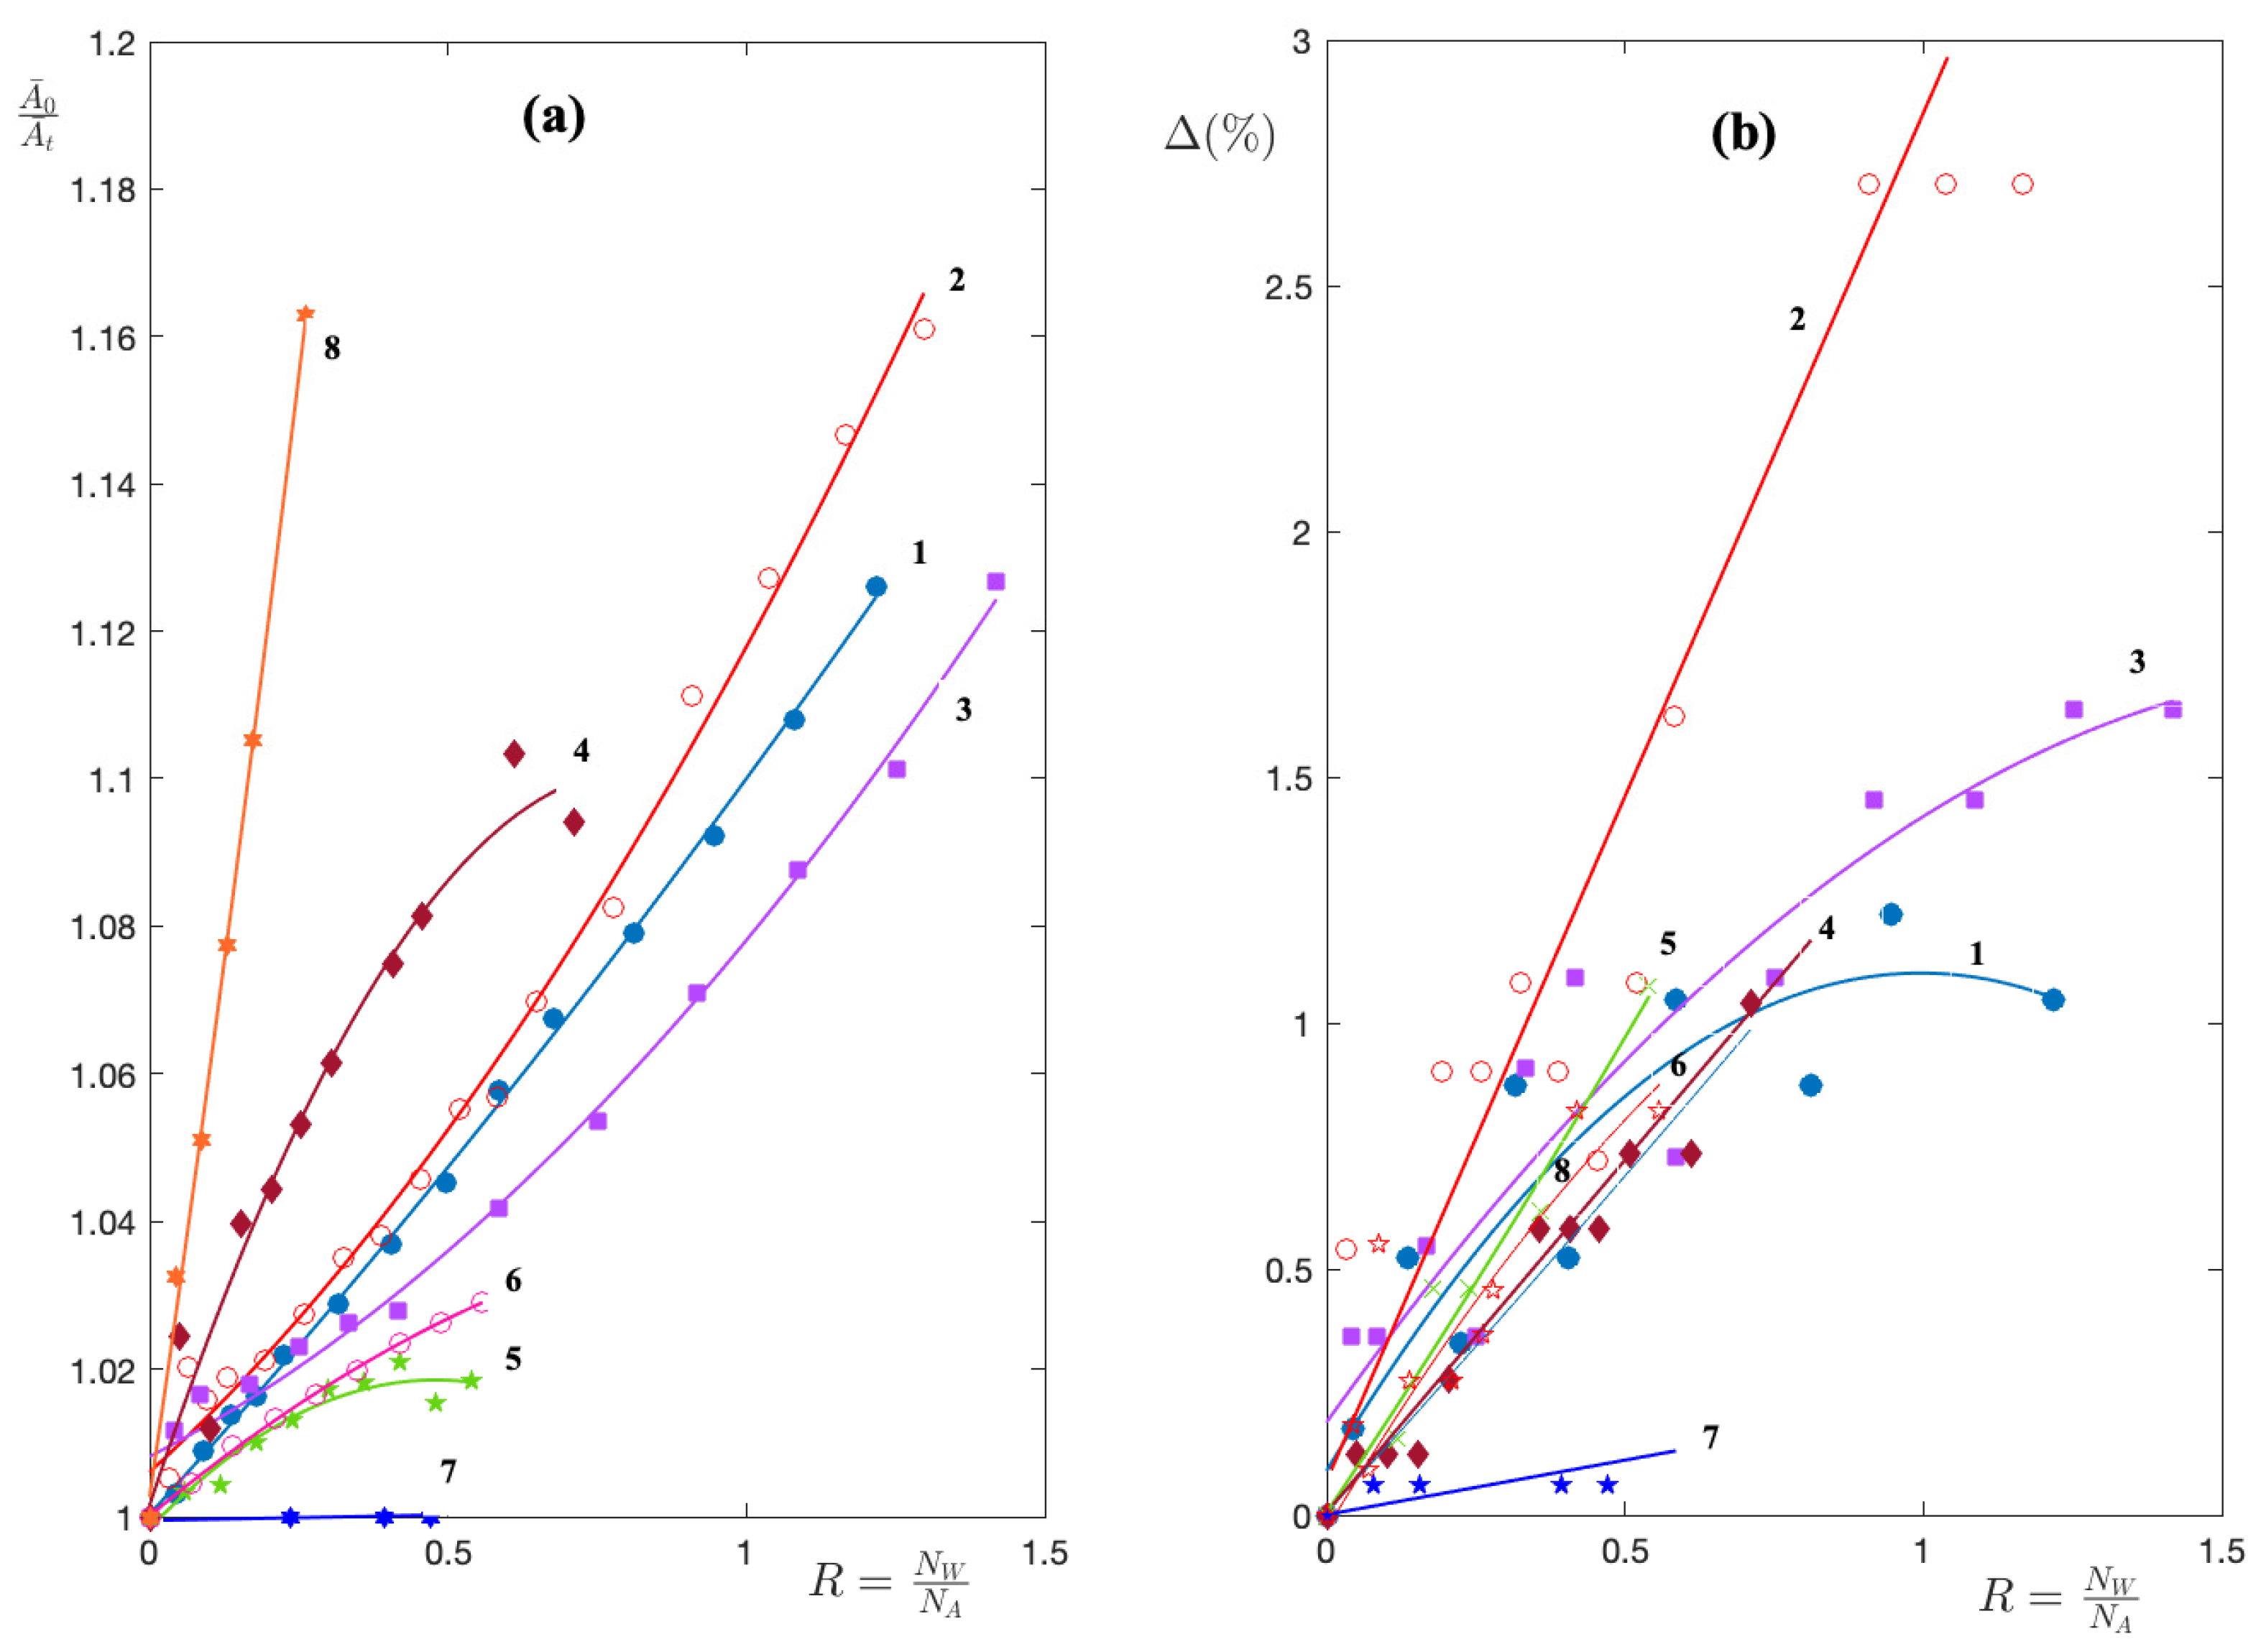
4.1. Absorption in Binary and Ternary Systems

4.1.1. Binary Systems

Figure 1 shows NR absorption spectra recorded in H−(CH2)n−OH (n = 1–8) solutions at different dye concentrations. The complexity of the spectra is related to alkan-1ols–dye and dye–dye interactions, which trigger multiple transitions in the orbitals of the dye molecule. We focus our attention on absorption peaks in the 400–700 nm wavelength range corresponding to π π * transitions of the electron density delocalized over the whole molecule [27]. A careful inspection of the absorption spectra reveals that with an increasing NR concentration, no new band arises. On the contrary, in alkanes [28], with the same number of carbon atoms, NR was found to exhibit two sharp absorption peaks centered at 485 and 510 nm [29]. This different spectroscopic response suggests a direct involvement of the solvent in the electron transition process. Although increasing the NR concentration does not produce a new band, the absorption spectrum becomes broad, and the absorbance values, with a variation in concentrations, deviate from Beer’s law. This aspect is well represented in Figure 2a, where the curves A ¯ ( x D ) are markedly non-linear. In the literature, it is stressed that the absorption spectrum of NR in methanol follows Beer’s law [30]; however, the authors analyze the absorption spectra of NR at much lower molar concentrations than those used in this study.
Here, it is underlined that the deviation from Beer’s law may be attributed to the formation of dimers. Therefore, Equation (20) is used to calculate the equilibrium constant by the procedure employed in the “Theoretical Aspects” section. The results shown in Figure 2a fit the experimental data with a correlation coefficient of R2 = 0.98–0.99. Figure 2b displays the calculated constants as a function of the number of carbon atoms in the alkan-1ol, n. As one can see, the function K(n) increases up to n = 3, then decreases. Furthermore, the curve is quite symmetrical, and by a trial-and-error procedure, the best fit to the data turned out to be:
K · 10 4 = 8.76 e x p [ ( n 3.34 3.06 ) 2 ]
It is well known that alkan-1ol molecules produce both a direct solvent field effect and an indirect geometry effect [31]. The equilibrium constants are the juxtaposition of these two effects, and the maximum in Figure 2b indicates that the alcohol hydrophilicity plays an important role in the association process. Furthermore, it is interesting to note that for n = 0 and Equation (21) gives K = 2.7 × 10⁴, which agrees with the values in water determined with a chemometric method [32].
The chemical structure of NR, i.e., 9-(diethylamino)-5H-benzo[α]phenoxazine-5-one (scheme (A1) in Figure 3), consists of a rigid aromatic group and an exocyclic diethylamine group. The diethylamino group is free to rotate around the single N−C bond so that the NR molecule can assume a conformation suitable for delocalizing the lone pair of electrons from the nitrogen atom in the aromatic moiety. Due to the high electron density, plane-by-plane stacking would cause a strong repulsion between the aromatic electrons, resulting in an unstable configuration. On the contrary, a head-to-tail arrangement can be stabilized by the alkan-1ol molecules. Moreover, as the hydrocarbon chain of an alkanol gets larger, the compound begins to look more like an alkane, the steric hindrance increases, and the attraction between the solvent molecules becomes significant. Under these conditions, the dimer is less stable, and the equilibrium constant is reduced. It is noteworthy that, from thermodynamic studies on alkanol and diols, it was established that the hydrophilic character of the OH group extends to the first three neighboring carbon atoms [33].
This study was conducted by assuming the function λ m a x ( x D ) to be analytic, i.e., it can be represented as a power series:
λ m a x = λ m a x + λ x x x D +
where λ m a x is the value of λ m a x at infinite dilution and represents the contribution to the shift due to the alkanol–NR interactions. The coefficient λ x x = d λ m a x d x D is the contribution due to NR–NR interactions. Figure 4a shows that the first two terms of the series are sufficient to correctly describe the experimental results. Furthermore, the parameter λ m a x is plotted as a function of n in Figure 4b.
It decreases with n 0.5 , according to the equation:
λ m a x = 537.4 + 22.3 n + 1
Equation (23) suggests that the medium may exert a dual effect on the spectrophotometric behavior of NR. For n , i.e., a perfectly hydrophobic environment, λ m a x = 537.4 nm, and for n = 0 = λ m a x = 559.7 nm. In other words, the change in medium produces a maximum shift of 22.3 nm. This behavior can be rationalized bearing in mind that short-chain alkan-1ols have a purely hydrophilic (polar) character, on the contrary, long-chain alkan-1ols are practically apolar. Results seem to show that the excited state is less stabilized by a hydrophobic environment, from which we can assume that maybe the excited state is more polar than the ground state. Concerning dye–dye interactions, the inspection of Figure 4c reveals that λ x x > 0, for all the alkan-1ols investigated, namely λ m a x increases with the NR concentration.

4.1.2. Ternary Systems

In order to modulate the hydrophilicity of the solvent, suitable NR-Alkanol-water ternary systems were prepared by adding fixed volumes of ultrapure water to 1 mL of NR-alkanol binary solution. The hydrophilicity of the medium was measured by parameter R, defined as:
R = N W N A
where N W and N A are water and alcohol moles, respectively. Indeed, R = 0 identifies the starting binary system which was taken as a reference for the relative integral absorbances, A ¯ / A ¯ 0 . As one can see in Figure 5, for all alkanols A ¯ / A ¯ 0 < 1, the addition of water reduces the integral absorbance.
In order to show such reduction is not the only result of the dilution of the chromophore, we make use of the absorbance definition to write:
A ¯ t A ¯ 0 = ϵ t ϵ 0 C t C 0     ϵ t ϵ 0 1 1 + R V ¯ W V ¯ A
where C0 and Ct are the NR concentrations in the binary and ternary systems, and ϵ 0 and ϵ t are the average molar extinction coefficients in the binary and ternary systems, respectively. In Equation (25), the fact that the dye concentration is very low was made use of. If the reduction were due only to the dilution, being ϵ 0 = ϵ t , Equation (25) would imply A ¯ 0 / A ¯ t = 1 + R V ¯ W V ¯ A , i.e., a linear plot of A ¯ 0 / A ¯ t vs. R. On the contrary, experimental data exhibit marked curvature, as can be seen in Figure 5a. The interaction of NR in the hydrophilic environment was further investigated by monitoring the mean percentage increase of λ m a x , compared to the binary system, i.e.,
Δ ( % ) = [ λ m a x ( t e r n a r y   s y s t e m ) λ m a x ( b i n a r y   s y s t e m )   λ m a x ( b i n a r y   s y s t e m ) ] 100
Experimental results displayed in Figure 5b clarify that ∆(%) increases by adding water. Thus, an increase in the solvent hydrophilicity corresponds to an increase in the red shift.
This increase is greater in short-chain alkanols and indeed reaches 3% in methanol, but remains almost zero in heptan-1ol and octan-1ol. In short-chain n-alkanols, the hydrophobic attraction is practically absent; the interaction with the water molecules stabilizes the excited state of NR. For long-chain n-alkanols, the attraction between the individual molecules is greater than the attraction with the water molecules, resulting in a marked hydrophobic effect and a reduced stabilizing effect on the excited state of NR.

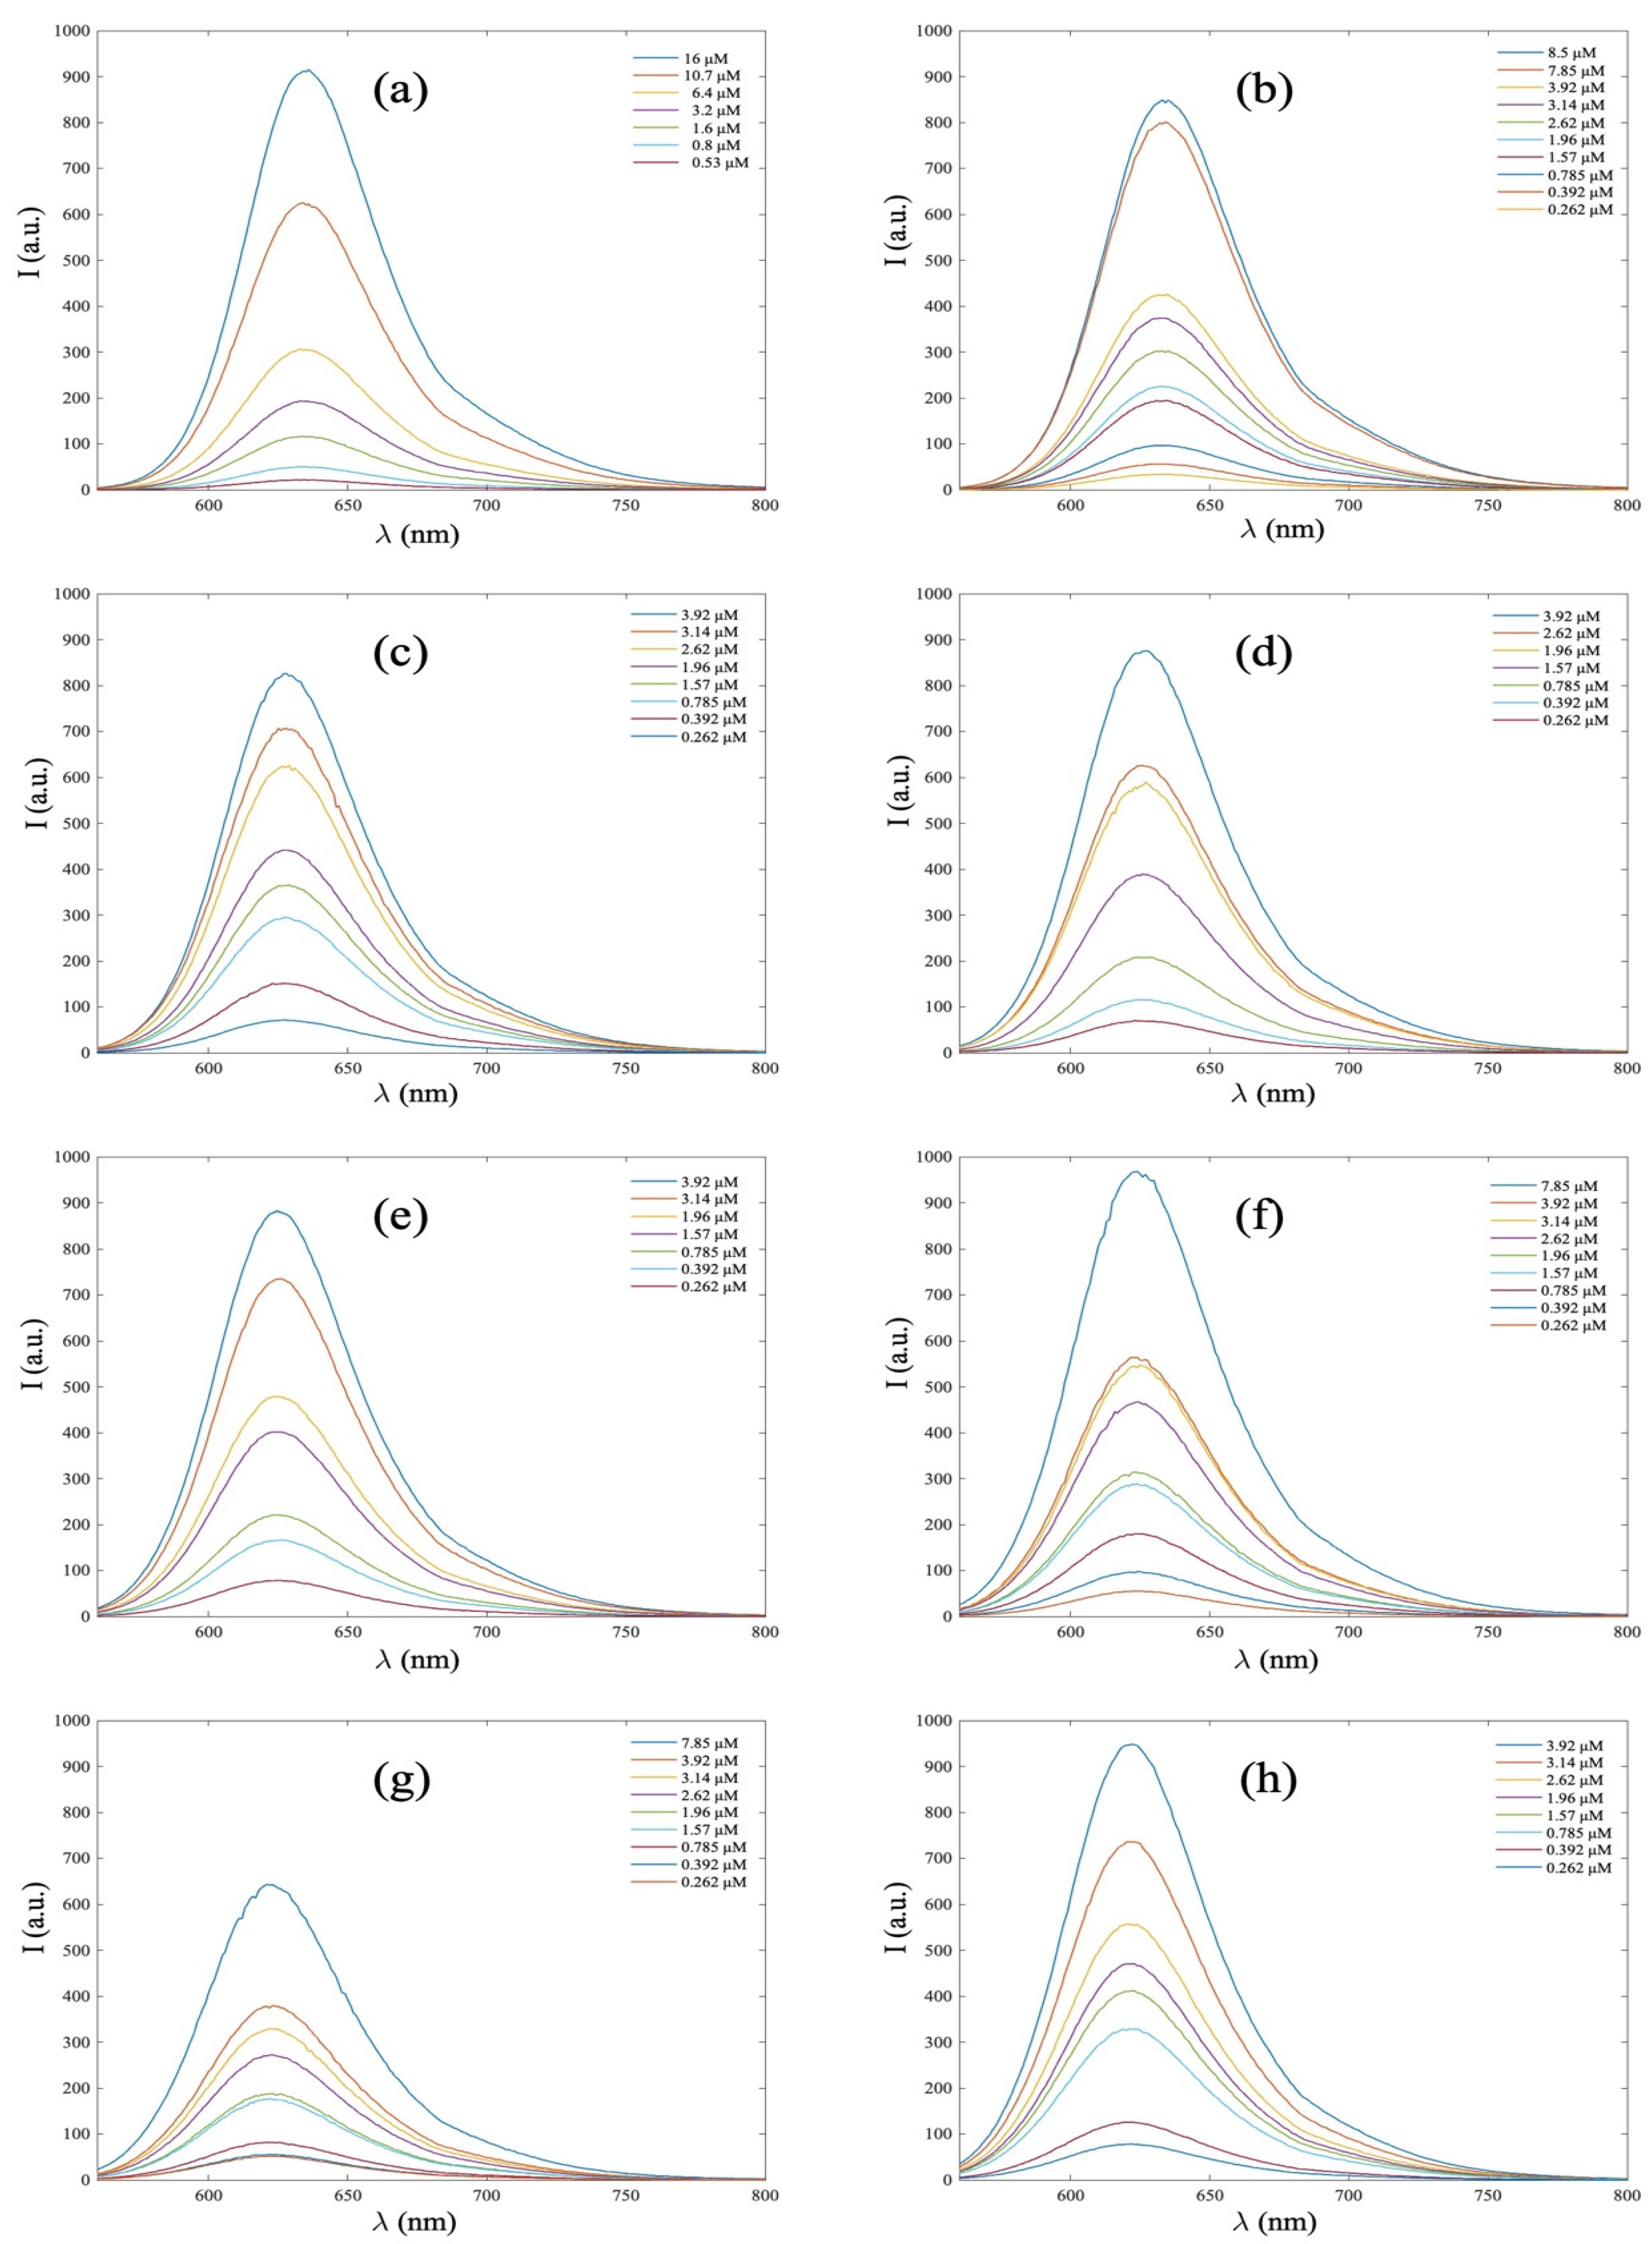
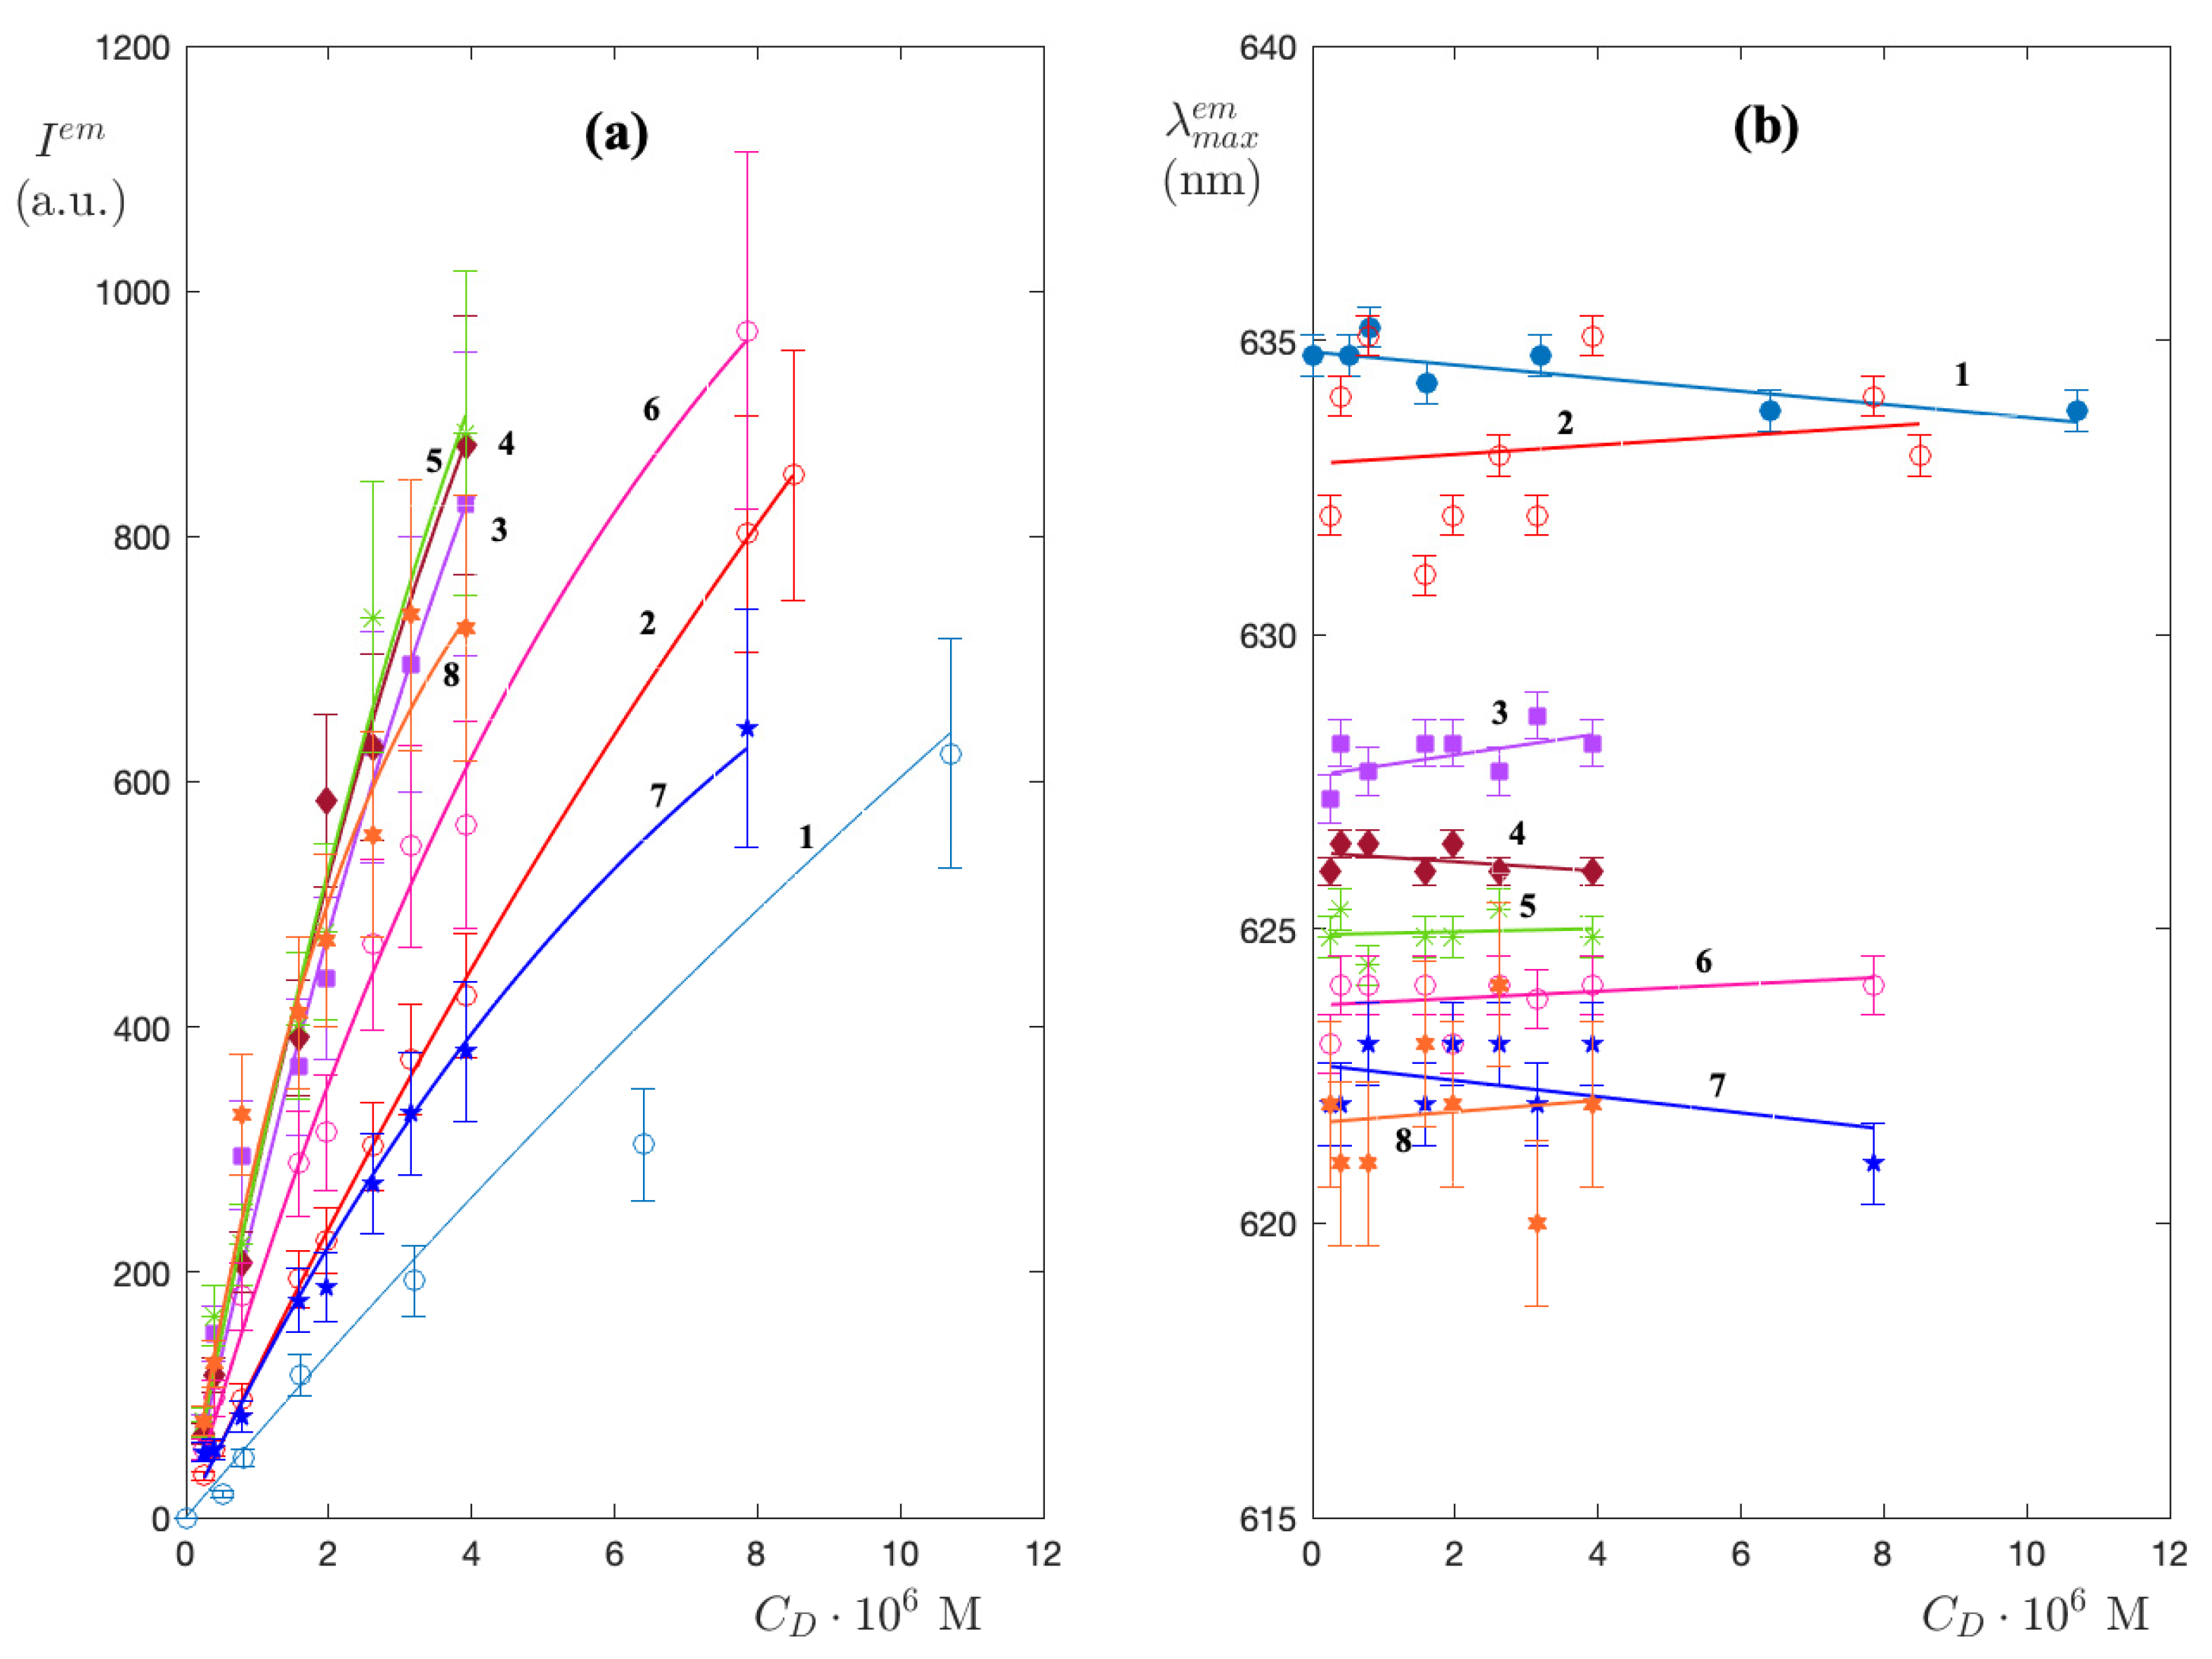
4.2. Static Fluorescence in Binary and Ternary Systems

4.2.1. Binary Systems

As observed for NR dissolved in alkanes [28], for alkan-1-ols, we also experienced a substantial overlap between the absorption and emission bands. Figure 6 displays the fluorescence emission spectra of NR in H−(CH2)n−OH (n = 1–8) at various concentrations, recorded at 25 °C ( λ e x = 540 nm). It should be noted that, to avoid saturation of the fluorescence signal, the measurements were performed on more dilute NR solutions [0.2, 16] μM. The area under the emission band, I e m , and maximum wavelength, λ m a x e m , were extracted from each spectrum and plotted as a function of dye concentration, C D , in Figure 7a,b.
In Figure 7a it is apparent that I e m ( C D ) increases non-linearly. This may be due, on the one hand, to the attenuation of the light flux through an absorbing solution and, on the other hand, to the difference between the area illuminated by the exciting light and the working area from which the fluorescence is collected. This latter effect is purely instrumental, so it produces a systematic change in all measurements. On the contrary, attenuation depends on the ability to absorb, which is connected to the polarity of the medium. Theoretical studies [34] have established that, due to attenuation, the fluorescence intensity, F, can be quantitatively determined using the following equation:
F = F 0 e x Φ f · ( 1 10 ϵ C D )
where F 0 e x is the exciting light intensity, Φ f is the fluorescence quantum efficiency, ϵ is the molar extinction coefficient, is the cell pathlength.
Accordingly, we analyzed the experimental results in terms of nonlinear models:
I e m = Γ ( 1 10 b Δ C D )
where adjustable parameters Γ and b were computed by a Levenberg–Marquardt procedure. The curves displayed in Figure 7a with an average correlation coefficient of R 2 = 0.98 indicate that Equation (28) is a good model for experimental results. Figure 7b reveals that λ m a x e m remains practically constant, at 0 < C D ≤ 10 μM, in all analyzed samples. Figure 7b shows that λ m a x e m varies slightly with max dye concentration, while it shifts markedly to shorter wavelength with an increase in the number of carbon atoms in the alkanol. In order to relate these macro-effects to the molecular properties of the system, Γ and b were plotted as a function of n, as can be seen in Figure 8. As one can see, both parameters are strongly related to the number n, albeit in the opposite way. In particular, Γ tends to decrease with n, while b increases. The solvent hydrophobicity grows when going from methanol to octanol, reducing the NR’s ability to stabilize the excited state. Accordingly, the number of NR molecules in the excited state decreases ( Γ reduction) and, at the same time, the average absorption coefficient increases (b growth).

4.2.2. Ternary Systems

Figure 9 shows Δ (%) as a function of R for all alkan-1ols investigated. Two important aspects emerge from this figure. First, for all the experimental data of the mixtures, Δ (%) > 0, namely in the ternary system, the emission wavelength is always longer. Second, the parameter Δ (%) exhibits a conspicuous maximum. For methanol and ethanol, the maximum falls in the range R > 1, while for other alkanols, the maximum is in R < 1 and decreases as n increases along the alkanol chain.
It is well established that longer wavelengths are recorded when the excited state is more polar as compared to the ground state, so that a polar solvent stabilizes the excited state more than the ground state. The shorter wavelengths are produced when the ground state is more polar than the excited state. The presence of a maximum in the plot of Figure 9 shows that the ground state polarity in NR molecules is heavily dependent on the molecular ratio N W / N A . Since the polarity of the solvent increases with R, we deduce that the hydrophobicity of the medium also has a decisive contribution.
To further analyze the influence of the solvent on the emission wavelength shift, the λ m a x e m values displayed in Figure 7 were extrapolated to water infinite dilution and compared with the corresponding values measured in the binary systems in the complete absence of water. Results are shown in Figure 10 as a function of n on a logarithmic scale; the same plot also shows λ m a x e m values measured in the ternary systems with 4 and 8% (v/v) of water. It is immediately noted that the extrapolated values (black curve) and the values measured in the binary system (red curve) are practically coincident within the experimental error. This experimental observation ensures that the NR molecules exposed to water do not undergo irreversible conformational changes. In other words, alkanol and water can be considered a “pure solvent” whose molecular characteristics are composition averages. As one can see in Figure 10, the reduction in λ m a x e m is drastically reduced, with the same n, if measured in the presence of 4 or 8% (v/v) of water. On the other hand, it is well known that when the fluorescent is bound to the π electron system through an H-bond, the fluorescence emission is quenched or enhanced, depending on whether the H-bond can conjugate directly with the π electron system or not [35]. Accordingly, reduction of λ m a x e m ongoing from a non-polar solvent to a polar solvent implies a partial fixation of the non-bonding electron by the intermolecular H-bonding.

5. Conclusions

Considering the outstanding role of the partitioning of hydrophobic solutes between water and nonpolar solvents in terms of energy cost and applicable processes, this study tries to give experimental inputs regarding the partitioning of Nile Red in different solvents. By varying the length of n-alkanes, differently hydrophilic environments have been created where the NR dye is soluble. In non-aqueous solutions, the integral absorbance of the individual measures shows a deviation from Beer’s law. However, the experimental functions show very slight curvature, making data-fitting difficult. Based on the idea that dye–solvent and dye–dye interactions determine two molecular states with specific contributions to the absorption band, the procedure converges rapidly because it identifies fixed points on the experimental curve. The NR dimerization equilibrium constant, K, in the first eight n-alkanols was calculated. The equilibrium constant plotted as a function of n shows a Gaussian trend centered around n = 3, indicating that the hydrophilicity extent of the medium assists the NR molecules in the aggregation process. Indeed, the chemical structure of the NR molecule includes a basic di-amino nitrogen atom and an acidic quinone-oxygen atom, which result in a charge-separating conformer (twisted intramolecular transfer). This conformer is more stabilized by short-chain alkanols due to their greater ability to create H-bonds. On the contrary, the longer-chain alkanols tend to form micelles due to the hydrophobic effect, thus increasing the steric hindrance and reducing the ability to form H-bonds. The spectra of NR in all n-alkanols investigated show a red shift at the absorption peak at 550 nm as the NR concentration increases. This shift is studied by analyzing the contribution to infinite dilution and the initial increase for each n-alkanol. λ m a x decreases exponentially with n, i.e., the hydrophobic n-alkanols interact with NR molecules by reducing the red shift. The term λ x x , due to the finite concentration of dye, decreases linearly with n 2 . Hence, the hydrophobicity of alkanol significantly reduces the red shift of the NR absorption band. The role of the medium hydrophilicity on the NR spectroscopic response was further investigated by adding constant volumes of pure water to the single NR-alkanol binary systems. In order to quantify the hydrophilicity, the parameter R, defined as the ratio of water molecules to alkanol molecules, is introduced. The integral absorbance measured, relative to the condition of the binary system without water, decreases significantly. Furthermore, the average percentage increase undergoes a significantly greater increase if the alkanol is hydrophilic; on the contrary, the increase is very mild if the alkanol is hydrophobic. Fitting the area below the emission band allowed for the determination of the Γ and b parameters. They are related to the quantum yield and the molar extinction coefficient of NR molecules. The Γ parameter is found to decrease with n, while b increases. This suggests that long-chain alkanols poorly stabilize the excited state of NR and reduce fluorescence. The introduction of water to the binary system NR-alkanol causes a decrease in fluorescence.

Author Contributions

Conceptualization, L.A. and A.M.; methodology, L.A., A.M., G.C. and F.L.; software, L.A.; validation, L.A., A.M. and F.L.; formal analysis, L.A.; investigation, A.M. and G.C.; data curation, L.A. and A.M.; writing—original draft preparation, L.A. and A.M; writing—review and editing, L.A; visualization, A.M.; G.C.; supervision, L.A.; project administration, L.A.; funding acquisition, L.A. All authors have read and agreed to the published version of the manuscript.

Funding

This research received no external funding.

Acknowledgments

CSGI (Centre for Colloid and Surface Science) is acknowledged.

Conflicts of Interest

The authors declare no conflict of interest.

References

  1. Sarkar, N.; Das, K.; Nath, D.N.; Bhattacharyya, K. Twisted charge transfer processes of nile red in homogeneous solutions and in faujasite zeolite. Langmuir 1994, 10, 326–329. [Google Scholar] [CrossRef]
  2. Greenspan, P.; Lou, P. Spectrofluorometric studies of nile red treated native and oxidized low density lipoprotein. Int. J. Biochem. 1993, 25, 987–991. [Google Scholar] [CrossRef] [PubMed]
  3. Brown, W.; Sullivan, T.; Greenspan, P. Nile red staining of lysosomal phospholipid inclusions. Histochemisty 1992, 97, 349–354. [Google Scholar] [CrossRef] [PubMed]
  4. Trappmann, B.; Ludwing, K.; Radowski, M.R.; Shukla, A.; Mohr, A.; Rehage, H.; Bottcher, C.; Haag, R. A new family of nonionic dendritic amphiphiles displaying unexpected packing parameters in micellar assemblies. J. Am. Chem. Soc. 2010, 132, 11119–11124. [Google Scholar] [CrossRef]
  5. Datta, A.; Mandal, D.; Pal, S.K.; Bhattacharyya, K. Intramolecular charge transfer processes in confined systems. Nile red in reverse micelles. J. Phys. Chem. B 1997, 101, 10221–10225. [Google Scholar] [CrossRef]
  6. Watkins, D.M.; Sayed-Sweet, Y.; Klimash, J.W.; Turro, N.J.; Tomalia, D.A. Dendrimers with hydrophobic cores and the formation of supramolecular dendrimer-surfactant assemblies. Langmuir 1997, 13, 3136–3141. [Google Scholar] [CrossRef]
  7. Fleige, E.; Ziem, B.; Grabolle, M.; Haag, R.; Resch-Genger, U. Aggregation phenomena of host and guest upon the loading of dendritic core-multishell nanoparticles with solvatochromic dyes. Macromolecules 2012, 45, 9452–9459. [Google Scholar] [CrossRef]
  8. Kurniasih, I.N.; Liang, H.; Kumar, S.; Mohr, A.; Sharma, S.K.; Rabe, J.P.; Haag, R. A bifunctional nanocarrier based on amphiphilic hyperbranched polyglycerol derivatives. J. Mater. Chem. B 2013, 1, 3569–3577. [Google Scholar] [CrossRef]
  9. Mukherjee, S.; Raghuraman, H.; Chattopadhyay, A. Membrane localization and dynamics of nile red: Effect of cholesterol. Biochim. Biophys. Acta Biomembr. 2007, 1768, 59–66. [Google Scholar] [CrossRef] [Green Version]
  10. Sloniec, J.; Schnurr, M.; Witte, C.; Resch-Genger, U.; Schröder, L.; Hennig, A. Biomembrane interactions of functionalized cryptophane-a: Combined fluorescence and 129xe nmr studies of a bimodal contrast agent, Chem. Eur. J. 2013, 19, 3110–3118. [Google Scholar] [CrossRef]
  11. Sackett, D.L.; Wolff, J. Nile red as a polarity-sensitive fluorescent probe of hydrophobic protein surfaces. Anal. Biochem. 1987, 167, 228–234. [Google Scholar] [CrossRef] [PubMed]
  12. Hawe, A.; Sutter, M.; Jiskoot, W. Extrinsic fluorescent dyes as tools for protein characterization, Pharm. Res. 2008, 25, 1487–1499. [Google Scholar] [CrossRef] [Green Version]
  13. Carmichael, A.J.; Seddon, K.R. Polarity study of some 1-alkyl-3-methylimidazolium ambient-temperature ionic liquids with the solvatochromic dye, nile red. J. Phys. Org. Chem. 2000, 13, 591–595. [Google Scholar] [CrossRef]
  14. Michel, R.; Gradzielski, M. Experimental aspects of colloidal interactions in mixed systems of liposome and inorganic nanoparticle and their applications. IJMS 2012, 13, 11610–11642. [Google Scholar] [CrossRef] [Green Version]
  15. Sabın, J.; Prieto, G.; Ruso, J.M.; Hidalgo-Alvarez, R.; Sarmiento, F. Size and stability of liposomes: A possible role of hydration and osmotic forces. EPJE 2006, 20, 401–408. [Google Scholar] [CrossRef]
  16. Cuomo, F.; Palazzo, G.; Ceglie, A.; Lopez, F. Quenching efficiency of pyrene fluorescence by nucleotide monophosphates in cationic micelles. J. Photochem. Photobiol. 2009, 202, 21–27. [Google Scholar] [CrossRef]
  17. Lopez, F.; Venditti, F.; Ambrosone, L.; Colafemmina, G.; Ceglie, A.; Palazzo, G. Gelatin Microemulsion-Based Gels with the Cationic Surfactant Cetyltrimethylammonium Bromide:  A Self-Diffusion and Conductivity Study. Langmuir 2004, 20, 9449–9452. [Google Scholar] [CrossRef]
  18. Sacco, P.; Furlani, F.; Cok, M.; Travan, A.; Borgogna, M.; Marsich, E.; Paoletti, S.; Donati, I. Boric Acid Induced Transient Cross-Links in Lactose-Modified Chitosan (Chitlac). Biomacromolecules 2017, 18, 4206–4213. [Google Scholar] [CrossRef]
  19. Cuomo, F.; Mosca, M.; Murgia, S.; Avino, P.; Ceglie, A.; Lopez, F. Evidence for the role of hydrophobic forces on the interactions of nucleotide-monophosphates with cationic liposomes. J. Colloid Interface Sci. 2013, 410, 146–151. [Google Scholar] [CrossRef]
  20. Henkel, S.; Misuraca, M.C.; Troselj, P.; Davidson, J.; Hunter, C.A. Polarization effects on the solvation properties of alcohols, Chem. Sci. 2018, 9, 88–99. [Google Scholar] [CrossRef]
  21. Di Nezza, F.; Guerra, G.; Costagliola, C.; Zeppa, L.; Ambrosone, L. Thermo-dynamic properties and photodegradation kinetics of indocyanine green in aqueous solution. Dyes. Pigm. 2016, 134, 342–347. [Google Scholar] [CrossRef]
  22. Abbott, L.C.; Batchelor, S.N.; Oakes, J.; Lindsay-Smith, J.R.; Moore, J.N. Spectroscopic studies of the intermolecular interactions of a bis-azo dye, direct blue 1, on di- and trimerization in aqueous solution and in cellulose. J. Phys. Chem. B 2004, 108, 13726–13735. [Google Scholar] [CrossRef]
  23. Kurniasih, I.N.; Liang, H.; Mohr, P.C.; Khot, G.; Rabe, J.P.; Mohr, A. Nile red dye in aqueous surfactant and micellar solution. Langmuir 2015, 31, 2639–2648. [Google Scholar] [CrossRef] [PubMed]
  24. Kataev, E.A.; Shumilova, T.A.; Fiedler, B.; Anacker, T.; Friedrich, J. Under-standing stacking interactions between an aromatic ring and nucleobases in aqueous solution: Experimental and theoretical study. J. Org. Chem. 2016, 81, 6505–6514. [Google Scholar] [CrossRef] [PubMed]
  25. Grob, S.; Hasse, H. Reaction kinetics of the homogeneously catalyzed esterification of 1-butanol with acetic acid in a wide range of initial compositions. Ind. Eng. Chem. Res. 2006, 45, 1869–1874. [Google Scholar] [CrossRef]
  26. Kircher, R.; Schmitz, N.; Berje, J.; Münnemann, K.; Thiel, W.R.; Burger, J.; Hasse, H. Generalized chemical equilibrium constant of formaldehyde oligomerization. Ind. Eng. Chem. Res. 2020, 59, 11431–11440. [Google Scholar] [CrossRef]
  27. Dias Jr, L.C.; Custodio, R.; Pessine, F.B. Investigation of the nile red spectra by semi-empirical calculations and spectrophotometric measurements. Int. J. Quantum. Chem 2006, 106, 2624–2632. [Google Scholar] [CrossRef]
  28. Dutta, A.K.; Kamada, K.; Ohta, K. Spectroscopic studies of nile red in organic solvents and polymers. J. Photochem. Photobiol. A Chem. 1996, 93, 57–64. [Google Scholar] [CrossRef]
  29. Yablon, D.G.; Schilowitz, A.M. Solvatochromism of nile red in nonpolar solvents. Appl. Spectrosc. 2004, 58, 843–847. [Google Scholar] [CrossRef]
  30. Ray, A.; Das, S.; Chattopadhyay, N. Aggregation of nile red in water: Prevention through encapsulation in β-cyclodextrin. ACS. Omega 2019, 4, 15–24. [Google Scholar] [CrossRef]
  31. Tuck, P.O.; Mawhinney, R.C.; Rappon, M. An ab initio and td-dft study of solvent effect contributions to the electronic spectrum of nile red. Phys. Chem. Chem. Phys. 2009, 11, 4471–4480. [Google Scholar] [CrossRef] [PubMed]
  32. Niazi, A.; Yazdanipour, A.; Ghasemi, J.; Kubista, M. Spectrophotometric and thermodynamic study on the dimerization equilibrium of ionic dyes in water by chemometrics method. Spectrochim. Acta A Mol. Biomol. Spectrosc 2006, 65, 73–78. [Google Scholar] [CrossRef] [PubMed]
  33. Ambrosone, L.; Andini, S.; Castronuovo, G.; Elia, V.; Guarino, G. Empirical correlations between thermodynamic and spectroscopic properties of aqueous solutions of alkan-m, n-diols. excess enthalpies and spin–lattice relaxation times at 298.15 k. J. Chem. Soc. Faraday Trans. 1991, 87, 2989–2993. [Google Scholar] [CrossRef]
  34. Guilbault, G.G. Practical Fluorescence; Marcel Dekker: New York, NY, USA, 1990. [Google Scholar]
  35. Reppy, M.A. Structure, emissive properties, and reporting abilities of conjugated polymers. In Advanced Fluorescence Reporters in Chemistry and Biology II; Demchenko, A.P., Ed.; Springer: Berlin/Heidelberg, Germany, 2010; Volume 9, pp. 357–388. [Google Scholar] [CrossRef]
Figure 1. Absorption spectra of NR in (a) Methanol, (b) Ethan-1ol, (c) Propan-1ol, (d) Butan-1ol, (e) Pentan-1ol, (f) Hexan-1ol, (g) Heptan-1ol, and (h) Octan-1ol. The concentrations of the dilutions are in the range of 0.785–160 μ M.
Applsci 13 00638 g001
Figure 2. (a) Integral absorbance of NR in H (CH2)n OH (n = 1 8) solutions as a function of alkanol mole fraction. The number of carbon atoms is shown on each experimental curve. (b) The dimerization constant, calculated by Equation (20), as a function of the number of carbon atoms.
Applsci 13 00638 g002
Figure 3. Chemical structures of NR. (A1) stable conformer without charge separation. (A2) conformer with charge separation stabilized by resonance between diamine nitrogen and oxygen. (A3) possible dimerization of NR molecules via H-bonding with alkanol.
Applsci 13 00638 g003
Figure 4. (a) The wavelength at the maximum of the absorption band in binary systems NR H (CH2)n OH (the n value is read directly on each line) as a function of mole fraction. (b) The wavelength of maximum absorption, extrapolated to infinite dilution as a function of the number of carbon atoms in the alkanol molecule. (c) Slope of the curve λ m a x ( x D ) as a function of the number of carbon atoms squared.
Applsci 13 00638 g004
Figure 5. (a) Normalized integral absorbance as a function of the hydrophilicity index, in ternary systems NR–H–(CH2)n–OH–water (the n value is read directly on each line). (b) Average percentage increase of NR red shift in ternary systems NR–H–(CH2)n–OH–water (the n value is read directly on each line).
Applsci 13 00638 g005
Figure 6. Fluorescence emission spectra of NR in (a) Methanol, (b) Ethan-1ol, (c) Propan-1ol, (d) Butan-1ol, (e) Pentan-1ol, (f) Hexan-1ol, (g) Heptan-1ol, and (h) Octan-1ol. The concentrations of the dilutions are in the range of 0.262–16 μ M.
Applsci 13 00638 g006
Figure 7. (a) Area under the emission band as a function of NR molar concentration. Although the concentration is low, the fluorescence exhibits a non-linear trend. (b) The wavelength of the maximum emission as a function of NR molar concentration.
Applsci 13 00638 g007
Figure 8. Characteristic parameters of fluorescence emission (Equation (28)) as a function of the number of carbon atoms.
Applsci 13 00638 g008
Figure 9. Average percent increase in the red shift of NR fluorescence in the ternary systems NR–n–alkanol–water, as a function of the parameter R. The number on the curves indicates the number of carbon atoms in the alkanol molecule.
Applsci 13 00638 g009
Figure 10. Fluorescence emission values obtained by dissolving NR in alkanols at different carbon numbers H−(CH2)n−OH (n = 1–8) compared with the same samples in the presence of 4% and 8% water.
Applsci 13 00638 g010
Disclaimer/Publisher’s Note: The statements, opinions and data contained in all publications are solely those of the individual author(s) and contributor(s) and not of MDPI and/or the editor(s). MDPI and/or the editor(s) disclaim responsibility for any injury to people or property resulting from any ideas, methods, instructions or products referred to in the content.

