Article

Fusion Segmentation Network Guided by Adaptive Sampling Radius and Channel Attention Mechanism Module for MLS Point Clouds

1
School of Geomatics and Urban Spatial Informatics, Beijing University of Civil Engineering and Architecture, Daxing District, Beijing 102616, China
2
Engineering Research Centre of Representative Building and Architectural Heritage Database, Ministry of Education, Beijing 100044, China
3
Key Laboratory of Modern Urban Surveying and Mapping, National Administration of Surveying, Mapping and Geoinformation, Beijing 100044, China
4
Beijing Key Laboratory of Building Heritage Fine Reconstruction and Health Monitoring, Beijing 102616, China
5
School of Economics and Management, Hubei University of Technology, Wuhan 430068, China
*
Author to whom correspondence should be addressed.
Appl. Sci. 2023, 13(1), 281; https://doi.org/10.3390/app13010281
Submission received: 19 November 2022 / Revised: 9 December 2022 / Accepted: 21 December 2022 / Published: 26 December 2022
(This article belongs to the Special Issue Lidar Technology and Application)

Abstract

:
Road high-precision mobile LiDAR measurement point clouds are the digital infrastructures for high-precision maps, autonomous driving, digital twins, etc. High-precision automated semantic segmentation of road point clouds is a crucial research direction. Aiming at the problem of low semantic segmentation accuracy of existing deep learning networks for inhomogeneous sparse point clouds of mobile LiDAR system measurements (MLS), a deep learning method that adaptively adjusts the sampling radius of region groups according to the point clouds density is proposed. We construct a deep learning road point clouds dataset based on a self-developed mobile LiDAR system to train and test road point clouds semantic segmentation. The overall accuracy of the method for road point clouds segmentation is 98.08%, with an overall mIOU of 0.73 and mIOUs of 0.99, 0.983, 0.99, 0.66, and 0.51 for roads, guardrails, signs, streetlights, and lane lines, respectively. The experimental result shows that the method can achieve more accurate segmentation for inhomogeneous sparse road point clouds of mobile LiDAR systems. Compared with the existing methods, the segmentation accuracy is significantly improved.

1. Introduction

Fast and accurate semantic segmentation of point clouds data of mobile LiDAR systems (MLS) is an essential foundation for smart cities, digital twins, and other fields [1,2]. Mobile LiDAR systems (MLS) can rapidly collect point clouds data around roads [3,4,5]. These point clouds data have a wide range of applications: deformation monitoring [6], architectural heritage preservation [7], urban planning [8], and autonomous driving [9] are the most common areas of their use, and efficient and accurate semantic segmentation is a significant challenge in future research.
The point clouds data of the road scene scanned by MLS at high speed is not as dense and uniform as the indoor point clouds data. A large amount of missing and noise in the road point clouds data during the high-speed scanning process because when LiDAR scans the data, it is sparse in the distance and dense in the near. The data collection work under different vehicle speeds causes the inhomogeneous of the point clouds data of different road sections, (as in Figure 1). MLS can quickly acquire the surrounding feature point clouds data, but the amount acquired is huge, and the time required for manual processing is long. Therefore, how to solve the problem of automatic segmentation of road scenes with a large number of inhomogeneous sparse point clouds data has become a current trend for research.
At the beginning of the study, researchers tried to apply traditional machine learning methods to solve the problem of road point clouds segmentation, which requires designing manual features, such as geometric features, topological features, etc., and then using support vector machines, conditional random fields, and random forests for point clouds segmentation. However, these manual features require a priori knowledge and are not ideal for point clouds segmentation.
With the advancement of technical methods and the incredible popularity of convolutional neural networks (CNNs) for 2D target recognition, more researchers have extended deep learning to 3D [10]. However, CNNs cannot be directly applied to the analysis of point clouds data because the unstructured nature of 3D point clouds is not the same as 2D images. Before the emergence of Pointnet [11], there were roughly three deep learning models applied to point clouds: the voxel model based on 3DCNN [12], mapping point clouds to 2D space using CNNs for classification [13], and using standard artificial features such as normal vectors, local pump density, and local curvature.
After the emergence of Pointnet, which directly implemented the end-to-end learning process of point clouds, the emergence of Pointnet++ [14] improved the sampling method. With the success of Pointnet [11] and Pointnet++ [14], a series of network structures were proposed for solving the problem of automatic point clouds segmentation, such as Pointconv [15], PointSIFT [16], PointCNN [17], etc. Deep learning networks based on Pointnet++ [14] are used to solve the problems of 3D point clouds classification and semantic segmentation of scenes, which have widely influenced the automatic point clouds segmentation field.
Although Pointnet++ [14] and other derived network models performed well for various tasks, they are still quite challenging for applications in the semantic segmentation of road scenes with large-scale inhomogeneous sparse point clouds. Inspired by the Pointnet++ [14] network, we propose a new end-to-end approach to exploit road point clouds data that achieves high segmentation accuracy in inhomogeneous sparse MLS road point clouds data. To train the model, we produce a high-speed road point clouds dataset of a mobile measurement system to support tests and experiments. The main contributions of the work in this paper are as follows.
  • A module for adaptively varying the sampling radius is proposed to enhance the high-dimensional features of the sampled points and improve the semantic segmentation accuracy of inhomogeneous sparse MLS point clouds, which can solve the problem that road point clouds data was sparse and inhomogeneous in deep learning network.
  • To train and test the proposed model, we constructed a new MLS road point clouds dataset for training, testing, and evaluating the deep learning network.
  • Based on the addition of the new sampling module, the attention mechanism module is added to build a new deep learning network, and ablation experiments are conducted to verify the effectiveness of the new sampling module with the mechanism.

2. Related Work

Based on the types of methods for semantic segmentation of road point clouds, we divide the related studies into non-deep learning methods and deep learning methods.

2.1. Non-Deep Learning Methods

Edge-based segmentation methods: Bhanu et al. [18] proposed an edge detection technique to fit line segments by calculating gradients and detecting changes in the direction of the unit average vector on the surface, while Jiang et al. [19] is based on grouping of scan lines to perform fast segmentation. The edge-based methods are faster, but accuracy is not guaranteed because the edge method is not very sensitive to inhomogeneous or sparse point clouds.
Region-based segmentation: In the process of point clouds segmentation, when using a region-based segmentation method, it is necessary to classify the points with similar properties adjacent to each other, so that different segmentation regions of the point clouds can be obtained. The seed region approach was proposed initially by Besl et al. [20], and when using this bottom-up segmentation method, it is mainly seed-based. The region segmentation is done by selecting multiple seed points. Chen et al. [21] used a non-seed region approach to guide the process of planar clustering regions to reconstruct the complete shape of the building.
Attribute-based segmentation method: The attributes of point clouds data are used as footholds for segmentation, and this method usually has better robustness. Filin et al. [22] proposed a segmentation method based on feature space clustering. Zhu et al. proposed a road boundary enhancement point-column network BE-PCFCN, which uses point columns to extract point clouds features directly and integrates a road enhancement module to achieve accurate unstructured road segmentation [23]. Luo et al. proposed a super voxel point clouds segmentation algorithm based on the principle of region growth [24]. Wang et al. proposed a rod-shape segmentation method based on geometric structure constraints to segment road streetlights and other features [25]. Sha et al. proposed a new super voxel segmentation algorithm framework for enhancing road boundaries from 3D point clouds to achieve road segmentation [26]. Heidar Rastiveis et al. [27] proposed a method for automatically extracting road lane markers based on fuzzy inference based on point attributes associated with MLS point clouds. In traditional non-deep learning methods, manual features require much prior knowledge, and the segmentation effect of MLS road point clouds data is not ideal.

2.2. The Way of Deep Learning

Based on the permutation and rotation invariance of point clouds, Qi et al. [11] proposed Pointnet, which learns the features of points by sharing a multilayer perceptron (MLP) and then uses a symmetric pooling function to obtain global features. Based on the Pointnet [11], a series of networks were proposed: Pointnet++ [14] groups points by hierarchy and progressively learns from more significant regions. PointCNN [17] proposes an X-transformation to first process the point clouds data so that it “regularizes” the data, and then using convolution operations, the point clouds is processed. Pointconv [15] proposes a method that can efficiently perform convolution operations on non-uniformly sampled 3D point clouds data. GACNet [28] creates a graph structure of each point and its surrounding points by introducing attention mechanism calculating the edge weights of the centroid and each neighboring point, thus enabling the network to achieve better results. PATs [29] mainly improved the part of FPS in PointNet++ [14] by adding a self-attention mechanism to select the down-sampled points at locations with high attention weights. Ma et al. [30] proposed a capsule-based deep learning framework for extracting and classifying road markers from a large number of disordered MLS point clouds. Chen et al. proposed a deep learning model based on a dense feature pyramid network (DFPN) by combining the specificity and complexity of road markers [31]. Li et al. proposed a deep learning model using point clouds aggregated into a 2D image space and then transformed 2D projection using affine transformation for use in 3D LiDAR point clouds in rural accurate segmentation and extraction of road targets [32]. Ma et al. used multi-scale dynamic point-by-point convolution operations to provide an end-to-end feature extraction framework for 3D point clouds segmentation [33]. However, the existing deep learning network cannot accurately segment the sparse and non-uniform large-scale road field scenic spot cloud data collected by the high-speed mobile LiDAR system. Therefore, our research is based on enhancing the characteristics of sampling points in MLS point clouds data, specifically through adding an adaptive sampling radius module, enhancing the high-dimensional features of sampling points, and improving the segmentation accuracy of inhomogeneous sparse point clouds by deep learning network.

3. Methods

The method in this paper is based on the deep learning network model, it adaptively changes the sampling point radius of the regional group according to the density of the MLS road point clouds. The network structure is shown in Figure 2. Further, this method focuses on the MLS point clouds dataset with inhomogeneous sparse characteristics to segment the road scene more accurately. Inhomogeneous road point clouds data significantly affects the segmentation accuracy of the deep learning networks. Sparse point clouds data mean that there is point clouds information missing in the sampling process. Therefore, this method takes the number of sampling points within the sampling radius as the threshold and first divides the whole point clouds data into space to reduce the influence of inhomogeneous and sparse road point clouds data on the segmentation accuracy in the process of deep learning. According to the density of MLS road point clouds data, the threshold of the number of sampling points is defined so that the sampling module can adaptively transform the size of the sampling radius and improve the high-dimensional characteristics of sampling points. By obtaining the correlation between the features on each channel, the information on the more critical channels among the features of each point is highlighted, and the prediction success rate of each point of the network model is increased. The deep learning model predicts a label for each point of each batch and finally reintegrates the results into a scene.

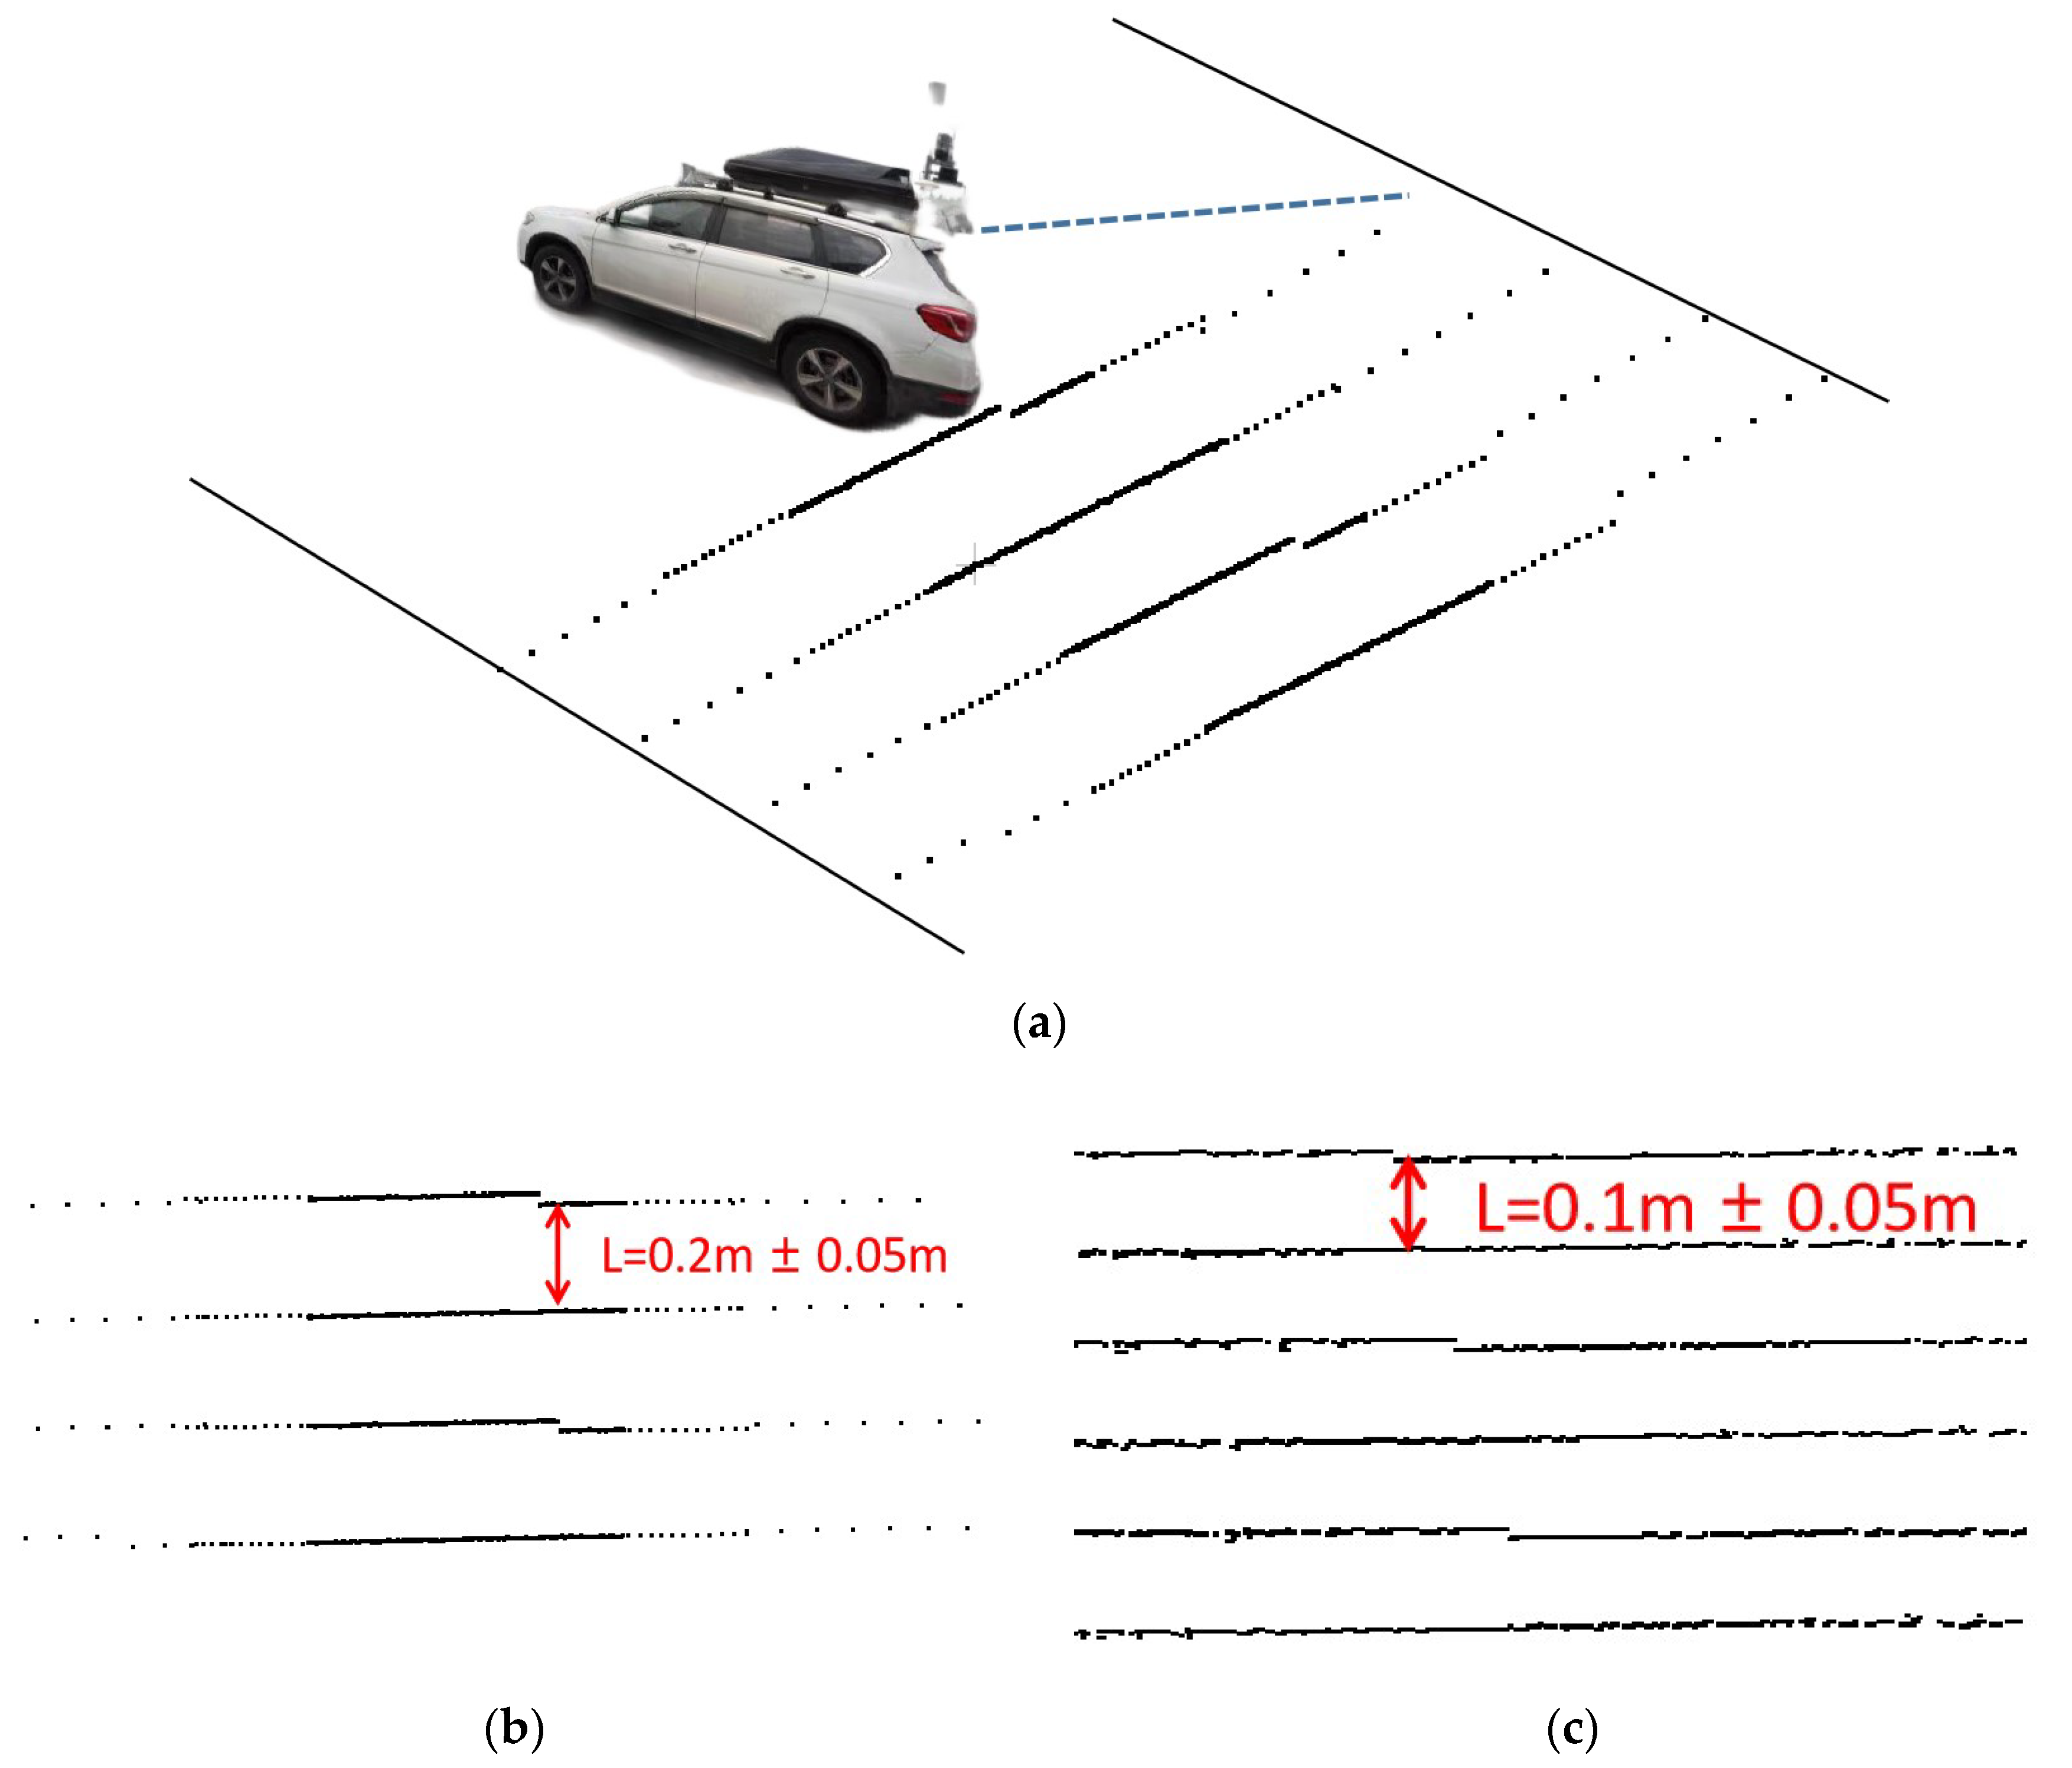
3.1. Sampling Module with Adaptive Radius

The Pointnet++ [14] network uses an iterative farthest point sampling (FPS) method to select the centroids of a subset. However, in the process of using ball sampling, the number of all points in the ball radius is counted first, from which n points are selected as sampling points, and other points are discarded for processing; when the points in the ball radius do not reach n, the point with the largest value is copied to fill in. In indoor dense point clouds data, such processing can meet the requirements of feature learning. However, in the inhomogeneous sparse road extensive field point clouds data, it is easy to cause the loss of local information and the reduction of point clouds segmentation accuracy.
Considering the characteristics of the road point clouds data collected by MLS using line scan, we design a new sampling method as in Figure 3. Calculate the Euclidean distance between the sampling center point and all the selected points. All the points greater than r2 are assigned the value N, where N is null, and the rest keep the original value. The points in the sampling radius are arranged in ascending order, and n points are taken out of the remaining points as sampling points, where n is a parameter. In the MLS road point clouds environment, n is set to 36 or 48. Considering that there may be points containing N values among the n points, i.e., less than n points are in the ball sampling radius, then judge whether there are points containing N values in the sampling points. If so, the ball sampling radius is expanded by b(0.1)m. Then, judge whether the points in the ball sampling satisfy the condition again. If not, the radius is expanded again until the condition of n numbers is satisfied and ensuring that enough points to learn the features to enhance the high-dimensional features from the sampled points.
This deep learning model extracts local features by sampling and delimiting a range in the whole point clouds. The points inside as local features for one feature extraction, and the extracted local features capture the fine geometric structure from the small neighborhood. A multilayer perceptron (MLP) operation is performed for each point in the local area, and finally, a maximum local pooling is performed to obtain the local global features. After multiple sampling operations, although the original number of point clouds becomes smaller, the existing points all contain local features extracted from the points in the previous cycle, and each point contains more information. These local features are further grouped into larger units and processed to produce features on a larger scale. This process is repeated until features are obtained for the entire point clouds data.
Up-sampling is performed by linear difference, and for the point to be recovered, the closest points in the same scale space are determined, and the inverse of the distance weights the features to obtain the features of the points after up-sampling. Then, the up-sampled point features are stitched with those obtained from the previous part of the encoder through a jump connection. Then, feature extraction is performed and repeated until the point clouds resolution is consistent with the original point clouds resolution.

3.2. Channel Attention Module

After obtaining the high-dimensional features of each point, we focus on the influence of the information on each feature channel on the whole point clouds information and realize the point clouds data channel attention mechanism by obtaining the correlation between features and information on each channel (shown in Figure 4). Highlight the information on the more critical channel in each point feature. First, we obtain a feature that reflects the global point clouds, then on this basis, we learn the attention weight of each channel to obtain the point clouds features after processing it by the feature channel attention module.
Unlike 2D image data, 3D point clouds data have the characteristics of unstructured and disordered. The features of the point clouds can be expressed explicitly in the neural network as F = ℝB×N×1×C where B, N, and C are the Batch Size, the number of point clouds and the number of feature channels. In this paper, Pooling is along with the C dimension of the number of characteristic channels, as shown in Equation (1),
F c = F M c ( F )
where Mc ∈ ℝB×N×1×C is the point clouds channel attention mechanism, Fc is the output feature of point clouds channel attention, and ⊗ is the matrix fork multiplication. After obtaining the point clouds features, to generate the point clouds channel attention mechanism Mc, along the feature channel number N dimension, using average pooling can effectively obtain the holistic features of the point clouds, and using maximum pooling can effectively obtain more distinguishable point clouds features. Two types of pooling are used in the channel attention mechanism, and feature aggregation is performed on the point clouds data input features F to generate two different point clouds global features Favg and Fmax. In this paper, MLP is used to extract the point clouds features, and the features are trained using MLP with shared parameters, reduce the point clouds channel C first and then revert to the original, where the reduction factor is k. Finally, the required channel attention mechanism weights are obtained by Sigmoid.
The point clouds channel attention mechanism Mc can be expressed as Equation (2),
M c = s { MLP ( A v g ( F ) ) + MLP ( M a x ( F ) ) }
where s is the sigmoid activation function.

4. Results and Discussion

4.1. Dataset Description and Assessment

To train the deep learning model and evaluate the learning ability of the model, the point clouds data of road scenes need to be labeled with the corresponding tags. To obtain datasets with features of different road scenes, the point clouds data of relevant road sections from different road scenes are selected as the training datasets for the deep learning model. Based on the self-developed mobile LiDAR system, the road point clouds of the dataset are based on the road data around Beijing city, including the Daxing Airport loop, Jingtai highway, Jingkai highway, and Beijing ring road (Figure 5b,c). To prevent overfitting from occurring, the research area is about 180 km long. The data collection of different types of roads is made into a road point clouds dataset, and the features are divided into the road surface, lane lines, guardrails, streetlights, signage, etc. During the acquisition process, the mobile LiDAR system collects point clouds data at 90–110 km/h. During the data processing, the automatic segmentation distance is 5 m, and the samples with high integrity are selected, with a total of 3968 samples. Each sample size is about 4 M, 85,000 points; 80% of the samples are used for training, 12% for testing, and 8% for validation.
The network model is built based on Python 3.6, and the main libraries used are PyTorch, CUDA 10.0, cuDNN 7.5, etc. All experiments were run in a GeForce RTX 2080ti 11G environment. The Adam optimizer is used in the training phase, which requires less memory and has excellent acceleration for neural network training. The initial learning rate was set to 0.001, the batch size was set to 16, the learning rate decay rate was 0.7, and the step size (epoch) was set to 48.

4.1.1. Quantitative Analysis

In order to accurately reflect the performance of our proposed method, we conducted a quantitative evaluation and selected the Daxing Airport loop, with a length of about 6 km, as the validation set for this time. The intersection over union (IOU) and the overall accuracy (OA) and accuracy per class are used to evaluate the classification results. The ratio of the intersection and set is the ratio of their intersection to the real scene, which is the accuracy of detection IOU, as shown in Equation (3). mIOU is the average intersection ratio of each class.
IOU = Prediction   result     Real   scene Prediction   result     Real   scene
where the prediction result is the prediction result, and the Real scene is the real scene. Overall accuracy OA indicates how close the prediction is to the simulated label.
Mean Intersection over Union (mIOU) calculates the average ratio of intersection and union of all categories, Equation (4).
mIOU = 1 k + 1 i = 0 k TP FN + FP + TP
where true positive (TP) means correct prediction, prediction = true = positive class; false positive (FP) means wrong prediction, prediction = positive class ≠ true = negative class; false negative (FN) means wrong prediction, prediction = negative class ≠ true = positive class.
Overall accuracy (OA) indicates how close the prediction is to the simulated label. Accuracy is a single class indicating the degree of approximation between prediction and simulation label in Equation (5),
Accuracy = Total   correct   class Total   seen   class
where the entire correct class is the completely correct class, and the total seen class is all the classes.

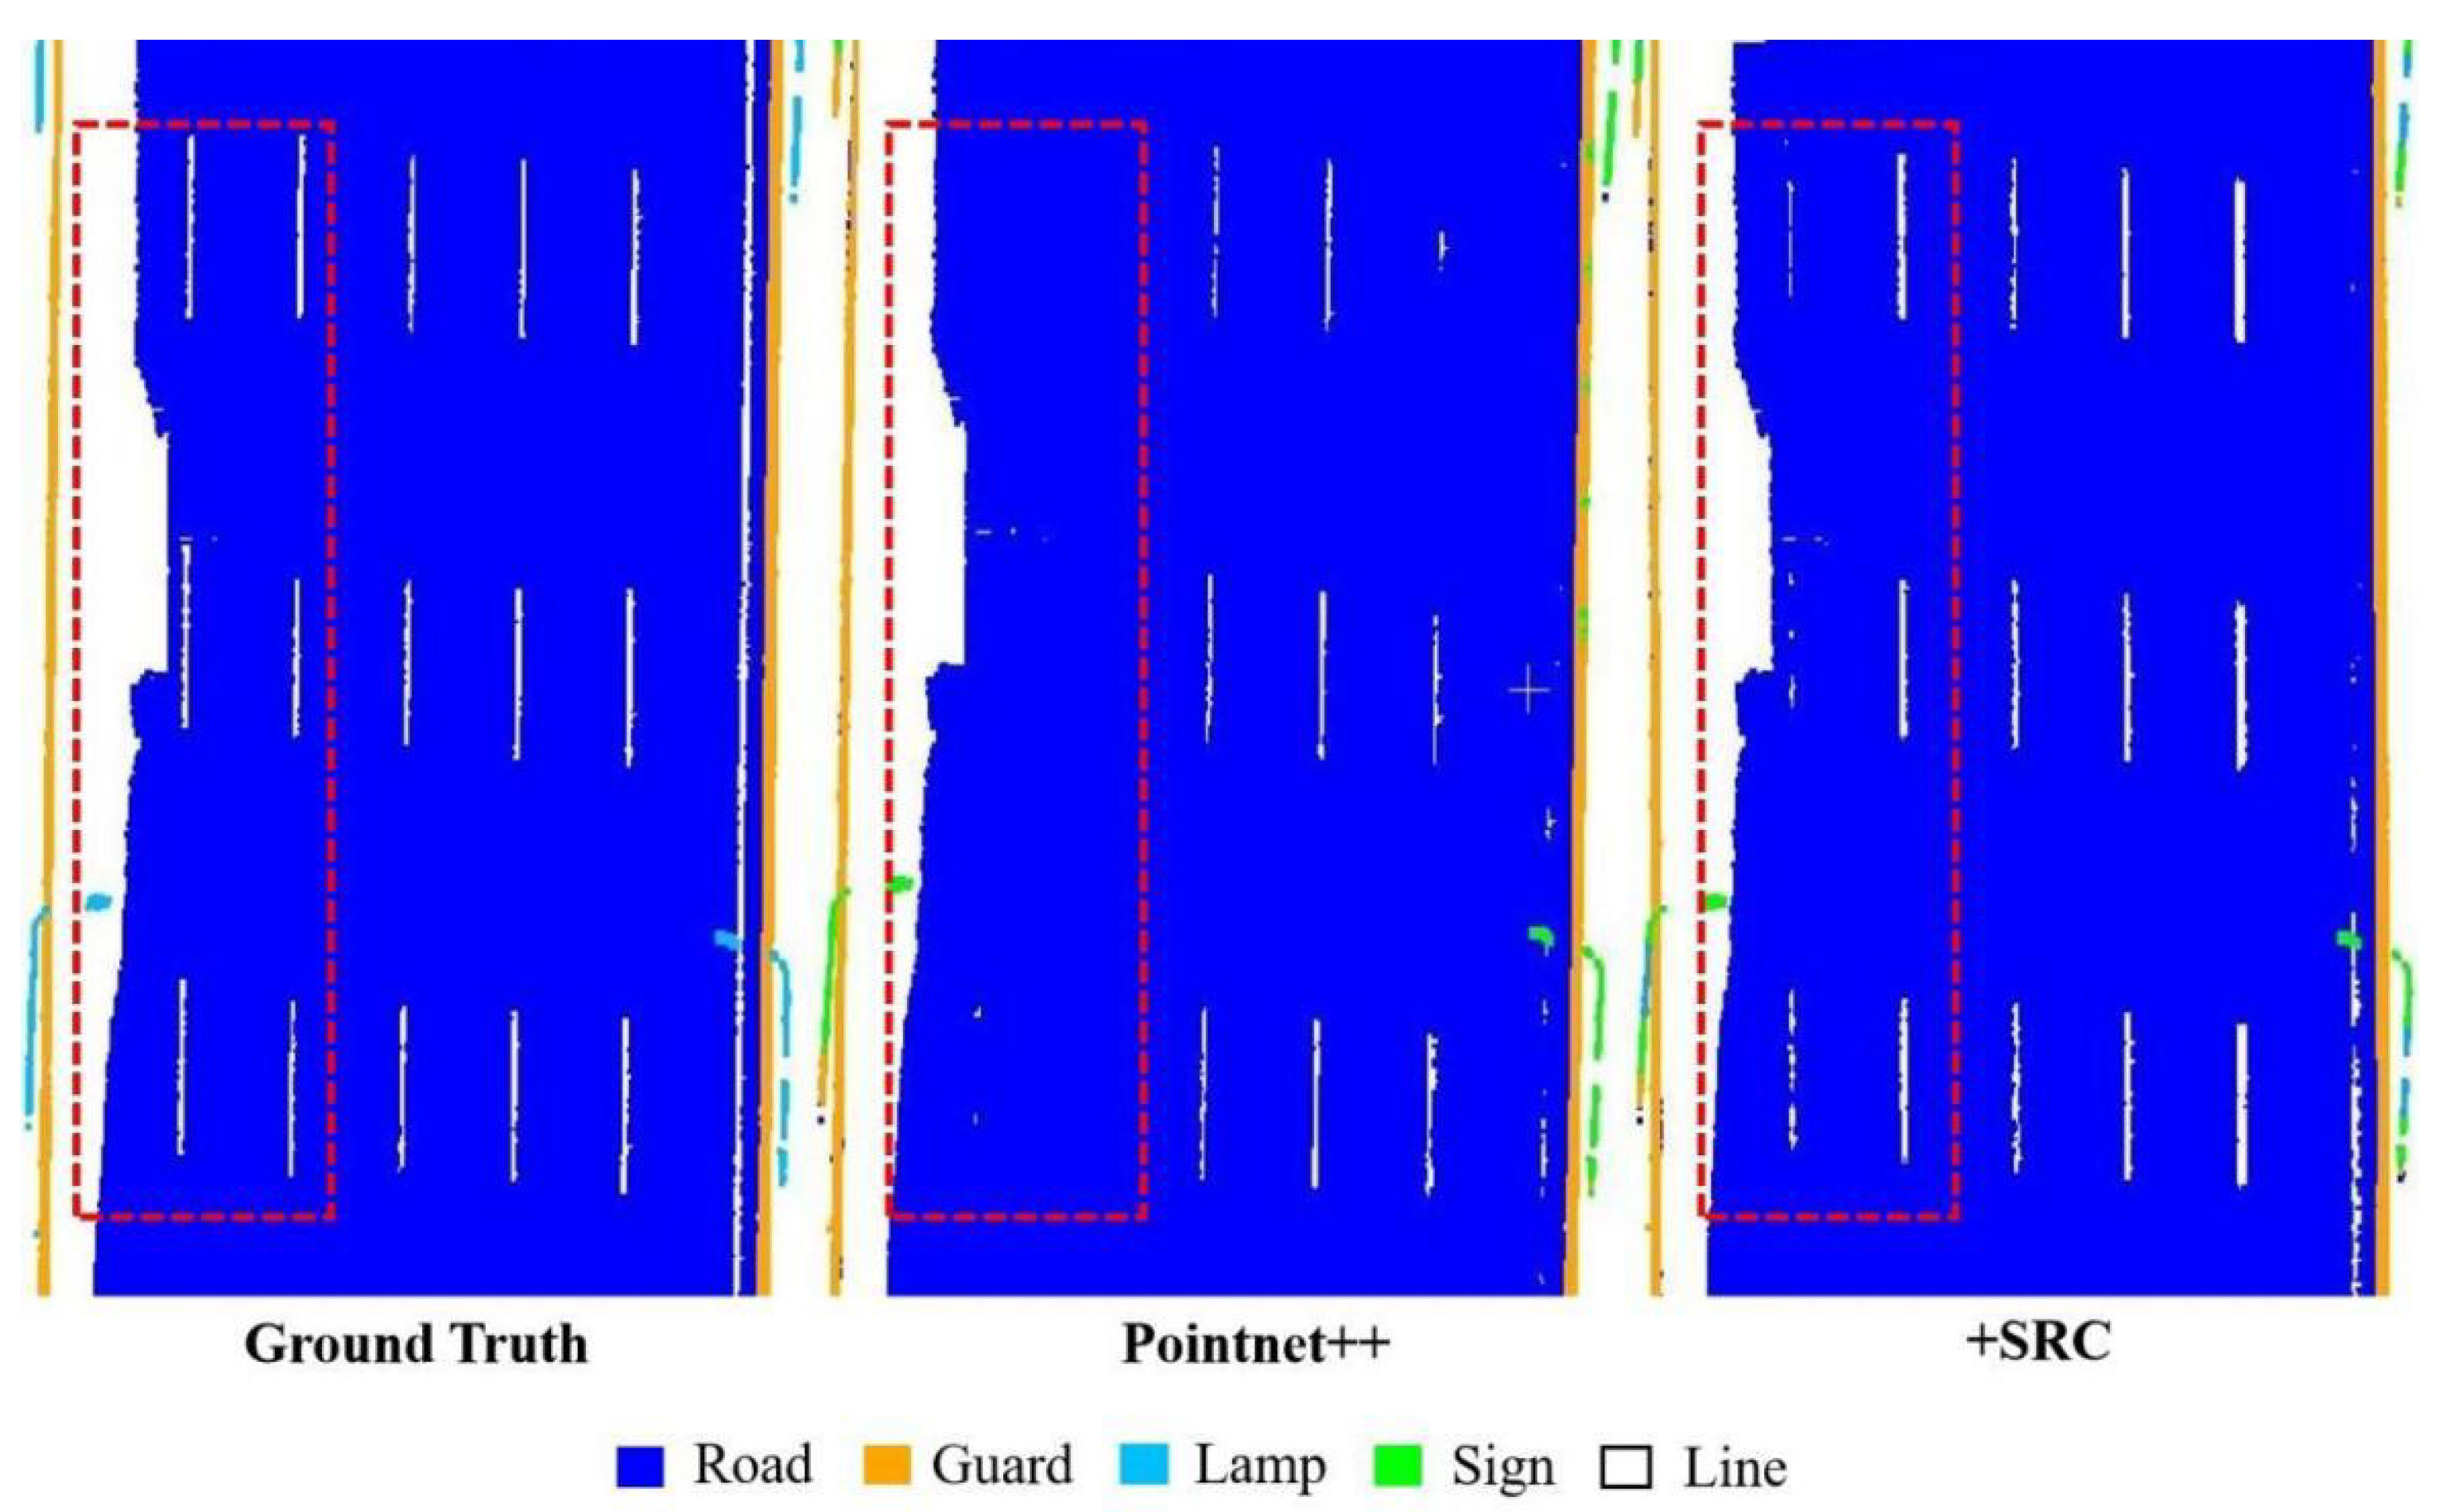
4.1.2. Qualitative Analysis

Figure 6 shows the qualitative experiment results of some areas selected from the Daxing Airport loop verification set. The road scene is divided into streetlights, signs, lane lines, pavement, and guardrails. We used MLS road field scenic spots such as Beijing–Taiwan Expressway, Beijing–Guangzhou Expressway, and Beijing South Sixth Ring Road to train our network model. The section of Daxing Airport loop was taken as a verification test to ensure the generalization of the fusion network model.
Table 1 shows the quantitative results of the fusion network model in the Daxing Airport loop section. From an overall perspective, the integrated network model achieved an OA of 99.1% and a mIOU of 72.6 in the MLS Daxing Airport section dataset, which verified the effectiveness of the new deep learning network integrated with two modules in MLS road point clouds scene segmentation. At the same time, the fusion network has a certain effect on the five road features. Among them, the pavement and guardrail segmentation accuracy reached 99.1% and 99.9%, in all categories of the best performance. The segmentation effect of streetlamps is average, only 38.5%. The main reason for this result is that in the road field scenic spot cloud collected by MLS, the amount of streetlamp features is less than other features, and the point clouds data are incomplete and have other problems.
Figure 7 shows a detailed description section of some sections of the segmentation result of the fusion network. Integrates the two modules of the deep learning network can correctly segment most of the MLS road field scenic spot cloud data, which has a remarkable segmentation effect on the road scene and noticeable geometric features. In previous research, MLS usually drives at a low speed in the process of collecting road point clouds data to increase the density of the point clouds, improve the features of ground object point clouds data, or combine with images to increase the richness of feature information. However, it is limited by weather, environment, time, and other conditions. In contrast, when this method only relies on MLS point clouds data, it can accurately segment road point clouds data collected by MLS at high speed. Three-dimensional point clouds data can be used to efficiently collect road point clouds data at night when the traffic flow is low, improving the utilization efficiency of MLS.

4.2. Experiment and Analysis

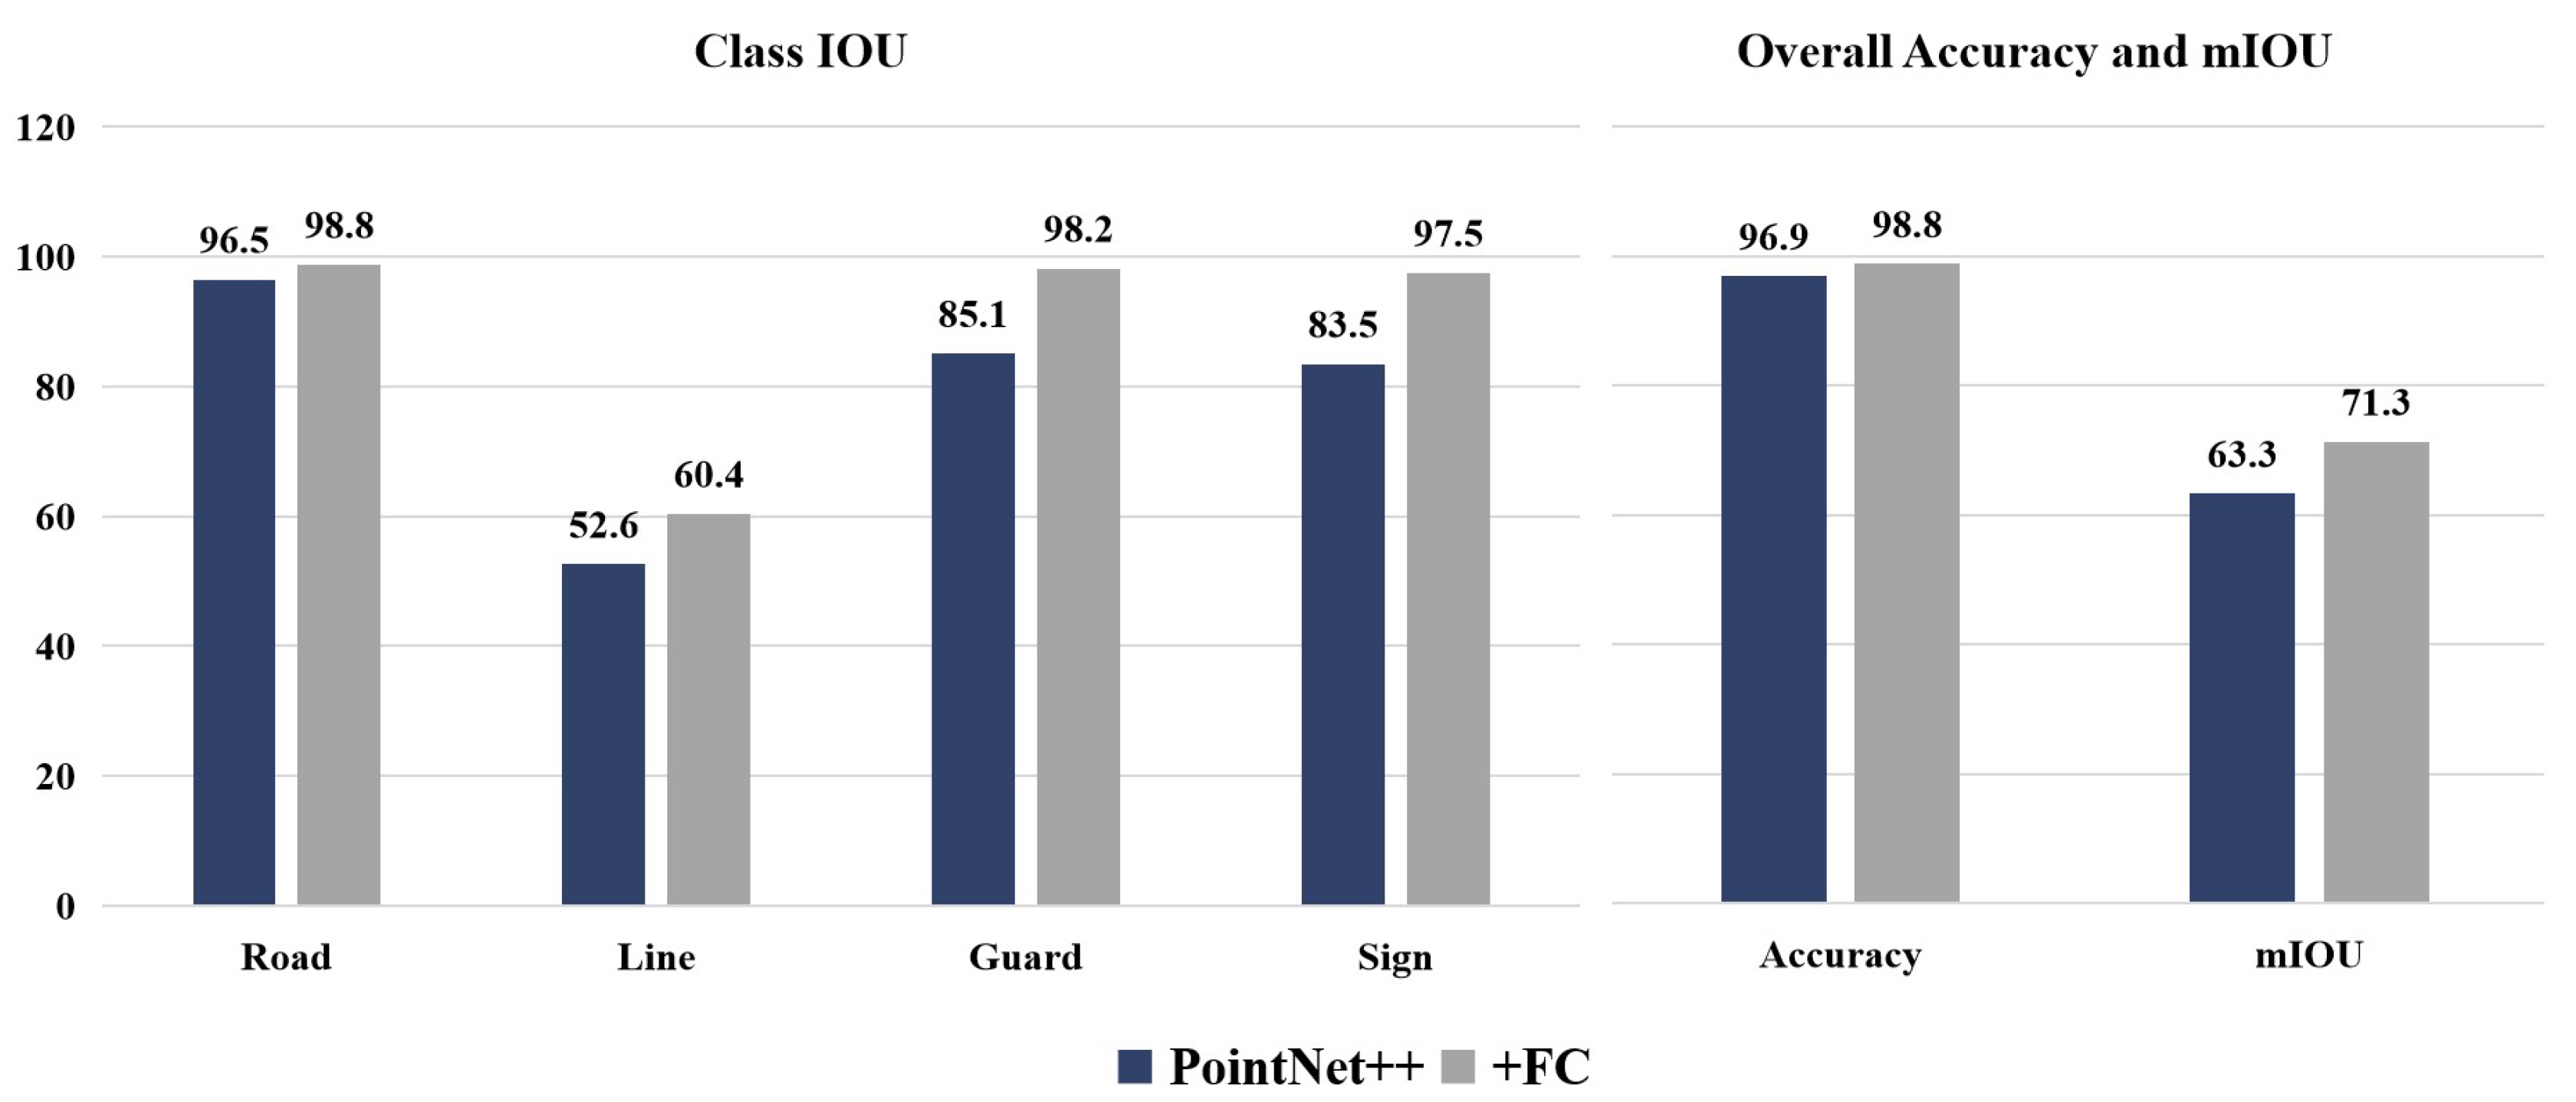
4.2.1. SRC Module Enhancements

First, we trained a Pointnet++ [14] original network model on the newly created MLS point clouds dataset, and then added the SRC sampling module to Pointnet++ [14] to replace the original ball sampling module, trained a new model with the MLS point clouds dataset, and then selected the same area for segmentation testing and validation to obtain the test results. From Figure 8, we can see that the new network with the SRC module added effectively segmented the sparse road point clouds at more distant locations, and the sparse lane line point clouds data at the edges were also segmented. Compared with the original already segmented near lane lines, SRC obtained a more accurate and precise segmentation effect.
As can be seen from the bar comparison in Figure 9, the network testing accuracy with the addition of the SRC sampling module reached 98.7%, which is better than the original Pointnet++ [14] network. In the test, the mIOU of the new network model replaced with the SRC sampling module reached 69.8%, which is better than the 63.3% of the original deep learning network. It indicates that under the same conditions, our method prediction yields more accurate results, more precise segmentation of sparse point clouds, and a significant improvement for features with less point clouds data such as streetlights. In addition to the correctness, our method maintains high accuracy in road point clouds tests in different regions. Therefore, it is inferred that our proposed method of adaptively varying the sampling radius is easier to learn the features of inhomogeneous sparse MLS road point clouds.

4.2.2. Enhancement of Channel Attention Mechanism

To verify the impact of the channel attention mechanism module on the original deep learning network, we added the channel attention mechanism to the original network model alone. In the same dataset for training and testing, Figure 10 shows that adding the channel attention mechanism also improves the performance of the native network model at the far end. In Figure 11, we find that the network with the channel attention mechanism (FC) alone also significantly improve in all aspects. Although the network model with FC did not segment the street light features with less point clouds data, the segmentation accuracy of lane lines and other features at the far end was improved. The OA and average mIOU were also improved, demonstrating that the channel attention mechanism can also have a positive effect on the native deep learning network.

4.2.3. Ablation Experiment

In order to test the influence of different modules on the original network model, we designed an ablation experiment to add an adaptive sampling radius module and channel attention mechanism into the initial deep learning network to provide test effects, to verify the effect of each module on segmentation accuracy.
Based on the above two comparison experiments, both SRC sampling module and channel attention mechanism can positively affect the native deep learning network. Therefore, we added both modules to the original network to generate a fusion network model. We trained and experimented on the MLS road point clouds dataset to verify whether the fusion network generated by adding the two modules has positive enhancement. Figure 12 shows the segmentation results of the native network model and the network model with different modules added under the same conditions and in the same region. The fusion network model’s segmentation of distal lane lines is significantly improved compared with the native network model, proving that the fusion network can quickly learn the inhomogeneous sparse MLS road point clouds features and substantially improve the segmentation accuracy of distal lane lines with sparse point clouds. As seen in Figure 13, the guardrail, as a feature bordering the road, does not easily learn the boundary features of the inhomogeneous sparse MLS road point clouds, leading to the failure of the method in the boundary part. The native network identifies part of the guardrail as the road surface and a small part of the boundary as signage. Under the same conditions, the fused network model has significantly improved the segmentation accuracy of guardrails and road surfaces. Most road point clouds data are segmented with clear boundaries and high accuracy, except for a few areas with segmentation errors.
Figure 14 shows the performance of the fusion network model with both the SRC module and the channel attention mechanism added compared with the original network and other single-module networks. As shown, we can see the fusion network model generated by adding the two modules can still learn the features of streetlights under the condition of sparse point clouds, which significantly improves the accuracy of streetlight segmentation. Moreover, the segmentation accuracy of all other features has been significantly improved: the single-class IOU of guardrail is improved from 85.1% to 99.9%, the single-class IOU of signage is improved from 83.5% to 98.3%, and the IOU of lane lines is improved from 52.6% to 66.2%. The fusion network model achieved an overall segmentation accuracy of 99.1% for the test area de improved by 2.2% compared with the original network. The mIOU reached 72.6%, improved by 9.3%, proving that the fusion network generated by adding two modules at the same time has excellent segmentation effect on MLS point clouds data and has been effectively improved in all aspects. The road surface is the feature that achieves the best segmentation results for all network models, achieving more than 96%, as the main element of the scene, with an adequate amount of point clouds data that is relatively evenly distributed and has very similar characteristics. In contrast, the segmentation of the lane lines is relatively poor, with only 66.2% accuracy, which is because the lane line and the road surface, as adjacent features, have the same point clouds data density, which leads to problems in the segmentation of the two features at the junction, and the segmentation results at the junction are easily confused. Some of the lane lines are easily recognized as the road surface.

4.2.4. Comparison Experiments

We did the same tests again on different areas to obtain accurate evaluation results. Overall, applying the trained model in the test sample, the present method achieved an overall accuracy of 97.8% and an overall mIOU of 0.726 on the available dataset. Table 1 shows the performance of the present method on the same dataset with methods such as Pointnet [11], where the present method has a partial improvement in overall accuracy. The present method shows significant improvement in mIOU over PointNet++ [14], with about 30% improvement compared to the Pointnet [11] method; 21.1% improvement in mIOU compared to Pointnet++ [14], and 8.4% improvement in mIOU compared to the graph convolution-based method GACNet [28].
Streetlights failed to be segmented effectively in Pointnet [11], Pointnet++ [14], and GACNet [28] which is because the streetlights are in the MLS road point clouds data set. The number of point clouds is sparse, which leads to insufficient features and easily confused with features such as signage. The multidimensional features of the data are reduced, which affects the segmentation results. The fusion network model, with the addition of the SRC module and channel attention mechanism, has a much higher segmentation success rate in the streetlights (38.5%) than other methods. Similarly, the segmentation results of this method (98.3%) in signage features with a relatively large number of point clouds compared to streetlights showed a relatively significant improvement compared to other methods (as in Table 2). It can be inferred that the method in this paper is more sensitive to inhomogeneous sparse road point clouds data and easier to learn.

5. Conclusions

In this paper, an adaptive radius sampling method based on point clouds density variation is proposed for MLS road point clouds data to achieve improved semantic segmentation accuracy of inhomogeneous sparse point clouds measured by a high-speed mobile LiDAR system. A new point clouds road dataset for mobile measurement systems is constructed for deep learning network training. The experimental results show this method’s result accuracy and mIOU are both higher than other deep learning networks. This paper still has some drawbacks, such as the general segmentation effect on streetlights and lanes. In future research, other attention mechanisms can be added to the network model, and the optimization function can be modified to improve the semantic segmentation accuracy.

Author Contributions

P.C. and Z.F. designed the algorithm and wrote the paper. M.G. supervised the research and revised the manuscript. P.C. performed the experiments on the Daxing dataset. H.W. revised the manuscript. D.L. and X.R. were responsible for collecting data. All authors have read and agreed to the published version of the manuscript.

Funding

This research was funded by the National Natural Science Foundation of China (Grant No.:41971350); National Natural Science Foundation of China (Grant No.:42171416); Beijing Advanced Innovation Center for Future Urban Design Project (Grant No.: UDC2019031724); Teacher Support Program for Pyramid Talent Training Project of Beijing University of Civil Engineering and Architecture (Grant No.: JDJQ20200307).

Informed Consent Statement

Not applicable.

Data Availability Statement

The data that support the findings of this study are available from the author, Peng Cheng, upon reasonable request.

Conflicts of Interest

The authors declare no conflict of interest.

References

  1. Guo, M.; Zhou, Y.Q.; Zhao, J.H.; Zhou, T.F.; Yan, B.N.; Huang, X.F. Urban Geospatial Information Acquisition Mobile Mapping System based on close-range photogrammetry and IGS site calibration. Geo-Spat. Inf. Sci. 2021, 24, 558–579. [Google Scholar] [CrossRef]
  2. Gu, J.X.; Yang, B.S.; Dong, Z.; Yang, C.H. Intelligent holographic mapping for digital twin cities. Mapp. Bull. 2020, 6, 134–140. [Google Scholar]
  3. Guo, M.; Sun, M.X.; Pan, D.; Huang, M.; Yan, B.N.; Zhou, Y.Q.; Nie, P.J.; Zhou, T.F.; Zhao, Y.S. High-precision detection method for large and complex steel structures based on global registration algorithm and automatic point cloud generation. Measurement 2021, 172, 8. [Google Scholar] [CrossRef]
  4. Zhao, J.H.; Wang, Y.R.; Cao, Y.E.; Guo, M.; Huang, X.F.; Zhang, R.J.; Dou, X.T.; Niu, X.Y.; Cui, Y.Y.; Wang, J. The Fusion Strategy of 2D and 3D Information Based on Deep Learning: A Review. Remote Sens. 2021, 13, 4029. [Google Scholar] [CrossRef]
  5. Guo, M.; Sun, M.X.; Zhou, T.F.; Yan, B.N.; Zhou, Y.Q.; Pan, D. Novel Trajectory Optimization Algorithm of Vehicle-borne LiDAR Mobile Measurement System. Sens. Mater. 2020, 32, 3935–3953. [Google Scholar] [CrossRef]
  6. Guo, M.; Yan, B.N.; Zhou, T.F.; Pan, D.; Wang, G.L. Accurate Calibration of a Self-Developed Vehicle-Borne LiDAR Scanning System. J. Sens. 2021, 2021, 18. [Google Scholar] [CrossRef]
  7. Guo, M.; Yan, B.N.; Zhou, T.F.; Chen, C.Y.; Zhang, C.; Liu, Y. Application of lidar technology in the deformation analysis of Yingxian wooden towers. J. Build. Sci. Eng. 2020, 37, 109–117. [Google Scholar]
  8. Guo, M.; Zhao, J.W.; Pan, D.; Sun, M.X.; Zhou, Y.Q.; Yan, B.N. Normal cloud model theory-based comprehensive fuzzy assessment of wooden pagoda safety. J. Cult. Herit. 2022, 55, 1–10. [Google Scholar] [CrossRef]
  9. Balado, J.; Martinez-Sanchez, J.; Arias, P.; Novo, A. Road Environment Semantic Segmentation with Deep Learning from MLS Point Cloud Data. Sensors 2019, 19, 3466. [Google Scholar] [CrossRef] [Green Version]
  10. Guo, M.; Zhou, Y.Q.; Chen, C.; Zhou, Z.; Guo, K. Design of time synchronization device for mobile lidar measurement system with BeiDou navigation timing. Infrared Laser Eng. 2020, 49, 33–42. [Google Scholar]
  11. Qi, C.R.; Su, H.; Mo, K.; Guibas, L.J. PointNet: Deep Learning on Point Sets for 3D Classifification and Segmentation. In Proceedings of the IEEE Conference on Computer Vision and Pattern Recognition, Honolulu, HI, USA, 21–26 July 2017. [Google Scholar]
  12. Wang, P.; Li, W.; Liu, S.; Zhang, Y.; Gao, Z.; Ogunbona, P. Large-scale Continuous Gesture Recognition Using Convolutional Neural Networks. In Proceedings of the 2016 23rd International Conference on Pattern Recognition (ICPR), Cancun, Mexico, 4–8 December 2016. [Google Scholar]
  13. Yang, B.S.; Han, X.; Dong, Z. Point cloud deep learning benchmark data set. J. Remote Sens. 2021, 25, 231–240. [Google Scholar]
  14. Qi, C.R.; Yi, L.; Su, H.; Guibas, L.J. PointNet++: Deep Hierarchical Feature Learning on Point Sets in a Metric Space. arXiv 2017, arXiv:1706.02413. [Google Scholar]
  15. Wu, W.; Qi, Z.; Li, F. PointConv: Deep Convolutional Networks on 3D Point Clouds. In Proceedings of the 2019 IEEE/CVF Conference on Computer Vision and Pattern Recognition (CVPR), Long Beach, CA, USA, 15–20 June 2019; pp. 9613–9622. [Google Scholar]
  16. Jiang, M.; Wu, Y.; Zhao, T.; Zhao, Z.; Lu, C. PointSIFT: A SIFT-like Network Module for 3D Point Cloud Semantic Segmentation. arXiv 2018, arXiv:1807.00652v2. [Google Scholar]
  17. Li, Y.; Bu, R.; Sun, M.; Wu, W.; Di, X.; Chen, B. PointCNN: Convolution On X-Transformed Points. arXiv 2018, arXiv:1801.07791v5. [Google Scholar]
  18. Bhanu, B.; Lee, S.; Ho, C.C.; Henderson, T. Range data processing: Representation of surfaces by edges. In Proceedings of the Eighth International Conference on Pattern Recognition, Paris, France, 27–31 October 1986. [Google Scholar]
  19. Jiang, X.Y.; Bunke, H.; Meier, U. Fast range image segmentation using high leve segmentation primitives. In Proceedings of the 3rd IEEE Workshop on Applications of Compute Vision, Sarasota, FL, USA, 2–4 December 1996. [Google Scholar]
  20. Besl, P.J.; Jain, R.C. Segmentation through variable order surface fitting. IEEE Trans. Pattern Anal. Mach. Intell. 1988, 10, 167–192. [Google Scholar] [CrossRef] [Green Version]
  21. Chen, J.; Chen, B. Architectural modeling from sparsely scanned range data. Int. J. Comput. Vis. 2008, 78, 223–236. [Google Scholar] [CrossRef]
  22. Filin, S.; Pfeifer, N. Segmentation of airborne data using a slope adaptive filter. ISPRS J. Photogramm. Remote Sens. 2006, 60, 71–80. [Google Scholar] [CrossRef]
  23. Zhu, Z.J.; Li, X.; Xu, J.H.; Yuan, J.H.; Tao, J. Unstructured Road Segmentation Based on Road Boundary Enhancement Point-Cylinder Network Using LiDAR Sensor. Remote Sens. 2021, 13, 495. [Google Scholar] [CrossRef]
  24. Luo, N.; Jiang, Y.Y.; Wang, Q. Supervoxel-Based Region Growing Segmentation for Point Cloud Data. Int. J. Pattern Recognit. Artif. Intell. 2021, 35, 20. [Google Scholar] [CrossRef]
  25. Wang, Z.; Yang, L.; Sheng, Y.; Shen, M. Pole-like Objects Segmentation and Multiscale Classifification-Based Fusion from Mobile Point Clouds in Road Scenes. Remote Sens. 2021, 13, 4382. [Google Scholar] [CrossRef]
  26. Sha, Z.C.; Chen, Y.P.; Lin, Y.B.; Wang, C.; Marcato, J.; Li, J. A Supervoxel Approach to Road Boundary Enhancement From 3-D LiDAR Point Clouds. IEEE Geosci. Remote Sens. Lett. 2022, 19, 5. [Google Scholar] [CrossRef]
  27. Rastiveis, H.; Shams, A.; Sarasua, W.A.; Li, J. Automated extraction of lane markings from mobile LiDAR point clouds based on fuzzy inference. ISPRS J. Photogramm. Remote Sens. 2020, 160, 149–166. [Google Scholar] [CrossRef]
  28. Wang, L.; Huang, Y.; Hou, Y.; Zhang, S.; Shan, J. Graph attention convolution for point cloud semantic segmentation. In Proceedings of the IEEE/CVF Conference on Computer Vision and Pattern Recognition, Long Beach, CA, USA, 15–20 June 2019; pp. 10296–10305. [Google Scholar]
  29. Yang, J.C.; Zhang, Q.; Ni, B.B.; Li, L.G.; Liu, J.X.; Tian, Q. Modeling Point Clouds with Self-Attention and Gumbel Subset Sampling. arXiv 2019, arXiv:1904.03375. [Google Scholar]
  30. Ma, L.F.; Li, Y.; Li, J.; Yu, Y.T.; Marcato, J.; Goncalves, W.N.; Chapman, M.A. Capsule-Based Networks for Road Marking Extraction and Classification from Mobile LiDAR Point Clouds. IEEE Trans. Intell. Transp. Syst. 2021, 22, 1981–1995. [Google Scholar] [CrossRef]
  31. Chen, S.Y.; Zhang, Z.X.; Zhong, R.F.; Zhang, L.Q.; Ma, H.; Liu, L.R. A Dense Feature Pyramid Network-Based Deep Learning Model for Road Marking Instance Segmentation Using MLS Point Clouds. IEEE Trans. Geosci. Remote Sens. 2021, 59, 784–800. [Google Scholar] [CrossRef]
  32. Li, H.T.; Todd, Z.; Bielski, N.; Carroll, F. 3D lidar point-cloud projection operator and transfer machine learning for effective road surface features detection and segmentation. Visual Comput. 2022, 38, 1759–1774. [Google Scholar] [CrossRef]
  33. Ma, L.F.; Li, Y.; Li, J.; Tan, W.K.; Yu, Y.T.; Chapman, M.A. Multi-Scale Point-Wise Convolutional Neural Networks for 3D Object Segmentation from LiDAR Point Clouds in Large-Scale Environments. IEEE Trans. Intell. Transp. Syst. 2021, 22, 821–836. [Google Scholar] [CrossRef]
Figure 1. (a) Schematic diagram of data collected by mobile LiDAR line scan; (b) schematic diagram of the width between scanning lines of point clouds data collected by mobile LiDAR system in low-speed driving; (c) schematic diagram of the width between scanning lines of point clouds data collected by mobile LiDAR system in high-speed driving.
Applsci 13 00281 g001
Figure 2. (a) Backbone network structure of MLS road point clouds data processing, the left side is the input MLS road point clouds data, the right side is the output segmentation results, the orange part represents the addition of adaptive sampling radius module and channel attention module. (b) The specific structure of the orange section.
Applsci 13 00281 g002
Figure 3. The sampling method of Pointnet++ with the adaptive radius sampling method. The green blob represents the point clouds data within the initial radius, the yellow blob represents those with the maximum value selected for replication, and the red blob and blue blob represent the initial radius as the learned point clouds features.
Applsci 13 00281 g003
Figure 4. Structure of channel attention mechanism.
Applsci 13 00281 g004
Figure 5. (a) Self-developed mobile LiDAR system; (b) experimental data collection area; (c) cloud data of road field points of interest.
Applsci 13 00281 g005
Figure 6. Global view of the qualitative results of the Daxing Airport loop validation set, where the global display of region 1, region 2, and region 3. The blue color in the segmentation results represents the road surface, the orange color represents the guardrail, the cyan color represents the streetlight, the green color represents the signage, and the white color represents the lane line.
Applsci 13 00281 g006
Figure 7. Close-up view of the qualitative results of the three area blocks of the Beijing Daxing Airport loop. The road segmentation results are blue for the road surface, white for the lane lines, green for the signs, yellow for the guardrails, and cyan for the streetlights.
Applsci 13 00281 g007
Figure 8. Visualization of segmentation results for the network with the adaptive radius sampling module (SRC) alone compared to the original Pointnet++. The improvement of the segmentation results for the distal sparse point clouds lane lines with the addition of the adaptive radius sampling module can be seen in the red dashed box.
Applsci 13 00281 g008
Figure 9. Analytical plot of the accuracy evaluation of the network with the adaptive radius sampling module (SRC) added alone versus the original Pointnet++.
Applsci 13 00281 g009
Figure 10. Visualization of segmentation results for the network with the channel attention mechanism module (FC) alone compared to the original Pointnet++. The improvement in segmentation results for the distal sparse point clouds lane lines with the addition of the channel attention mechanism module can be seen in the red dashed box.
Applsci 13 00281 g010
Figure 11. Accuracy evaluation analysis plot of the network with the channel attention mechanism module (FC) alone added versus the original Pointnet++.
Applsci 13 00281 g011
Figure 12. Visual comparison of segmentation results for the ablation experiment, the comparison in the red dashed box shows the improvement of the fusion network with the addition of both the adaptive sampling radius and the channel attention mechanism modules on the distal sparse point clouds lane line segmentation results.
Applsci 13 00281 g012
Figure 13. Visualization results of segmentation results of ablation experiments. Close-up of the road and guardrail edges, with the junction of the road and guardrail edges in the solid red box, and the improvement of the segmentation results of the road scene after adding different modules.
Applsci 13 00281 g013
Figure 14. (a) Analytical plot of accuracy assessment of a single class of feature IOU for the ablation experiment; (b) the analytical plot of the overall accuracy of the ablation experiment versus the accuracy assessment of the mIOU.
Applsci 13 00281 g014
Table 1. Evaluation results of the validation set of the Beijing Daxing airport loop, with single-class feature IOUs on the left and overall accuracy and mIOU on the right.
Object TypesClass IOUOverall
RoadLineLampGuardSignAccuracymIOU
Syncretic0.9910.6620.3850.9990.9830.9910.726
Table 2. Comparison results of single-class IOU, overall accuracy, and mIOU obtained from a quantitative comparison of our method with other point clouds segmentation methods in the Beijing Daxing airport loop validation set.
MethodObject TypesOverall
RoadLineLampGuardSignAccuracymIOU
PointNet0.9610.406-0.303 0.1880.9630.421
PointNet++0.9650.526-0.8510.835 0.9690.517
GACNet0.9650.584-0.8060.7140.9720.642
Syncretic0.9910.6620.3850.9990.9830.9910.726
Disclaimer/Publisher’s Note: The statements, opinions and data contained in all publications are solely those of the individual author(s) and contributor(s) and not of MDPI and/or the editor(s). MDPI and/or the editor(s) disclaim responsibility for any injury to people or property resulting from any ideas, methods, instructions or products referred to in the content.

