1. Introduction
One of the most frequently diagnosed diseases of the upper gastrointestinal tract is gastroesophageal reflux disease (GERD). In particular, many cases are reported in developed countries [
1,
2,
3,
4]. At least 44% of American adults experience at least one reflux disease symptom each month, whereas in Asian and African countries the disease is diagnosed very rarely. This state is mostly related to the most common causes of GERD: fat-rich diet, unhealthy habits (smoking cigarettes and drinking coffee extensively), not much exercise, and living in a constant rush and stress [
2]. Many of the affected people are not aware of the gravity of the problem; they relate their symptoms to heartburn and seek the aid of professionals only when those symptoms escalate. Therefore, it is particularly important to improve early GERD diagnostics as, if left untreated, the symptoms will further worsen the quality of life of the patients.
Until recently, the most frequently used method was 24-h esophageal pH-metry, but in recent years, pH-metry with an impedance measurement was named as the new golden standard [
2]. Esophageal pH measurements provide a high percentage of correct diagnoses. The main disadvantage, however, is the fact that the 24-h dataset has to be assessed by a specialist/gastroenterologist, which can be a time-consuming task. Even with the use of modern computer programs, it takes up to several hours to assess the data [
5,
6,
7,
8,
9,
10]. Therefore, it is advisable to develop computer techniques that will allow the automation of the process and shorten the time needed to diagnose a patient by a specialist. Consequently, this will allow the treatment to start quicker and will also free some time for the specialist/gastroenterologist to devote to other patients.
The research presented in this paper was carried out to answer two fundamental research questions. First, the authors wanted to check whether and to what extent it is possible to use wavelet and fractal analysis to analyse pH-metry waveforms in order to examine or determine new features/differences between the waveforms of healthy and sick people. If it turned out that there were measurable differences, visible only as a result of testing with the aforementioned methods, this would open the possibility of further exploring the nature of the differences, such as those in relation to the specific symptoms of reflux diseases. The second significant reason for undertaking this research work was to check whether it is possible to develop new and better methods of GERD diagnosis based on the analysis of the pH course—methods that could also be used in computer-aided diagnostic systems and self-diagnosis systems. Therefore, the authors of the paper put forward the thesis that the use of the computer methods of waveform analysis (wavelet analysis and spectral analysis) for esophageal pH courses would allow the development of new indicators enabling the diagnosis of gastroesophageal reflux diseases. The newly developed methods could be a viable alternative to the classical method of diagnosing reflux diseases.
1.1. Reflux Diseases of the Upper Gastrointestinal Tract
Regurgitation of gastric contents happens to everyone—it is a physiological process [
2,
11]. Problems arise, however, when the stomach contents stay in the esophagus too often and for too long. A healthy human esophagus is equipped with a physiological mechanism that protects the tissues of the esophagus against gastric contents—the so-called anti-reflux barrier. There are four components to it: the gastro-esophageal junction (otherwise known as the lower esophageal sphincter—LES); the mechanism of cleaning the esophagus of hydrochloric acid through the movement of the esophageal musculature; the upper esophageal sphincter protecting the upper sections of the esophagus (the pharynx and larynx) against exposure to gastric contents; and the esophageal mucosa with a natural pH neutralizing the acid reaction of gastric juice [
12]. The histological structure of the esophagus does not adapt it to excessive exposure to acid content (the stomach is also protected)—it is only the anti-reflux barrier that protects the esophageal tissues (mucosa, submucosa, and muscle) from destruction. If the anti-reflux barrier fails, the mucosal, submucosal, or muscular cells may be destroyed, resulting in ulceration, necrosis or dysplasia, and ultimately metaplasia. The above processes are often the cause of esophageal cancer or pathological changes in its structure (e.g., Barrett’s esophagus or Zenker’s diverticulum). A number of lifestyle changes or new eating trends lead to the diagnosis of pathological changes in the esophagus in younger and younger people. The increase in the trend is particularly visible over the last few years [
13]. Concerning infants, it was discovered that GERD has an effect on ALTEs (apparent life-threatening events in infancy), while anti-reflux therapy considerably decreases the number of ALTE episodes [
14].
A very important group of pathological diseases, directly resulting from the insufficiency of the anti-reflux barrier and the increased exposure of the esophagus to hydrochloric acid and pepsin, are gastroesophageal, laryngeal, and pharyngeal reflux diseases. The most important diseases in this group include gastroesophageal reflux disease—GERD—and laryngopharyngeal reflux disease—LPR. These changes are most often manifested by very burdensome sensations for the patient—retrosternal pain, painful heartburn, painful ailments that persist at night, dysphagia, odynophagia, and others. If left untreated, gastroesophageal reflux diseases may eventually lead to pathologies within the esophageal tissues and, consequently, to the above-mentioned pathologies, including esophageal cancer [
2,
15].
1.2. GERD Diagnostics with MII-pH Measurement
The diagnosis of gastroesophageal reflux disease can be carried out using invasive methods (such as 24-h pH-metry with/without impedance, esophageal endoscopy, esophageal manometry, balloon mucosal impedance, or double-contrast radiography) and non-invasive methods (real-time MRI, IPP test, or swallowing sound analysis) [
2,
15,
16,
17,
18,
19]. There are even attempts to combine traditional pH-metry with other diagnostic techniques, such as the simultaneous measurement of pH in the esophagus and larynx [
20,
21]. According to current guidelines, the gold standard among invasive diagnostic methods for GERD is MII-pH (multichannel intraluminal impedance-pH). Numerous studies have shown that this method has a number of advantages over other methods, which translates into high effectiveness in diagnosing GERD [
2,
15,
22,
23,
24,
25,
26,
27,
28,
29], and thus, this method proves to be one of the most informative tests that could be performed in patients with suspected GERD, particularly in those patients with atypical symptoms, or to assess the response to therapy. A particular advantage of this method is also the possibility of using it in both adults and children (including infants) [
30]. However, the method has its limitations—the difficulty in interpreting the test results requires the assessment of a specialist with extensive experience. Another limitation is the price of the MII-pH apparatus: not every diagnostic centre is able to purchase this equipment, which makes it necessary to use other, less effective, diagnostic methods. This is seen especially in the less prosperous parts of countries that are particularly in need of a good GERD diagnosis. Therefore, taking this into account, further research is focused solely on the pH monitoring method only. Thanks to this approach, the test results can be applied to more common devices, which increases the probability of detecting GERD in a wider population.
With the use of esophageal 24-h pH-metry, the gastroenterologist can determine the pH of the contents inside the esophageal lumen. With the standard 24-h pH-metry alone, the patient had one or two pH probes attached to the esophageal wall (one near the lower esophageal sphincter and, if there was a need for a second probe, one near the pharynx). The research shows that stomach content that has a pH value lower than 4 is harmful to the tissues of the esophagus. The test is performed during a 24-h period, in which the pH data are measured and stored on a special device/Holter. The patient is encouraged to act casually, as if he was performing his normal daily routine. After the exam is over the gastroenterologist has to read the pH course and determine whether the pattern is physiological or pathological. The analysis of the pH courses involves using a method described by DeMeester [
7,
31]. It allows the more or less objective description of each pH course and the reduction of the analysis to numbers, which can be then compared to the standards for a healthy/sick patient. Therefore, the specialist must find the parameters which are characteristic to GERD, which are shown in
Table 1, and sum them up to calculate the total DeMeester count. Subsequently, this value is then compared with a reference value of 14.71. If the value of the total DeMeester count is higher than the above-mentioned reference value, then the patient is diagnosed as sick.
Using the DeMeester method has major advantages. Every pH course can be assessed in the same way and can therefore be compared objectively, no matter what measuring device was used. Moreover, modern pH analysis programs calculate this value automatically; so, the physician can only glance through the pH course and confirm or reject the calculation, based on his own experience. Unfortunately, pH-metry has its limitations—the method only allows the detection of pH changes in the esophagus and gives no information about the state of the content passing through the esophagus (whether it is solid, liquid, or gas). This in turn makes it impossible to detect non-acid reflux episodes, which do occur [
15].
1.3. Wavelet Transform
The wavelet transform (WT) method used in this paper is a well-known method for decomposing a source signal and its subsequent representation by a linear combination of given base functions, known in the literature as wavelets. In a mathematical sense, wavelets are functions characterised by zero mean value, finite signal power, fast decay, and finite length. Wavelets are well localised in both the time (or space) and the frequency domains, which makes them particularly useful in the analysis of non-periodic and non-stationary signals with omnipresent singular points. Those features are characteristic for biomedical signals.
One of the key parameters that has a strong influence on the quality and accuracy of the wavelet transform calculation results is the correct selection type of the basis wavelet. In the present work, it was decided to use the Haar wavelet (which is synonymous with the Daubechies wavelet [
32]), which is useful for the analysis of discontinuous, non-stationary signals of high variability [
33,
34,
35,
36,
37,
38,
39].
To measure the quality of the assessment, the typical medical parameters were used: sensitivity and specificity [
2,
5,
6]. Sensitivity (1) is measured as the percentage of correctly diagnosed sick patients (true positives). This parameter is crucial in medical diagnostics since it gives the best outlook on the used method. It shows the probability of finding a sick patient from a population. Specificity (2), on the other hand, refers to the percentage of rightfully healthy patients out of all the patients diagnosed as healthy. This parameter describes a test’s ability to identify healthy patients from a population. This is helpful as such patients do not have to undergo other, often more time-consuming and expensive, tests to rule out a doubtful diagnosis.
2. Materials and Methods
Twenty-four-hour MII-pH data were collected from 20 patients of different ages and sexes. All the selected patients underwent 24-h impedance pH-metry to confirm or exclude reflux disease. The tests were performed in one and the same medical centre (Medical University of Gdańsk, Gastroenterology Clinic) and with the use of the same measuring device (Sandhill Scientific ZepHr, Sandhill Scientific, Highlands Ranch, CO, USA, owner: Medical University of Gdansk). The test results were always described by the same gastroenterologist—a second-degree specialist with many years of experience in diagnosing gastroesophageal reflux diseases using the traditional approach to diagnosing GERD. For every measurement, the total DeMeester count was calculated. The patients selected for the study were of different ages and sexes and had different pain related to the disease and different general symptoms. The aim of this approach was to obtain the most general picture of a sick or healthy patient so that the results of the study would not be influenced by a specific age group or gender. The patient’s pH courses were divided into two groups: 16 with reflux and 4 healthy.
2.1. Preparing pH-Metry Measurements
Statistical analysis (maximal, minimal, and mean values) was performed for the collected pH courses—the results are shown in
Table 2. The maximum pH value for the healthy patient group was 9.1005, whereas for the GERD patients it was 9.0414. The mean pH values were: 6.0928 for the healthy patients and 4.5769 for the GERD patients. This significant drop in pH values for unhealthy patients was expected since GERD patients tend to have lower pH results. The mean standard deviation in the case of the healthy pH courses was 0.99225, whereas the GERD patients’ pH courses had a mean standard deviation of 1.7581. Negative minimal values of pH can be registered in esophageal pH courses since the scale is logarithmic. The minimal values for the healthy and sick patients in this case were also negative, but the healthy patients had a higher (and closer to 0) mean value of the minimal pH than the GERD patients.
Statistical analysis of some of the total DeMeester counts for the healthy and GERD patients also delivered some interesting details. They are shown in
Table 3. The mean number of reflux episodes in the healthy pH courses was 36.75, whereas in the GERD patients it was 104.88—more than twice the number. The maximum number of reflux episodes for a healthy patient was 79, whereas for an unhealthy patient it was 235; the minimal number of reflux episodes for a healthy individual was 4, whereas for a sick patient the minimal number of reflux episodes was 35. Such data show a significant difference in the number of reflux episodes, which again is expected on the basis of the DeMeester criteria. Some GERD patients experience a higher number of episodes (even up to 10 in an hour) where their esophageal pH changes rapidly, whereas some patients have only 1–3 episodes per hour, but their duration is significantly longer and more steady. A graphical interpretation of the relevant data is shown in
Figure 1. However, it should be noted that these are only aggregate statistics as the diagnosis of gastroesophageal reflux disease based on the total DeMeester count is carried out individually and is very individual. Therefore, it is very important that the diagnostics based on this method are carried out by a specialist gastroenterologist who is able to properly interpret the pH-metry records, confronting the result of the total DeMeester count calculation with the pH course.
2.2. Methodology
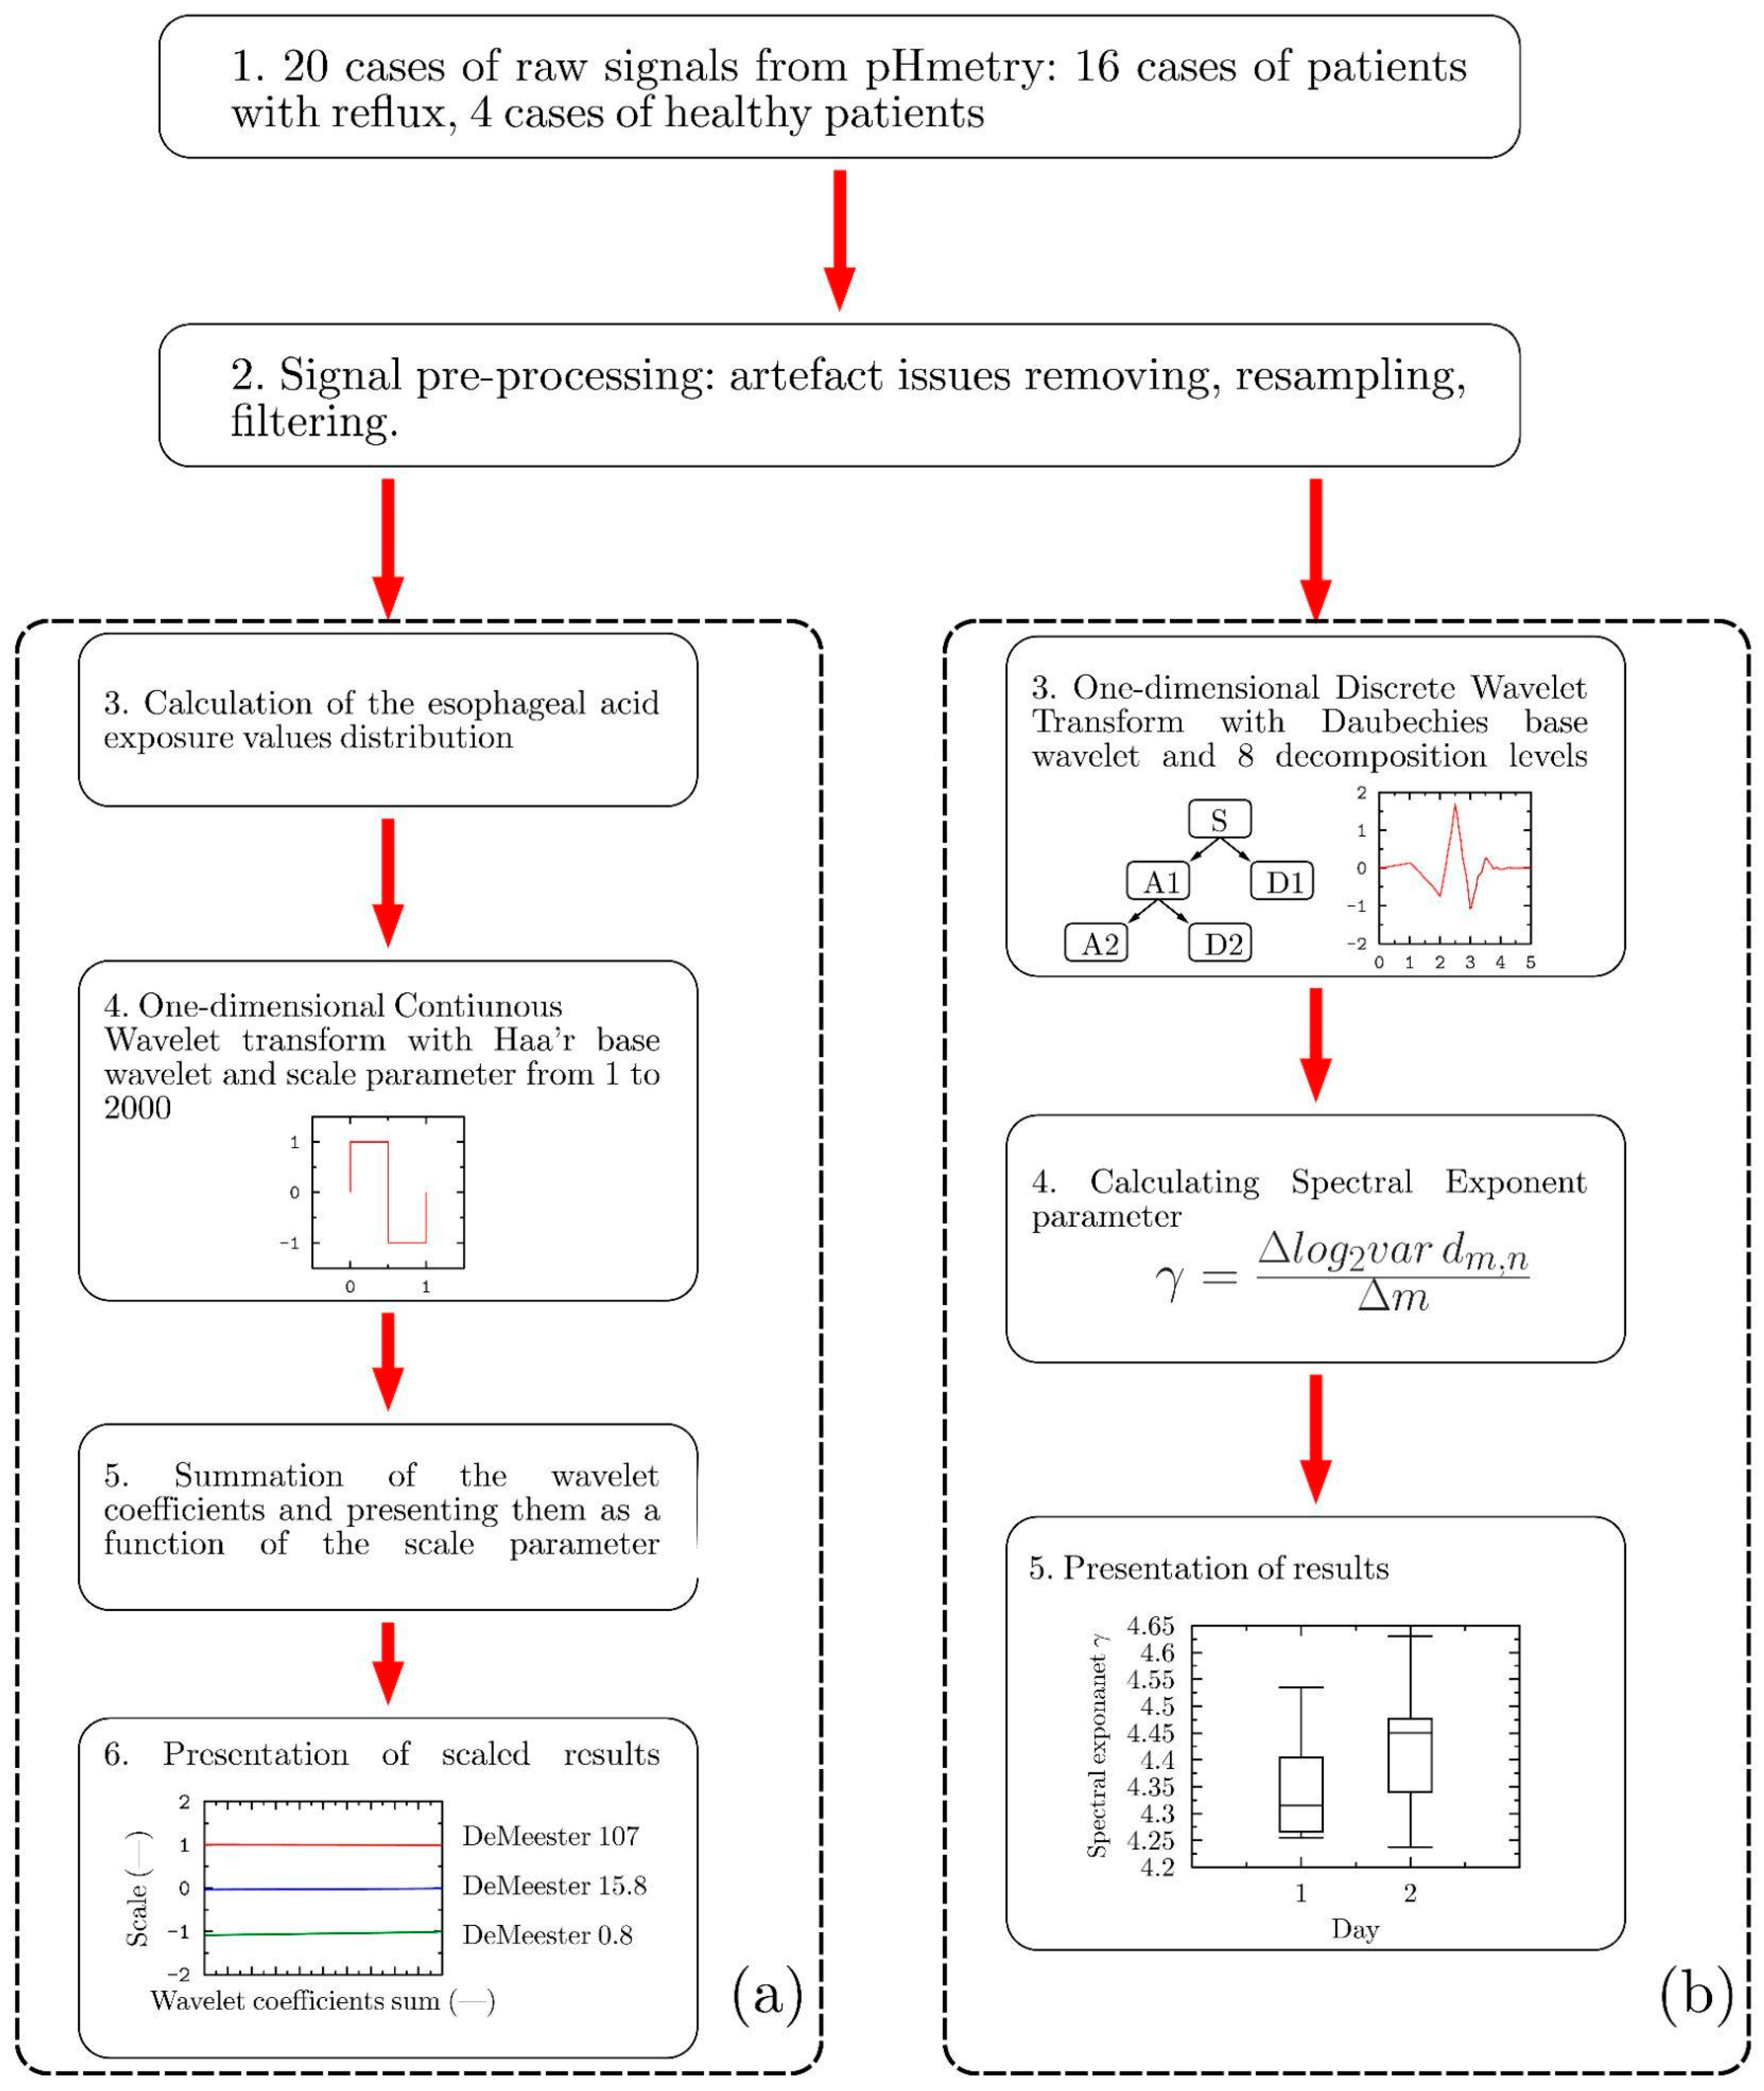
The schematic diagram presented in
Figure 2 illustrates the research methodology employed by the authors in the study; it focuses on two methods of signal decomposition based on wavelet transforms to classify a patient undergoing pH-metric examination into one who is healthy or one with symptoms of reflux. First, a continuous wavelet transform (CWT) was used to determine the specific wavelet coefficients describing the correlation between the selected basis wavelet and the signal undergoing the decomposition process.
Figure 2a illustrates the calculation methodology based on the application of the CWT, which led the authors to the calculation of the sums of the wavelet coefficients.
As the second method, the wavelet-based fractal analysis (WBFA) was chosen. The authors selected this approach due to the fact that the analysed signals can be interpreted as a time series (with some features of a stochastic process). At the same time, the signals manifesting the characteristics of a stochastic process can be well described by the power spectral density (PSD), which represents the signal power associated with particular frequencies, ω. The PSD calculations enable the study of the frequency content of the stochastic processes, as well as the identification of any periodic behaviour associated with them [
40]. It should also be mentioned that many biosignals are characterised by PSD distributions corresponding to 1/f processes (pink noise), which in practice means that their amplitudes are inversely proportional to the frequency f [
41,
42].
In the research presented in this paper, the authors used the WBFA method to determine the pH signal correlations in a manner similar to that of Tan et al. [
43]. They analysed the effect of different drugs on heart rate variability (HRV) in a group of 10 healthy subjects using fractal methods. This approach proved to be correct in a similar analysis [
44]. Self-similarity of the tested signals was analysed using the spectral exponent
γ determined by the WBFA method:
where
dm,n denotes the wavelet coefficients calculated using the discrete wavelet transform (DWT) analysis [
45]. The methodology employed based on the DWT analysis is schematically presented in
Figure 2b. The Daubechies base wavelet (db3) and 8 decomposition levels were used to calculate the spectral exponent coefficients.
The essence of the method presented in this paper, based on the application of CWT, is the determination of the sum of the wavelet coefficients as a function of the scale parameter. In contrast, the application of the WBFA method provides spectral coefficients, including all the necessary resultant information. The differences between the results representing the 24-h pH measurements for the patients with different conditions may indicate the existence of some subtle but significant changes in the signal under investigation, which can help in making a proper diagnosis. The results obtained can also confirm the validity of the proposed methodology and the developed numerical tool for determining the patient’s health status.
For the calculations of the wavelet coefficients (for both types of wavelet transform), the standard procedure calculations were used, using the MATLAB R2013a software. Based on the documentation provided by the MATLAB software developer, it can be stated that this function uses the L2 norm.
3. Results
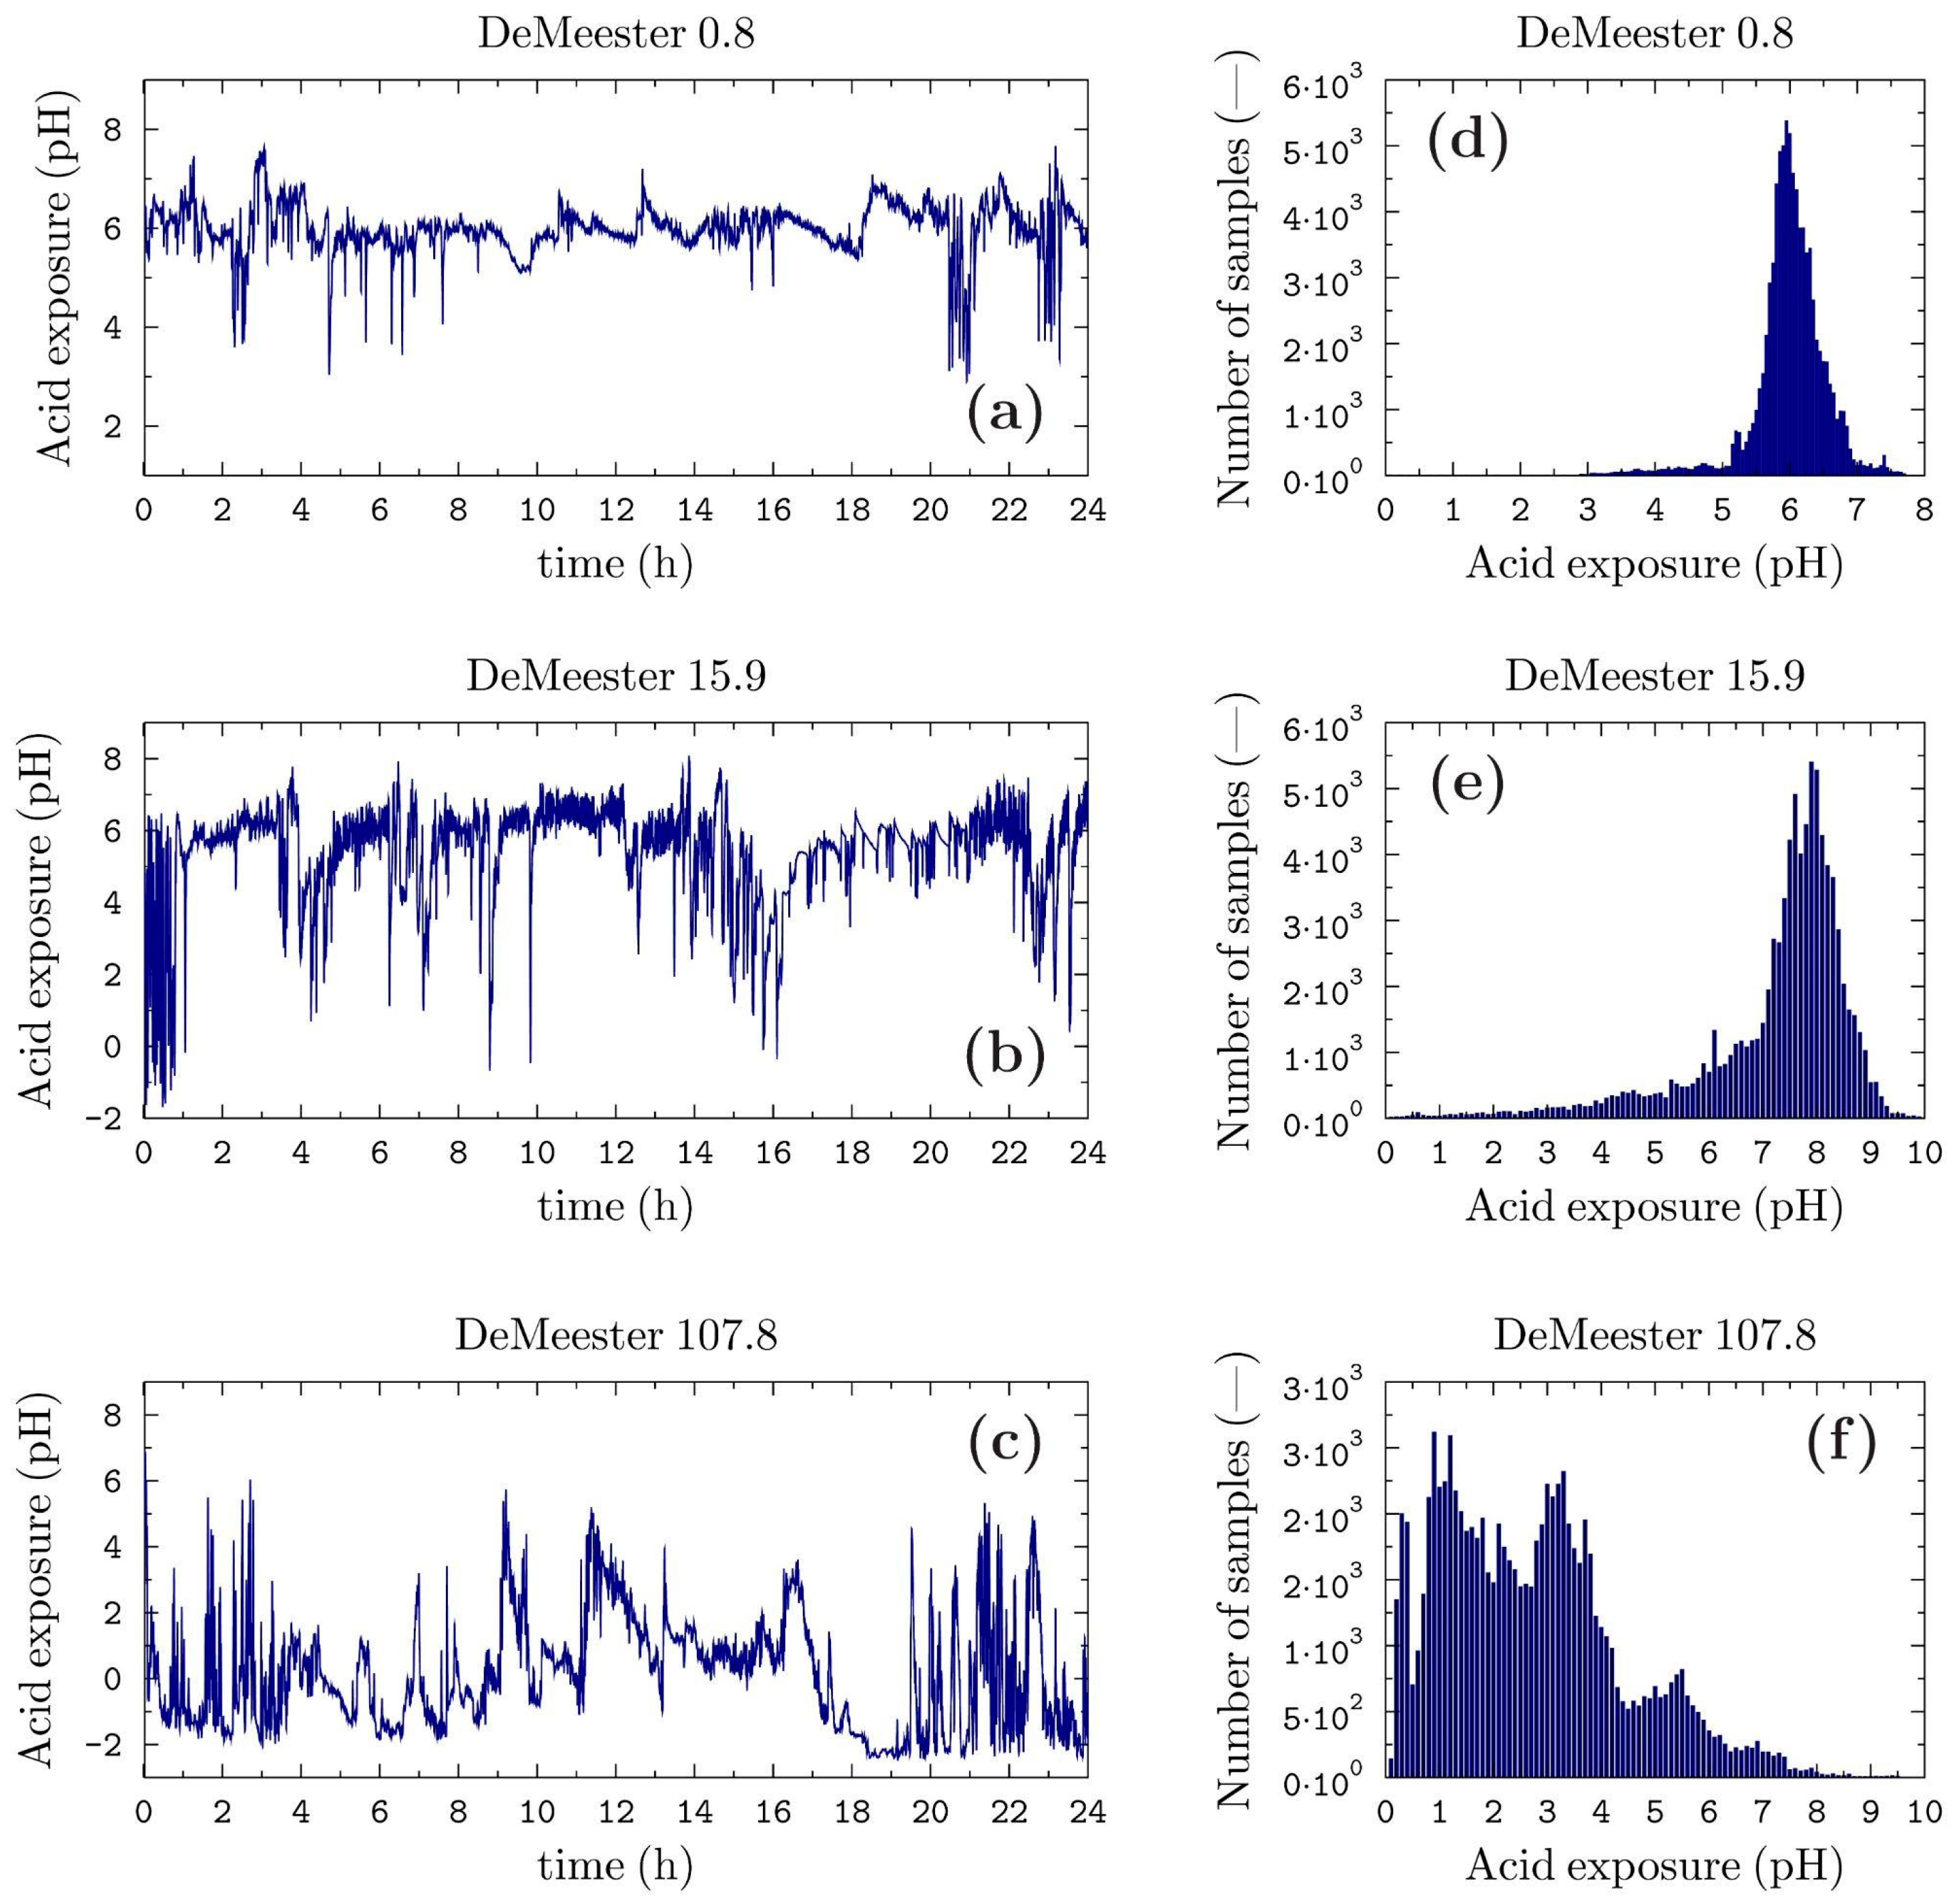
In the first step of the main calculation phase (for the data after the clearing from artefacts, resampling, and filtering processes), the 24-h pH time signal was processed by the determination of the distribution of the pH values in the assumed range (from zero to maximum value for each patient).
Figure 3 shows the result of the signal processing in the cases of three selected patients.
The measurement data of the patients with the minimum and maximum total DeMeester score (definitely healthy and definitely sick) and for the patient whose total DeMeester was closest to the value of 14.7 (being the literature’s cut-off value between healthy and sick) were selected as marginal cases. These cases are used later in the study as representative of the identified patient conditions.
Figure 3d–f show the corresponding distribution of these signals in the inverse domain, i.e., the number of samples vs pH.
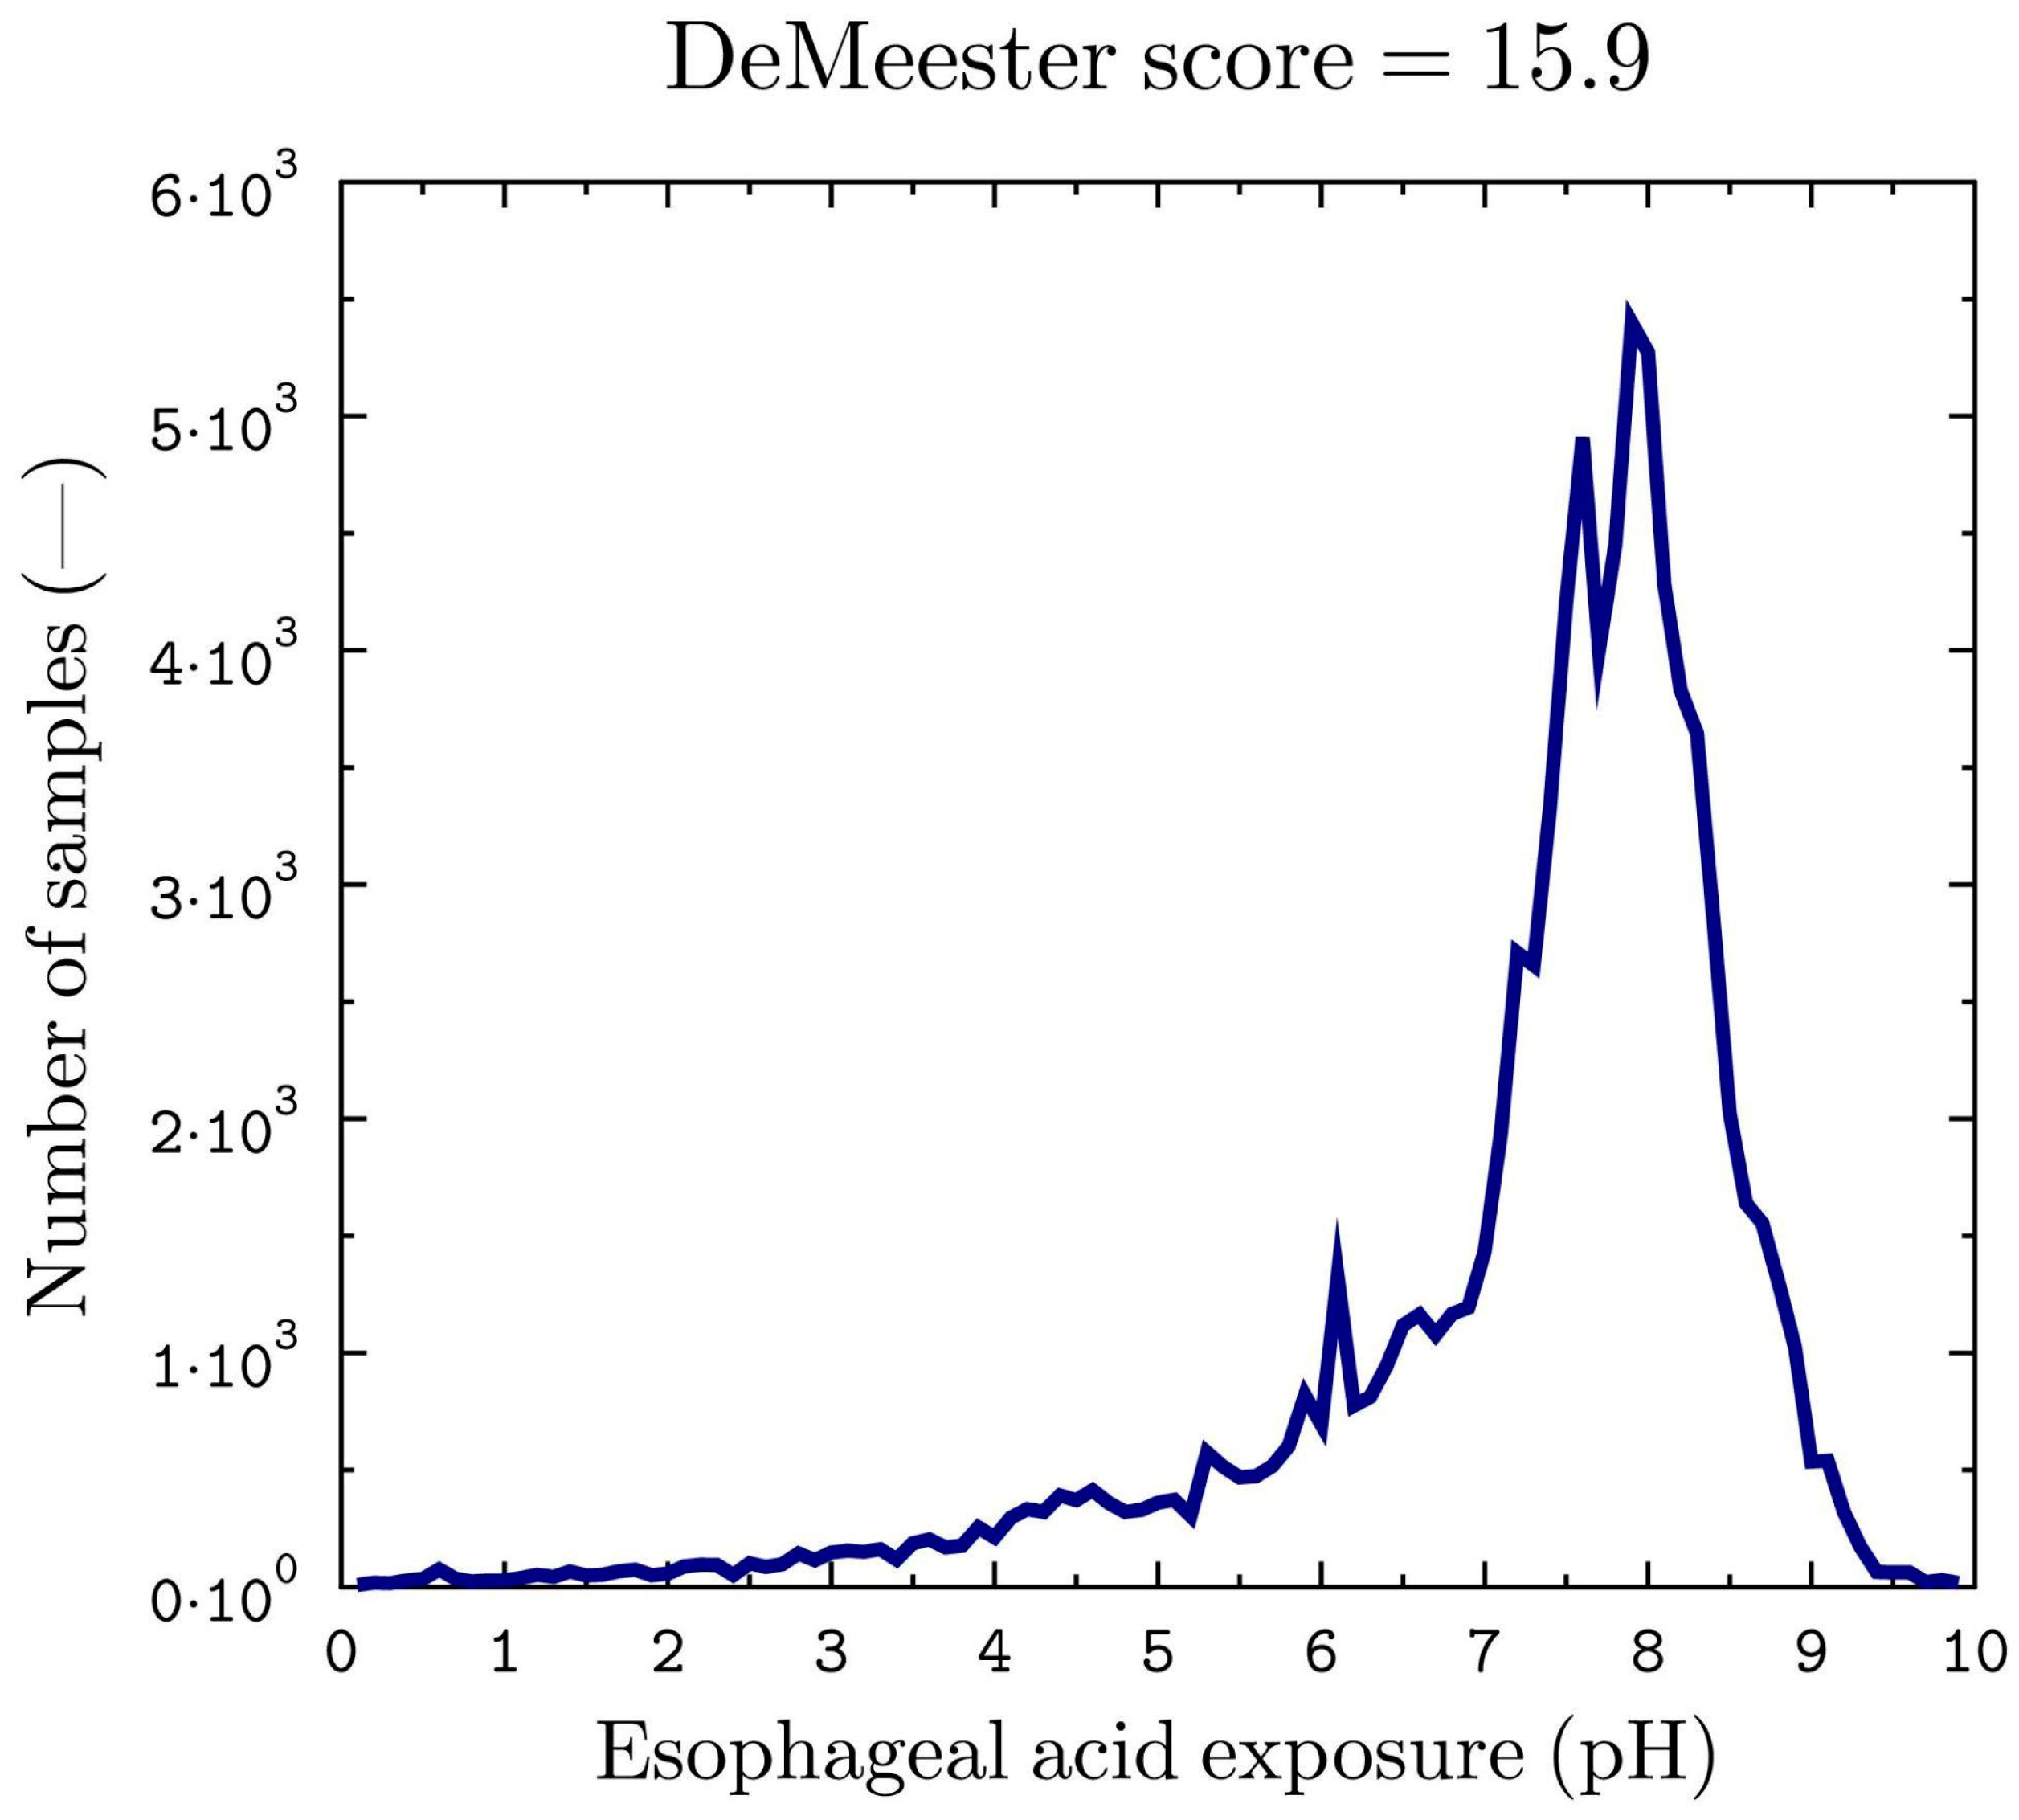
The presented operation allowed the authors to replace the non-stationary and discontinuous 24-h pH signals as time-independent by extracting their global features. The signals obtained by this procedure are devoid of the undesirable edge phenomenon (the beginnings and ends of the signals analysed are smooth and zero-valued), which is undesirable from the point of view of the wavelet analysis method. The final form of the signal (obtained from the distribution of the pH values for the threshold case considered), subjected to continuous wavelet transform analysis in the next stage of the study, is shown in
Figure 4.
In the second step of the current pH signal assessment procedure, the CWT was applied in order to determine the necessary wavelet coefficients. In essence, the wavelet transform shows the extent of the correlation between the investigated signal and the wavelet at the given scale. The lower the similarity, the closer the values of the wavelet coefficients are to zero. Therefore, the wavelet transform makes it possible to locate low and high-frequency features in the signal by analysing variations in the wavelet coefficients.
As one of the basic assumptions of the calculations carried out was to take into account both the low- and the high-frequency features of the signal, in the wavelet analysis the scale parameter was increased until the wavelet coefficients of the entire analysed signal were close to zero. Finally, the maximum scale value was set at 2000.
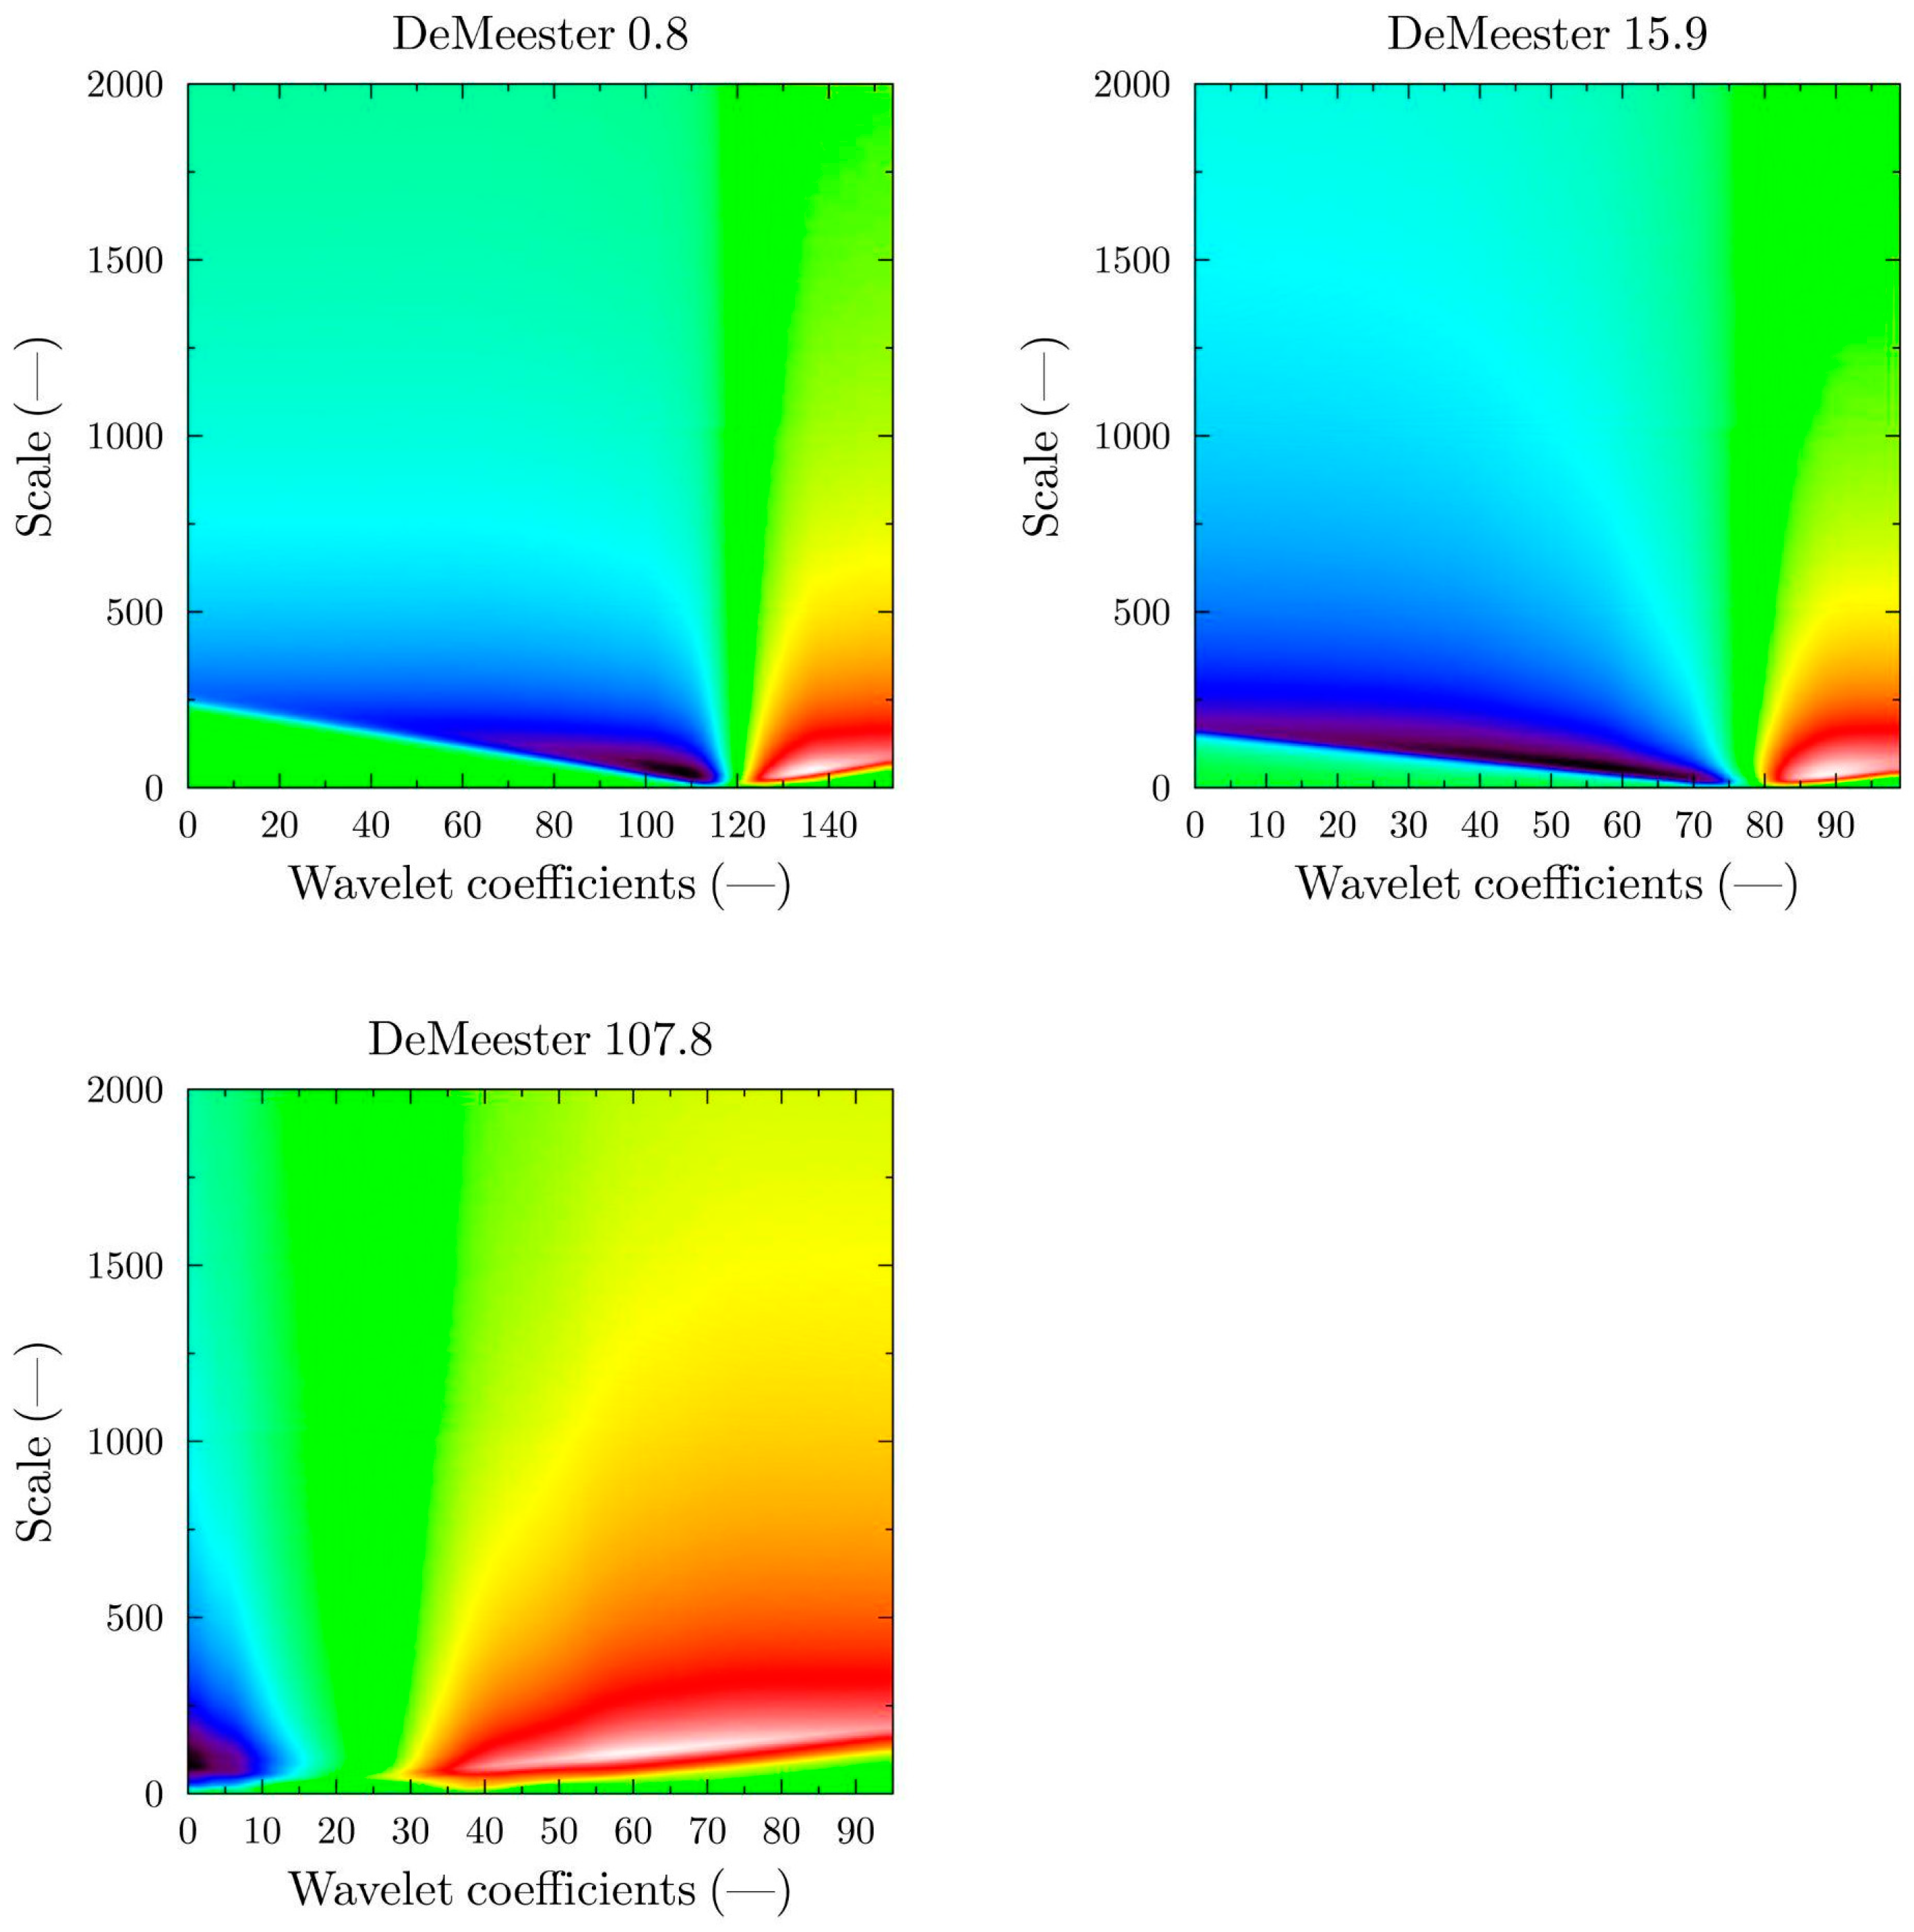
Scalograms were used for the clearest representation, in a graphical form, of the wavelet transform results for a given scale range. The scalograms represent the changes in the wavelet coefficients as a function of the scale. The typical scalograms of the pH-metry signals obtained for the Haar wavelet related to the 24-h measurement procedure are shown in
Figure 5. A low value of the scale parameter of the basis function means that the signal is analysed at the highest possible level of detail. The higher the scale value, the more the given signal is analysed in the direction of searching for more global features.
In the following step, the calculated wavelet coefficients were summed up and related to the succeeding scales in order to reveal any quantitative differences between the particular pH signals measured.
Figure 6 presents the calculated curves representing the state of a selected patient.
A cross-comparison of the curves shown in
Figure 6 for the extreme cases shows that the results obtained not only allow a healthy–sick patient condition to be distinguished but also allow for a preliminary estimate of the level of the patient’s condition. The calculation results for the healthy patient have the lowest value for the sum of the wavelet coefficients, while for the patient diagnosed with reflux the results are the highest. To confirm the validity of these conclusions, the calculations were carried out, and the results were then compared for all the patients in the measurement programme.
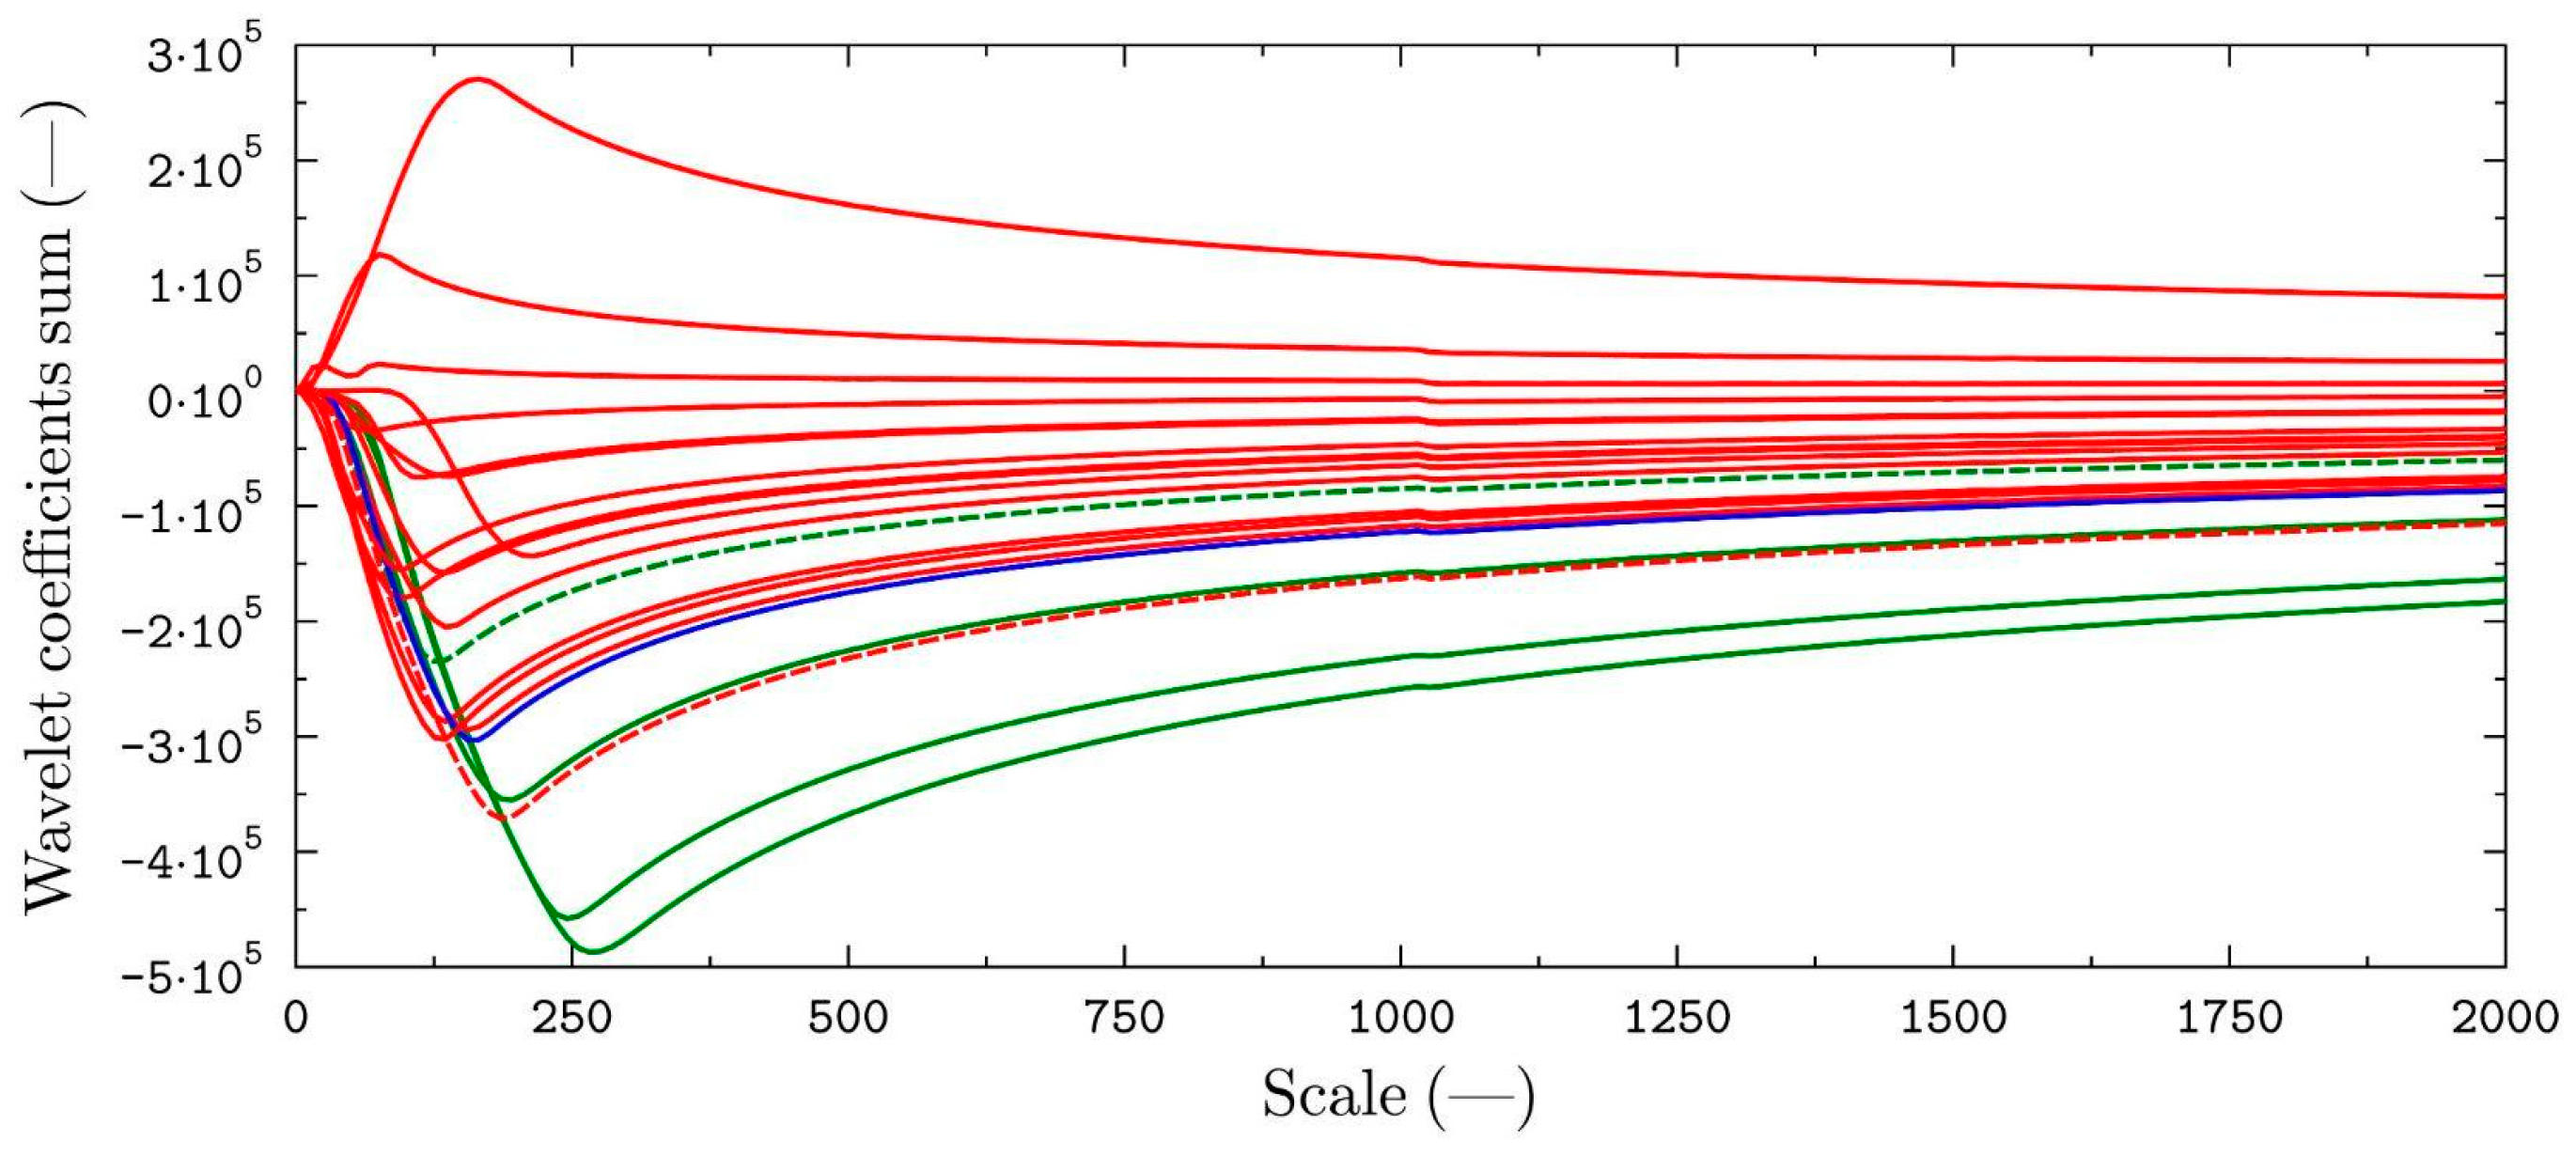
A summary of the results (
Figure 7) shows a clear clustering of the curves for the patients with diagnosed GERD (red line) above the curve taken as the cut-off value (DMS = 15.9, blue line) and a clustering of healthy patients below the cut-off value. Only in one case was a healthy person assigned to the group of patients with GERD (DMS = 12.4, green dashed line), and one patient with diagnosed GERD (DMS = 17.0, red dashed line) was marked as healthy.
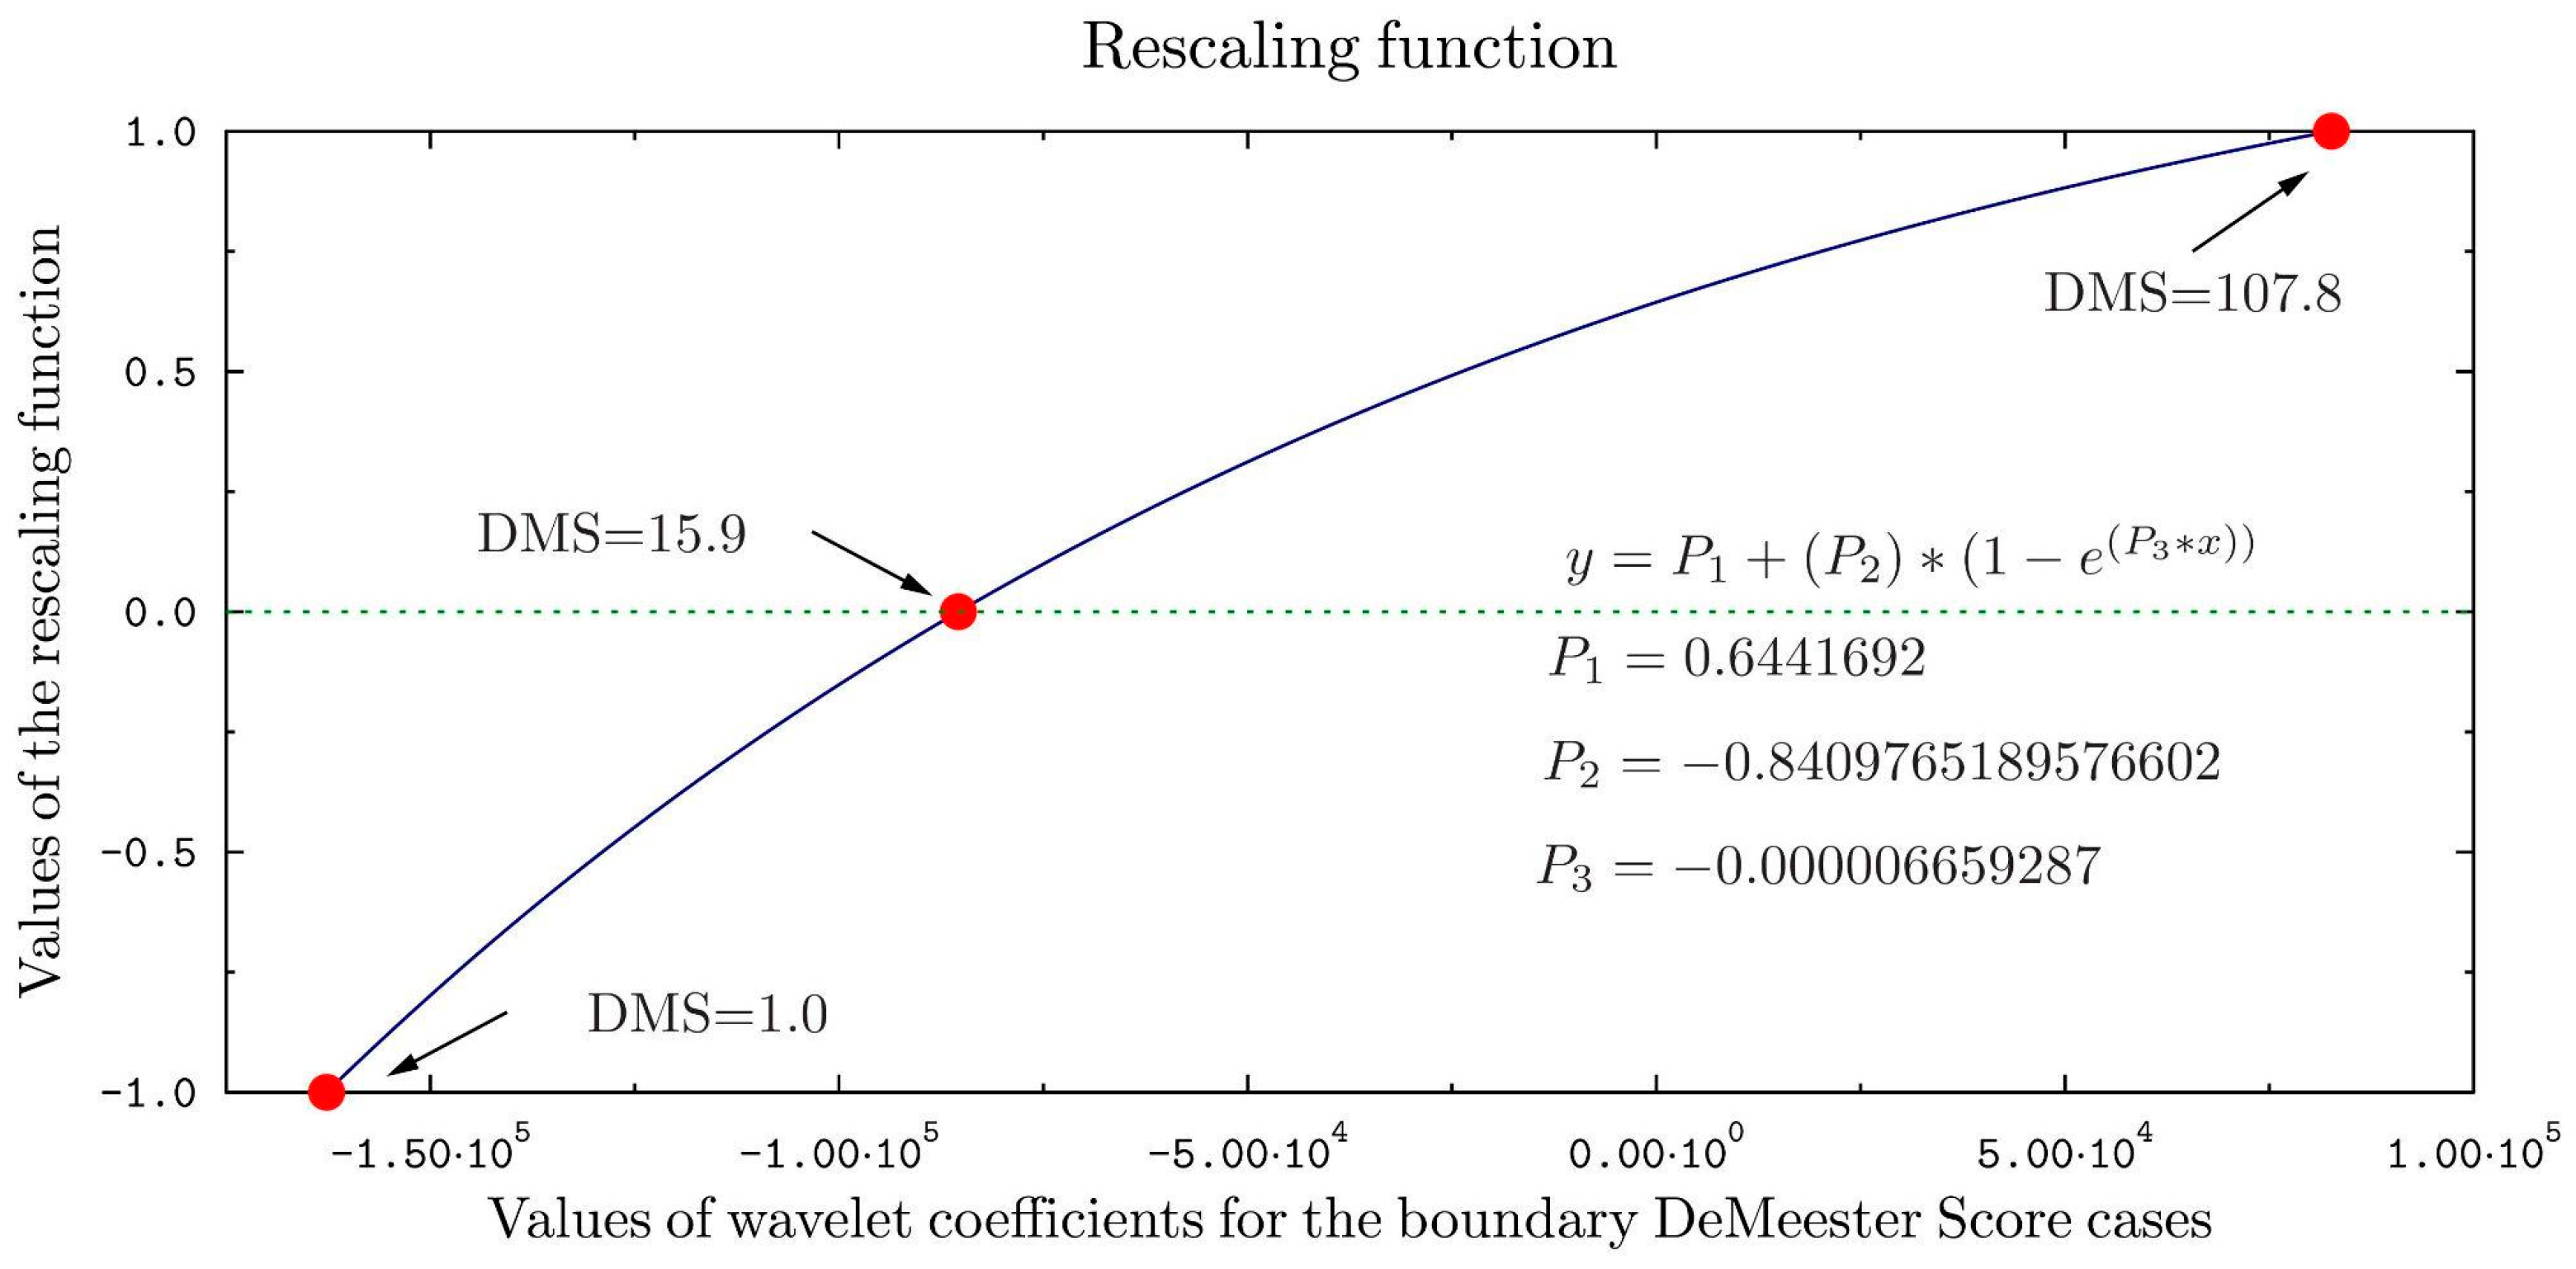
In order to more clearly differentiate the group of patients with diagnosed reflux from healthy patients, a transformation using a scaling function specially designed for this purpose was applied. The scaling function is shown in
Figure 8. The parameters of the exponential scaling function were determined from the results of the calculations for the marginal cases of a healthy patient (DeMeester score = 0.8) and a patient with reflux (DeMeester score = 107.8). The patient case with a calculated DeMeester score equal to 15.9 was taken as the borderline between the sick and healthy cases.
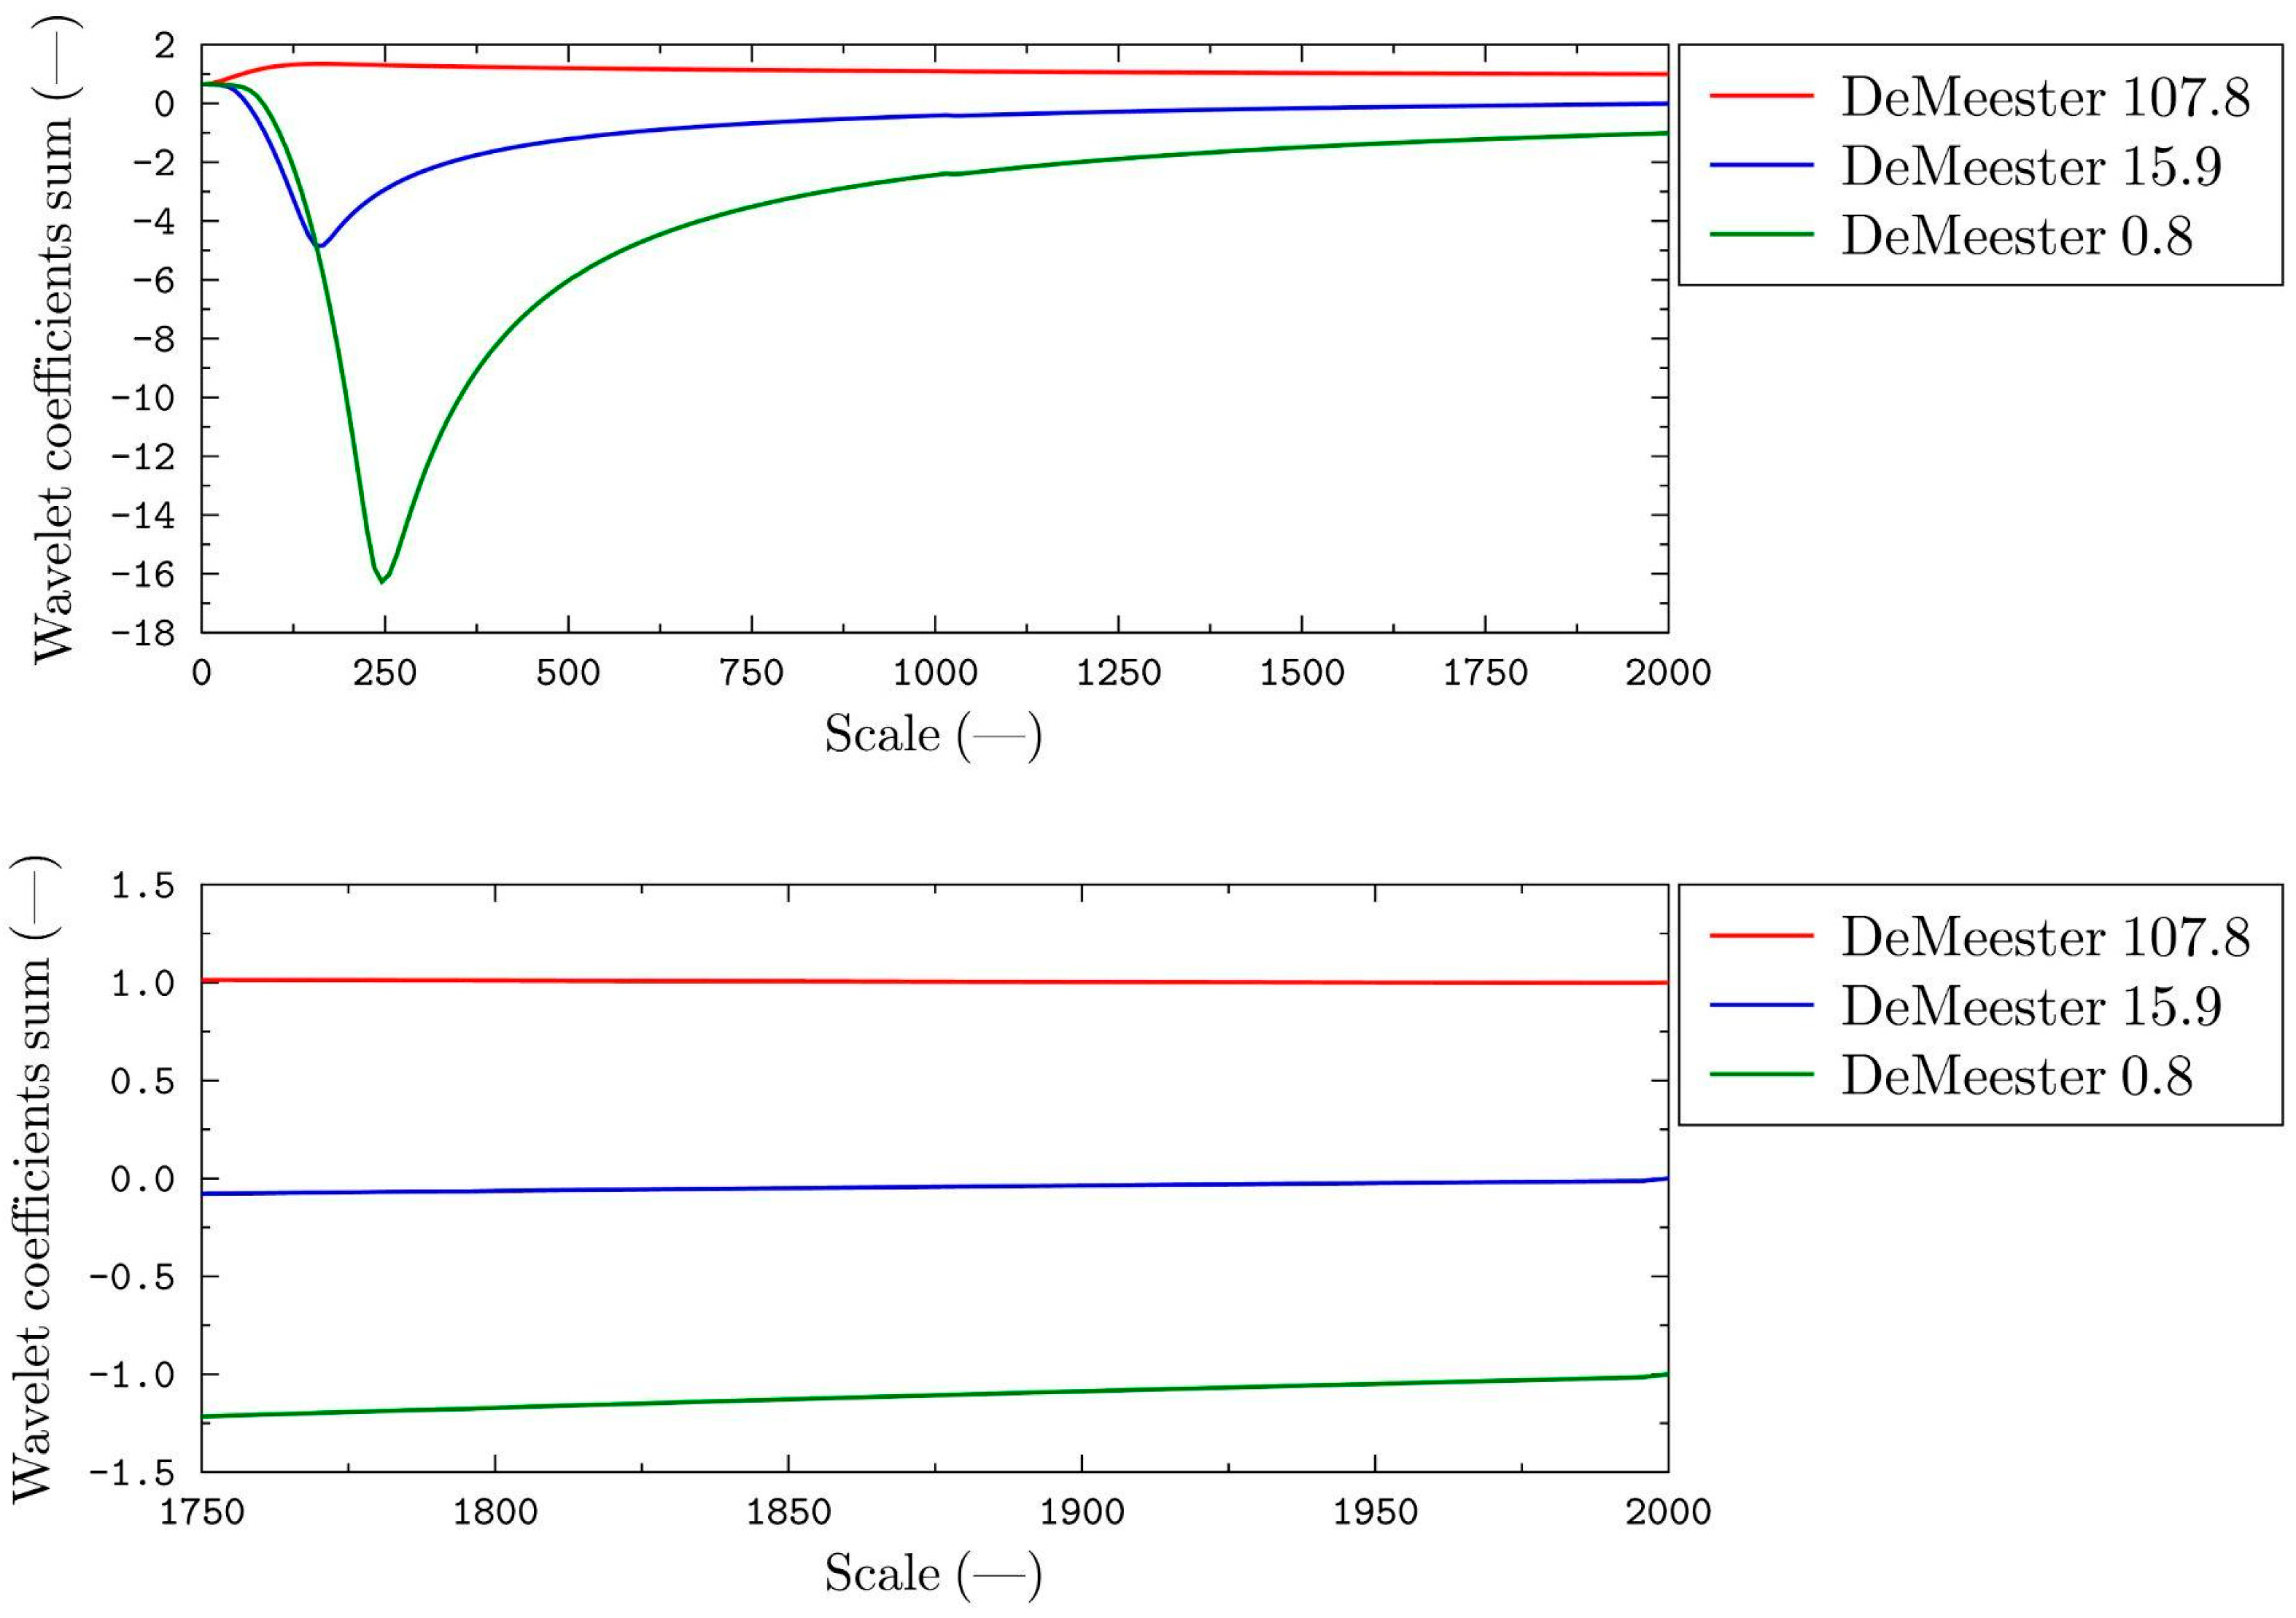
The result of the rescaling process for the marginal cases is shown in
Figure 9.
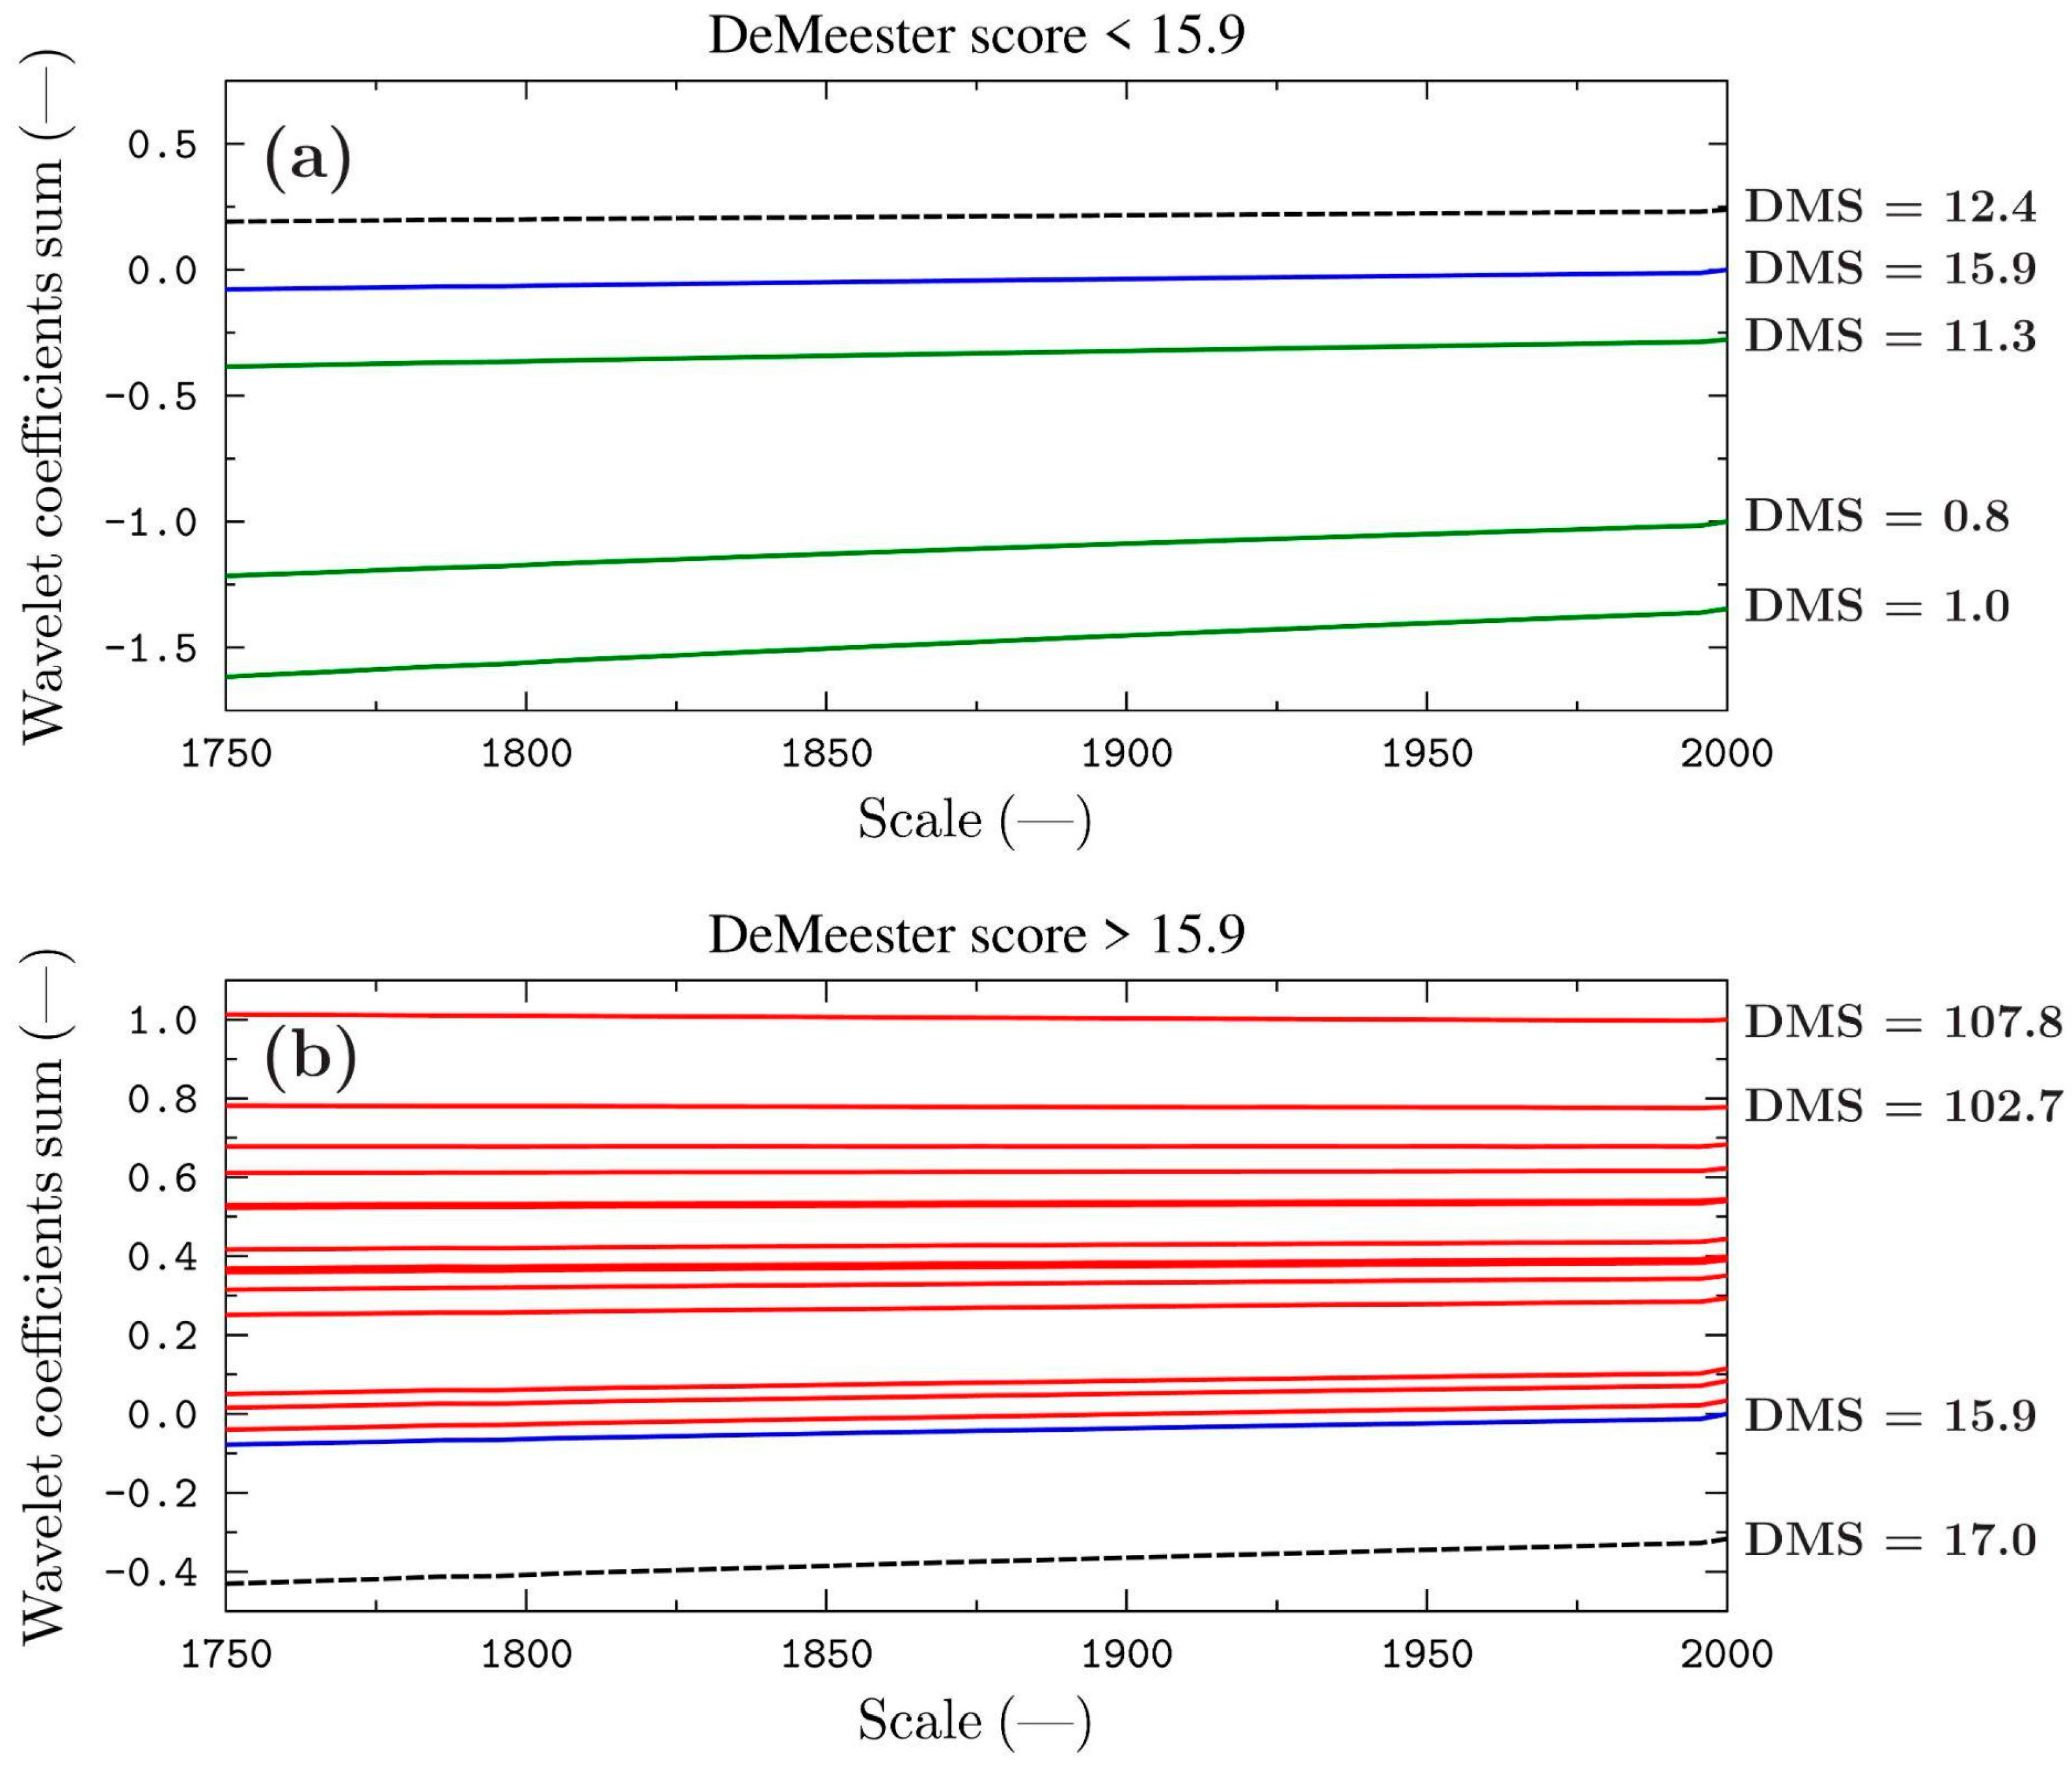
Figure 10a shows the results of the classification process for all the healthy patients (DMS < 15.9), while
Figure 10b shows the results of the classification process for all the patients diagnosed with GERD (DMS > 15.9). The main aim of this procedure was to obtain curves with values ranging from −1 (completely healthy patient—lowest DeMeester Score) to +1 (patient with the highest DeMeester Score). The curve drawn from the pH signal of the patient whose measurement data were taken as the boundary between the sick and healthy group corresponds to the zero value on the graph.
A summary of the results shows a clear clustering of the curves for the patients diagnosed with GERD above the curve taken as the cut-off (scale value greater than zero at point 2000 in
Figure 10) and a clustering of healthy patients below the cut-off (scale value less than zero at point 2000 in
Figure 10).
Based on the Formulas (1) and (2), the sensitivity and specificity for the results of the calculations with the use of CWT were determined. As the patient’s data with a DeMeester score of 15.9 were adopted as the borderline for the distinction between sick and healthy, this case was not taken into account when determining the values of sensitivity and specificity. The results of the calculation of these parameters are summarised in
Table 4. The calculations were repeated several times—each time obtaining the same assignment result.
Fractal Dimension
In the second stage of the study, the self-similarity of the pH signals was investigated to confirm that it is possible to automatically classify patients into a specific group.
It was assumed that the fractal properties of the pH time series obtained in the healthy persons are changed in the measurement data recorded in the subjects with the disorders resulting from diagnosed GERD. The methods of fractal statistics make it possible to study the correlations between the measured values at different levels of detail over the entire available time range of the signal under study.
This study used the calculations of the gamma spectral exponent of the 1/f processes. This factor is characterised by a high sensitivity to subtle changes in the features of the 1/f process signal under study. The main assumption made by the authors was that the gamma spectral exponents determined for the pH signals with different total DeMeester scores should also be different.
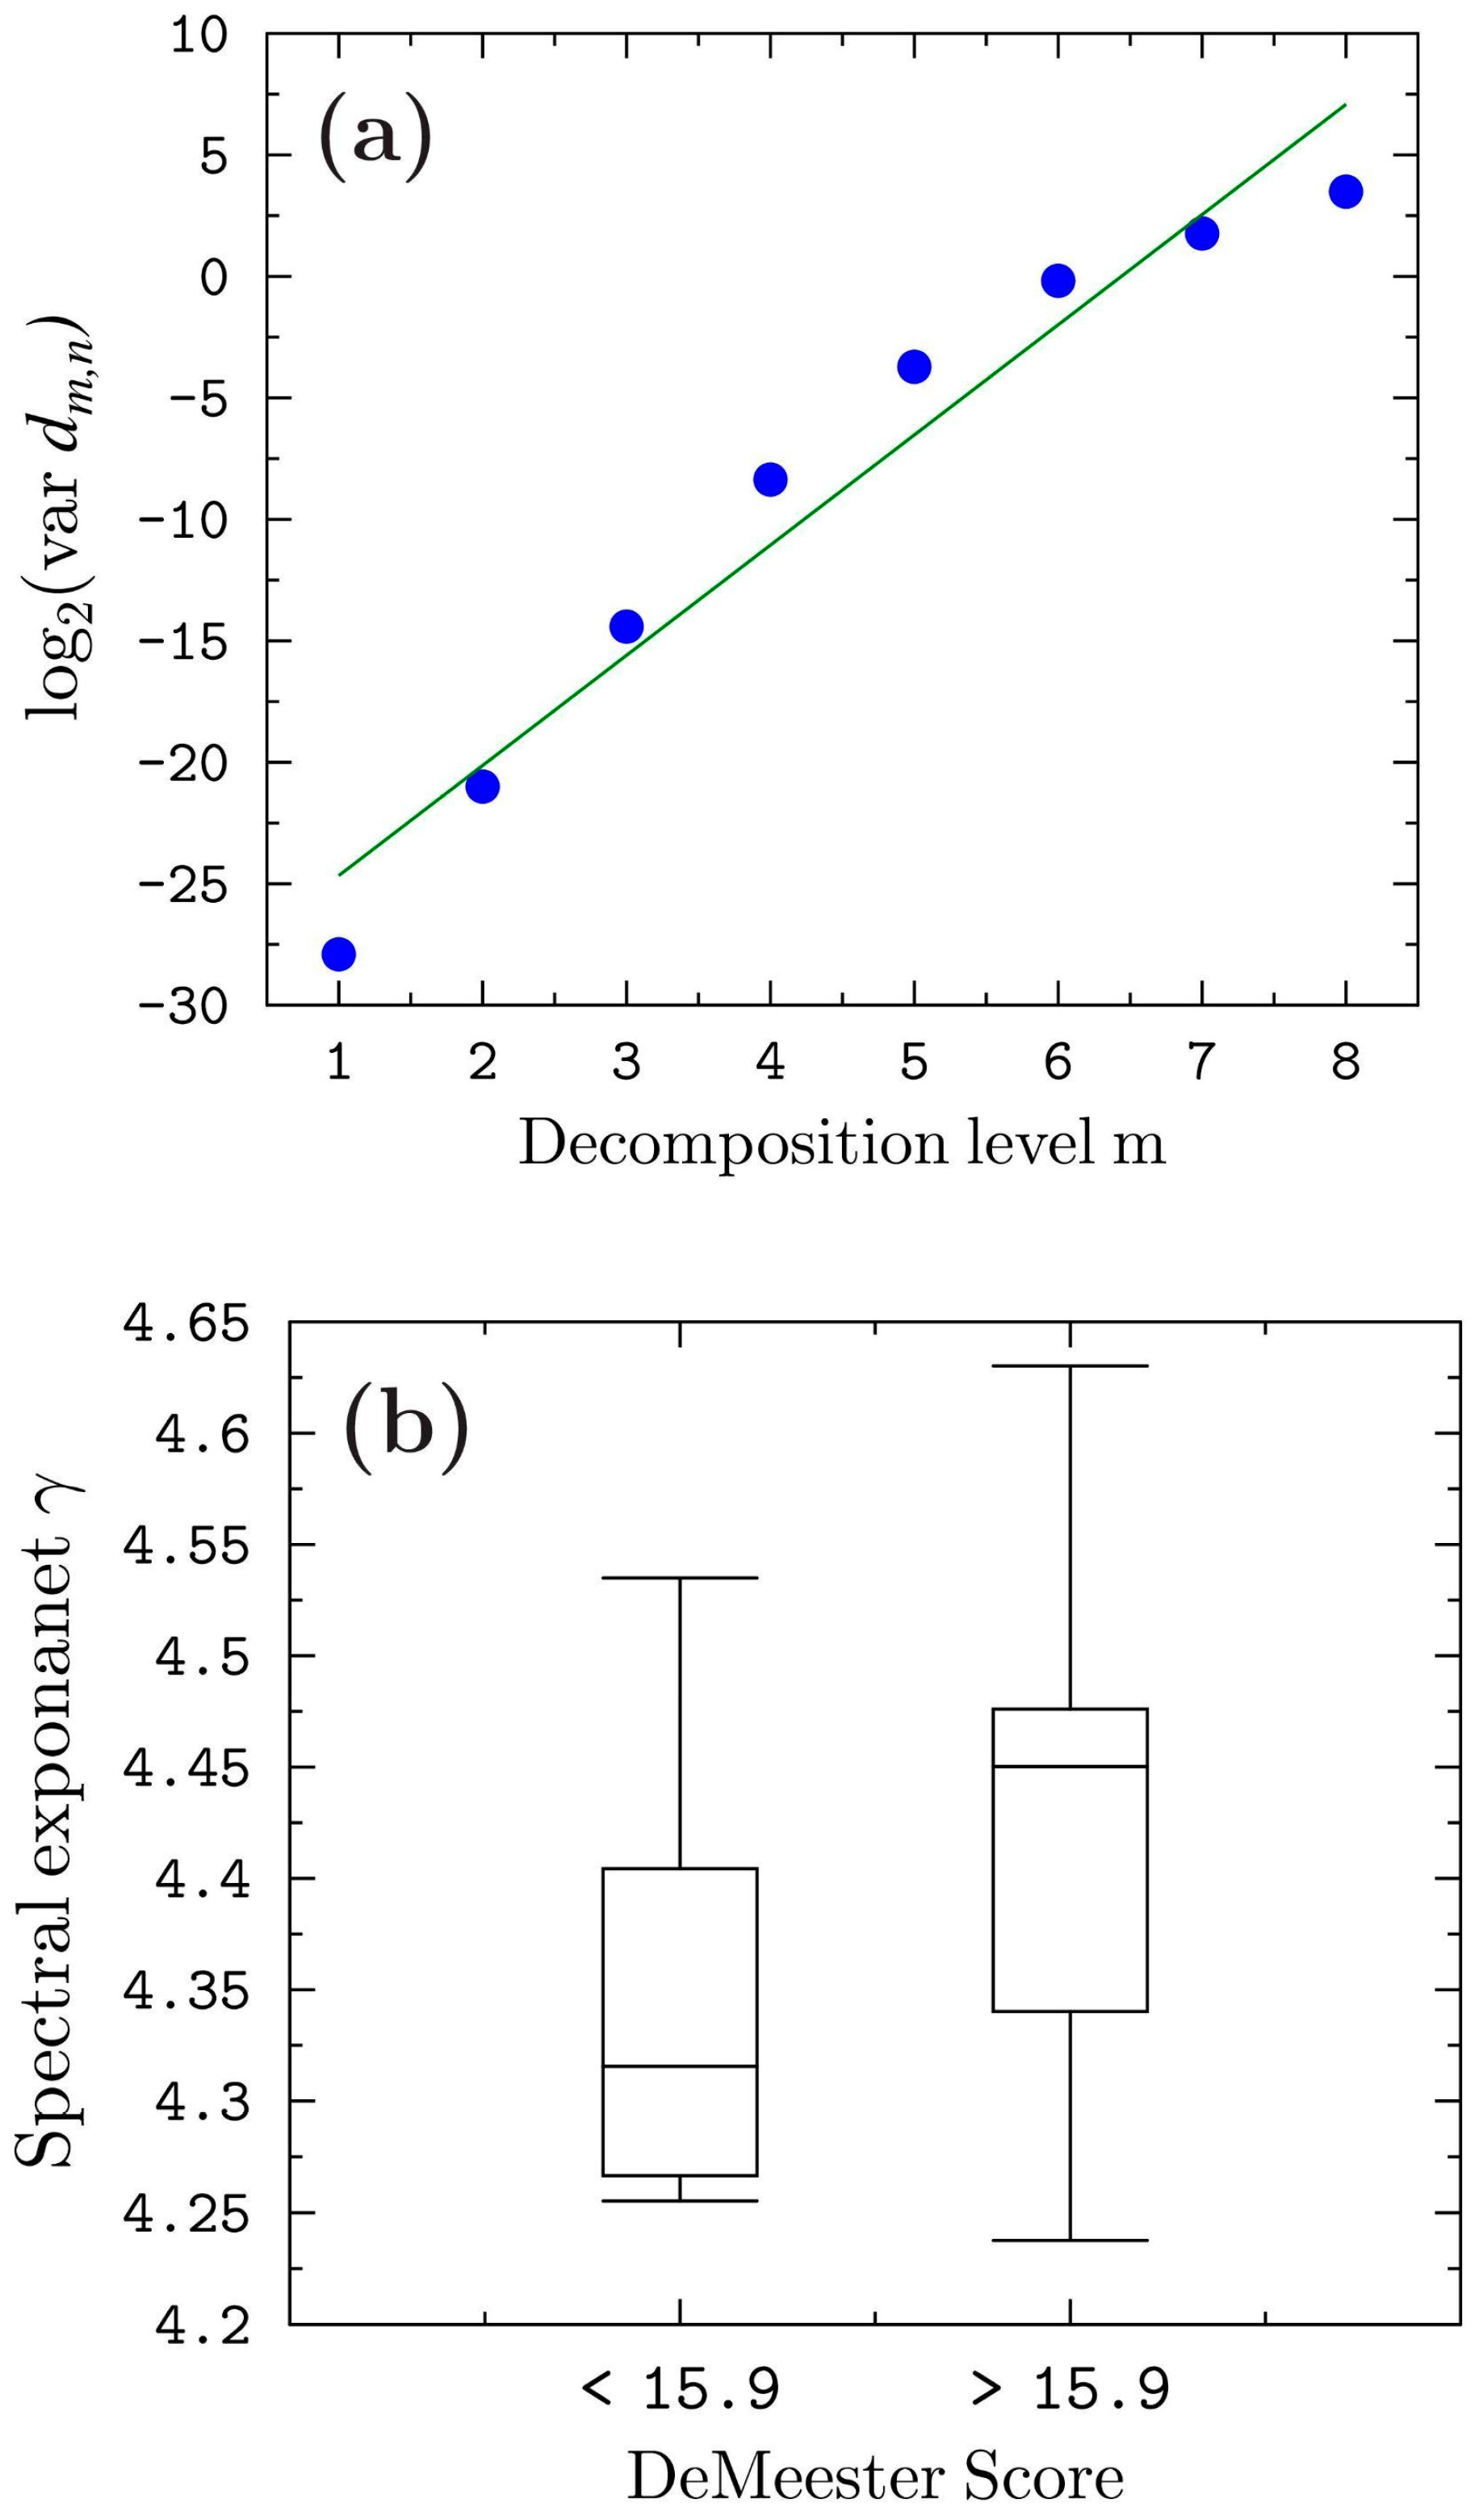
The values of the gamma exponents, for 24-h measurements of acid exposure, were determined according to Equation (1) using the DWT method. The gamma exponent can be graphically interpreted as the slope angle of the trend line for the points obtained from the discrete wavelet transform of the signal under study (
Figure 11a).
Figure 11b additionally shows box plots based on the fractal dimension analysis, illustrating the similarities and differences between the healthy and sick patients.
The analysis of the fractal calculation results, which are presented in
Figure 11b, clearly shows that the healthy subjects (total DeMeester < 15.9) have common features that differentiate them from the measurement data collected for the subjects diagnosed with GERD (total DeMeester > 15.9). These results both confirm the validity of the assumptions made by the authors and indicate the superiority of the method presented earlier in this chapter, which was based on the use of CWT. This method allows not only a simple classification of the patients into sick or healthy groups but also an indication of the stage of the pathology. In addition, the results of the applied method do not require interpretation by a specialist, which significantly accelerates and simplifies the procedure of the preliminary diagnosis of the examined patient. The method also does not require sophisticated and high-performance computing equipment, which allows its potential implementation and application as early as the stage of real-time measurement data recording.
4. Conclusions
The research led to the development of a new method to successfully access the esophageal pH-metry data. Summing up the results of the research, it can be stated that the results of the study confirmed that the tested signals have features that enable their fast and automatic classification and assignment to a group of sick or healthy people with the use of the various methods of wavelet transforms. The results with the WT methods provided the high value of the success rate (89.5%—17 successes out of 19 attempts) as well as the values of sensitivity (93.33%) and specificity (75%). Therefore, this approach can be implemented in medical programs for research as well as for clinical use.
The main advantage of the presented method is that it allows not only for a simple classification of the patients into sick or healthy groups but also for an indication of the stage of the pathology. This has been achieved by the clear clustering of the curves for the patients diagnosed with GERD above the curve taken as the cut-off (scale value greater than zero) and the clustering of healthy patients below the cut-off (scale value less than zero). In addition, the results of the applied method do not require interpretation by a specialist, which significantly accelerates and simplifies the procedure of the preliminary diagnosis of the examined patient. The method also does not require sophisticated and high-performance computing equipment, which allows its potential implementation and application as early as the stage of real-time measurement data recording.
Further research on the development of the signal analysis methods related to the measurement of esophageal acid requires the collection of high-quality, verified measurement data from a large number of patients with different states of health. This would enable the authors not only to validate the procedures presented in the article but also to use advanced methods based on machine learning, which make it possible to determine the correlations between the parameters of seemingly unrelated signals. The authors realise that modern medical diagnostic tests are increasingly based on multi-parametric analysis, using not only the main measurement quantity (e.g., impedance or pH) but also additional biosignal parameters such as temperature, SCL, HR, oxygen saturation level, or even EEG. Recording, analysing, and studying the correlations between several different bio-parameters would make it possible not only to determine the patient’s current state of health but also, potentially, to assess how the patient’s physiological system reacts to the applied drug treatment or its effectiveness.
The proposed methods can be used as a preliminary assessment procedure when analysing esophageal pH courses, which would be subject to verification by a medical specialist in the course of further analysis. Using the developed methods, it is possible to obtain the result/diagnosis of gastroesophageal reflux disease in a few seconds. Using the traditional method, the total DeMeester count, the test result can be obtained even after a few hours (the time needed by a gastroenterology specialist to calculate the total DeMeester count, perform an analysis of the pH course with appropriate exclusions, interpret the test, and finally make a diagnosis). The amount of work performed by the doctor is significant, lasting up to several hours per examination. It also requires the physician to be experienced in reading and interpreting pH waveforms. This all adds up to a significant increase in testing time and cost. For the computer analysis of the pH waveforms, only the pH waveform itself is needed. The algorithm developed by the authors of the work allows the result of the analysis (and possibly a diagnosis proposal) to be provided in a few to several seconds (depending on the computing power of the computer). A particular advantage of the presented method is that its implementation on a computer is quick, and the calculation process takes a small amount of time. This in turn leads to a fast diagnosis suggestion that is computed and available for the gastroenterologist. As it was the first attempt to use wavelet transforms with fractal analysis in the case of GERD diagnostics, it is understandable that by adding and using impedance measurements the procedure can be perfected so that the results are better. The first step would be to include more patients and more data. Moreover, further research can be performed to determine and produce a computer system capable of distinguishing between the GERD-correlated diseases and complications (known or unknown for the patient at the time of the measurement). A very important step, however, will be the application of the developed methods and approaches to pH-metry with impedance. This approach will allow the checking of whether it will be possible to find similar relationships in the esophageal impedance waveforms, which would lead to the possibility of developing one of the first effective methods of computer-aided esophageal impedance analysis in the diagnosis of GERD (including non-acid reflux).
It is worth emphasising that the research carried out and described in this work is one of the first pilot studies. The authors, undertaking the implementation of the issue, intended to test the thesis stated at the beginning. If the research assumptions had been confirmed, the authors would have planned to continue the research, with a wider scope, using the methods proven and described in this work, with the use of the appropriate modifications, to improve the research quality indicators—sensitivity and specificity. Only then can formal actions be taken to develop a medical device/system supporting the diagnosis of reflux diseases and to apply for legalisation, certification, and admission of the device for use in health facilities.
Author Contributions
Conceptualization, P.M.T., G.R. and M.J.; methodology, P.M.T., G.R. and Ł.D.; software, Ł.D. and J.S.; validation, P.M.T. and M.D.; formal analysis, G.R.; investigation, P.M.T., G.R. and Ł.D.; resources, M.J.; data curation, P.M.T. and J.S.; writing, P.M.T. and G.R.; writing—review and editing, P.M.T., Ł.D. and G.R.; visualization, Ł.D.; supervision, G.R.; project administration, P.M.T. and G.R.; funding acquisition, G.R. All authors have read and agreed to the published version of the manuscript.
Funding
This research received no external funding.
Institutional Review Board Statement
Not applicable.
Informed Consent Statement
Patient consent was waived due to the fact that the data collected from the participants were obtained as a standard diagnostic/medical procedure and only after that used in research. Moreover, every participant agreeing to be diagnosed/treated in a university/teaching hospital is informed that their measurements can be used in research, providing that no identifying data are connected with the test results and therefore used.
Data Availability Statement
Data sharing not applicable.
Conflicts of Interest
The authors declare no conflict of interest.
References
- Richter, J.E.; Rubenstein, J.H. Presentation and Epidemiology of Gastroesophageal Reflux Disease. Gastroenterology 2018, 154, 267–276. [Google Scholar] [CrossRef]
- Yamada, T. Textbook of Gastroenterology; Blackwell Publishing: Hoboken, NJ, USA, 2009. [Google Scholar]
- Segal, I.; Pitchumoni, C.S.; Sung, J. Gastroenterology and Hepatology Manual: A Clinicians Guide to a Global Phenomenon; McGraw Hill: New York, NY, USA, 2011. [Google Scholar]
- Tutuian, R.; Vela, M.F.; Hill, E.; Mainie, I.; Agrawal, A.; Castell, D. Characteristics of Symptomatic Reflux Episodes on Acid Suppressive Therapy. Am. J. Gastroenterol. 2008, 103, 1090–1096. [Google Scholar] [CrossRef] [PubMed]
- Tojza, P.M.; Jaworski, J.; Gradolewski, D.; Redlarski, G. Platform Supporting the Esophageal Impedance Analysis Mechatronics; Ideas for Industrial Applications Springer International Publishing: Berlin/Heidelberg, Germany, 2015. [Google Scholar]
- Tojza, P.M.; Gradolewski, D.; Redlarski, G. An Application Supporting Gastroesophageal Multichannel Intraluminal Impedance-pH Analysis. In Proceedings of the 2014 International Conference on Signal Processing and Multimedia Applications (SIGMAP), Vienna, Austria, 28–30 August 2014. [Google Scholar]
- Redlarski, G.; Tojza, P.M. Computer application supporting upper gastrointensinal tract disease diagnosis based on pH-metry analysis. Pomiary Autom. Kontrola 2013, 59, 193–195. [Google Scholar]
- Kessing, B.F.; Bredenoord, A.J.; Weijenborg, P.W.; Hemmink, G.J.; Loots, C.M.; Smout, A.J.P.M. Esophageal acid exposure decreases intraluminal baseline impedance levels. Am. J. Gastroenterol. 2011, 106, 2093–2097. [Google Scholar] [CrossRef]
- Mousa, H.M. Esophageal Impedance Monitoring for Gastroesophageal Reflux. J. Pediatr. Gastroenterol. Nutr. 2014, 52, 129–139. [Google Scholar] [CrossRef] [Green Version]
- Bredenoord, A.J.; Tutuian, R.; Smout, A.J.; Castell, D.O. Technology Review: Esophageal Impedance Monitoring. Am. J. Gastroenterol. 2007, 102, 187–194. [Google Scholar] [CrossRef]
- Porro, G. Gastroenterologia i Hepatologia; Czelej: Lublin, Poland, 2003. [Google Scholar]
- Krogulska, A.; Wasowska-Krolikowska, K. Refluks zoladkowo-przełykowy a refluks krtaniowo-gardłowy—Znaczenie w laryngologiis. Otolaryngologia 2009, 8, 45–52. [Google Scholar]
- Yamasaki, J.T.; Sakiani, S.; Maradey-Romero, C.; Mehta, R.; Sandhu, D.; Ganocy, S.; Gemond, C.; Eisa, M.; Fass, R. Barrett’s esophagus patients are becoming younger: Analysis of a large United States dataset. Esophagus 2020, 17, 190–196. [Google Scholar] [CrossRef] [PubMed]
- Macchini, F.; Morandi, A.; Cognizzoli, P.; Farris, G.; Gentilino, V.; Zanini, A.; Leva, E. Acid Gastroesophageal Reflux Disease and Apparent Life-Threatening Events: Simultaneous pH-metry and Cardiorespiratory Monitoring. Pediatr. Neonatol. 2017, 58, 43–47. [Google Scholar] [CrossRef] [PubMed] [Green Version]
- Sifrim, D.; Fornari, F. Esophageal impedance-pH monitoring. Dig. Liver Dis. 2008, 40, 161–166. [Google Scholar] [CrossRef]
- Patel, D.A.; Higginbotham, T.; Slaughter, J.C.; Aslam, M.; Yuksel, E.; Katzka, D.; Gyawali, C.P.; Mashi, M.; Pandolfino, J.; Vaezi, M.F. Development and Validation of a Mucosal Impedance Contour Analysis System to Distinguish Esophageal Disorders. Gastroenterology 2019, 156, 1617–1626. [Google Scholar] [CrossRef] [PubMed]
- Hosseini, A.S.A.; Uhlig, J.; Streit, U.; Gliem, N.; Wedi, E.; Ellenrieder, V.; Ghadimi, M.; Ahmed, S.; Uecker, M.; Frahm, J.; et al. Real-time MRI for dynamic assessment of gastroesophageal reflux disease: Comparison to pH-metry and impedance. Eur. J. Radiol. 2020, 125, 108856. [Google Scholar] [CrossRef] [PubMed]
- Gyawali, C.P.; Kahrilas, P.J.; Savarino, E.; Zerbib, F.; Mion, F.; Smout, A.J.; Vaezi, M.; Sifrim, D.; Fox, M.R.; Vela, M.F.; et al. Modern diagnosis of GERD: The Lyon Consensus. Gut 2018, 67, 1351–1362. [Google Scholar] [CrossRef] [PubMed] [Green Version]
- Basiri, B.; Vali, M.; Agah, S. Classification of normal and dysphagia in patients with GERD using swallowing sound analysis. In Proceedings of the 2017 Artificial Intelligence and Signal Processing Conference (AISP), Shiraz, Iran, 25–27 October 2017; pp. 268–274. [Google Scholar]
- Fuchs, H.F.; Müller, D.T.; Berlth, F.; Maus, M.K.; Fuchs, C.; Dübbers, M.; Schröder, W.; Bruns, C.J.; Leers J., M. Simultaneous laryngopharyngeal pH monitoring (Restech) and conventional esophageal pH monitoring-correlation using a large patient cohort of more than 100 patients with suspected gastroesophageal reflux disease. Dis. Esophagus Off. J. Int. Soc. Dis. Esophagus 2018, 31, doy018. [Google Scholar] [CrossRef] [PubMed]
- Mazzoleni, G.; Vailati, C.; Lisma, D.G.; Testoni, P.A.; Passaretti, S. Correlation between oropharyngeal pH-monitoring and esophageal pH-impedance monitoring in patients with suspected GERD-related extra-esophageal symptoms. Neurogastroenterol. Motil. 2014, 26, 1557–1564. [Google Scholar] [CrossRef] [PubMed]
- Kahrilas, P.J. Will impedance testing rewrite the book on GERD? Gastroenterology 2001, 120, 1862–1864. [Google Scholar] [CrossRef] [PubMed]
- Lazarescu, A.; Sifrim, D. Ambulatory Monitoring of GERD: Current Technology. Gastroenterol. Clin. N. Am. 2008, 37, 793–805. [Google Scholar] [CrossRef]
- Pritchett, J.M.; Aslam, M.; Slaughter, J.C.; Ness, R.M.; Garrett, C.G.; Vaezi, M.F. Efficacy of Esophageal Impedance/pH Monitoring in Patients With Refractory Gastroesophageal Reflux Disease, on and off Therapy. Clin. Gastroenterol. Hepatol. 2009, 7, 742–748. [Google Scholar] [CrossRef]
- Shay, S.S.; Bomeli, S.; Richter, J.E. Reflux event (RE) clearing: Multichannel intraluminal impedance (MII) compared to pH probe and manometry in fasting severe GERD patients. Gastroenterology 2001, 120, 431. [Google Scholar] [CrossRef]
- Sifrim, D.; Holloway, R.; Silny, J.; Xin, Z.; Tack, J.; Lerut, A.; Janssens, J. Acid, nonacid, and gas reflux in patients with gastroesophageal reflux disease during ambulatory 24-hour pHimpedance recordings. Gastroenterology 2001, 120, 1588–1598. [Google Scholar] [CrossRef] [PubMed] [Green Version]
- Smith, H.L.; Hollins, G.W.; Booth, I.W. Epigastric impedance recording for measuring gastric emptying in children: How useful is it? J. Pediatr. Gastroenterol. Nutr. 1993, 17, 201–206. [Google Scholar] [CrossRef]
- Tutuian, R.; Castell, D.O. Use of multichannel intraluminal impedance (MII) in evaluating patients with esophageal diseases. Part III: Combined MII and pH (MII-pH). Pract. Gastroenterol. 2003, 27, 19–28. [Google Scholar]
- Forootan, M.; Zojaji, H.; Ehsani, M.J.; Darvishi, M. Advances in the Diagnosis of GERD Using the Esophageal pH Monitoring, Gastro-Esophageal Impedance-pH Monitoring, And Pitfalls. Open Access Maced J. Med. Sci. 2018, 6, 1934–1940. [Google Scholar] [CrossRef] [PubMed]
- Ristic, N.; Milovanovic, I.; Radusinovic, M.; Stevic, M.; Ristic, M.; Ristic, M.; Kisic Tepavcevic, D.; Alempijevic, T. The comparative analyses of different diagnostic approaches in detection of gastroesophageal reflux disease in children. PLoS ONE 2017, 12, e0187081. [Google Scholar] [CrossRef] [PubMed] [Green Version]
- Lupu, V.V.; Ignat, A.; Paduraru, G.; Ciubara, A.; Moscalu, M.; Marginean, C.O.; Burlea, M. Correlation between the different pH-metry scores in gastroesophageal reflux disease in children. Medicine 2016, 95, e3804. [Google Scholar] [CrossRef] [PubMed]
- Daubechies, I. Orthonormal bases of compactly supported wavelets. Commun. Pure Appl. Math. 1988, 41, 909–996. [Google Scholar] [CrossRef] [Green Version]
- Addison, P.S. Wavelet transforms and the ECG: A review. Physiol. Meas. 2005, 26, 155–199. [Google Scholar] [CrossRef] [Green Version]
- Adeli, H.; Zhou, Z.; Dadmehr, N. Analysis of EEG records in an epileptic patient using wavelet transform. J. Neurosci. Methods 2003, 123, 69–87. [Google Scholar] [CrossRef] [PubMed]
- Gandhi, T.; Panigrahi, B.K.; Anand, S. A comparative study of wavelet families for EEG signal classification. Neurocomputing 2011, 74, 3051–3057. [Google Scholar] [CrossRef]
- Kumar, S.; Ahmadian, A.; Kumar, R.; Kumar, D.; Singh, J.; Baleanu, D.; Salim, M. An Efficient Numerical Method for Fractional SIR Epidemic Model of Infectious Disease by Using Berstain Wavelets. Mathematics 2020, 8, 558. [Google Scholar] [CrossRef] [Green Version]
- Kumar, S.; Kumar, R.; Agarwal, R.P.; Samet, B. A Study of Fractional Lotka-Volterra Population Model Using Haar Wavelet and Adams-Bashforth-Moulton Methods. Math. Methods Appl. Sci. 2020, 43, 5564–5578. [Google Scholar] [CrossRef]
- Kumar, S.; Kumar, R.; Cattani, C.; Samet, B. Chaotic Behaviour of Fractional Predator-Prey Dynamical System. Chaos Solitons Fractals 2020, 135, 109811. [Google Scholar] [CrossRef]
- Kumar, S.; Kumar, R.; Osman, M.S.; Samet, B. A Wavelet Based Numerical Scheme for Fractional Order SEIR Epidemic of Measles by Using Genocchi Polynominals. Numer. Methods Partial. Differ. Equ. 2021, 37, 1250–1268. [Google Scholar] [CrossRef]
- Abry, P.; Gonçalvès, P.; Flandrin, P. Wavelets, spectrum analysis and 1/f processes. In Wavelets and Statistics; Lecture Notes in Statistics; Antoniadis, A., Oppenheim, G., Eds.; Springer: New York, NY, USA, 1995; Volume 103, pp. 15–29. [Google Scholar]
- Kobayashi, M.; Musha, T. 1/f fluctuation of heartbeat period. IEEE Trans. Biomed. Eng. 1982, 29, 456–457. [Google Scholar] [CrossRef] [PubMed]
- Tsuji, Y.; Nagasawa, K.; Satoh, H. Cross-correlation between 1/f-like fluctuations in heartbeat and diurnal changes in the sleep-waking stage. Psychiatry Clin. Neurosci. 1998, 52, 174–176. [Google Scholar] [CrossRef]
- Tan, C.O.; Cohen, M.A.; Eckberg, D.L.; Taylor, J.A. Fractal properties of human heart period variability: Physiological and methodological implications. J. Physiol. 2009, 587, 3929–3941. [Google Scholar] [CrossRef] [PubMed]
- Redlarski, G.; Siebert, J.; Krawczuk, M.; Zak, A.; Danilowicz-Szymanowicz, L.; Dolinski, L.; Gutknecht, P.; Trzeciak, B.; Ratkowski, W.; Palkowski, A. Wavelet Transform Analysis of Heart Rate to Assess Recovery Time for Long Distance Runners. Electronics 2020, 9, 2189. [Google Scholar] [CrossRef]
- Engin, M. Spectral and wavelet based assessment of congestive heart failure patients. Comput. Biol. Med. 2007, 37, 820–828. [Google Scholar] [CrossRef] [PubMed]
Figure 1.
Selected statistical parameters of healthy patients and patients with GERD.
Figure 1.
Selected statistical parameters of healthy patients and patients with GERD.
Figure 2.
A flow chart for the methodology of analysis for esophageal pH monitoring signal: (a) calculation of the sums of wavelet coefficients (CWT), (b) based on spectral exponent parameters.
Figure 2.
A flow chart for the methodology of analysis for esophageal pH monitoring signal: (a) calculation of the sums of wavelet coefficients (CWT), (b) based on spectral exponent parameters.
Figure 3.
The pH-metry signal measured and the corresponding pH value distributions: (a,d) calculated DeMeester score = 0.8; (b,e) calculated DeMeester score = 15.9; (c,f) calculated DeMeester score = 107.8.
Figure 3.
The pH-metry signal measured and the corresponding pH value distributions: (a,d) calculated DeMeester score = 0.8; (b,e) calculated DeMeester score = 15.9; (c,f) calculated DeMeester score = 107.8.
Figure 4.
The final form of the signal subjected to continuous wavelet transform analysis.
Figure 4.
The final form of the signal subjected to continuous wavelet transform analysis.
Figure 5.
Scalograms of pH-metry signals obtained for Haar wavelet related to the 24-h measurement procedure. Scalograms show the result of the continuous wavelet transform, based on pH signals for the marginal cases of calculated DeMeester score.
Figure 5.
Scalograms of pH-metry signals obtained for Haar wavelet related to the 24-h measurement procedure. Scalograms show the result of the continuous wavelet transform, based on pH signals for the marginal cases of calculated DeMeester score.
Figure 6.
Curves representing sums of wavelet coefficients. Each curve was obtained as a result of summing up wavelet coefficients after the application of the continuous wavelet transform of pH signals for a selected patient during 24 h of measurement procedure. Different colours indicate marginal cases of calculated DeMeester score: blue line—base line (DeMeester 15.9); red—a patient diagnosed with reflux (DeMeester 107.8); green line—healthy patient (DeMeester 0.8).
Figure 7.
Curves representing sums of wavelet coefficients. Each curve was obtained as a result of summing up wavelet coefficients after the application of the continuous wavelet transform of pH signals for a selected patient during 24 h of measurement procedure. Different colours indicate marginal cases of calculated DeMeester score: blue line—base line (DeMeester 15.9); red—a patient diagnosed with reflux (DeMeester > 15.9); green lines—healthy patient (DeMeester < 15.9); black dashed line—misclassified patients.
Figure 8.
Rescaling function designed based on selected patient cases.
Figure 8.
Rescaling function designed based on selected patient cases.
Figure 9.
Curves representing rescaled sums of wavelet coefficients. Different colours indicate marginal cases of calculated DeMeester score: blue line—base line (DeMeester 15.9); red line—a patient diagnosed with reflux (DeMeester 107.8); green line—healthy patient (DeMeester 0.8).
Figure 9.
Curves representing rescaled sums of wavelet coefficients. Different colours indicate marginal cases of calculated DeMeester score: blue line—base line (DeMeester 15.9); red line—a patient diagnosed with reflux (DeMeester 107.8); green line—healthy patient (DeMeester 0.8).
Figure 10.
Curves representing rescaled sums of wavelet coefficients. Different colours indicate cases of calculated DeMeester score (DMS): (a) classification of healthy patient: blue line—baseline (DMS 15.9), green lines—healthy patient (DMS < 15.9), black dashed line—misclassified patients (DMS = 12.4); (b) classification of patients with reflux: blue line—baseline (DMS = 15.9), red lines—a patient diagnosed with GERD (DMS > 15.9), black dashed line—misclassified patients (DMS = 17.0).
Figure 11.
The calculation results of the spectral exponent γ and its statistical representation. (a) Distribution of the spectral exponent γ illustrated as a function of the decomposition level (the dashed line represents a trend line calculated by the method of least squares). (b) The minimum and maximum values of the spectral exponent gamma together with the first, second, and third quartiles associated with the two groups of patients.
Table 1.
Parameters used to calculate the total DeMeester count [
3,
6].
Table 1.
Parameters used to calculate the total DeMeester count [
3,
6].
| No. | Required Parameter |
|---|
| 1 | Number of reflux episodes |
| 2 | Number of long reflux episodes (longer than 5 min) |
| 3 | Time of longest reflux episode |
| 4 | Time during pH < pH 4 in horizontal position [%] |
| 5 | Time during pH < pH 4 in supine position [%] |
| 6 | Total time during which pH is <4 |
Table 2.
Statistical analysis of esophageal pH measurements for healthy and GERD patients.
Table 2.
Statistical analysis of esophageal pH measurements for healthy and GERD patients.
| Statistic | Healthy Patient pH | GERD Patient pH |
|---|
| max pH | 9.10050 | 9.04140 |
| mean value of max pH | 8.25210 | 8.15120 |
| min pH | −2.44650 | −2.49570 |
| mean value of min pH | −0.61099 | −1.01580 |
| mean pH value | 6.09280 | 4.57690 |
| median pH value | 6.24060 | 4.88860 |
| mean standard deviation of pH values | 0.99225 | 1.75810 |
Table 3.
Statistical analysis of total DeMeester count parameters for healthy and GERD patients.
Table 3.
Statistical analysis of total DeMeester count parameters for healthy and GERD patients.
| Statistic | Healthy Patient Total DeMeester Parameter | GERD Patient Total DeMeester Parameter |
|---|
| max number of episodes | 79 | 235 |
| min number of episodes | 4 | 35 |
| mean number of episodes | 36.75 | 104.88 |
| mean time of the longest reflux episode [s] | 620.230 | 5990.700 |
| mean number of long reflux episodes | 3.250 | 11.813 |
Table 4.
Parameters used to calculate the total DeMeester parameter.
Table 4.
Parameters used to calculate the total DeMeester parameter.
| Parameter | Value | Successes/Attempts |
|---|
| Total success rate | 89.5% | 17/19 |
| Sensitivity | 93.33% | 14/15 |
| Specificity | 75% | 3/4 |
| Disclaimer/Publisher’s Note: The statements, opinions and data contained in all publications are solely those of the individual author(s) and contributor(s) and not of MDPI and/or the editor(s). MDPI and/or the editor(s) disclaim responsibility for any injury to people or property resulting from any ideas, methods, instructions or products referred to in the content. |
© 2022 by the authors. Licensee MDPI, Basel, Switzerland. This article is an open access article distributed under the terms and conditions of the Creative Commons Attribution (CC BY) license (https://creativecommons.org/licenses/by/4.0/).

 ,
, 


