Article

Variability and Complexity of Knee Neuromuscular Control during an Isometric Task in Uninjured Physically Active Adults: A Secondary Analysis Exploring Right/Left and Dominant/Nondominant Asymmetry

School of Sport, Rehabilitation, and Exercise Sciences, University of Essex, Wivenhoe Park, Colchester CO4 3SQ, UK
*
Author to whom correspondence should be addressed.
Appl. Sci. 2022, 12(9), 4762; https://doi.org/10.3390/app12094762
Submission received: 31 March 2022 / Revised: 30 April 2022 / Accepted: 7 May 2022 / Published: 9 May 2022
(This article belongs to the Special Issue New Trends in Neuromechanics and Motor Rehabilitation)

Abstract

:
Work is needed to better understand the control of knee movement and knee health. Specifically, work is needed to further understand knee muscle force control variability and complexity and how it is organized on both sides of the body. The purpose of this study was to explore side-to-side comparisons of magnitude- and complexity-based measures of knee muscle force control to support future interpretations of complexity-based analyses and clinical reasoning in knee injury control. Participants (male/female n = 11/5) performed constant-force isometric efforts at 50% maximal effort. Force variability was quantified during the constant-force efforts using a coefficient of variation (CV%) and force complexity using approximate entropy (ApEn) and detrended fluctuation analysis (DFA) α. Outcomes were right/left and dominant/nondominant group-level and individual-level comparisons. A limb-symmetry index was calculated for each variable and clinically significant absolute asymmetry was defined (>15%). The only significant side-to-side difference was for right/left DFA α (p = 0.00; d = 1.12). Maximum absolute asymmetries were (right/left, dominant/nondominant): CV 18.2%, 18.0%; ApEn 34.5%, 32.3%; DFA α 4.9%, 5.0%. Different side-to-side comparisons yield different findings. Consideration for how side-to-side comparisons are performed (right/left, dominant/nondominant) is required. Because a significant difference existed for complexity but not variability, this indicates that both complexity-based and magnitude-based measures should be used when studying knee muscle force control.

1. Introduction

The knee accounts for 46.8% of musculoskeletal injuries [1] with ligament and meniscus injuries being frequent [2]. The consequences of knee injury include physical disability [3], substantial healthcare costs [4], and post-trauma osteoarthritis [5]. Therefore, the exploration of factors affecting the control of knee movement and health is necessary for informing knee injury control interventions that support individuals’ lifelong physical activity.
Injury control involves the prevention, acute care, and rehabilitation phases of healthcare [6]. When considering aspects of knee movement and health, clinicians make side-to-side comparisons of knee characteristics (e.g., right/left, dominant/nondominant) [7,8]. The reasoning for a right/left or dominant/nondominant side-to-side comparison should be considered carefully because one can yield different findings to the other [9] and because limb dominance changes according to the nature of the task (e.g., muscle strength vs. skill) [10]. Regardless of whether a right/left or dominant/nondominant side-to-side comparison is performed, the premise of a side-to-side comparison is that one side represents a reference standard for clinical judgments relative to the opposite side [7,11]. Therefore, before a valid clinical judgment can be made in injury control as a result of comparing one side to the opposite side, exploratory research is needed to first understand biological phenomena and provide reference data from uninjured individuals [12]. The side-to-side comparison of a variable is termed a “symmetry analysis” [13]; symmetry exists when a variable is equal in magnitude for both limbs and asymmetry exists when a variable is unequal in magnitude for both limbs [14]. In knee injury control, symmetry analyses are performed frequently using variables representing aspects of knee neuromuscular control.
In joint injury control, neuromuscular control refers to the activation of the dynamic restraints (skeletal muscles) in preparation for and response to joint loading and motion to maintain functional joint stability [15]. One aspect of neuromuscular control that has received little attention with regard to symmetry analysis is muscle force control. Physiological signals, such as muscle force, represent interactions between multiple physiological components and asynchronous feedback loops operating over a range of temporal and spatial scales and are characterized by constant fluctuations in system output [16]. The quantification of fluctuations in muscle force signals is, therefore, necessary to better analyze knee neuromuscular control characteristics. The behavior of physiological signals can be analyzed using measures of variability or complexity [17,18]. Metrics of variability are linear and magnitude-based (e.g., standard deviation [SD], coefficient of variation [CV]; Figure 1, y-axis) [19,20]. Metrics of complexity are nonlinear and time-based (e.g., approximate entropy, detrended fluctuation analysis; Figure 1, x-axis) [21,22]. Specifically, complexity metrics characterize moment-to-moment relationships between successive data points, thereby examining how a signal’s structure changes over time (Figure 1, x-axis) [17,20]. Magnitude-based measures cannot quantify temporal irregularities and, therefore, miss “hidden information” regarding signal fluctuations [17]. Subsequently, several authors have used complexity analyses (nonlinear time-series analyses) for studying different aspects of human movement in order to gain more information and understanding of the control of posture [23], balance [24], and walking gait [25].
Complex fluctuations in physiological processes represent the range across which biological systems function and their ability to respond to unpredictable environments [16]. Complex fluctuations in neuromuscular control reflect the ability to adapt motor output rapidly and accurately in response to task demands [26]. In knee neuromuscular control, some researchers have used magnitude-based metrics [27], others have used complexity-based metrics [20], but few have used both magnitude- and complexity-based metrics [28]. No published work reports examining knee neuromuscular control using both magnitude- and complexity-based measures within both right/left and dominant/nondominant side-to-side analyses in uninjured individuals. Therefore, there is a gap in the literature for exploratory analyses into knee muscle force control variability and complexity and how it is organized specifically on both sides of the body.
The supplementary (secondary) analysis of primary data fulfills a valuable role in scientific inquiry and is encouraged to facilitate research economy, answer interdisciplinary research questions, and mitigate research waste [29,30]. Secondary analysis can be undertaken at any stage of a research project and is further encouraged where primary data from relatively “small-scale experiments” is used to build a foundation for planning future larger-scale original studies and plot a direction for new basic and applied research questions [31]. Accordingly, this study was a secondary analysis of data collected for a prior project [32,33]. The first purpose was to test the hypothesis that there would be no statistically-significant side-to-side differences (right/left, dominant/nondominant) for magnitude- and complexity-based variables extracted from isometric knee extension sub-maximal force output during a constant-force task. The second purpose was to test the hypothesis that the mean side-to-side (right/left, dominant/nondominant) absolute-asymmetry for the magnitude- and complexity-based variables using the limb symmetry index (LSI) would be ≤15%; this hypothesis was based on previous research on knee extension neuromuscular control with uninjured individuals [34]. The present exploratory analyses are practically significant because they provide new preliminary reference data that helps to better understand the control of knee movement for both sides of the body in uninjured individuals; these findings will, in turn, inform and support the design and direction of future larger-scale primary studies of motor control and knee health in uninjured and injured individuals.

2. Materials and Methods

2.1. Study Design, Ethical Approval, Informed Consent, Participants

This study was a secondary analysis of data collected for a larger research project [32,33]. Ethics approval was obtained for the original work. Informed consent was provided by all participants. For the original project, inclusion criteria were physically-active males/females aged 18–40 years, and exclusion criteria were current lower limb pain and any lower limb injury in the previous three months. Sixteen participants were available from the original datasets (11 male, 5 female; mean ± SD: age 24.0 ± 5.3 years; height 1.74 ± 0.08 m; body mass 68.3 ± 11.1 kg).

2.2. Original Experimental Procedures

Participants attended the laboratory on three occasions with ≥48 h between sessions. Participants were instructed to avoid any fatiguing exercise/sports for 24 h beforehand. During the first session, participants were familiarized with the instrumentation and procedures, their dynamometer settings were recorded, and limb dominance was established (preferred leg to kick a football). For the next two sessions, isometric knee extension efforts were performed and data were collected for all variables. Limb order was randomized, with one limb assessed in session 2 and the opposite limb assessed in session 3.

2.3. Dynamometry

Isometric knee extension efforts were sampled with a CSMi isokinetic dynamometer (HUMAC Norm, Stoughton, MA, USA), initialized and calibrated according to the manufacturers’ instructions. Participants sat with their hips and knees flexed 85° and 90°, respectively, and the lateral epicondyle of the knee aligned with the axis of rotation of the dynamometer lever-arm. The trunk and pelvis were secured using the device’s straps. The lever arm’s attachment was adjusted so the lower edge of the shin pad was just above the malleoli. The sampling frequency was 1000 Hz.

2.4. Isometric Knee Extension Efforts

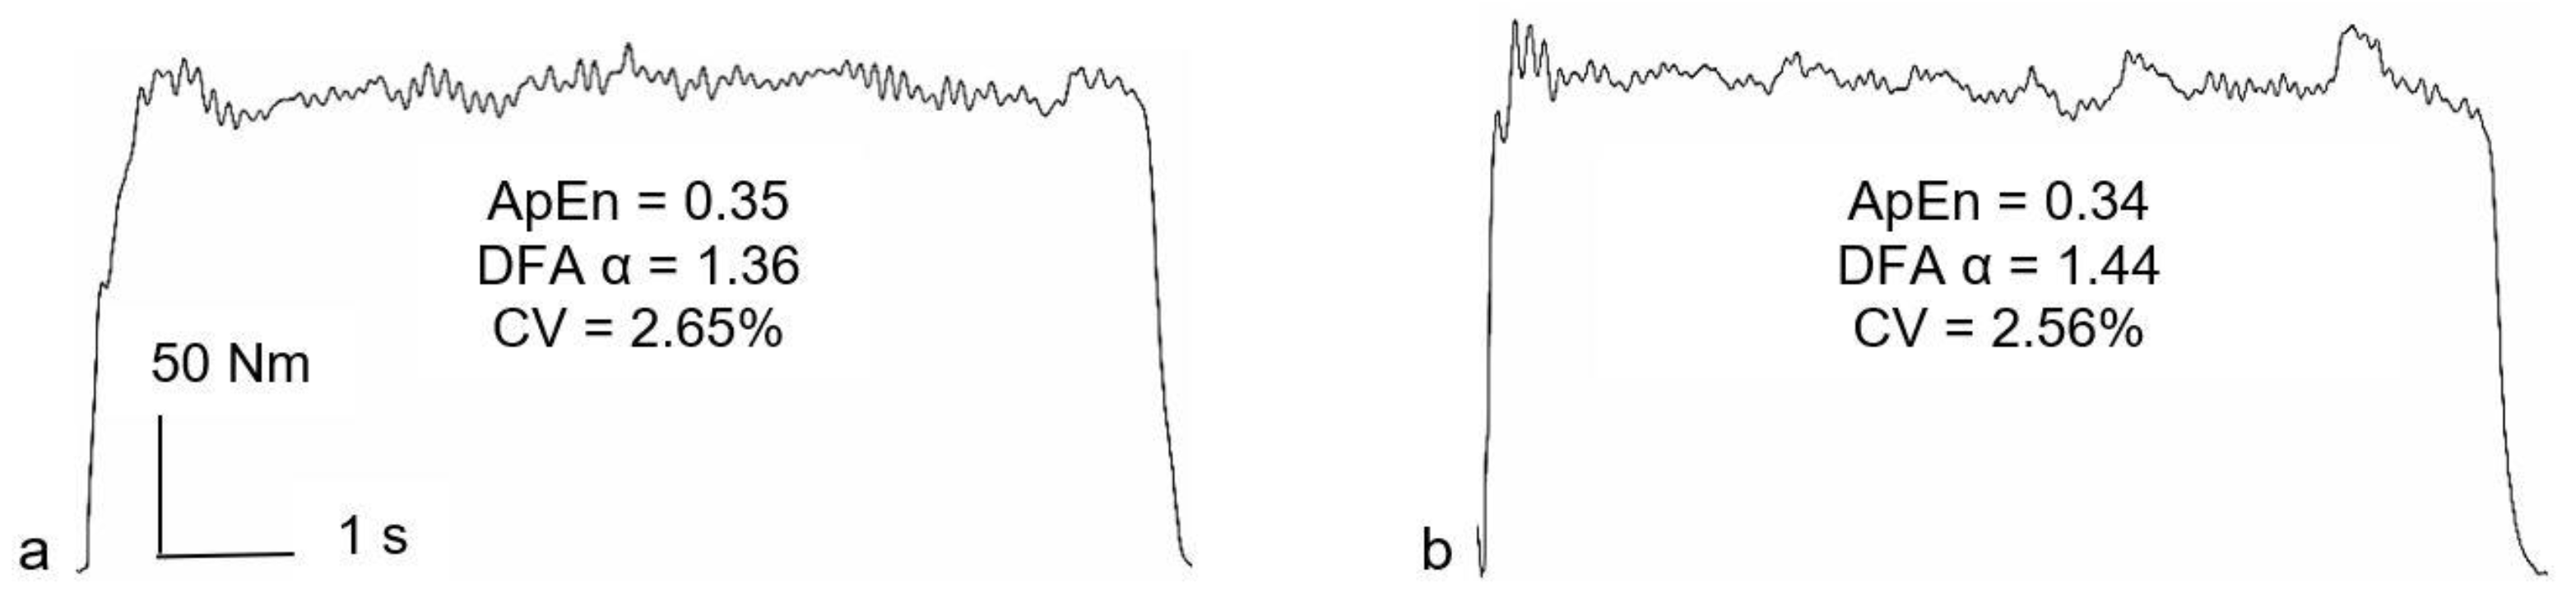
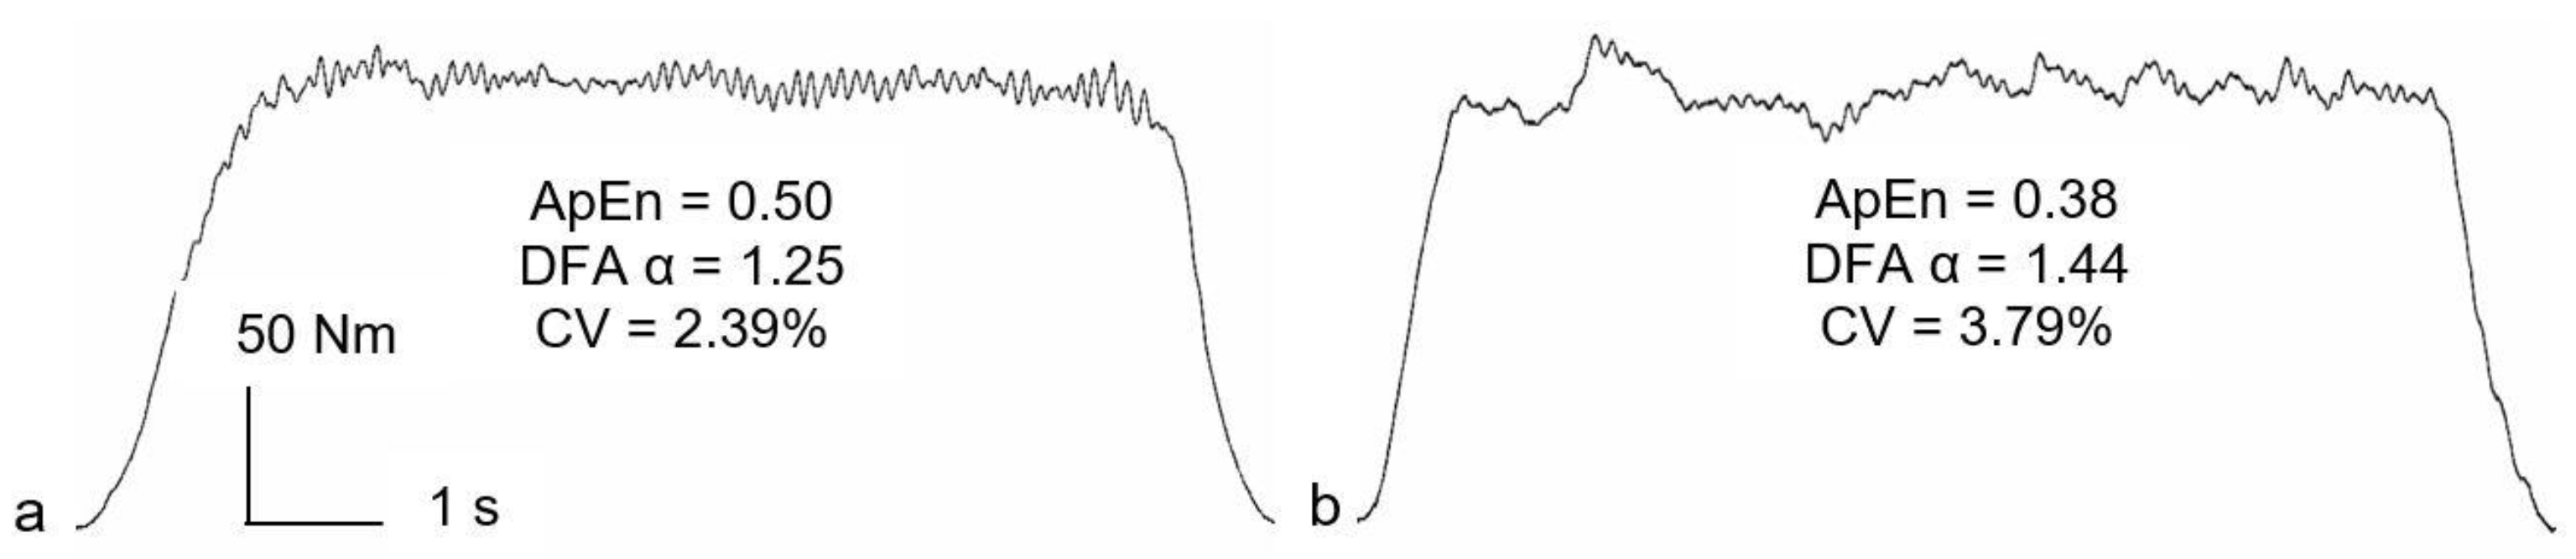
Participants performed a series of 3-s maximal voluntary efforts (MVE) separated by 60 s of rest and which continued until the peak moment in three consecutive efforts were within 5% of each other. Participants then performed a 50% MVE constant-force task, with this target based on the peak knee extension moment identified during the MVEs. A chart containing the instantaneous knee extension moment was projected onto a screen placed ~1 m in front of the participant. A scale consisting of a 1 mm thick line was superimposed on the chart and acted as a target so that participants were able to match their instantaneous moment to the target during each trial. Participants were instructed to match their instantaneous moment with the target superimposed on the display for as much of each trial as possible. Five trials were performed, each lasting six seconds and separated by four seconds of rest.

2.5. Data Acquisition and Reduction

Devices were connected by BNC cables (Digitimer, Welwyn Garden City, UK) to a Biopac MP150 and a CED Micro 1401-3 (Cambridge Electronic Design, Cambridge, UK) interfaced with a personal computer. Data were collected in Spike2 software (Version 7, Cambridge Electronic Design, Cambridge, UK). Raw data were processed using customized code in MATLAB R2017a (Mathworks, Natick, MA, USA).
For all variability and complexity analyses, the steadiest five seconds of each 50% MVE trial was identified as the five-second epoch with the lowest SD [20]. Variability and complexity were, therefore, analyzed using 5000 data points. The CV was used as a magnitude-based variable, representing force variability normalized to the mean force [20]. Multiple complexity metrics are recommended for probing subtly different aspects of physiological signals [21]. Approximate entropy (ApEn) [22] was used to determine the regularity/randomness of the force signal and temporal fractal scaling was estimated using detrended fluctuation analysis (DFA) α [35]. Sample entropy [36] was also considered; however, as shown by Pethick et al. [20], this measure does not differ from muscle force ApEn when 5000 data points are used in their calculation. The full details of the calculation of ApEn and DFA α can be found in Pethick et al. [20].
In short, ApEn quantifies the negative natural logarithm of the conditional probability that a template of length m is repeated during a time series. If the data are highly regular, then templates similar for m points (within the tolerance r) are likely to be similar for m + 1 points. In this situation, the conditional probability will be close to 1, and the negative logarithm, and therefore the entropy, will be close to zero. This reflects low complexity and high predictability. ApEn was calculated with the template length, m, set at two and the tolerance, r, set at 10% of the SD of knee extension moment output [20,37]; 10% was chosen over other percentages following the recommendations of Forrest et al. [37], who sought to identify a “gold standard” for signal acquisition and processing parameters in the context of the ApEn analyses of isometric muscle force control records. In the DFA algorithm, the time-series of interest is integrated, then divided into boxes of equal length, n, and a least-squares line (representing the trend in each box) is fitted. The integrated time series is detrended by subtracting the local trend in each box, and the root mean square of this integrated, detrended series, F(n), is calculated. This calculation is then repeated over all timescales or box sizes. The slope of the line relating log F(n) to log n determines the DFA α scaling exponent [21]. Subsequently, DFA was calculated using 57 boxes, ranging from 1250 to 4 data points. The log-log plot of fluctuation size versus box size was plotted for each participant to identify any significant crossover (as shown by an r < 0.95) and the presence of two trends [38]. No cases of significant crossover were observed. Typically, DFA α ranges from ~0.5 to ~1.5 and acts as an indicator of the “roughness” of the time series; the larger the value of α, the more regular the time series [21].

2.6. Statistical Analyses

The mean CV, ApEn, and DFA α from the five 50% MVE constant-force trials were used for analyses. Summary statistics were calculated, including the absolute side-to-side differences (right–left, dominant–nondominant). The minus sign was removed from negative differences.
For statistical analyses (group-level), the normality of data was assessed with histogram inspection and Shapiro–Wilk tests. Alpha was set a priori at 0.05. Bonferroni-corrected paired t-tests were used for right/left and dominant/nondominant side-to-side comparisons across all variables. Ninety-five percent confidence intervals (CI) were estimated for all variables and within-group Cohen’s d was calculated for all side-to-side comparisons; effect sizes of 0.20, 0.50, and 0.80 were considered small, medium, and large, respectively [12].
For clinical analyses (individual-level), two LSIs were calculated: right/left LSI (R/L-LSI) [13] and dominant/nondominant LSI (D/ND-LSI). The R/L-LSI (%) was calculated: (right ÷ left) × 100 [13]. A R/L-LSI of 100% represented side-to-side symmetry, <100% lower right-side/higher left-side values, >100% lower left-side/higher right-side values. The D/ND-LSI (%) was calculated: (dominant ÷ nondominant) × 100. A D/ND-LSI of 100% represented side-to-side symmetry, <100% lower dominant-side/higher nondominant-side values, >100% lower nondominant-side/higher dominant-side values. Therefore, for the R/L-LSI and D/ND-LSI, each indicated both the magnitude and direction of asymmetry [13]. Because the size of an absolute asymmetry is frequently the principal matter of clinical interest [13], the absolute asymmetry for both the R/L-LSI and D/ND-LSI was calculated: 100%—participant’s LSI [13]. Minus signs were removed from negative differences [13].

3. Results

Summary statistics are presented for the CV in Table 1, ApEn in Table 2, and DFA α in Table 3. All data were normally distributed.
Example findings from the 50% MVE constant-force task for two different participants are illustrated in Figure 2 and Figure 3. The only significant side-to-side differences were for the right/left DFA α (p = 0.00; Table 3). For effect sizes, a little under large effect was evident for right/left ApEn (Table 2). A very large effect was evident for right/left DFA α (Table 3).
Summary statistics for R/L-LSIs, D/ND-LSIs, and absolute asymmetries are presented in Table 4, Table 5 and Table 6. The mean absolute-asymmetry values for both side-to-side comparison methods were >15% for CV and ApEn (Table 4 and Table 5). The inspection of the maximum absolute-asymmetry values for both side-to-side comparison methods demonstrates some participants had very large absolute-asymmetries for the CV and ApEn (Table 4 and Table 5).

4. Discussion

The first purpose of this study was to test the hypothesis that there would be no statistically-significant side-to-side differences (right/left, dominant/nondominant) for magnitude- and complexity-based variables during an isometric knee extension 50% MVE constant-force task. The only significant difference in either comparison was for right/left DFA α (Table 3). The second purpose of this study was to test the hypothesis that the mean side-to-side (right/left, dominant/nondominant) absolute-asymmetry for the magnitude- and complexity-based variables, assessed using the LSI, would be ≤15% for both side-to-side comparisons. The mean absolute-asymmetry was >15% for both comparisons for CV and ApEn (Table 4 and Table 5), but not for either comparison for DFA α (Table 6).
In knee health and injury control, side-to-side comparisons inform clinical reasoning and support clinical decision-making [7,13]. At the group level, symmetry analyses examine whether statistically significant side-to-side differences exist for measures of central tendency [13]. The only significant side-to-side group-level differences were for right/left DFA α (Table 3). Interestingly, the significant finding was for a right/left comparison and not for any dominant/nondominant comparison; this is consistent with the findings of Hollman et al. [28], who report no significant dominant/nondominant differences for a fractal exponent during knee extension or flexion constant-force tasks. Similar to this study, Hollman et al. [28] employed a mixed male/female sample. Different from this study, Hollman et al. [28] employed a mixed adult/adolescent sample and did not specify explicitly how the dominant limb was defined. Accordingly, because growth and development affect knee neuromuscular control [39] and limb dominance changes according to the nature of the task (e.g., load-bearing vs. skill) [10], the findings of Hollman et al. [28] are likely not comparable to the present study. Given that the present study identified a significant finding for a right/left comparison but not for a dominant/nondominant comparison, careful consideration should underpin the clinical reasoning for which a comparison method is employed because different statistical findings are evident for one method versus another; this is supported by the finding that side-to-side effect-sizes were substantially different between comparison methods for both ApEn and DFA α (Table 2 and Table 3).
Previous research has analyzed side-to-side differences in variability, with equivocal results. Adam, Luca, and Erim [40] observed a significantly greater magnitude of variability in the nondominant first dorsal interosseous, whilst Bernardi et al. [41] observed no difference between dominant and nondominant limbs. The present study indicates potential side-to-side differences in the complexity of muscle output, with the left limb exhibiting lower complexity, as indicated by greater DFA α (Table 3). Moreover, there were no significant differences for either side-to-side comparison method for CV (Table 1). This supports the notion that complexity-based metrics may be more sensitive to subtle side-to-side differences than variability-based metrics [42]. It is, however, still recommended to use both magnitude- and complexity-based metrics for a thorough evaluation of signal fluctuations [17].
That there was a significant difference for the right/left DFA α comparison but not the right/left ApEn comparison supports the notion that these metrics assess subtly different aspects of complexity [21]. Because ApEn measures the regularity/randomness of a time series across one time scale [22], and DFA α measures fractal scaling across multiple time scales [21], agreement between the two metrics is not guaranteed. The insensitivity of one metric does not imply that other metrics will not yield meaningful information about a physiological system’s functionality [43]. That side-to-side effect-size findings for right/left ApEn and DFA α are not similar (Table 2 and Table 3) supports the notion that each variable provides unique information about knee extensor neuromuscular control complexity. Researchers should, therefore, use both ApEn and DFA α to assess knee neuromuscular control complexity, regardless of whether right/left or dominant/nondominant side-to-side comparisons are made.
Complex fluctuations in physiological signals represent the range across which biological systems operate and their ability to respond and adapt to stressors [16]. For both comparison methods, there was no significant side-to-side difference for ApEn (Table 2), suggesting that adaptability in knee extensor neuromuscular control is similar between sides. However, the medium-to-large effect size for the right/left ApEn comparison (Table 2) may indicate that side-to-side adaptability does actually differ. The significant side-to-side difference and very large effect size for the right/left DFA α (Table 3) supports the perspective that side-to-side adaptability in knee extensor neuromuscular control is different in uninjured individuals. Potential differences in the complexity of knee extensor neuromuscular control are reflective of differences in coordination and could have implications for the risk of injury [18]. Indeed, low complexity has been speculated to reflect a narrowing of system responsiveness and lower adaptability, which could increase the risk of failing a motor task and have a detrimental effect on functional movements [33].
Based on the coherence between the cumulative motor unit spike train (measured using high-density EMG) and muscle force output [44], variations in common synaptic input to the motor unit are the main determinant of the magnitude of force fluctuations [45]. Increased common synaptic input has also been speculated to be associated with lower complexity [33]. In support of the potential side-to-side differences in complexity, differences in motor unit synchronization (a necessary consequence of common synaptic input) have been observed between the muscles of the dominant/nondominant hand [40,46]. Such differences in motor unit discharge properties have, however, only been observed in the muscles of the hand, which may be subject to greater preferential use than the knee extensors during daily activities [47].
At the individual level, symmetry analyses examine whether clinically-significant side-to-side differences exist for an individual’s mean or maximum values [13]. An absolute-asymmetry threshold of 15% was chosen because mean LSIs of approximately 85% are reported for isometric knee extension MVEs in uninjured individuals [34]. The mean absolute asymmetries for right/left and dominant/nondominant comparisons of CV and ApEn were >15% (Table 4 and Table 5), whereas the mean absolute asymmetries for both comparisons for DFA α were ≤5% (Table 6). The magnitude of the mean absolute asymmetry was consistent regardless of whether a right/left or dominant/nondominant comparison was performed. Because the mean absolute asymmetry ranged from 4.9 to 34.5% across all variables and side-to-side comparison methods (Table 4, Table 5 and Table 6), further work is needed to determine whether the isometric knee extension strength mean LSIs of approximately 85% [34] and corresponding absolute asymmetries of 15% apply to variability and complexity measures.
The present study had some limitations. First, this study was a secondary analysis of a previously published work and was confined to a total sample size created from two separate primary studies [32,33]. Therefore, it was not possible to perform an a priori power analysis and our findings may include type 2 errors. Future primary research should ensure a priori power analyses are performed to facilitate adequate statistical power. Second, we did not undertake a post hoc power analysis. A post hoc power analysis uses the p-value returned from significance tests; given that nonsignificant p-values always correspond to low beta values and power, post hoc power analyses fail to add value to interpretations of research findings and are discouraged [48]. Again, future primary research should ensure that a priori power analyses are performed to reduce the risk of committing type 2 errors. Third, we were confined by the methods used in the original work, which only used one sub-maximal level of effort (50% MVE). Variability and complexity can vary with the level of isometric efforts [17]. Future primary studies should assess a variety of sub-maximal levels to reveal potential differences in knee neuromuscular control complexity. Fourth, limb dominance was defined by the preferred kicking limb rather than the strongest limb. Although it is possible that participants may have mistakenly and incorrectly self-reported one side as their dominant side, the subjectively reported preferred kicking limb is the method commonly employed in the literature for determining lower limb dominance [10]. Future research should compare different methods of defining and objectively determining limb dominance and how it affects the variability and complexity of side-to-side absolute asymmetries.

5. Conclusions

This is the first study to explore right/left and dominant/nondominant side-to-side comparisons of magnitude- and complexity-based metrics of knee neuromuscular control in uninjured individuals. A significant side-to-side difference and very large effect size existed for the right/left DFA α comparison, suggesting that side-to-side adaptability of knee extensor neuromuscular control in uninjured individuals is different. Side-to-side differences in the adaptability of knee extensor neuromuscular control may have clinical implications for the risk of future knee injury. Participants demonstrated a wide range of side-to-side absolute-asymmetries in knee neuromuscular control variability and complexity according to the comparison method used and the variable employed. Researchers should carefully consider which method is used for side-to-side comparisons and the threshold or range employed to define a clinically significant absolute asymmetry for each variable. Approximate entropy and DFA α assess subtly different aspects of complexity and both should be used alongside other traditional magnitude-based variables when studying knee neuromuscular control. The present analyses are practically significant because they provide new preliminary reference data that help to better understand the control of knee movement for both sides of the body and support the design of future larger-scale primary studies of motor control and knee health in uninjured and injured individuals.

Author Contributions

Conceptualization, N.C.C. and J.P.; methodology, N.C.C. and J.P.; formal analysis, N.C.C.; resources, J.P.; writing—original draft preparation, N.C.C. and J.P.; writing—review and editing, N.C.C. and J.P.; visualization, N.C.C. and J.P.; supervision, N.C.C.; project administration, N.C.C. All authors have read and agreed to the published version of the manuscript.

Funding

This research received no external funding.

Institutional Review Board Statement

This study was a secondary analysis of data collected for a larger primary research project. Ethics approval was obtained for the original primary research project.

Informed Consent Statement

This study was a secondary analysis of data collected for a larger primary research project. Informed consent was provided by all participants for the original primary research project.

Data Availability Statement

Because this study was a secondary analysis, no new data were created or analyzed in this study. Data sharing is not applicable to this article.

Conflicts of Interest

The authors declare no conflict of interest.

References

  1. Kennedy, M.; Dunne, C.; Mulcahy, B.; Molloy, M. The sports clinic: A one year review of new referrals. Ir. Med. J. 1993, 86, 29–30. [Google Scholar] [PubMed]
  2. Sarimo, J.; Rantanen, J.; Heikkilä, J.; Helttula, I.; Hiltunen, A.; Orava, S. Acute traumatic hemarthrosis of the knee. Is routine arthroscopic examination necessary? A study of 320 consecutive patients. Scand. J. Surg. 2002, 91, 361–364. [Google Scholar] [CrossRef] [PubMed]
  3. Finch, C.; Cassell, E. The public health impact of injury during sport and active recreation. J. Sci. Med. Sport 2006, 9, 490–497. [Google Scholar] [CrossRef] [PubMed]
  4. Lubowitz, J.H.; Appleby, D. Cost-Effectiveness Analysis of the Most Common Orthopaedic Surgery Procedures: Knee Arthroscopy and Knee Anterior Cruciate Ligament Reconstruction. Arthroscopy 2011, 27, 1317–1322. [Google Scholar] [CrossRef] [PubMed]
  5. Lohmander, L.; Englund, P.; Dahl, L.; Roos, E. The Long-term Consequence of Anterior Cruciate Ligament and Meniscus Injuries: Osteoarthritis. Am. J. Sports Med. 2007, 35, 1756–1769. [Google Scholar] [CrossRef] [Green Version]
  6. Avery, J. Accident prevention-injury control-injury prevention-or whatever? Inj. Prev. 1995, 1, 10–11. [Google Scholar] [CrossRef] [PubMed] [Green Version]
  7. Clark, N.C. Functional performance testing following knee ligament injury. Phys. Ther. Sport 2001, 2, 91–105. [Google Scholar] [CrossRef] [Green Version]
  8. Clark, N.C. Noncontact knee ligament injury prevention screening in netball: A clinical commentary with clinical practice suggestions for community-level players. Int. J. Sports Phys. Ther. 2021, 16, 911–929. [Google Scholar] [CrossRef]
  9. Newton, R.; Gerber, A.; Nimphius, S.; Shim, J.; Doan, B.; Robertson, M.; Pearson, D.; Craig, B.; Häkkinen, K.; Kraemer, W. Determination of functional strength imbalance of the lower extremities. J. Strength Cond. Res. 2006, 20, 971–977. [Google Scholar]
  10. McGrath, T.; Waddington, G.; Scarvell, J.; Ball, N.; Creer, R.; Woods, K.; Smith, D. The effect of limb dominance on lower limb functional performance—A systematic review. J. Sports Sci. 2016, 34, 289–302. [Google Scholar] [CrossRef]
  11. Magee, D. Orthopedic Physical Assessment, 6th ed.; Elsevier: St. Louis, MO, USA, 2014. [Google Scholar]
  12. Portney, L.; Watkins, M. Foundations of Clinical Research: Applications to Practice, 3rd ed.; Pearson/Prentice Hall: Upper Saddle River, NJ, USA, 2009. [Google Scholar]
  13. Clark, N.C.; Mullally, E.M. Prevalence and magnitude of preseason clinically-significant single-leg balance and hop test asymmetries in an English adult netball club. Phys. Ther. Sport 2019, 40, 44–52. [Google Scholar] [CrossRef] [PubMed]
  14. Clark, N.C.; Clacher, L.H. Lower-limb motor-performance asymmetries in English community-level female field hockey players: Implications for knee and ankle injury prevention. Phys. Ther. Sport 2020, 43, 43–51. [Google Scholar] [CrossRef] [PubMed]
  15. Riemann, B.; Lephart, S. The sensorimotor system, part I: The physiologic basis of functional joint stability. J. Athl. Train. 2002, 37, 71–79. [Google Scholar] [PubMed]
  16. Lipsitz, L.; Goldberger, A. Loss of ‘complexity’ and aging. Potential applications of fractals and chaos theory to senescence. J. Am. Med. Assoc. 1992, 267, 1806–1809. [Google Scholar] [CrossRef]
  17. Slifkin, A.B.; Newell, K.M. Noise, information transmission, and force variability. J. Exp. Psychol. 1999, 25, 837–851. [Google Scholar] [CrossRef]
  18. Stergiou, N.; Decker, L.M. Human movement variability, nonlinear dynamics, and pathology: Is there a connection? Hum. Mov. Sci. 2011, 30, 869–888. [Google Scholar] [CrossRef] [Green Version]
  19. Enoka, R.M.; Christou, E.A.; Hunter, S.K.; Kornatz, K.W.; Semmler, J.G.; Taylor, A.M.; Tracy, B.L. Mechanisms that contribute to differences in motor performance between young and old adults. J. Electromyogr. Kinesiol. 2003, 13, 1–12. [Google Scholar] [CrossRef]
  20. Pethick, J.; Winter, S.L.; Burnley, M. Fatigue reduces the complexity of knee extensor torque fluctuations during maximal and submaximal intermittent isometric contractions in man. J. Physiol. 2015, 593, 2085–2096. [Google Scholar] [CrossRef]
  21. Goldberger, A.L.; Amaral, L.A.; Hausdorff, J.M.; Ivanov, P.C.; Peng, C.-K.; Stanley, H.E. Fractal dynamics in physiology: Alterations with disease and aging. Proc. Natl. Acad. Sci. USA 2002, 99, 2466–2472. [Google Scholar] [CrossRef] [Green Version]
  22. Pincus, S.M. Approximate entropy as a measure of system complexity. Proc. Natl. Acad. Sci. USA 1991, 88, 2297–2301. [Google Scholar] [CrossRef] [Green Version]
  23. Paraschiv-Ionescu, A.; Buchser, E.; Rutschmann, B.; Aminian, K. Nonlinear analysis of human physical activity patterns in health and disease. Phys. Rev. E 2008, 77, 021913. [Google Scholar] [CrossRef] [PubMed]
  24. Tigrini, A.; Verdini, F.; Fioretti, S.; Mengarelli, A. Long term correlation and inhomogeneity of the inverted pendulum sway time-series under the intermittent control paradigm. Commun. Nonlinear Sci. Numer. Simul. 2022, 108, 106198. [Google Scholar] [CrossRef]
  25. Marmelat, V.; Meidinger, R.L. Fractal analysis of gait in people with Parkinson’s disease: Three minutes is not enough. Gait Posture 2019, 70, 229–234. [Google Scholar] [CrossRef] [PubMed]
  26. Vaillancourt, D.; Newell, K. Aging and the time and frequency structure of force output variability. J. Appl. Physiol. 2003, 94, 903–912. [Google Scholar] [CrossRef] [Green Version]
  27. Goetschius, J.; Hart, J.M. Knee-extension torque variability and subjective knee function in patients with a history of anterior cruciate ligament reconstruction. J. Athl. Train. 2016, 51, 22–27. [Google Scholar] [CrossRef] [Green Version]
  28. Hollman, J.H.; Nagai, T.; Bates, N.A.; McPherson, A.L.; Schilaty, N.D. Diminished neuromuscular system adaptability following anterior cruciate ligament injury: Examination of knee muscle force variability and complexity. Clin. Biomech. 2021, 90, 105513. [Google Scholar] [CrossRef]
  29. Gibson, F.; Fern, L.A.; Phillips, B.; Gravestock, H.; Malik, S.; Callaghan, A.; Dyker, K.; Groszmann, M.; Hamrang, L.; Hough, R. Reporting the whole story: Analysis of the ‘out-of-scope’questions from the James Lind Alliance Teenage and Young Adult Cancer Priority Setting Partnership Survey. Health Expect. 2021, 24, 1593–1606. [Google Scholar] [CrossRef]
  30. Boslaugh, S. Secondary Data Sources for Public Health. A Practical Guide; Cambridge University Press: Cambridge, UK, 2007. [Google Scholar]
  31. Lewis-Beck, M.; Bryaman, A.; Liao, T. Secondary Analysis of Quantitative Data—The SAGE Encyclopedia of Social Science Research Methods; Sage Publications: Thousand Oaks, CA, USA, 2004. [Google Scholar]
  32. Pethick, J.; Winter, S.L.; Burnley, M. Effects of ipsilateral and contralateral fatigue and muscle blood flow occlusion on the complexity of knee-extensor torque output in humans. Exp. Physiol. 2018, 103, 956–967. [Google Scholar] [CrossRef] [Green Version]
  33. Pethick, J.; Whiteaway, K.; Winter, S.L.; Burnley, M. Prolonged depression of knee-extensor torque complexity following eccentric exercise. Exp. Physiol. 2019, 104, 100–111. [Google Scholar] [CrossRef]
  34. Lisee, C.; Slater, L.; Hertel, J.; Hart, J.M. Effect of sex and level of activity on lower-extremity strength, functional performance, and limb symmetry. J. Sport Rehabil. 2019, 28, 413–420. [Google Scholar] [CrossRef]
  35. Peng, C.-K.; Buldyrev, S.V.; Havlin, S.; Simons, M.; Stanley, H.E.; Goldberger, A.L. Mosaic organization of DNA nucleotides. Phys. Rev. E 1994, 49, 1685–1689. [Google Scholar] [CrossRef] [PubMed] [Green Version]
  36. Richman, J.S.; Moorman, J.R. Physiological time-series analysis using approximate entropy and sample entropy. Am. J. Physiol.-Heart Circ. Physiol. 2000, 278, H2039–H2049. [Google Scholar] [CrossRef] [PubMed] [Green Version]
  37. Forrest, S.M.; Challis, J.H.; Winter, S.L. The effect of signal acquisition and processing choices on ApEn values: Towards a “gold standard” for distinguishing effort levels from isometric force records. Med. Eng. Phys. 2014, 36, 676–683. [Google Scholar] [CrossRef] [PubMed]
  38. Pethick, J.; Winter, S.L.; Burnley, M. Relationship between muscle metabolic rate and muscle torque complexity during fatiguing intermittent isometric contractions in humans. Physiol. Rep. 2019, 7, e14240. [Google Scholar] [CrossRef]
  39. DiStefano, L.; Martinez, J.; Crowley, E.; Matteau, E.; Kerner, M.; Boling, M.; Nguyen, A.; Trojian, T. Maturation and sex differences in neuromuscular characteristics of youth athletes. J. Strength Cond. Res. 2015, 29, 2465–2473. [Google Scholar] [CrossRef]
  40. Adam, A.; Luca, C.J.D.; Erim, Z. Hand dominance and motor unit firing behavior. J. Neurophysiol. 1998, 80, 1373–1382. [Google Scholar] [CrossRef] [Green Version]
  41. Bernardi, M.; Felici, F.; Marchetti, M.; Montellanico, F.; Piacentini, M.; Solomonow, M. Force generation performance and motor unit recruitment strategy in muscles of contralateral limbs. J. Electromyogr. Kinesiol. 1999, 9, 121–130. [Google Scholar] [CrossRef]
  42. Vaillancourt, D.; Slifkin, A.; Newell, K. Regularity of force tremor in Parkinson’s disease. Clin. Neurophysiol. 2001, 112, 1594–1603. [Google Scholar] [CrossRef]
  43. Pethick, J.; Winter, S.L.; Burnley, M. Fatigue reduces the complexity of knee extensor torque during fatiguing sustained isometric contractions. Eur. J. Sport Sci. 2019, 19, 1349–1358. [Google Scholar] [CrossRef]
  44. Negro, F.; Holobar, A.; Farina, D. Fluctuations in isometric muscle force can be described by one linear projection of low-frequency components of motor unit discharge rates. J. Physiol. 2009, 587, 5925–5938. [Google Scholar] [CrossRef]
  45. Farina, D.; Negro, F. Common synaptic input to motor neurons, motor unit synchronization, and force control. Exerc. Sport Sci. Rev. 2015, 43, 23–33. [Google Scholar] [CrossRef] [PubMed]
  46. Schmied, A.; Vedel, J.-P.; Pagni, S. Human spinal lateralization assessed from motoneurone synchronization: Dependence on handedness and motor unit type. J. Physiol. 1994, 480, 369–387. [Google Scholar] [CrossRef] [PubMed] [Green Version]
  47. Williams, D.; Sharma, S.; Bilodeau, M. Neuromuscular fatigue of elbow flexor muscles of dominant and non-dominant arms in healthy humans. J. Electromyogr. Kinesiol. 2002, 12, 287–294. [Google Scholar] [CrossRef]
  48. Hoenig, J.M.; Heisey, D.M. The abuse of power: The pervasive fallacy of power calculations for data analysis. Am. Stat. 2001, 55, 19–24. [Google Scholar] [CrossRef]
Figure 1. Illustration of how variability-based (magnitude-domain, y-axis) and complexity-based (time-domain, x-axis) variables relate to the graphical plot of an isometric knee extension signal. Nm = Newton-meters; s = seconds; SD = standard deviation; CV = coefficient of variation; ApEn = approximate entropy; DFA α = detrended fluctuation analysis α. See Methods for explanation of ApEn and DFA α.
Applsci 12 04762 g001
Figure 2. Raw output from a trial for a participant with similar complexity and variability values on the right (a) and left (b) sides. Nm = Newton-meters; s = seconds; ApEn = approximate entropy; DFA α = detrended fluctuation analysis α; CV = coefficient of variation. ApEn right/left limb-symmetry-index = 102.9%; ApEn right/left absolute-asymmetry = 2.9%. DFA α right/left limb-symmetry-index = 94.4%; DFA α right/left absolute-asymmetry = 5.6%. CV right/left limb-symmetry-index = 103.5%; CV right/left absolute-asymmetry = 3.5%.
Applsci 12 04762 g002
Figure 3. Raw output from a trial for a participant with different complexity and variability values on the right (a) and left (b) sides. Nm = Newton-meters; s = seconds; ApEn = approximate entropy; DFA α = detrended fluctuation analysis α; CV = coefficient of variation. ApEn right/left limb-symmetry-index = 131.6%; ApEn right/left absolute-asymmetry = 31.6%. DFA α right/left limb-symmetry-index = 86.8%; DFA α right/left absolute-asymmetry = 13.2%. CV right/left limb-symmetry-index = 63.1%; CV right/left absolute-asymmetry = 36.9%.
Applsci 12 04762 g003
Table 1. Summary statistics and effect sizes for the coefficient of variation (n = 16).
CV (%)CV (%)
RLR-LDNDD-ND
Absolute Absolute
Diff. Diff.
Min2.012.280.022.222.010.02
Max3.516.203.643.516.203.64
95% CI2.53, 2.962.67, 3.820.20, 1.222.54, 2.932.68, 3.830.20, 1.22
Mean2.753.240.712.743.250.71
SD0.401.070.960.371.080.96
ES0.45 0.47
CV = coefficient of variation; R = right; L= left; R-L Absolute Diff. = right − left (+/− sign removed); D = dominant; ND = nondominant; D-ND Absolute Diff. = dominant − nondominant (+/− sign removed); Min = minimum; Max = maximum; 95% CI = 95% confidence interval (lower bound, upper bound); SD = standard deviation; ES = effect size.
Table 2. Summary statistics and effect sizes for approximate entropy (n = 16).
ApEnApEn
RLR-LDNDD-ND
Absolute Absolute
Diff. Diff.
Min0.250.140.010.250.140.01
Max0.650.540.290.650.620.29
95% CI0.37, 0.500.31, 0.420.06, 0.140.34, 0.460.33, 0.460.06, 0.14
Mean0.430.360.100.400.390.10
SD0.120.100.070.110.130.07
ES0.73 0.08
ApEn = approximate entropy; R = right; L= left; R-L Absolute Diff. = right − left (+/− sign removed); D = dominant; ND = nondominant; D-ND Absolute Diff. = dominant − nondominant (+/− sign removed); Min = minimum; Max = maximum; 95% CI = 95% confidence interval (lower bound, upper bound); SD = standard deviation; ES = effect size.
Table 3. Summary statistics and effect sizes for detrended fluctuation analysis α (n = 16).
DFA αDFA α
RLR-LDNDD-ND
Absolute Absolute
Diff. Diff.
Min1.171.260.001.261.170.00
Max1.521.620.211.561.620.21
95% CI1.33, 1.471.40, 1.500.04, 0.991.36, 1.451.38, 1.490.41, 0.99
Mean1.38 a1.450.071.401.430.07
SD0.100.090.060.090.110.06
ES1.12 0.34
DFA α = detrended fluctuation analysis α; R = right; L= left; R-L Absolute Diff. = right − left (+/− sign removed); D = dominant; ND = nondominant; D-ND Absolute Diff. = dominant − nondominant (+/− sign removed); Min = minimum; Max = maximum; 95% CI = 95% confidence interval (lower bound, upper bound); SD = standard deviation; ES = effect size; a = significant side-to-side difference, p = 0.00.
Table 4. Summary statistics for the coefficient of variation limb symmetry indices and absolute asymmetries (n = 16).
CVCV
R/LR/LD/NDD/ND
LimbAbsoluteLimbAbsolute
Symm.Asymm.Symm.Asymm.
Index(%)Index(%)
(%) (%)
Min41.20.741.20.7
Max131.258.8120.758.8
95% CI78.3, 102.39.7, 26.778.2, 101.79.7, 26.4
Mean90.318.290.018.0
SD22.616.022.015.7
CV = coefficient of variation; R/L = right/left; D/ND = dominant/nondominant; Limb Symmetry Index, see text for equation and explanation; Absolute Asymmetry, see text for equation and explanation; Min = minimum; Max = maximum; 95% CI = 95% confidence interval (lower bound, upper bound); SD = standard deviation.
Table 5. Summary statistics for approximate entropy symmetry indices and absolute asymmetries (n = 16).
ApEnApEn
R/LR/LD/NDD/ND
LimbAbsoluteLimbAbsolute
Symm.Asymm.Symm.Asymm.
Index(%)Index(%)
(%) (%)
Min58.32.458.32.4
Max309.6209.6309.6209.6
95% CI99.6, 156.18.5, 60.483.2, 144.26.4, 58.2
Mean127.934.5113.732.3
SD53.048.657.248.6
ApEn = approximate entropy; R/L = right/left; D/ND = dominant/nondominant; Limb Symmetry Index, see text for equation and explanation; Absolute Asymmetry, see text for equation and explanation; Min = minimum; Max = maximum; 95% CI = 95% confidence interval (lower bound, upper bound); SD = standard deviation.
Table 6. Summary statistics for detrended fluctuation analysis α symmetry indices and absolute-asymmetries (n = 16).
DFA αDFA α
R/LR/LD/NDD/ND
LimbAbsoluteLimbAbsolute
Symm.Asymm.Symm.Asymm.
Index(%)Index(%)
(%) (%)
Min86.80.386.80.3
Max101.713.2108.113.2
95% CI93.2, 97.73.0, 6.994.9, 101.43.0, 7.0
Mean95.54.998.25.0
SD4.23.76.13.7
DFA α = detrended fluctuation analysis α; R/L = right/left; D/ND = dominant/nondominant; Limb Symmetry Index, see text for equation and explanation; Absolute Asymmetry, see text for equation and explanation; Min = minimum; Max = maximum; 95% CI = 95% confidence interval (lower bound, upper bound); SD = standard deviation.
Publisher’s Note: MDPI stays neutral with regard to jurisdictional claims in published maps and institutional affiliations.

