Article

Brassinin Enhances Apoptosis in Hepatic Carcinoma by Inducing Reactive Oxygen Species Production and Suppressing the JAK2/STAT3 Pathway

1
Department of Biological Sciences, College of Science, King Faisal University, P.O. Box 400, Al Ahsa 31982, Saudi Arabia
2
Department of Chemistry, College of Science, King Faisal University, P.O. Box 400, Al Ahsa 31982, Saudi Arabia
3
Department of Chemistry, Faculty of Science, Tanta University, Tanta 31527, Egypt
4
Department of Zoology, Faculty of Science, Alexandria University, Alexandria 21568, Egypt
*
Author to whom correspondence should be addressed.
Appl. Sci. 2022, 12(9), 4733; https://doi.org/10.3390/app12094733
Submission received: 24 March 2022 / Revised: 25 April 2022 / Accepted: 4 May 2022 / Published: 8 May 2022

Abstract

:
Plants from the family Brassicaceae produce brassinin (BSN), which is an essential indole phytoalexin. BSN can kill certain types of cancer cells. Using hepatocarcinoma (HCC) cells, we examined the molecular mechanisms of BSN. We found that HCC cell growth was suppressed and apoptosis was induced by BSN via the downregulation of the JAK/STAT3 pathway. The cytoplasmic latent transcription factor STAT3, belonging to the STAT family, acted as both a signal transducer and an activator and was linked to tumor progression and decreased survival. BSN incubation caused HCC cells to produce reactive oxygen species (ROS). By activating caspase-9/-3 and PARP cleavage, Bcl-2 was reduced, and apoptosis was increased. BSN inhibited constitutive STAT3, JAK2, and Src phosphorylation. The JAK/STAT signaling cascade was confirmed by siRNA silencing STAT3 in HCC cells. BSN also suppressed apoptosis by Z-Val-Ala-Asp-Fluoromethylketone (Z-VAD-FMK), an apoptotic inhibitor. N-acetylcysteine (NAC) inhibited the production of ROS and diminished BSN-induced apoptosis. Our findings suggested that BSN has potential as a treatment for cancer.

1. Introduction

The liver is the site of hepatocellular carcinoma, which is one of the leading causes of cancer-associated deaths worldwide. In 2020, the World Health Organization (WHO) estimated that approximately 830,000 people would die of liver cancer [1]. Cirrhosis caused by hepatitis B/C infection, heavy alcohol consumption, hemochromatosis, obesity, and diabetes are major risk factors. The treatment options are surgery, chemotherapy, immunotherapy, and targeted therapy. HCC has a poor long-term survival rate when diagnosed late [2]. A variety of chemotherapeutic agents have been used in the treatment of HCCs, but no single or combined chemotherapy regimen has been particularly effective. Therefore, finding new treatments for HCCs, including complementary and preventative approaches, remains a priority. The application of natural anticancer agents could provide an opportunity to improve the current standard of care for HCC.
Studies have found that eating vegetables and fruits high in active compounds can lower your risk of heart disease, allergic inflammation, Alzheimer’s disease, and cancer [3]. Fruits and vegetables produce phytoalexins in response to infection and stress. These compounds inhibit apoptosis, proliferation, the progression of cell cycles, and migration [4,5]. Brassinin is a phytoalexin found in cruciferous vegetables that has antifungal and anticancer properties [6]. BSN suppressed STAT3 signaling in human lung cancer cells and xenograft mice [7]. BSN has been shown to modulate epithelial mesenchymal transition (EMT) in lung cancer cells and induce apoptosis in prostate cancer cells by modulating PI3K/Akt/mTOR [8]. BSN inhibited PI3K signaling cascades in colon cancer cells and boosted p21 and p27 expression [4].
Different types of cancers have abnormal STAT3 activation [9,10,11,12,13]. STAT3 was phosphorylated by JAK1/2 and Src following stimulation by cytokines and growth factors [14]. According to various studies, blocking STAT3 signaling could be an effective way to fight human cancer. Tumor cells can be affected by oxidative stress in multiple ways. Reducing the reactive oxygen species (ROS) levels has been beneficial, but excessively low levels have caused tumors [15]. Radiation, drugs, pollutants, xenobiotics, and other exogenous factors can produce ROS intracellularly. By modulating various cell signaling pathways, ROS has also been shown to control different hallmarks of cancer cells, such as STAT3, protein kinases, growth factors, cytokines, and others [16]. It has been reported that STAT3 activation is deregulated in many human cancers, including HCC, and it is associated with cancer progression, chemoresistance, a poor prognosis, and a shorter lifespan. Deregulating STAT3 cascades has been suggested as a promising therapeutic strategy for countering STAT3′s oncogenic and pro-survival effects in human cancers [1].
In the present study, HepG2 and C3A cells were used that showed distinct differences in energy metabolism and urea production, as compared to primary hepatocytes. Restoring primary hepatocyte characteristics, such as the urea cycle, is crucial. For example, HepG2 cells were successfully transfected with cDNA-encoding urea cycle enzymes to enhance the application of HepG2 and C3A cells for drug testing and bioartificial liver applications [17]. In this study, we also demonstrated the significance of the STAT3 pathway in the growth of HepG2-C3A cells. STAT3 plays a crucial role in several aspects of HCC survival, proliferation, invasion, and angiogenesis. Therefore, we explored whether BSN could provide its anti-proliferative and pro-apoptotic effects in HCC cells by suppressing STAT3 signaling in HCC cells.

2. Materials and Methods

2.1. Reagents and Cell Culture

C3A and HepG2 were obtained from CLS Cell Lines Service GmbH (Eppelheim, Germany) and DMEMF/12 (Gibco company, Co Dublin, Ireland) with 10% FBS (Southern Biotech, Birmingham, AL, USA) was used to culture the cells. We grew the cells in an incubator. Sigma-Aldrich (St. Louis, MO, USA) provided the N-acetyl-cysteine (NAC). Brassinin was purchased from Sigma-Aldrich (St. Louis, MO, USA). The z-VAD-fmk was sourced from Calbiochem (San Diego, CA, USA). Santa Cruz Biotechnology (Santa Cruz, CA) provided the antibodies (primary and secondary). The staining kits for 2′-7′dichlorofluorescin diacetate (DCFH2-DA) and terminal deoxynucleotidyl transferase dUTP nick-end labeling (TUNEL) was obtained from Roche (Mannheim, Germany). Caspase-9 (PA5-15191), caspase-3 (PA5-77887), PARP (PA5-34803), γ-H2A (PA5-116205), p-STAT3 (#44-384G), STAT3 (44-384G), Bcl2 (PA5-27094), pJAK2 (PA5-105889), JAK2 (PA5-11267), psrc (14-9034-82), src (44-656G), cyclin-D1 (PA5-32373), Bcl-xl (PA5-17805), survivin (PA1-16836), VEGF (P802), β-actin (PA1-183), GAPDH (#PA1-987), and cleaved caspase-3 (PA5-114687) were procured from Thermo Fisher Scientific, Inc. (Waltham, MA, USA).

2.2. MTT Assay

HepG2 and C3A cells (1 × 10⁴ cells/mL) were cultured in 96-well plates and incubated with various concentrations of BSN (purity 98%, Sigma-Aldrich (St. Louis, MO, USA) for 24 h, 48 h, and 72 h, respectively. 3-(4,5-dimethylthiazol-2-yl)-2,5-diphenyltetrazolium bromide, also known as 2,5-diphenyl-2H-tetrazolium bromide (MTT), was applied to determine the cell viability on the basis of the manufacturer’s protocol. The viability was calculated by comparing the absorbance of each group with control cells, which were arbitrarily assigned 100%.

2.3. Western Blotting

A Radioimmunoprecipitation assay (RIPA) buffer was used to extract the protein of the gastric cancer cells and tumor tissue samples for 50 min at 4 °C. Next, we centrifuged the lysates for 15 min at 17,500× g at 4 °C, as previously described [18]. After centrifugation, the supernatant was used for Western blotting analysis. Protein concentration was quantified by bicinchoninic acid (BCA) analysis kit (Beyotime, Shanghai, China). Protein lysates were separated on 10–12.5% SDS-polyacrylamide gels and were used to resolve equal amounts of protein (50 μg) and transferred to nitrocellulose membranes. Membranes were subsequently blocked and incubated with specific primary antibodies (caspase-9, caspase-3, PARP, γ-H2A, p-STAT3, STAT3, Bcl2, pJAK2, JAK2, psrc, src, Cuclin-D1, Bcl-xl, Survivin, VEGF, β-actin, GAPDH, and Cleaved caspase-3) and HRP-conjugated secondary antibodies. β-actin was an internal loading control. The samples were examined with a LI-COR chemiluminescence imaging system (3600-00-C-Digit Blot Scanner) to visualize the protein bands. In order to generate the graphs, we used LI-COR Biosciences Image Studio Lite software (Lincoln, NE, USA) with normalization for the intensity of the untreated control band, which was set to 1. Each experiment was repeated at least three times.

2.4. ROS Detection

The DCFH2-DA method measured the ROS levels in cells [19]. In an 8-well Lab Teck chamber, 1.5 × 10⁵ cells were grown to 80% confluence. ROS were inhibited in cells that had been treated with NAC (3 mM) one hour before BSN (200 µmoL). Fluorescence from DCF indicated intracellular ROS. This was performed with a fluorescence microscope from Olympus. LS 5.0 soft imaging solution analysis was used to quantify fluorescence intensity under each setting.

2.5. DNA Fragmentation

Following the protocols in previous studies, cellular DNA fragments were detected using a cell death detection ELISAPLUS kit (Roche Molecular Biochemicals, Mannheim, Germany) [20].

2.6. Immunofluorescence for Nuclear Translocation

After the treatment, we fixed the cells in 4% paraformaldehyde (PFA) in 1 X PBS for 20 min after treating the cells with BSN (200 mol) for 2 h. After being permeabilized with 0.2% Triton X-100 for 10 min, the HepG2 and C3A cells were blocked with 5% BSA in 1% PBS for 1 hour. They were then incubated with STAT3 primary antibody for 24 h. At room temperatures the next day, the cells were incubated with secondary antibodies Alexa Fluor 594 rabbit anti-rabbit IgG (H + L) for 60 min. Nuclei of control cells were probed with 1 ug/mL DAPI for 3 min. Measurements were performed using a Leica D6000 fluorescence microscope (Leica, Wetzlar, Germany).

2.7. Colony Assay

A density of 3 × 10⁵/well was seeded into 6-well plates, and cells were cultured for 2 weeks. We washed the cells twice with PBS, fixed them with 4% formaldehyde for 15 min, and stained them with crystal violet (Sangon Biotech Co., Ltd., Shanghai, China) for 15 min. A microscope (Olympus, Tokyo, Japan) was used to count colonies and calculate colony formation rates.

2.8. Cell Invasion

We used BD Matrigel invasion chambers to test invasion. In the invasion assay, 10 µL Matrigel was applied to a polycarbonate membrane filter, and the standard medium was in the bottom of the apparatus. Cells were seeded in top chambers with 1 × 10⁵ cells in 500 µL serum-free medium, and BSN was added in the indicated doses. In the bottom chambers (750 µL), we added 10% FBS to the media. We allowed the cells to migrate for 24 h. After incubation with a cotton swab, we removed the non-migrated cells on top of the membrane. We fixed the migrated cells in cold 75% methanol for 15 min and then washed these three times in PBS. After Giemsa staining, the cells were washed with PBS. The imagery was taken with an optical microscope (200× magnification), and invading cells were counted manually. Invading cells were quantified as percentage of inhibition, with control cells as 100%.

2.9. Cell Migration

In the cell migration assay, 3 × 10⁵ HepG2 and C3A cells were plated in DMEM with 10% FBS and grown to a nearly confluent monolayer. We resuspended the cells in DMEM/F12 medium with 1% FBS. A 200 mL pipette tip was used to scratch the monolayers. Following a wash with PBS, the cells were incubated with BSN for 24 h. We stained the cells with Giemsa stain solution and de-stained them with PBS. After 24 h, we obtained photos of the cultures (100× magnification) to track the migration of cells into the wound area and calculated how close it was to achieving full wound closure.

2.10. TUNEL Assay

DNA fragmentation was measured with deoxynucleotidyl oligonucleotide TUNEL assays. After BSN treatments, the apoptotic cells (2 × 10⁴ in eight-well plates) were collected, fixed, and mounted in 4% formaldehyde. Hydrogen peroxide (3%) and endogenous peroxidase in methanol were used with TBS-fixed cells permeable to proteinase K 20 g/mL. Using the enzyme at 37 °C for 1.5 h, the 3′OH ends of DNA were detected to measure apoptosis. The slides were then incubated with streptavidin and 3,3′-diaminobenzidine. Under a fluorescence microscope, their fluorescent nuclei helped classify the fragmented DNA.

2.11. Transfection Assay

We transfected HCC cells for 24 h with scrambled siRNA (50 nM) and STAT3 using the Neon Transfection System (Invitrogen, Carlsbad, CA, USA). Transfected cells were treated with BSN for 4 h and 48 h. The cells were lysed, and equal amounts of proteins were prepared for Western blot analysis.

2.12. Statistics

Data are presented as mean ± SD (standard deviations) for at least three separate experiments. One-way ANOVA was used with GraphPad Prism software version 6.0. Tukey’s post hoc test was used in this study to analyze the data. Experiments were conducted in triplicate. * p < 0.05 vs. control; # p < 0.05 vs. BSN treatment.

3. Results

3.1. BSN Inhibited Cell Growth in HCC Cells

In HepG2 and C3A cells, BSN concentrations were tested for 24, 48, and 72 h to observe whether cell damage resulted. Each experiment was repeated at least three times. The BSN showed considerable growth inhibition against HepG2 and C3A cells, as shown in Supplementary Figure S1B,C, proving the specificity of the BSN-mediated effects. Therefore, it was highly likely that BSN suppressed cell growth by inducing apoptosis. These data suggest an anti-cancer role for BSN in HCC, and the IC50 of BSN was approximately 200 μmol for HepG2 and C3A cells at 48 h.

3.2. BSN Induced Apoptosis through Caspase-Mediated Activation

At multiple stages of cancer progression, apoptotic cell death operates as a tumor suppressor. In addition, apoptosis engagement is a potent therapeutic effector [21]. As the primary driver of apoptosis, caspase-9 has been classified as the initiator, and procaspase-3, when activated, would then be cleaved and execute apoptosis [22]. Therefore, we studied the potential of BSN on caspase activation. The Western blot analysis of the HCC cells treated with BSN showed a decline in expression levels of procaspase-9 and procaspase-3, but an increase in the cleaved form of caspase-3, which indicated the activation of caspases (Figure 1A,B). In addition, cleaved PARP, a marker for DNA double-strand breaks, showed dose-dependent increases.

3.3. BSN Induced Caspase-Dependent Apoptosis in HCC Cells

Activating caspases is key to apoptosis [23]. Z-VAD-FMK was used as a caspase inhibitor to test the effect of BSN on the viability abnormalities in HepG2 and C3A cells. According to the Western blot and MTT data, Z-VAD-FMK pre-treatment of HepG2 and C3A cells downregulated BSN-mediated cell death (Figure 1C,D and Supplementary Figure S2A,B). Z-VAD-FMK inactivated caspases in HepG2 and C3A cells and suppressed cellular morphology changes caused by BSN, which agreed with the Western blot and MTT data. These results show that caspases play a major role in the HCC cell apoptosis caused by BSN.

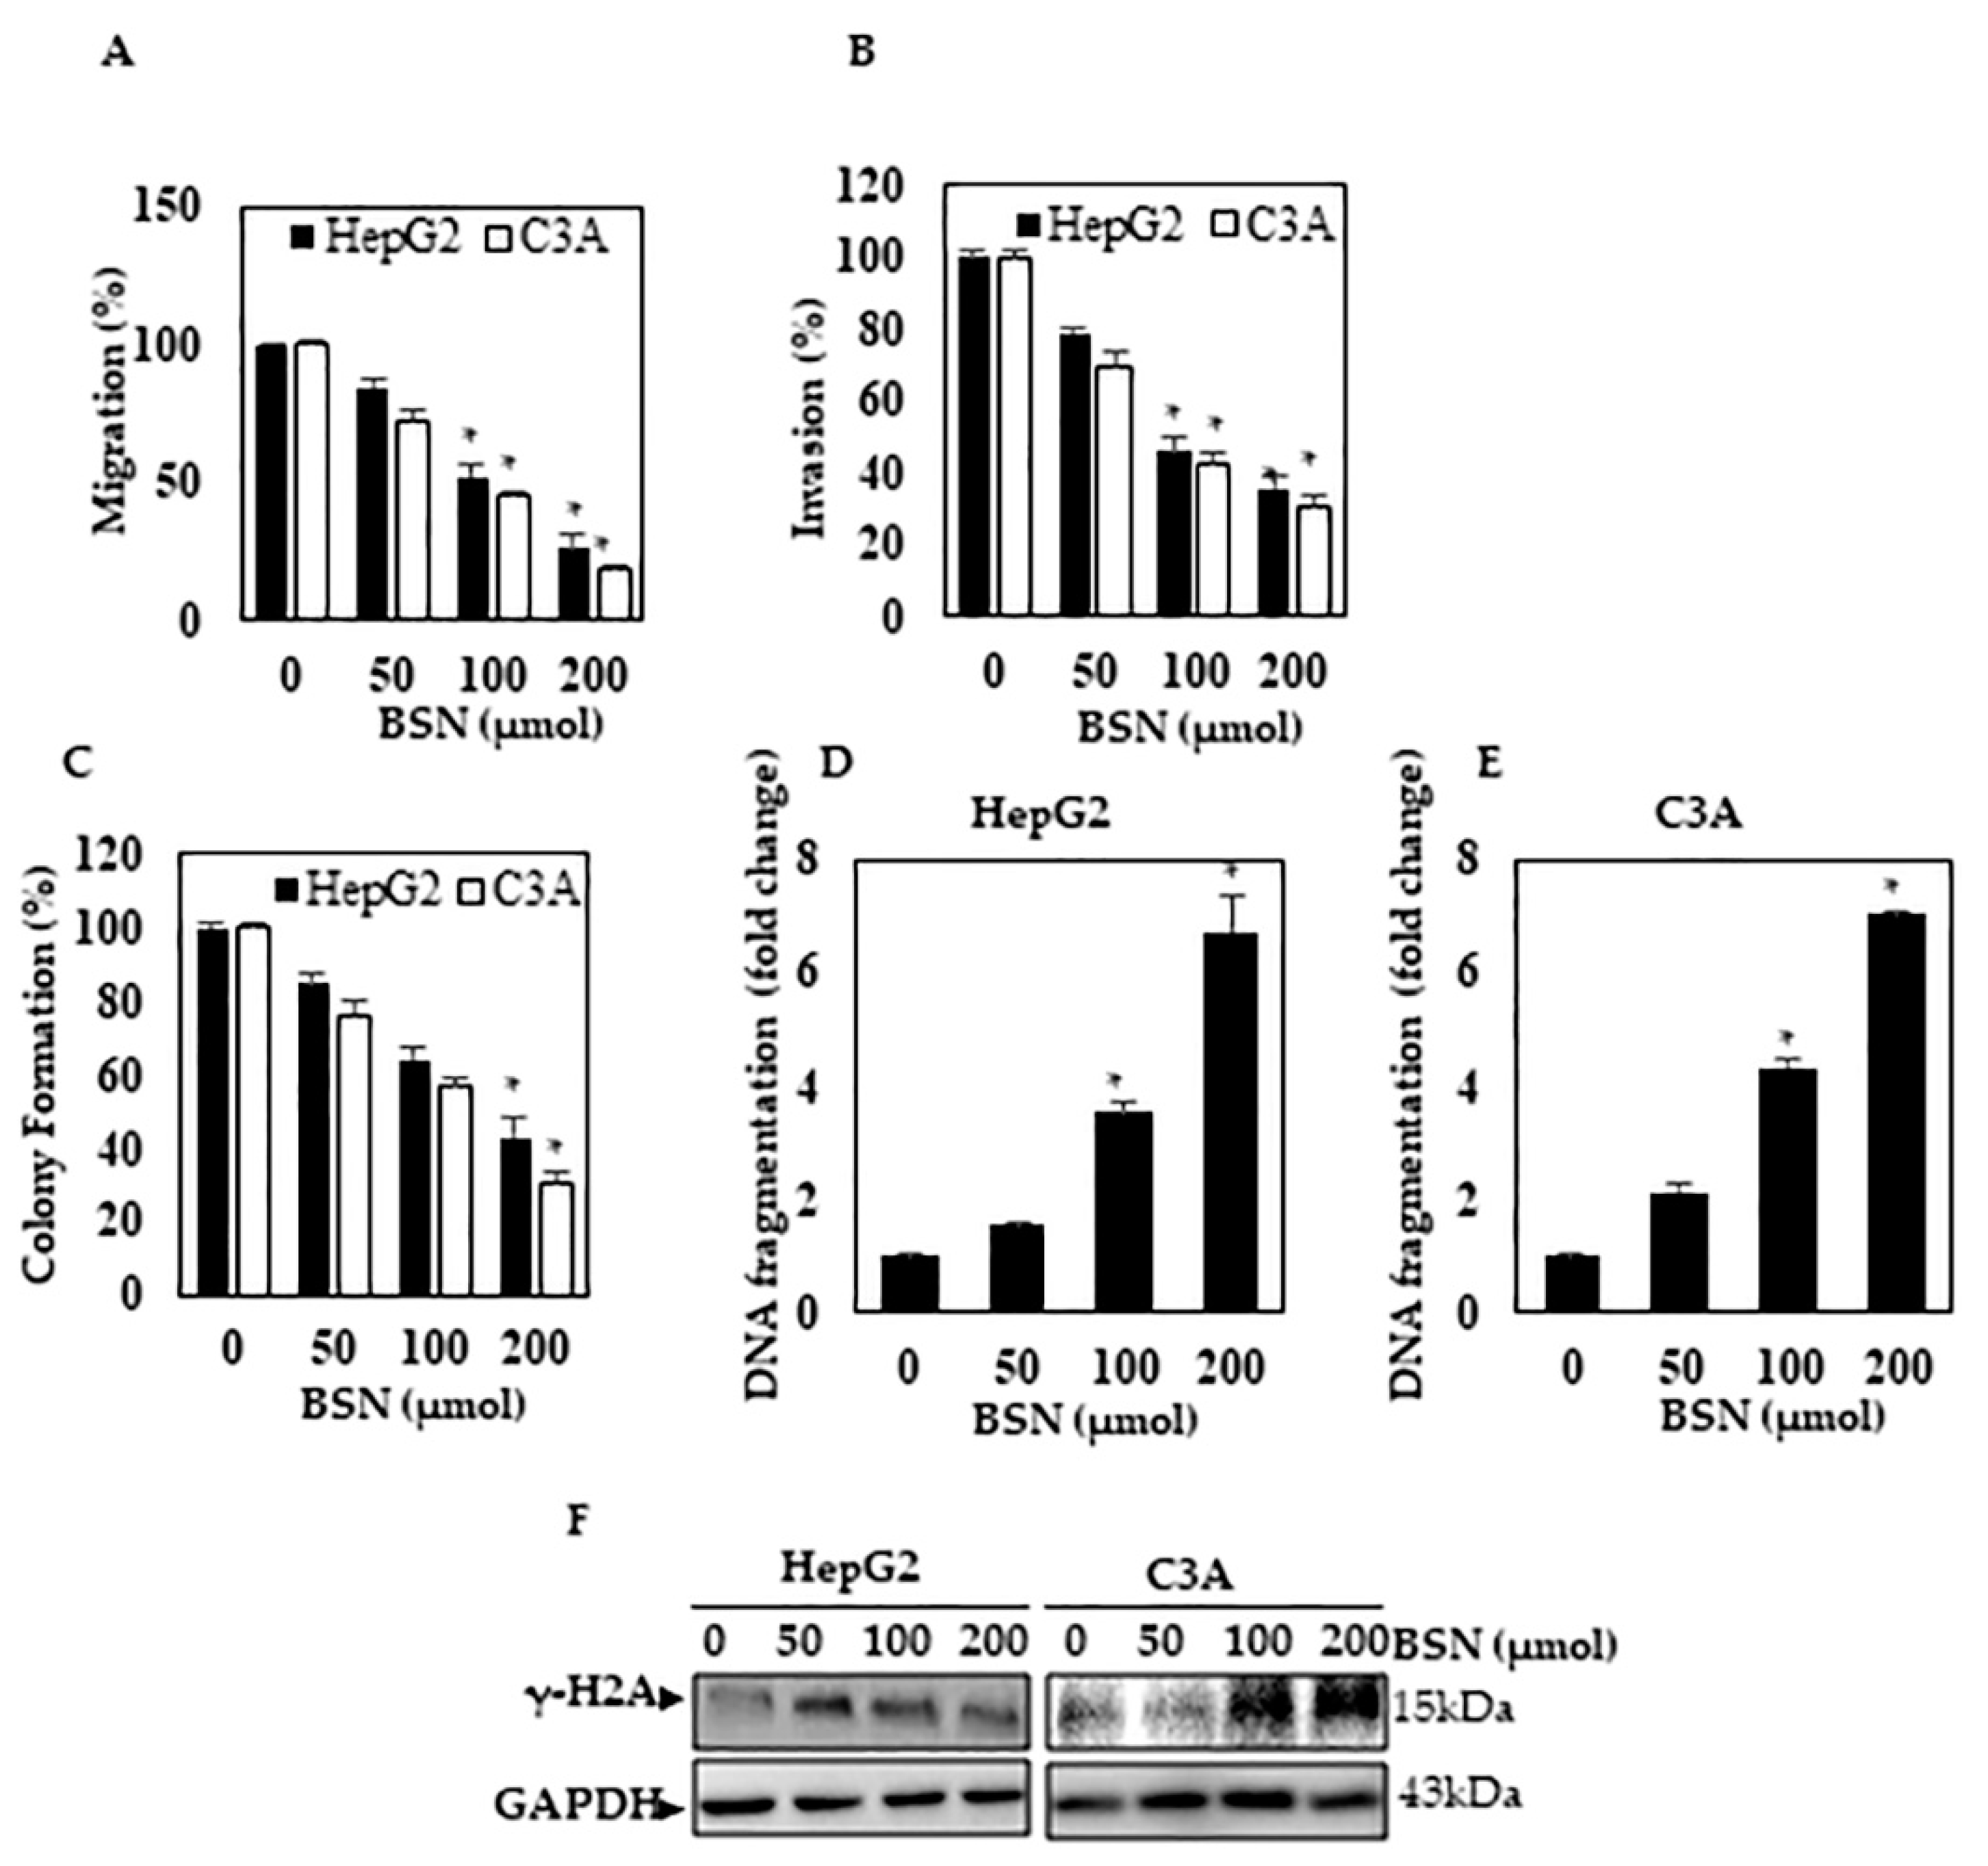
3.4. BSN Inhibited the HCC Migration and Invasion

Metastasis and the invasion of tumor cells are understood as the process of cells separating from the primary tumor, entering lymphatic vessels and the bloodstream, and spreading to distant organs [24,25]. It was important to identify the molecules that control the invasion and metastasis in cancer patients. A wound healing and invasion assay was performed to test BSN’s effects on HCC migration and invasion. Figure 2A shows that BSN (0–200 µmol) significantly restricted HCC cell migration. Furthermore, the migration potential of C3A cells was higher than that of HepG2 cells. In an experiment to examine whether BSN might prevent HCC invasion, HepG2 and C3A cells were exposed to BSN (0–200 µmol) for 24 h, and transwell invasion assays were performed using Matrigel-based transwells. Similarly, C3A HCC had a higher invasive ability than HepG2, based on the number of invading cells in the control group (Figure 2B).

3.5. BSN Inhibited HCC Colony Formation

The long-term impact of BSN on HCC growth was also evaluated by assessing its colony formation ability. BSN dose-dependently reduced the colony-forming ability in HepG2 and C3A cells (p < 0.05) (Figure 2C). Both types of HCC had lower colony numbers and smaller colonies. According to these data, BSN may decrease HCC cells’ proliferation and tumor-forming ability.

3.6. BSN Induced DNA Damage in HCC Cells

Augmented DNA fragmentation was noticed in BSN-treated (200 µmol) HepG2 and C3A cells (Figure 2D,E). DNA fragmentation was significantly higher in BSN-treated cells. Based on these results, BSN caused DNA fragmentation in HCC cells. In addition, by Western blotting of HCC cells, we tested whether BSN caused DNA damage. DNA damage marker γ-H2A was significantly elevated in BSN-treated cells, suggesting that BSN might be able to prevent the damage caused by BSN (Figure 2F).

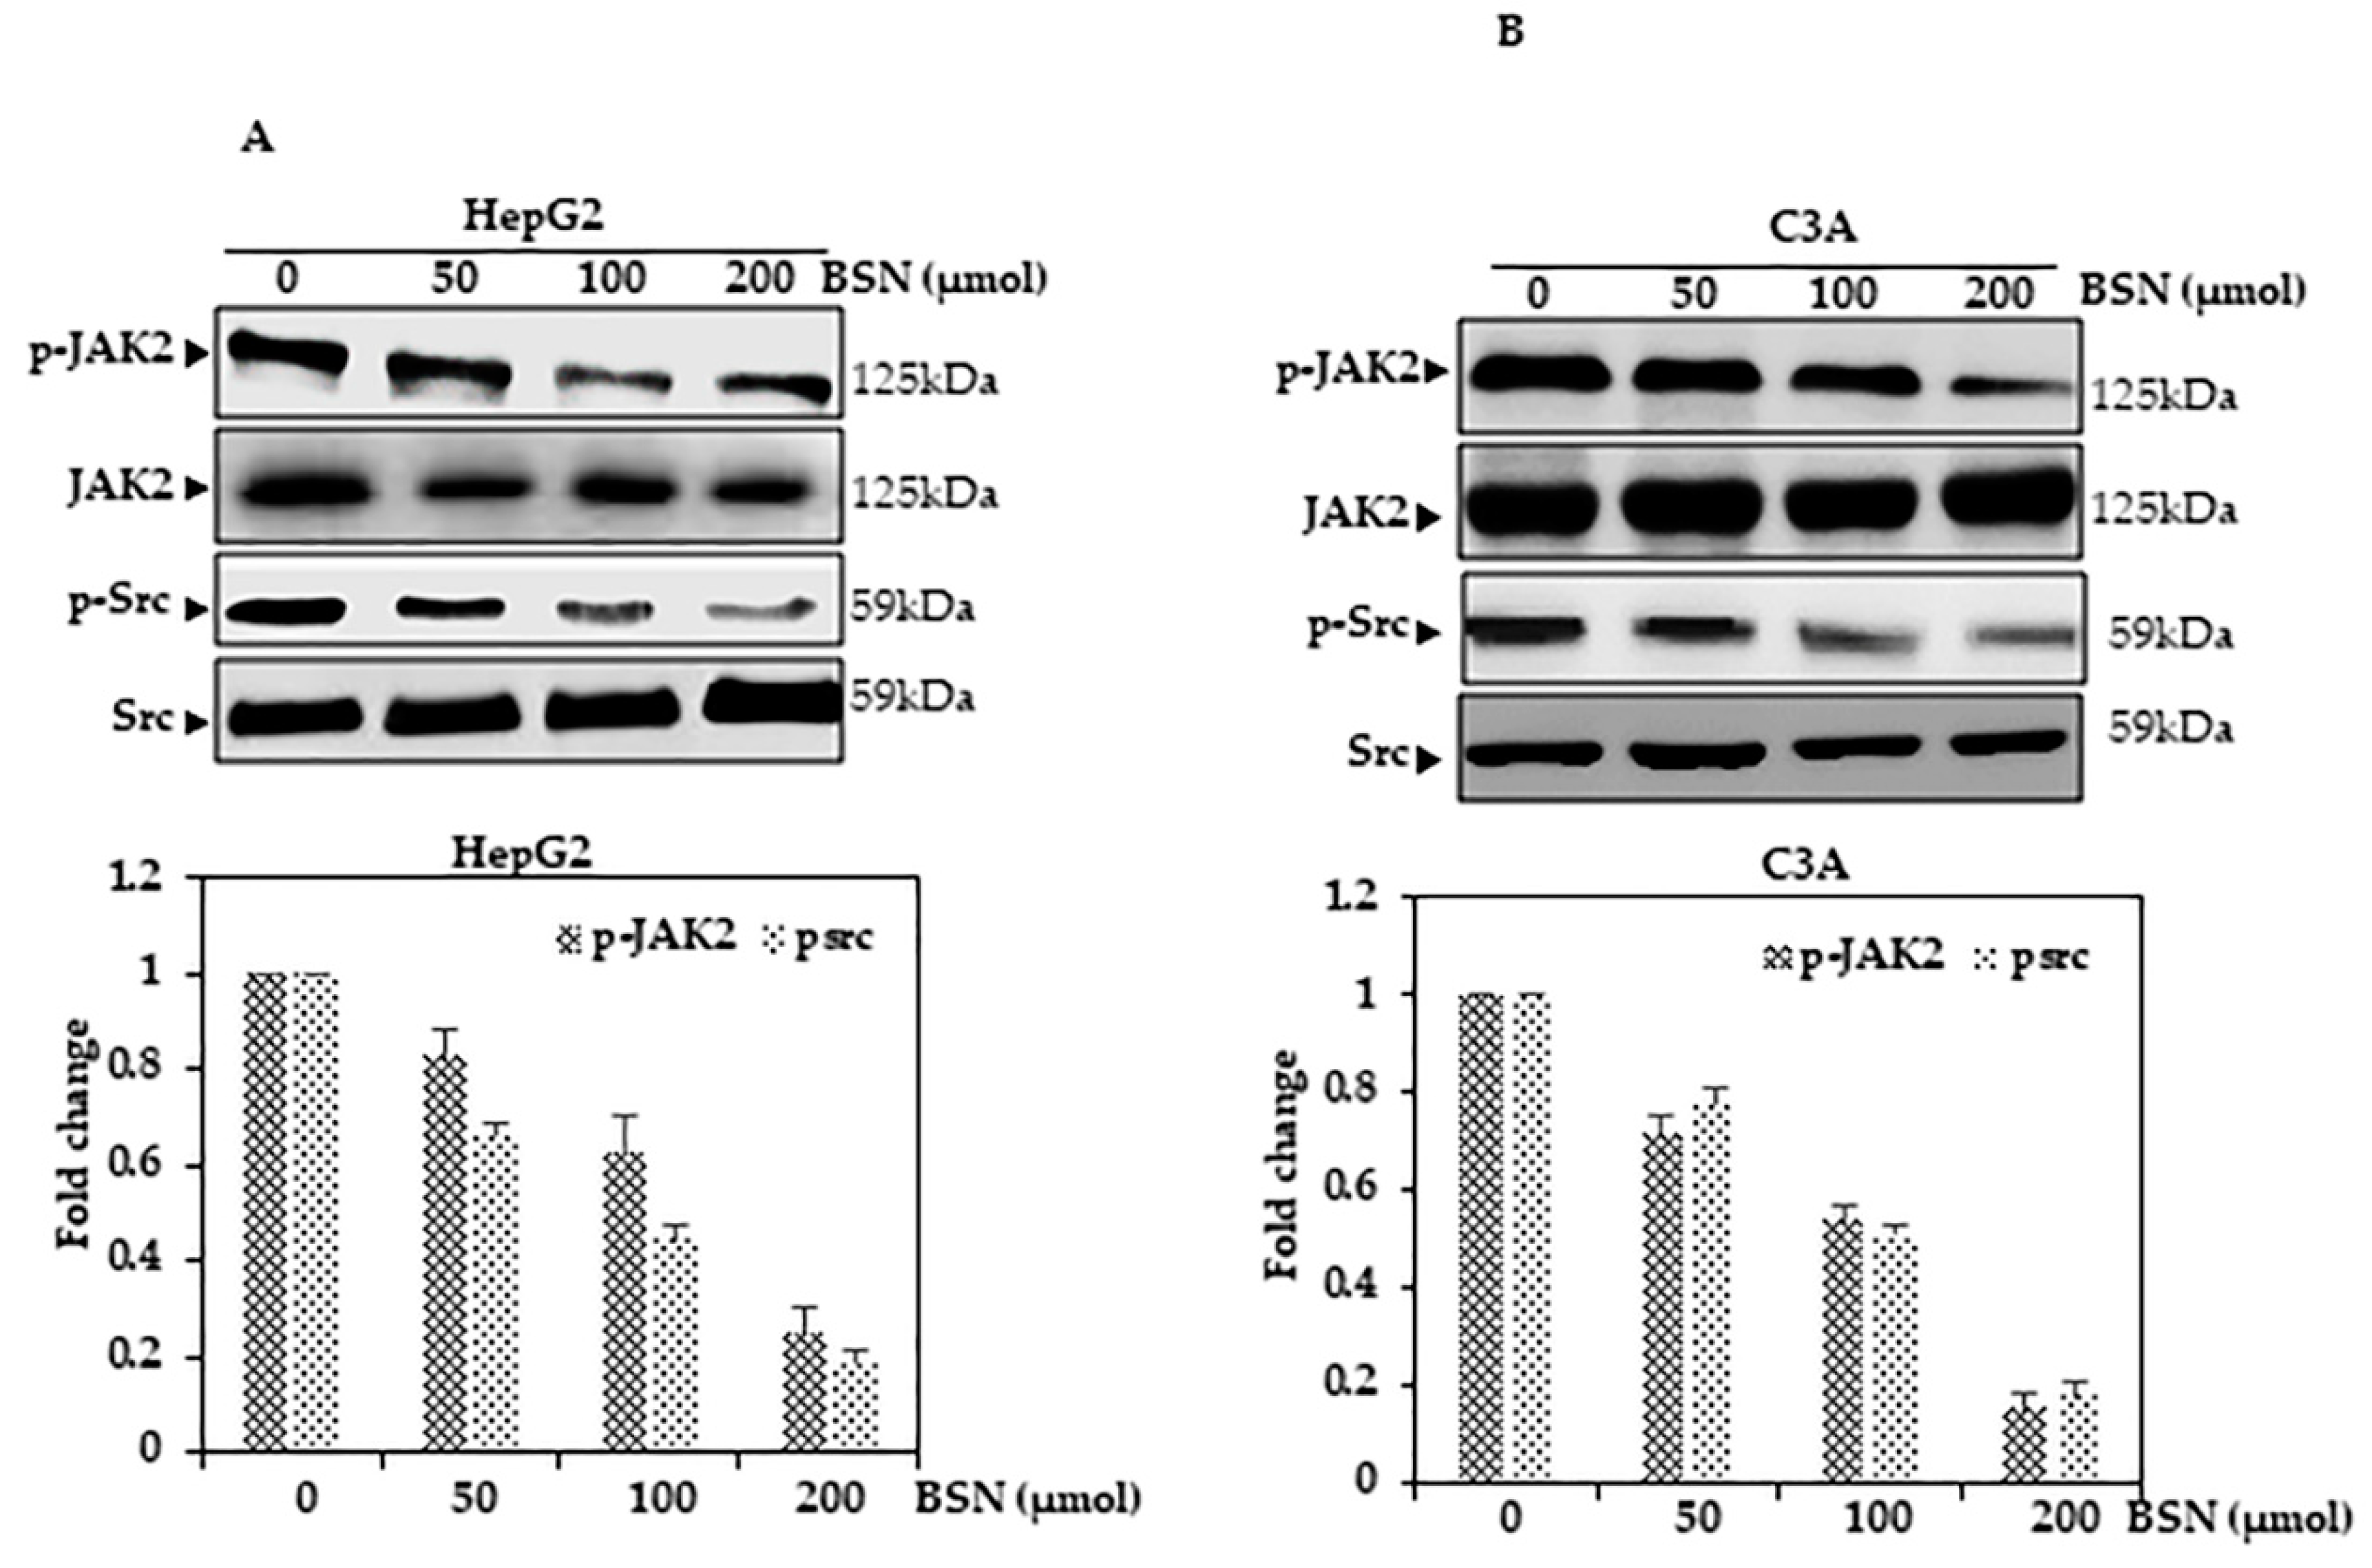
3.7. BSN Promoted ROS Production and Inactivated STAT3 in HCC Cancer Cells

Enzymatic reactions in cells released ROS. ROS increased apoptosis in cancer cells [26]. HepG2 and C3A cells treated with BSN (0–200 µmol) for 30 min had dramatically increased intracellular ROS levels (Figure 3A). There was a significant increase in DCF fluorescence after treatment with BSN (200 µmol) in both cells. An ROS inhibitor, NAC, was used to incubate HepG2 and C3a cells for 30 min with BSN (200 µmol) to test whether ROS contributed to BSN-mediated cell death. The results showed that NAC stopped the production of ROS considerably (Figure 3B). By treating HepG2 and C3A cells with BSN and NAC, we measured the levels of p-STAT3 protein to observe whether ROS was involved in STAT3 phosphorylation. Pre-treatment with NAC significantly reduced p-STAT3 levels and its downstream targets, such as Bcl-2 and caspase-3 caused by BSN (Figure 3B), suggesting that ROS hindered STAT3 activity in HepG2 and C3A cells. Notably, apoptosis was inhibited by NAC and BSN, and the cell death that had been mediated by BSN was reversed (Supplementary Figure S2C,D). Based on these findings, BSN caused intracellular ROS to be generated, leading to apoptotic cell death in HCC cells.

3.8. BSN Inhibited STAT3 Activation in HCC Cells

In many cancers, including HCC, abnormal activation of STAT3 signaling has led to increased levels of p-STAT3-driven downstream targets, including Bcl-2, BclxL, survivin, and VEGF [27,28]. As a result, we studied the mechanism of BSN-induced growth inhibition by HepG2 and C3A cells. Western blot analysis showed p-STAT3 involvement. Figure 4A shows that BSN treatment reduced the total protein content of p-STAT3 in a dose-dependent manner in HepG2 cells. BSN at 200 µmol decreased STAT3 phosphorylation fourfold, which led to proteasomal degradation.

3.9. STAT3 Silencing Suppressed BSN-Mediated Apoptosis in HCC

In STAT3 knockdown experiments, the essential role of STAT3 in BSN-mediated apoptosis mechanisms in HCC cells was further confirmed. Western blotting showed STAT3 knockdown cells exposed to BSN (200 µmol) induced a reduction in Bcl-2 and cleaved caspase-3 expression, suggesting that STAT3 knockdown affected apoptosis protein expression (Figure 4B,C).

3.10. BSN Inhibited Src Activation

Due to STAT3 being activated by JAK tyrosine kinases [29], we next showed that BSN could affect JAK1 and JAK2 activation in HepG2 and C3A cells. BSN suppressed JAK1 and JAK2 phosphorylation (Figure 5A,B). Under the same conditions, the levels of non-phosphorylated JAK1 and JAK2 remained the same. The Src kinase family may also activate STAT3 (Rajendran et al., 2012). As a result, we tested whether BSN affected Src kinase activation in C3A cells. BSN suppressed c-Src kinase constitutive phosphorylation (Figure 5A,B).

3.11. BSN Promoted Apoptosis in HCC Cells

We evaluated BSN’s apoptotic capacity (Figure 6A,B). These results showed that BSN could cause apoptosis. Using BSN in our experiments, we also found that it diminished the constitutive expression of various proliferative, survival, and angiogenetic proteins (Figure 6C,D) in HCC cells, which may explain its potential anti-neoplastic effects.

3.12. Gene Expression Profiling Interactive Analysis of STAT3 in Liver Cancer

STAT3 mRNA expression in tumors and normal tissues were analyzed using the publicly available liver hepatocellular carcinoma (LIHC) database gene expression profiling interactive analysis (GEPIA) to explore STAT3 expression in LIHC. As shown in Supplementary Figure S1A, LIHC tissues had significantly higher STAT3 mRNA expression than nearby non-tumor liver tissues (p < 0.01). In LIHC, STAT3 mRNA expression was significantly associated with the pathological stage (p = 0.001) (Supplementary Figure S1B). Most importantly, based on our Kaplan–Meier analysis, we built a prognostic classifier to determine whether STAT3 mRNA expression levels affected clinical outcomes. As shown in Supplementary Figure S1C,D, STAT3 expression was significantly correlated with LIHC patients (p = 0.010).

4. Discussion

Chemotherapy resistance remains a challenge, despite the availability of several well-known chemotherapeutic agents [30]. Considering the growing interest in natural compounds as potential cancer treatments, we extensively researched the molecular mechanisms unpinning the anti-cancer properties of BSN in HCC cells. We found that BSN inhibited the STAT3/JAK2 signaling pathway activity in HCC cell lines by reducing cell viability and causing apoptosis, which was regulated by ROS (Figure 1). Additionally, our results aligned with previous studies showing that BSN inhibited cell proliferation and colony formation in HCC and lung cancer [5,31]. Increased TUNEL-positive cells, increased caspase-3 cleavage, and PARP cleavage followed BSN treatment and showed pro-apoptotic properties. Bcl-2 inhibited apoptosis by acting as an anti-apoptotic regulator (Figure 6). There was much evidence that Bcl-2 suppressed apoptosis [32,33,34]. In our study, Bcl-2 activation was dramatically inhibited by BSN. Our findings aligned with previous research [8,35]. The BSN treatment released cytochrome C, which triggered caspase cascades, resulting in apoptosis [5]. Western blot analysis confirmed the caspase-mediated cell death induced by BSN was inhibited by z-VAD-FMK, a pro-caspase inhibitor (Figure 1D).
ROS production inside the cell can affect several physiological functions [15,36]. ROS can affect DNA, proteins, and lipids, causing oxidative stress and cell death. Several studies have shown that indole phytoalexin caused apoptosis in cancer cells by boosting ROS levels [37,38]. NAC (N-acetyl-l-cysteine) inhibits ROS-dependent apoptosis. A synthetic precursor of cysteine and glutathione, NAC, has anti-ROS properties either directly by scavenging free radicals or indirectly by increasing glutathione levels. NAC is commonly used to confirm ROSs are involved in drug-induced apoptosis [39]. In order to maintain healthy ROS levels in cells, oxygen is converted to ROS by redox reactions during respiration. In normal cells, ROS generation is out of control, which results in DNA damage caused by free radicals and can cause cancer. ROSs are also responsible for nonalcoholic steatohepatitis (NASH) to HCC [36]. The high metabolic and proliferation rates of cancer cells produce more ROS than normal cells, but high ROS generation can also kill cancer cells. For example, walsuronoid B inhibited cell proliferation by stopping the G2/M phase via mitochondrial depolarization and induced apoptosis through ROS/p53 [5]. In prior studies, BSN has also been shown to induce ROS, modulate PI3K/AKT/mTOR, and arrest cells during EMT [31]. The mechanisms underlying ROS-induced cell death from BSN are still unclear. Based on the current study, BSN increased ROS levels up to fourfold and caused cell death. In the presence of BSN, blocking ROS production with NAC significantly increased cell viability. The NAC co-treatment recovered anti-apoptotic protein Bcl-2 and decreased pro-apoptotic protein levels, resulting in a decrease in pro-caspase-3 activity. ROS appears to play a pivotal role in causing BSN-induced apoptosis in HCC cells.
The tyrosine kinase STAT3 is phosphorylated by various intrinsic and extrinsic factors. Angiogenesis, drug resistance, invasion, and anti-apoptotic response could be improved by STAT3 phosphorylation [13,27]. Dephosphorylation of the STAT3 pathway has led to an improvement of apoptosis in cancer cells, cell cycle arrest, inhibition of carcinomagenesis, and prolonged survival in tumor xenograft models [12,40]. In our study, BSN significantly reduced STAT3 activation. Junus kinase (JAK) mediated signal pathways by STAT in adjacent cytoplasm.
Furthermore, JAK2 and Src, STAT3’s upstream signals, were also highly expressed in hepatic cancer cells [41]. BSN could inactivate JAK2 and Src in a dose-dependent manner. By suppressing JAK2 and STAT3 signals, BSN could have an even greater effect on cell death. Therefore, we hypothesized that BSN-induced anti-cancer effects might be related to dephosphorylation of STAT3, JAK2, and Src. We found that BSN-induced suppression of constitutive STAT3 expression was diminished by NAC pre-treatment (Figure 3). ROS generation was one of the early events, but STAT3 activation was a downstream process of ROS generation. BSN induced apoptosis in HCC cells by activating STAT3, which depended on ROS levels. Phosphorylation of STAT3 is crucial to tumor cell proliferation [42].
Additionally, we found that BSN suppressed the expression of a number of STAT3-regulated genes, including proliferative (cyclin D1), anti-apoptotic (Bcl-2, Bcl-xL, survivin and Mcl-1), and angiogenic genes (VEGF). As cyclin D1 is necessary for the transition from G1 to the S phase in the cell cycle, the downregulation of cyclin D1 expression may explain the antiproliferative effects of BSN. Niu et al. (2002) found that the inhibition of STAT3 by an Src inhibitor led to a downregulation of Mcl-1 expression in melanoma cells [43]. The activation of STAT3 signaling also induced survivin gene expression and conferred resistance to apoptosis. Several chemotherapeutic agents also blocked Bcl-2 and Bcl-xL, which have been associated with an increase in chemoresistance [44]. This indicated that Bcl-2, Bcl-xL, survivin, and Mcl-1 expressions had been downregulated when BSN induced apoptosis in HCC cells. According to these observations, caspase-3-induced PARP cleavage increased, and TUNEL assays detected an increase in apoptotic cells (Figure 1 and Figure 6). STAT3 expression could promote tumor survival and growth whenever expressed, so agents such as BSN could lead to apoptosis by targeting STAT3.

5. Conclusions

As far as we know, to date, this is the first paper demonstrating that BSN inhibits cell viability in HCC cells via ROS. BSN caused apoptosis, as evidenced by TUNEL-positive cells. BSN increased ROS, changed Bcl-2/Bax ratios, activated caspase-3, cleaved PARP, and induced apoptosis. These findings suggest that BSN may be a promising chemotherapeutic agent in treating hepatocarcinoma. It may be possible to use BSN to treat cancers harboring active STAT3 and other inflammatory diseases; further in vivo studies will be necessary for validation.

Supplementary Materials

The following supporting information can be downloaded at: https://www.mdpi.com/article/10.3390/app12094733/s1, Figure S1: Brassinin inhibits cell growth; Figure S2: Brassinin induces apoptosis; Figure S3: STAT3 is overexpressed in tumor tissues, and its expression correlates with OS and RFS of LIHC patients.

Author Contributions

Conceptualization, P.R. and A.S.; methodology, P.R., H.E. and M.A.; software, A.S.; validation, M.A., P.R. and H.E.; formal analysis, M.A.; investigation, P.R.; resources, P.R.; data curation, P.R.; writing—original draft preparation, P.R.; writing—review and editing, H.E. and A.S.; visualization, P.R.; supervision, P.R.; project administration, H.E.; funding acquisition, H.E. All authors have read and agreed to the published version of the manuscript.

Funding

This research was funded by the Deanship of Scientific Research at King Faisal University, Saudi Arabia, grant number 1811005.

Institutional Review Board Statement

Not applicable.

Informed Consent Statement

Not applicable.

Data Availability Statement

The data that support the findings of this study are available from the corresponding author upon reasonable request.

Acknowledgments

Deanship of Scientific Research at King Faisal University, Saudi Arabia.

Conflicts of Interest

The authors declare no conflict of interest.

References

  1. Mohan, C.D.; Yang, M.H.; Rangappa, S.; Chinnathambi, A.; Alharbi, S.A.; Alahmadi, T.A.; Deivasigamani, A.; Hui, K.M.; Sethi, G.; Rangappa, K.S. 3-Formylchromone Counteracts STAT3 Signaling Pathway by Elevating SHP-2 Expression in Hepatocellular Carcinoma. Biology 2021, 11, 29. [Google Scholar] [CrossRef] [PubMed]
  2. Mohan, C.D.; Bharathkumar, H.; Bulusu, K.C.; Pandey, V.; Rangappa, S.; Fuchs, J.E.; Shanmugam, M.K.; Dai, X.; Li, F.; Deivasigamani, A. Development of a novel azaspirane that targets the Janus kinase-signal transducer and activator of transcription (STAT) pathway in hepatocellular carcinoma in vitro and in vivo. J. Biol. Chem. 2014, 289, 34296–34307. [Google Scholar] [CrossRef] [PubMed] [Green Version]
  3. Chen, Y.-H.; Yeh, C.-W.; Lo, H.-C.; Su, S.-L.; Hseu, Y.-C.; Hsu, L.-S. Generation of reactive oxygen species mediates butein-induced apoptosis in neuroblastoma cells. Oncol. Rep. 2012, 27, 1233–1237. [Google Scholar] [CrossRef] [Green Version]
  4. Chripkova, M.; Drutovic, D.; Pilatova, M.; Mikes, J.; Budovska, M.; Vaskova, J.; Broggini, M.; Mirossay, L.; Mojzis, J. Brassinin and its derivatives as potential anticancer agents. Toxicol. Vitr. 2014, 28, 909–915. [Google Scholar] [CrossRef] [PubMed]
  5. Hong, T.; Ham, J.; Song, J.; Song, G.; Lim, W. Brassinin inhibits proliferation in human liver cancer cells via mitochondrial dysfunction. Cells 2021, 10, 332. [Google Scholar] [CrossRef]
  6. Takasugi, M.; Katsui, N.; Shirata, A. Isolation of three novel sulphur-containing phytoalexins from the chinese cabbage Brassica campestris L. ssp. pekinensis (cruciferae). J. Chem. Soc. Chem. Commun. 1986, 14, 1077–1078. [Google Scholar] [CrossRef]
  7. Lee, J.H.; Kim, C.; Sethi, G.; Ahn, K.S. Brassinin inhibits STAT3 signaling pathway through modulation of PIAS-3 and SOCS-3 expression and sensitizes human lung cancer xenograft in nude mice to paclitaxel. Oncotarget 2015, 6, 6386. [Google Scholar] [CrossRef] [PubMed] [Green Version]
  8. Kim, S.M.; Park, J.H.; Kim, K.D.; Nam, D.; Shim, B.S.; Kim, S.H.; Ahn, K.S.; Choi, S.H.; Ahn, K.S. Brassinin induces apoptosis in PC-3 human prostate cancer cells through the suppression of PI3K/Akt/mTOR/S6K1 signaling cascades. Phytother. Res. 2014, 28, 423–431. [Google Scholar] [CrossRef]
  9. Jung, Y.Y.; Ha, I.J.; Um, J.-Y.; Sethi, G.; Ahn, K.S. Fangchinoline diminishes STAT3 activation by stimulating oxidative stress and targeting SHP-1 protein in multiple myeloma model. J. Adv. Res. 2022, 35, 245–257. [Google Scholar] [CrossRef]
  10. Shanmugam, M.K.; Rajendran, P.; Li, F.; Kim, C.; Sikka, S.; Siveen, K.S.; Kumar, A.P.; Ahn, K.S.; Sethi, G. Abrogation of STAT3 signaling cascade by zerumbone inhibits proliferation and induces apoptosis in renal cell carcinoma xenograft mouse model. Mol. Carcinog. 2015, 54, 971–985. [Google Scholar] [CrossRef]
  11. Kannaiyan, R.; Hay, H.S.; Rajendran, P.; Li, F.; Shanmugam, M.K.; Vali, S.; Abbasi, T.; Kapoor, S.; Sharma, A.; Kumar, A.P. Celastrol inhibits proliferation and induces chemosensitization through down-regulation of NF-κB and STAT3 regulated gene products in multiple myeloma cells. Br. J. Pharmacol. 2011, 164, 1506–1521. [Google Scholar] [CrossRef] [PubMed] [Green Version]
  12. Shanmugam, M.K.; Rajendran, P.; Li, F.; Nema, T.; Vali, S.; Abbasi, T.; Kapoor, S.; Sharma, A.; Kumar, A.P.; Ho, P.C. Ursolic acid inhibits multiple cell survival pathways leading to suppression of growth of prostate cancer xenograft in nude mice. J. Mol. Med. 2011, 89, 713–727. [Google Scholar] [CrossRef] [PubMed]
  13. Rajendran, P.; Li, F.; Manu, K.A.; Shanmugam, M.K.; Loo, S.Y.; Kumar, A.P.; Sethi, G. γ-Tocotrienol is a novel inhibitor of constitutive and inducible STAT3 signalling pathway in human hepatocellular carcinoma: Potential role as an antiproliferative, pro-apoptotic and chemosensitizing agent. Br. J. Pharmacol. 2011, 163, 283–298. [Google Scholar] [CrossRef] [PubMed] [Green Version]
  14. Baek, S.H.; Ko, J.-H.; Lee, H.; Jung, J.; Kong, M.; Lee, J.-w.; Lee, J.; Chinnathambi, A.; Zayed, M.; Alharbi, S.A. Resveratrol inhibits STAT3 signaling pathway through the induction of SOCS-1: Role in apoptosis induction and radiosensitization in head and neck tumor cells. Phytomedicine 2016, 23, 566–577. [Google Scholar] [CrossRef] [PubMed]
  15. Rajendran, P.; Nandakumar, N.; Rengarajan, T.; Palaniswami, R.; Gnanadhas, E.N.; Lakshminarasaiah, U.; Gopas, J.; Nishigaki, I. Antioxidants and human diseases. Clin. Chim. Acta 2014, 436, 332–347. [Google Scholar] [CrossRef]
  16. Hayes, J.D.; Dinkova-Kostova, A.T.; Tew, K.D. Oxidative stress in cancer. Cancer cell 2020, 38, 167–197. [Google Scholar] [CrossRef]
  17. Iyer, V.V.; Yang, H.; Ierapetritou, M.G.; Roth, C.M. Effects of glucose and insulin on HepG2-C3A cell metabolism. Biotechnol. Bioeng. 2010, 107, 347–356. [Google Scholar] [CrossRef]
  18. Takeno, A.; Kanazawa, I.; Notsu, M.; Tanaka, K.-i.; Sugimoto, T. Phloretin promotes adipogenesis via mitogen-activated protein kinase pathways in mouse marrow stromal ST2 cells. Int. J. Mol. Sci. 2018, 19, 1772. [Google Scholar] [CrossRef] [Green Version]
  19. Ismail, M.B.; Rajendran, P.; AbuZahra, H.M.; Veeraraghavan, V.P. Mangiferin Inhibits Apoptosis in Doxorubicin-Induced Vascular Endothelial Cells via the Nrf2 Signaling Pathway. Int. J. Mol. Sci. 2021, 22, 4259. [Google Scholar] [CrossRef]
  20. Adaramoye, O.; Erguen, B.; Oyebode, O.; Nitzsche, B.; Höpfner, M.; Jung, K.; Rabien, A. Antioxidant, antiangiogenic and antiproliferative activities of root methanol extract of Calliandra portoricensis in human prostate cancer cells. J. Integr. Med. 2015, 13, 185–193. [Google Scholar] [CrossRef]
  21. Cao, K.; Tait, S.W. Apoptosis and cancer: Force awakens, phantom menace, or both? Int. Rev. Cell Mol. Biol. 2018, 337, 135–152. [Google Scholar] [PubMed]
  22. Prabhu, K.S.; Bhat, A.A.; Siveen, K.S.; Kuttikrishnan, S.; Raza, S.S.; Raheed, T.; Jochebeth, A.; Khan, A.Q.; Chawdhery, M.Z.; Haris, M. Sanguinarine mediated apoptosis in Non-Small Cell Lung Cancer via generation of reactive oxygen species and suppression of JAK/STAT pathway. Biomed. Pharmacother. 2021, 144, 112358. [Google Scholar] [CrossRef] [PubMed]
  23. Hseu, Y.-C.; Chiang, Y.-C.; Vudhya Gowrisankar, Y.; Lin, K.-Y.; Huang, S.-T.; Shrestha, S.; Chang, G.-R.; Yang, H.-L. The in vitro and in vivo anticancer properties of chalcone flavokawain b through induction of ros-mediated apoptotic and autophagic cell death in human melanoma cells. Cancers 2020, 12, 2936. [Google Scholar] [CrossRef] [PubMed]
  24. Friedl, P.; Wolf, K. Tumour-cell invasion and migration: Diversity and escape mechanisms. Nat. Rev. Cancer 2003, 3, 362–374. [Google Scholar] [CrossRef]
  25. Rajendran, P.; Ben Ammar, R.; Al-Saeedi, F.J.; Elsayed Mohamed, M.; Islam, M.; Al-Ramadan, S.Y. Thidiazuron decreases epithelial-mesenchymal transition activity through the NF-kB and PI3K/AKT signalling pathways in breast cancer. J. Cell. Mol. Med. 2020, 24, 14525–14538. [Google Scholar] [CrossRef]
  26. Yang, H.-L.; Tsai, C.-H.; Shrestha, S.; Lee, C.-C.; Liao, J.-W.; Hseu, Y.-C. Coenzyme Q0, a novel quinone derivative of Antrodia camphorata, induces ROS-mediated cytotoxic autophagy and apoptosis against human glioblastoma cells in vitro and in vivo. Food Chem. Toxicol. 2021, 155, 112384. [Google Scholar] [CrossRef]
  27. Rajendran, P.; Ong, T.H.; Chen, L.; Li, F.; Shanmugam, M.K.; Vali, S.; Abbasi, T.; Kapoor, S.; Sharma, A.; Kumar, A.P. Suppression of signal transducer and activator of transcription 3 activation by butein inhibits growth of human hepatocellular carcinoma in vivo. Clin. Cancer Res. 2011, 17, 1425–1439. [Google Scholar] [CrossRef] [Green Version]
  28. Sikka, S.; Shanmugam, M.K.; Siveen, K.S.; Ong, T.H.; Yang, M.H.; Lee, J.H.; Rajendran, P.; Chinnathambi, A.; Alharbi, S.A.; Alahmadi, T.A. Diosgenin attenuates tumor growth and metastasis in transgenic prostate cancer mouse model by negatively regulating both NF-κB/STAT3 signaling cascades. Eur. J. Pharmacol. 2021, 906, 174274. [Google Scholar] [CrossRef]
  29. Rajendran, P.; Li, F.; Shanmugam, M.K.; Kannaiyan, R.; Goh, J.N.; Wong, K.F.; Wang, W.; Khin, E.; Tergaonkar, V.; Kumar, A.P. Celastrol suppresses growth and induces apoptosis of human hepatocellular carcinoma through the modulation of STAT3/JAK2 signaling cascade in vitro and in vivo. Cancer Prev. Res. 2012, 5, 631–643. [Google Scholar] [CrossRef] [Green Version]
  30. Sun, Q.; Lu, N.-N.; Feng, L. Apigetrin inhibits gastric cancer progression through inducing apoptosis and regulating ROS-modulated STAT3/JAK2 pathway. Biochem. Biophys. Res. Commun. 2018, 498, 164–170. [Google Scholar] [CrossRef]
  31. Yang, M.H.; Lee, J.H.; Ko, J.-H.; Jung, S.H.; Sethi, G.; Ahn, K.S. Brassinin represses invasive potential of lung carcinoma cells through deactivation of PI3K/Akt/mTOR signaling cascade. Molecules 2019, 24, 1584. [Google Scholar] [CrossRef] [PubMed] [Green Version]
  32. Warren, C.F.; Wong-Brown, M.W.; Bowden, N.A. BCL-2 family isoforms in apoptosis and cancer. Cell Death Dis. 2019, 10, 177. [Google Scholar] [CrossRef] [PubMed] [Green Version]
  33. Opferman, J.T.; Kothari, A. Anti-apoptotic BCL-2 family members in development. Cell Death Differ. 2018, 25, 37–45. [Google Scholar] [CrossRef] [PubMed]
  34. Adams, J.M.; Cory, S. The BCL-2 arbiters of apoptosis and their growing role as cancer targets. Cell Death Differ. 2018, 25, 27–36. [Google Scholar] [CrossRef] [Green Version]
  35. Yang, M.H.; Baek, S.H.; Ha, I.J.; Um, J.Y.; Ahn, K.S. Brassinin enhances the anticancer actions of paclitaxel by targeting multiple signaling pathways in colorectal cancer cells. Phytother. Res. 2021, 35, 3875–3885. [Google Scholar] [CrossRef]
  36. Zhang, Z.; Zhang, C.; Ding, Y.; Zhao, Q.; Yang, L.; Ling, J.; Liu, L.; Ji, H.; Zhang, Y. The activation of p38 and JNK by ROS, contribute to OLO-2-mediated intrinsic apoptosis in human hepatocellular carcinoma cells. Food Chem. Toxicol. 2014, 63, 38–47. [Google Scholar] [CrossRef]
  37. Tischlerova, V.; Kello, M.; Budovska, M.; Mojzis, J. Indole phytoalexin derivatives induce mitochondrial-mediated apoptosis in human colorectal carcinoma cells. World J. Gastroenterol. 2017, 23, 4341. [Google Scholar] [CrossRef]
  38. Mezencev, R.; Updegrove, T.; Kutschy, P.; Repovská, M.; McDonald, J.F. Camalexin induces apoptosis in T-leukemia Jurkat cells by increased concentration of reactive oxygen species and activation of caspase-8 and caspase-9. J. Nat. Med. 2011, 65, 488–499. [Google Scholar] [CrossRef]
  39. Halasi, M.; Wang, M.; Chavan, T.S.; Gaponenko, V.; Hay, N.; Gartel, A.L. ROS inhibitor N-acetyl-L-cysteine antagonizes the activity of proteasome inhibitors. Biochem. J. 2013, 454, 201–208. [Google Scholar] [CrossRef] [Green Version]
  40. Siveen, K.S.; Sikka, S.; Surana, R.; Dai, X.; Zhang, J.; Kumar, A.P.; Tan, B.K.; Sethi, G.; Bishayee, A. Targeting the STAT3 signaling pathway in cancer: Role of synthetic and natural inhibitors. Biochim. Biophys. Acta (BBA)-Rev. Cancer 2014, 1845, 136–154. [Google Scholar] [CrossRef] [Green Version]
  41. Wu, L.; Li, J.; Liu, T.; Li, S.; Feng, J.; Yu, Q.; Zhang, J.; Chen, J.; Zhou, Y.; Ji, J. Quercetin shows anti-tumor effect in hepatocellular carcinoma LM3 cells by abrogating JAK2/STAT3 signaling pathway. Cancer Med. 2019, 8, 4806–4820. [Google Scholar] [CrossRef] [PubMed]
  42. Bhutani, M.; Pathak, A.K.; Nair, A.S.; Kunnumakkara, A.B.; Guha, S.; Sethi, G.; Aggarwal, B.B. Capsaicin is a novel blocker of constitutive and interleukin-6–inducible STAT3 activation. Clin. Cancer Res. 2007, 13, 3024–3032. [Google Scholar] [CrossRef] [PubMed] [Green Version]
  43. Niu, G.; Wright, K.L.; Huang, M.; Song, L.; Haura, E.; Turkson, J.; Zhang, S.; Wang, T.; Sinibaldi, D.; Coppola, D. Constitutive Stat3 activity up-regulates VEGF expression and tumor angiogenesis. Oncogene 2002, 21, 2000–2008. [Google Scholar] [CrossRef] [PubMed] [Green Version]
  44. Seitz, S.J.; Schleithoff, E.S.; Koch, A.; Schuster, A.; Teufel, A.; Staib, F.; Stremmel, W.; Melino, G.; Krammer, P.H.; Schilling, T. Chemotherapy-induced apoptosis in hepatocellular carcinoma involves the p53 family and is mediated via the extrinsic and the intrinsic pathway. Int. J. Cancer 2010, 126, 2049–2066. [Google Scholar] [PubMed]
Figure 1. Caspase activation was mediated by BSN. The effect of BSN-mediated caspase cascade activation on HepG2 and C3A cells was investigated by Western blotting. (A,B) HepG2 and C3A cells treated with BSN (0–200 µmol) for 48 h, and cell lysates were used for SDS-PAGE and Western blotting to analyze caspase9, caspase3, cleaved caspase-3, and cleaved PARP. β-actin was used as an internal control. The effect of Z-VAD-FMK on BSN induced apoptosis. The pre-treatment of cells was conducted with 20 μM caspase inhibitor (Z-VAD-FMK) for 1 h followed by BSN for 48 h. (C) HepG2 cells and (D) C3A cells, caspase-3, cleaved caspase-3, and PARP were determined by Western blotting. Tukey’s post hoc test was used in this study to analyze the data. p < 0.05 was considered significant. Graph Pad prism was used. Experiments were conducted in triplicate. Data are presented as the mean  ±  SD. * p < 0.05 vs. control.
Applsci 12 04733 g001
Figure 2. DNA fragmentation from BSN inhibited migration, invasion, and colony formation. (A) For 24 h, the indicated concentrations of BSN were applied to C3A and HepG2 cells. Migration assays were used to test the wound-healing ability of HepG2 and C3A cells (Original magnification, ×100). (B) The invasiveness in each sample was determined by counting three microscopic fields. Cell invasion inhibitory percentage was calculated and expressed as 100% for untreated cells (control). (C) BSN interfered with colony formation (HepG2 and C3A cells). In the presence of BSN (0–200 µmol), the cells were incubated for five days to observe if they would proliferate or form colonies. Calculated by defining the number of colonies in absence of BSN as 100%. DNA fragmentation in hepatic cancer cells was caused by BSN (D,E). DNA fragmentation was measured in HepG2 and C3A cells (1 × 10⁶) after treatment with the indicated concentrations of BSN for 48 h. The columns are DNA fragmentation. (F) γ-H2A activation of control and experimental groups. Tukey’s post hoc test was used in this study to analyze the data. p < 0.05 was considered significant. Graph Pad prism was used. Experiments were conducted in triplicate. Data are presented as the mean  ±  SD. Furthermore, * p < 0.05 vs. control.
Applsci 12 04733 g002
Figure 3. In hepatic carcinoma cells, BSN induced apoptosis through ROS. (A) The ROS levels in Hepg2 and C3A cells were measured after pre-treatment with NAC (N-acetylcysteine) (1 mM) for 1 h and then treated with BSN (0–200 µmol for 2 h). (B) NAC (1 mM) for 1 h, followed by BSN (0 and 200 µmol) for 4 h, and then STAT3, Bcl-2, caspase-3, and PARP activation for 48 h. The p-STAT3, Bcl-2, caspase-3, and PARP expressions were monitored by Western blotting. Tukey’s post hoc test was used in this study to analyze the data. p < 0.05 was considered significant. Graph Pad prism was used. Experiments were conducted in triplicate. Data are presented as the mean  ±  SD. Furthermore, * p < 0.05 vs. control. # p < 0.05 vs. BSN treatment.
Applsci 12 04733 g003
Figure 4. BSN induced apoptosis by downregulating STAT3 signaling pathways in hepatic carcinoma cells. (A) We treated HepG2 and C3A cells with 0–200 μmol BSN for 4 h. Prepared whole-cell extracts and used anti-p-STAT3 antibody to perform Western blotting. The results were from three independent experiments. (B,C) Silencing STAT3 aborted BSN-mediated apoptosis. A specific SAT3 siRNA or control siRNA were transfected into cells. The cells were transfected and incubated with or without BSN (200 µmol) for 48 h. Western blotting was used to measure STAT3 transcriptional targets such as Bcl-2 and cleaved caspase-3. Experiments were conducted in triplicate. Tukey’s post hoc test was used in this study to analyze the data. p < 0.05 was considered significant. Graph Pad prism was used. Data are presented as the mean  ±  SD. Furthermore, * p < 0.05 vs. control.
Applsci 12 04733 g004
Figure 5. BSN suppressed p-JAK1, p-JAK2, and p-Src levels. (A,B) We treated hepG2 and C3A cells (2 × 10⁶/mL) with 0–200 µmol BSN and then prepared whole-cell extracts and resolved 40 g aliquots on 10% SDS-PAGE. The same blots were stripped and reprobed with JAK1, JAK2, and Src antibodies for equal protein loading. Experiments were conducted in triplicate. Tukey’s post hoc test was used in this study to analyze the data. p < 0.05 was considered significant. Graph Pad prism was used. Data are presented as the mean  ±  SD.
Applsci 12 04733 g005
Figure 6. BSN induced apoptosis in hepatic carcinoma cells. (A,B), TUNEL staining for in situ apoptosis detection in HepG2 and C3A cells. Apoptotic-positive cells from three samples were averaged. Scale bar = 50 μm. (C,D) BSN was added to HepG2 and C3A cells (2 × 10⁶/mL) for 48 h, and the indicated dose intervals; after that, whole-cell extracts were prepared, and 40 µg of those extracts were separated on a 10–12% SDS-PAGE, Slicing membranes according to molecular mass and probing antibodies against Bcl-2, Bcl-xL, surviving, and VEGF. Experiments were conducted in triplicate. Tukey’s post hoc test was used in this study to analyze the data. p < 0.05 was considered significant. Graph Pad prism was used. Data are presented as the mean  ±  SD.
Applsci 12 04733 g006
Publisher’s Note: MDPI stays neutral with regard to jurisdictional claims in published maps and institutional affiliations.

