Article

Multiple Stationary Human Targets Detection in Through-Wall UWB Radar Based on Convolutional Neural Network

1
Aerospace Information Research Institute, Chinese Academy of Sciences, Beijing 100190, China
2
Key Laboratory of Electromagnetic Radiation and Sensing Technology, Chinese Academy of Sciences, Beijing 100190, China
3
School of Electronic, Electrical and Communication Engineering, University of Chinese Academy of Sciences, Beijing 100190, China
*
Author to whom correspondence should be addressed.
Appl. Sci. 2022, 12(9), 4720; https://doi.org/10.3390/app12094720
Submission received: 6 March 2022 / Revised: 13 April 2022 / Accepted: 5 May 2022 / Published: 7 May 2022
(This article belongs to the Section Electrical, Electronics and Communications Engineering)

Abstract

:
Ultra-wideband (UWB) impulse radar is widely used for through-wall human detection due to its high-range resolution and high penetration capability. UWB impulse radar can detect human targets in non-line-of-sight (NLOS) conditions, mainly based on the chest motion caused by human respiration. The automatic detection and extraction of multiple stationary human targets is still a challenge. Missed alarms often exist if the detection method is based on the energy of the human target. This is mainly because factors such as the range of the target, the intensity of the respiratory movement, and the shadow effect will make a difference between the energy scattered by targets. Weak targets are easily masked by strong targets and thus cannot be detected. Therefore, in this paper, a multiple stationary human targets detection method based on convolutional neural network (CNN) in through-wall UWB impulse radar is proposed. After performing the signal-to-clutter-and-noise ratio (SCNR) enhancement method on the raw radar data, the range-slow-time matrix is fed into a six-layer CNN. Benefiting from the powerful feature extraction capability of CNN, the target point of interest (TPOI) can be extracted from the data matrix. The clustering algorithm is used to simplify the TPOIs to achieve accurate detection of multiple targets behind the wall. The effectiveness of the proposed method is verified by the experimental data.

Graphical Abstract

1. Introduction

Ultra-wideband (UWB) radar refers to a radar system in which the bandwidth of the transmitted signal is 25% greater than the central frequency. Compared to other sensors (such as acoustic and infrared sensors), UWB radar protects the privacy and can work normally in darkness. UWB radar is widely used in ground-penetrating radar (GPR), through-wall imaging, post-earthquake rescue, and so on, due to its high range resolution and high penetration capability [1,2,3,4,5,6,7]. The frequently benefitted waveforms in UWB radar literature are short impulses [8,9,10,11], pseudo-random coded signals [12,13,14,15], frequency-modulated continuous wave (FMCW) signals [16,17,18,19,20], and stepped-frequency continuous wave (SFCW) signals [21,22,23,24]. UWB impulse radar has been increasingly adopted by researchers for human target detection due to its simple structure, low-cost, and low power consumption [25,26,27].
Considering the stationary human targets detection, periodic motions generated by human respiration or heartbeat can be utilized. However, in practical applications, the energy scattered by the heart is too weak to be detected due to the propagation attenuation of the body. For electromagnetic waves with a frequency of 300–900 MHz, the electromagnetic energy scattered by dry skin is approximately 72% of the incident energy [28]. UWB impulse radar can detect human targets mainly based on the chest motion caused by human respiration. Over the past two decades, many scholars have conducted research on the detection of human targets behind obstacles or walls. Venkatesh et al. [29] proposed a general respiratory response model by considering the human target as a moving scatterer whose range varies periodically. Based on this model, the methods such as mean subtraction (MS) [29], range profile subtraction (RPS) [30], and linear-trend subtraction (LTS) [31] have been proposed to suppress the stationary background signal. The respiration detection algorithm was complemented with singular value decomposition (SVD) by Nezirovic et al. [31]. On the one hand, the respiration signal can be largely separated from the non-stationary clutter, and on the other hand, the effect of the additive white Gaussian noise (AWGN) can be reduced. Higher order cumulant were used to suppress AWGN based on that higher order cumulant of any Gaussian noise is zero [32]. Zhang et al. [33] proposed a correlation-based method to enhance the weak respiration signal based on the relativity and periodicity of the signals.
However, the above studies are all focused on the detection of weak respiration signal by developing algorithms to suppress background, noise, or enhance respiration signal. The automatic identification and detection of respiration signal is rarely studied by scholars. Hao et al. [34] proposed a method based on the 1D range profile to automatically identify respiration response. They regard the energy peak as the detection unit and then utilize the correlation to distinguish the respiration signal from the clutter signal. Xu et al. [35] proposed a method based on the 2D range-frequency matrix to automatically detect the human target. They design the constant false alarm ratio (CFAR) energy windows based on the characteristic of life sign. Acar et al. [36] proposed a range-dependent thresholding which decreases exponentially and hard thresholding is applied to the range profile. However, these three methods are energy-based automatic detection methods, and there will be missed alarms in the case of multiple human targets. First, the energy scattered by the farther target is much lower than the energy scattered by the nearer target, resulting in the farther target being missed. Second, the frequency and intensity of the target’s respiratory motion will also affect the intensity of the electromagnetic wave energy scattered by the target. Finally, in the case of multiple human targets, there is a shadow effect. Due to the reflection and absorption of electromagnetic waves by the target, there will be a high energy attenuation area behind the target. When other targets exist in this shadow area, they will be difficult to be detected.
Recently, deep learning technology has gained huge advances in the remote sensing community due to its powerful feature extraction capabilities [37,38,39,40,41]. Convolutional neural network (CNN) is originally designed to deal with the image-format datasets, which can also be adjusted to handle radar signals. CNN can extract hidden features from input signals, which replaces handcrafted features. A Doppler-Radar-based hand gesture recognition system using CNN was proposed in [42]. A residual neural network was used in [43] to identify the moving target number in through-wall radar. In this paper, a multiple stationary human targets detection method based on CNN in through-wall UWB radar is proposed. First, we pre-process the raw data collected by the developed UWB impulse radar prototype to achieve the suppression of background and noise signals and the enhancement of weak respiration signal. Then, a six-layer CNN is designed to extract the target point of interest (TPOI) from the range-slow-time matrix. Finally, the clustering algorithm is used to simplify the TPOIs to achieve the accurate detection of multiple targets behind the wall. To the best of our knowledge, this is the first work to automatically identify and extract multiple stationary human targets behind the wall using CNN. The effectiveness of the proposed method is verified by the experimental data.
This paper is organized as follows. In Section 2, the UWB time domain respiration signal model is demonstrated. Section 3 details the proposed multiple stationary human targets detection method based on CNN. Section 4 describes the UWB impulse radar system developed and explains the conducted experiments settings. Section 5 presents the analyses and discussions of the experimental results. Finally, Section 6 concludes this paper.

2. Signal Model

The UWB impulse radar can detect human targets mainly based on the chest motion caused by human respiration. The Gaussian pulse emitted by the UWB impulse radar can be formulated as follows [44]:
x ( t ) = 1 2 π σ t e ( t 2 2 σ t 2 ) ,
where t represents fast-time, and σ t is related to the pulse width. Slow-time is discrete with n T , n = 0 , 1 , , N 1 is the slow-time sampling point. T s is the pulse repetition time, which is also the slow-time sampling interval. Thus, the sequential transmitted signal is:
s ( t ) = n = 0 N 1 x ( t n T ) .
Consider a simple situation, and assume that there are P human targets and one stationary target in the detection area. The received signal can be expressed as:
R ( t ) = n = 0 N 1 p = 0 P 1 x ( t n T t p ) h p ( t ) + n = 0 N 1 x ( t n T t s ) h s ( t ) + r ( t ) + w ( t ) ,
where h p ( t ) denotes the respiration response of the pth human target with propagation time t p . h s ( t ) is the impulse response of the static target with propagation time t s . r ( t ) represents non-static inferences in the same frequency range as respiration, and w ( t ) represents additive Gaussian white noise (AWGN). t p is caused by the respiratory motion of the human chest, which varies approximately as harmonic vibration [45]. t p can be expressed as:
t p = t p 0 + t p d sin ( 2 π f p n T ) ,
where t p 0 is the propagation time delay of chest vibration center in fast time, t p d is the magnitude of the chest respiratory motion, and f p is respiratory frequency.
We denote the fast-time sampling interval by δ T , then R ( t ) can be expressed in discrete form as:
R [ m , n ] = h [ m , n ] + s [ m , n ] + r [ m , n ] + w [ m , n ] ,
where m = 0 , 1 , , M 1 is the fast-time sampling point. h [ m , n ] is the discrete form of the human respiration signal, s [ m , n ] is the discrete form of the static clutter, r [ m , n ] is the discrete form of non-static inferences, and w [ m , n ] is the discrete form of AWGN.

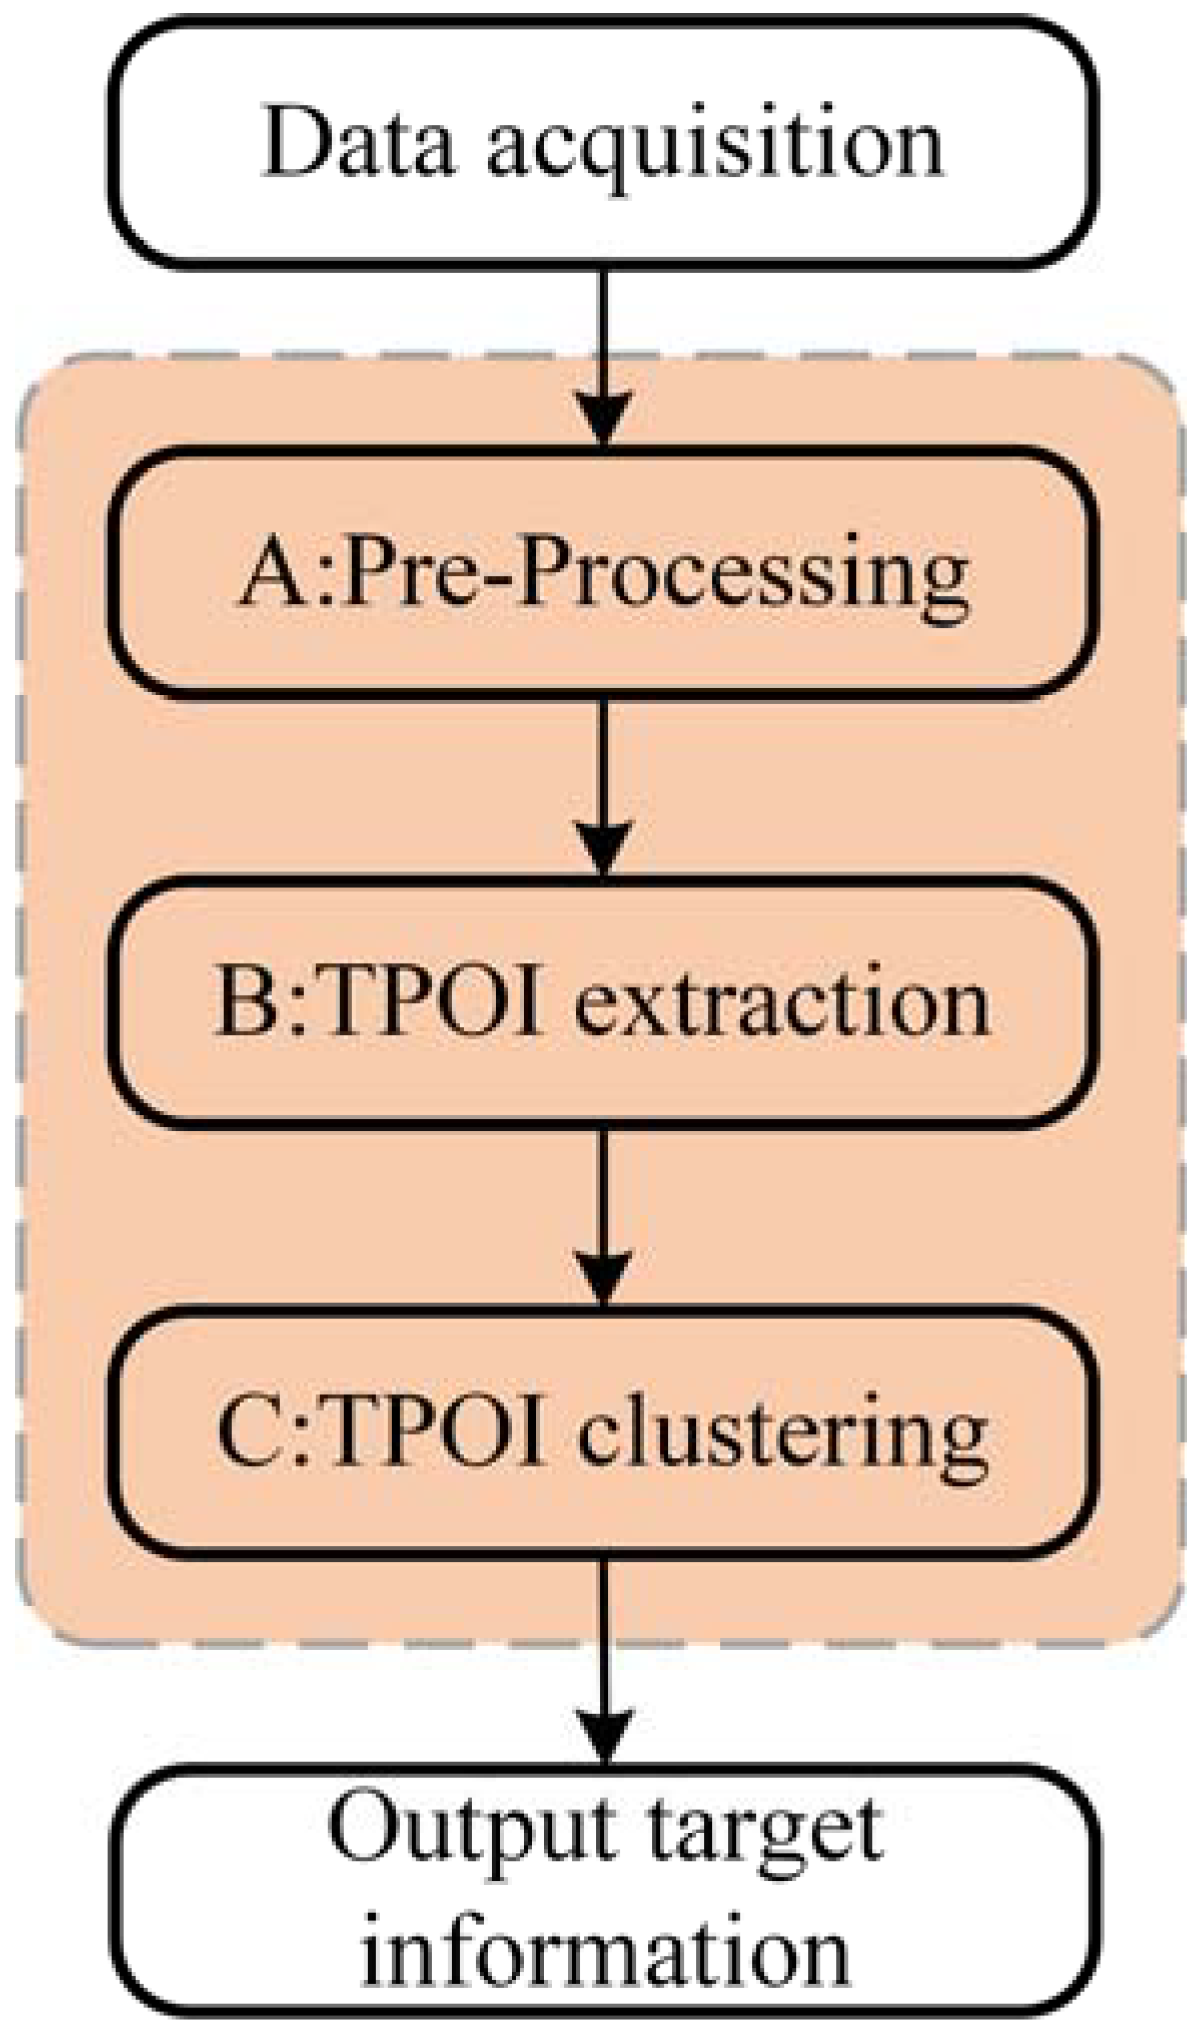
3. Proposed Multiple Stationary Human Targets Detection Method

The flowchart of the proposed method is given in Figure 1. The proposed method consists of three main steps: (A) pre-processing method, (B) TPOI extraction, and (C) TPOI clustering. First, in step A, we pre-process the raw radar data to achieve signal-to-clutter-and-noise ratio (SCNR) enhancement, including suppressing background and noise signals, and enhancing weak target signal. Then, in step B, we use the powerful feature extraction capability of convolutional neural network to automatically extract the TPOI. Finally, in step C, the information of targets such as their number and range is estimated by the clustering algorithm.

3.1. Step A: Pre-Processing

3.1.1. Adaptive Background Subtraction

The strong time-invariant background usually covers the respiration signal of interest, so the background needs to be removed from the received data. The simplest method is to calculate an average impulse response from all measured impulse responses. However, this method can only be processed after the measurement is completed and cannot be operated in real time.
Based on the above analysis, we choose the adaptive background subtraction (ABS) method based on the exponential averaging, which replaces a scalar weighting factor α with a vector of weighting coefficient λ [46]:
p n [ m ] = λ n [ m ] × p n 1 [ m ] + ( 1 λ n [ m ] ) × q n [ m ] ,
where p n [ m ] and q n [ m ] are one-dimensional vectors with the size [M × 1] and contain ‘sampled background estimate’ and ‘measured impulse response’, respectively. Thus, the new background estimate takes a fraction of the previous estimate and a fraction from the measured impulse response. The weighting coefficient has the size [M × 1] and is determined by two thresholds related to motions, and motions are automatically divided into micro- and macro-motions.

3.1.2. Filtering in Fast-Time Dimension

In order to further improve SCNR, a bandpass filter with the same bandwidth as the transmitted signal is added and performed along the fast-time dimension to filter out substantial high-frequency noise introduced by oversampling.

3.1.3. Advance Normalization

Because the distance between the target and the radar antenna is generally very long, the energy scattered by the target is weak. In addition, the low reflectivity of the human body and the high signal attenuation of obstacles make the energy of the respiration signal recorded by the radar weak.
The advance normalization (AN) method is used to enhance the weak respiration signal [47]. The basic idea of the method is to search the maximum in the interval ( t L max , t e n d ] serially and normalize the current signal in the interval ( t L max , t N max ] , where t L max represents the fast-time of the maximum value found last time, t N max is the fast-time of the maximum value found this time, and t e n d is the last fast-time of the measured impulse response.

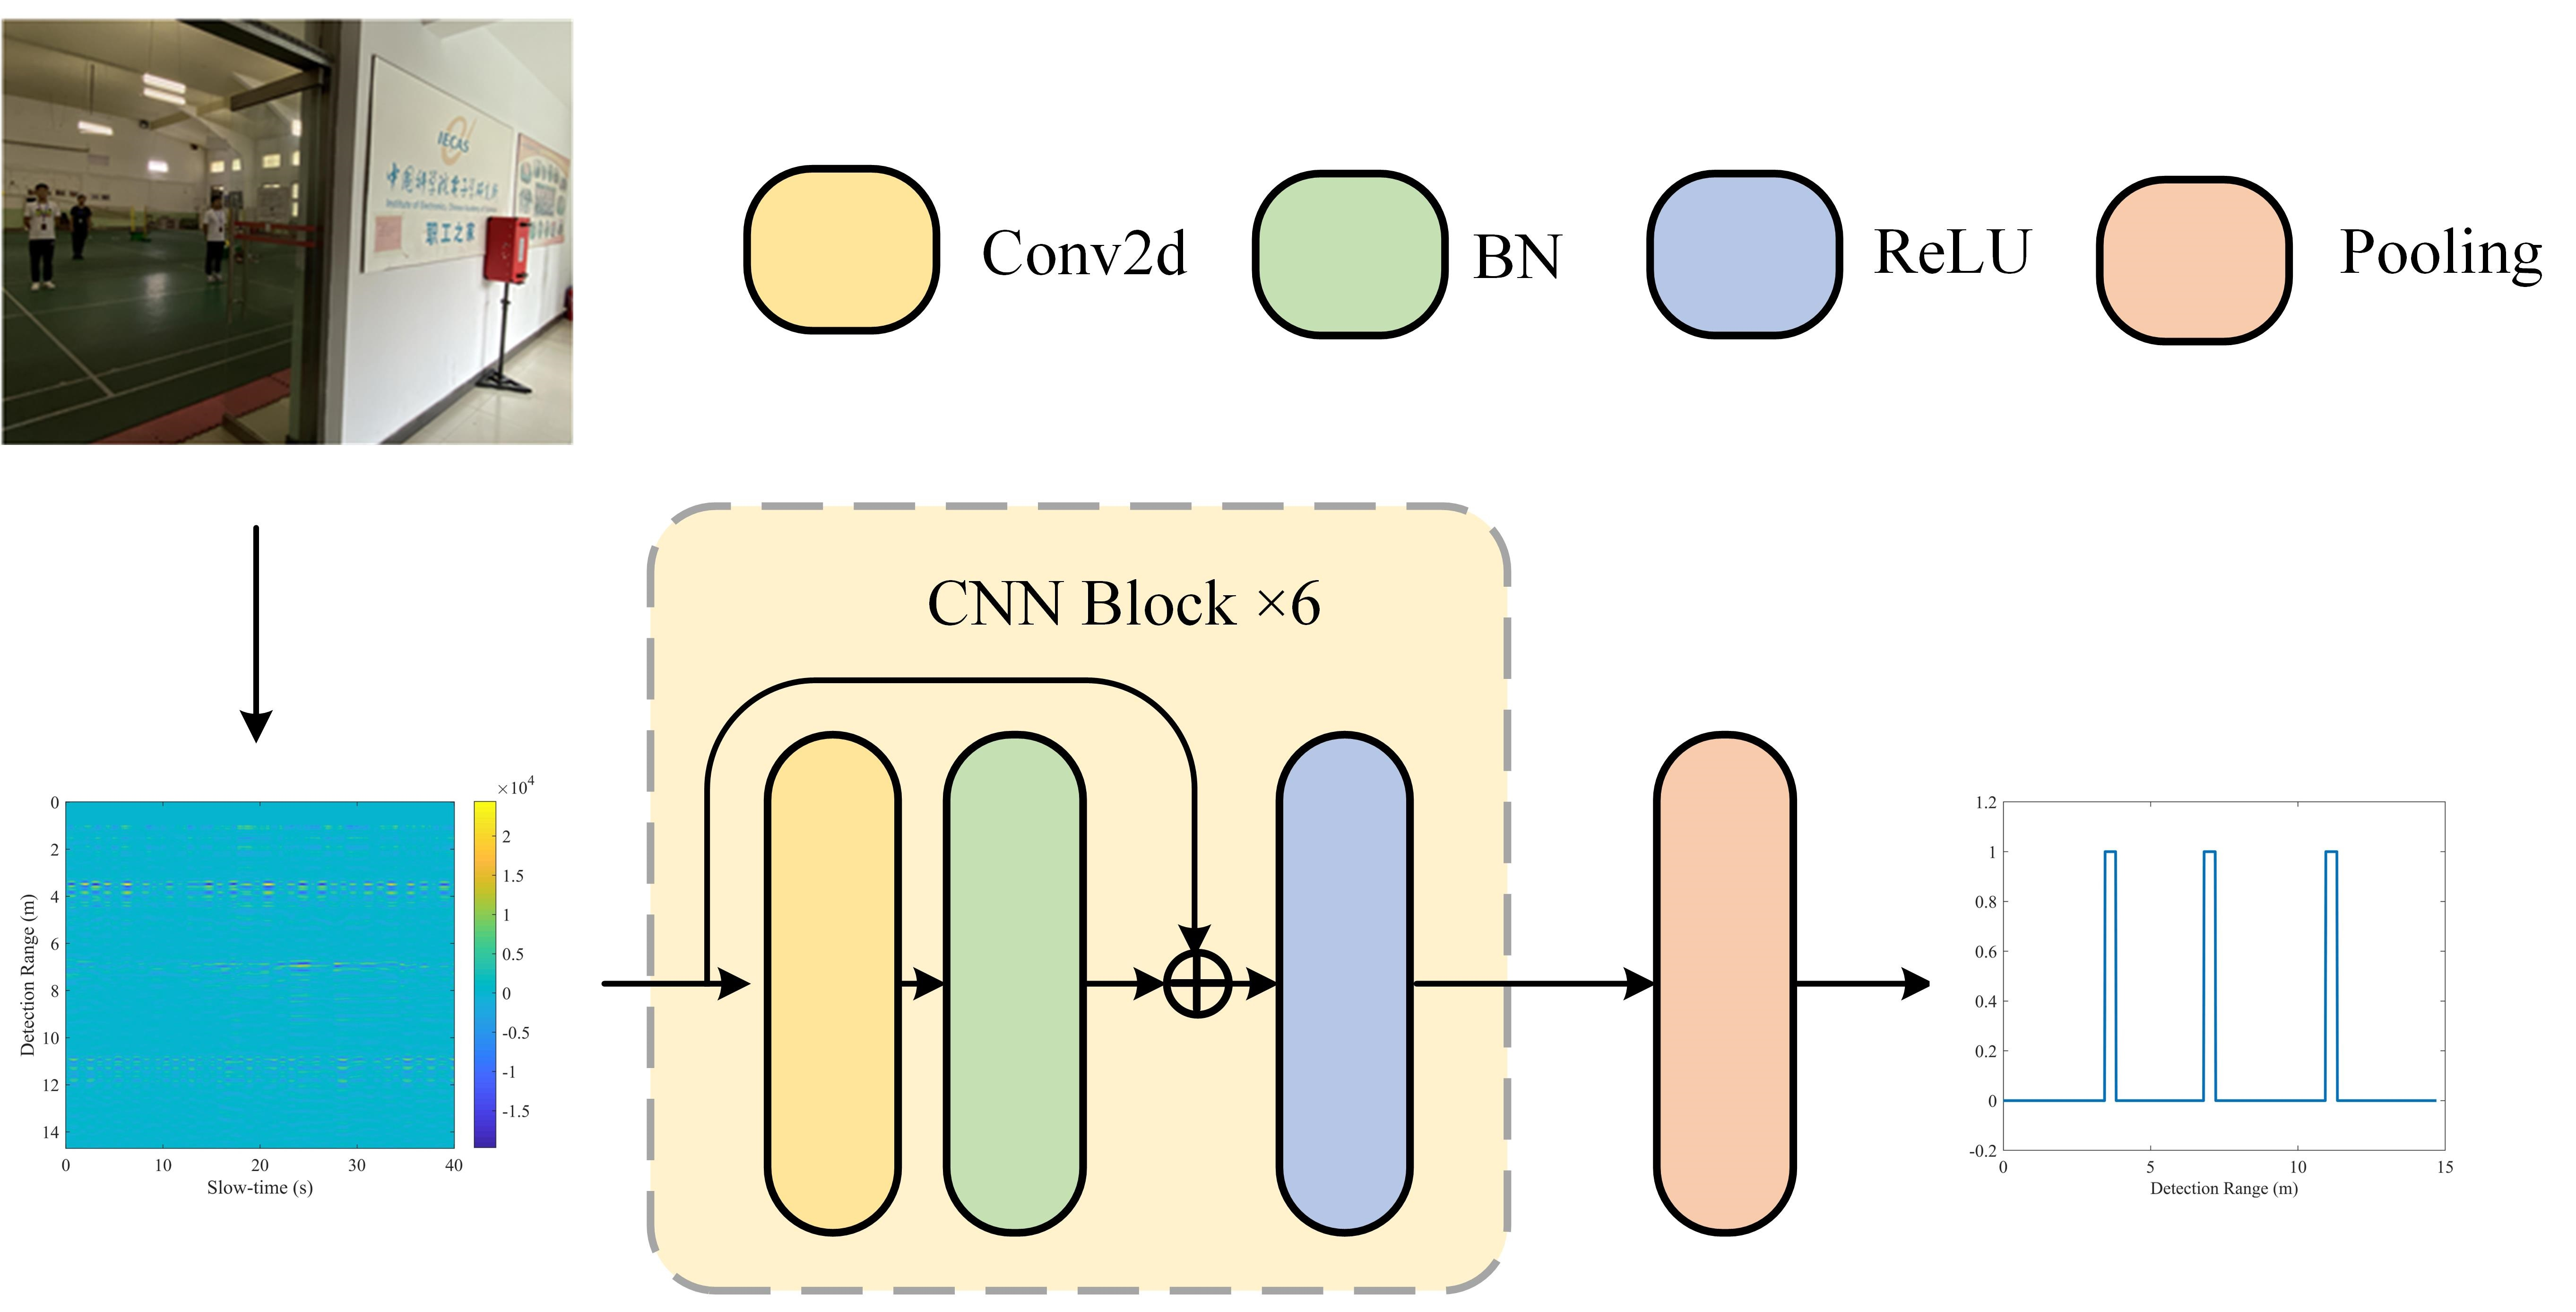
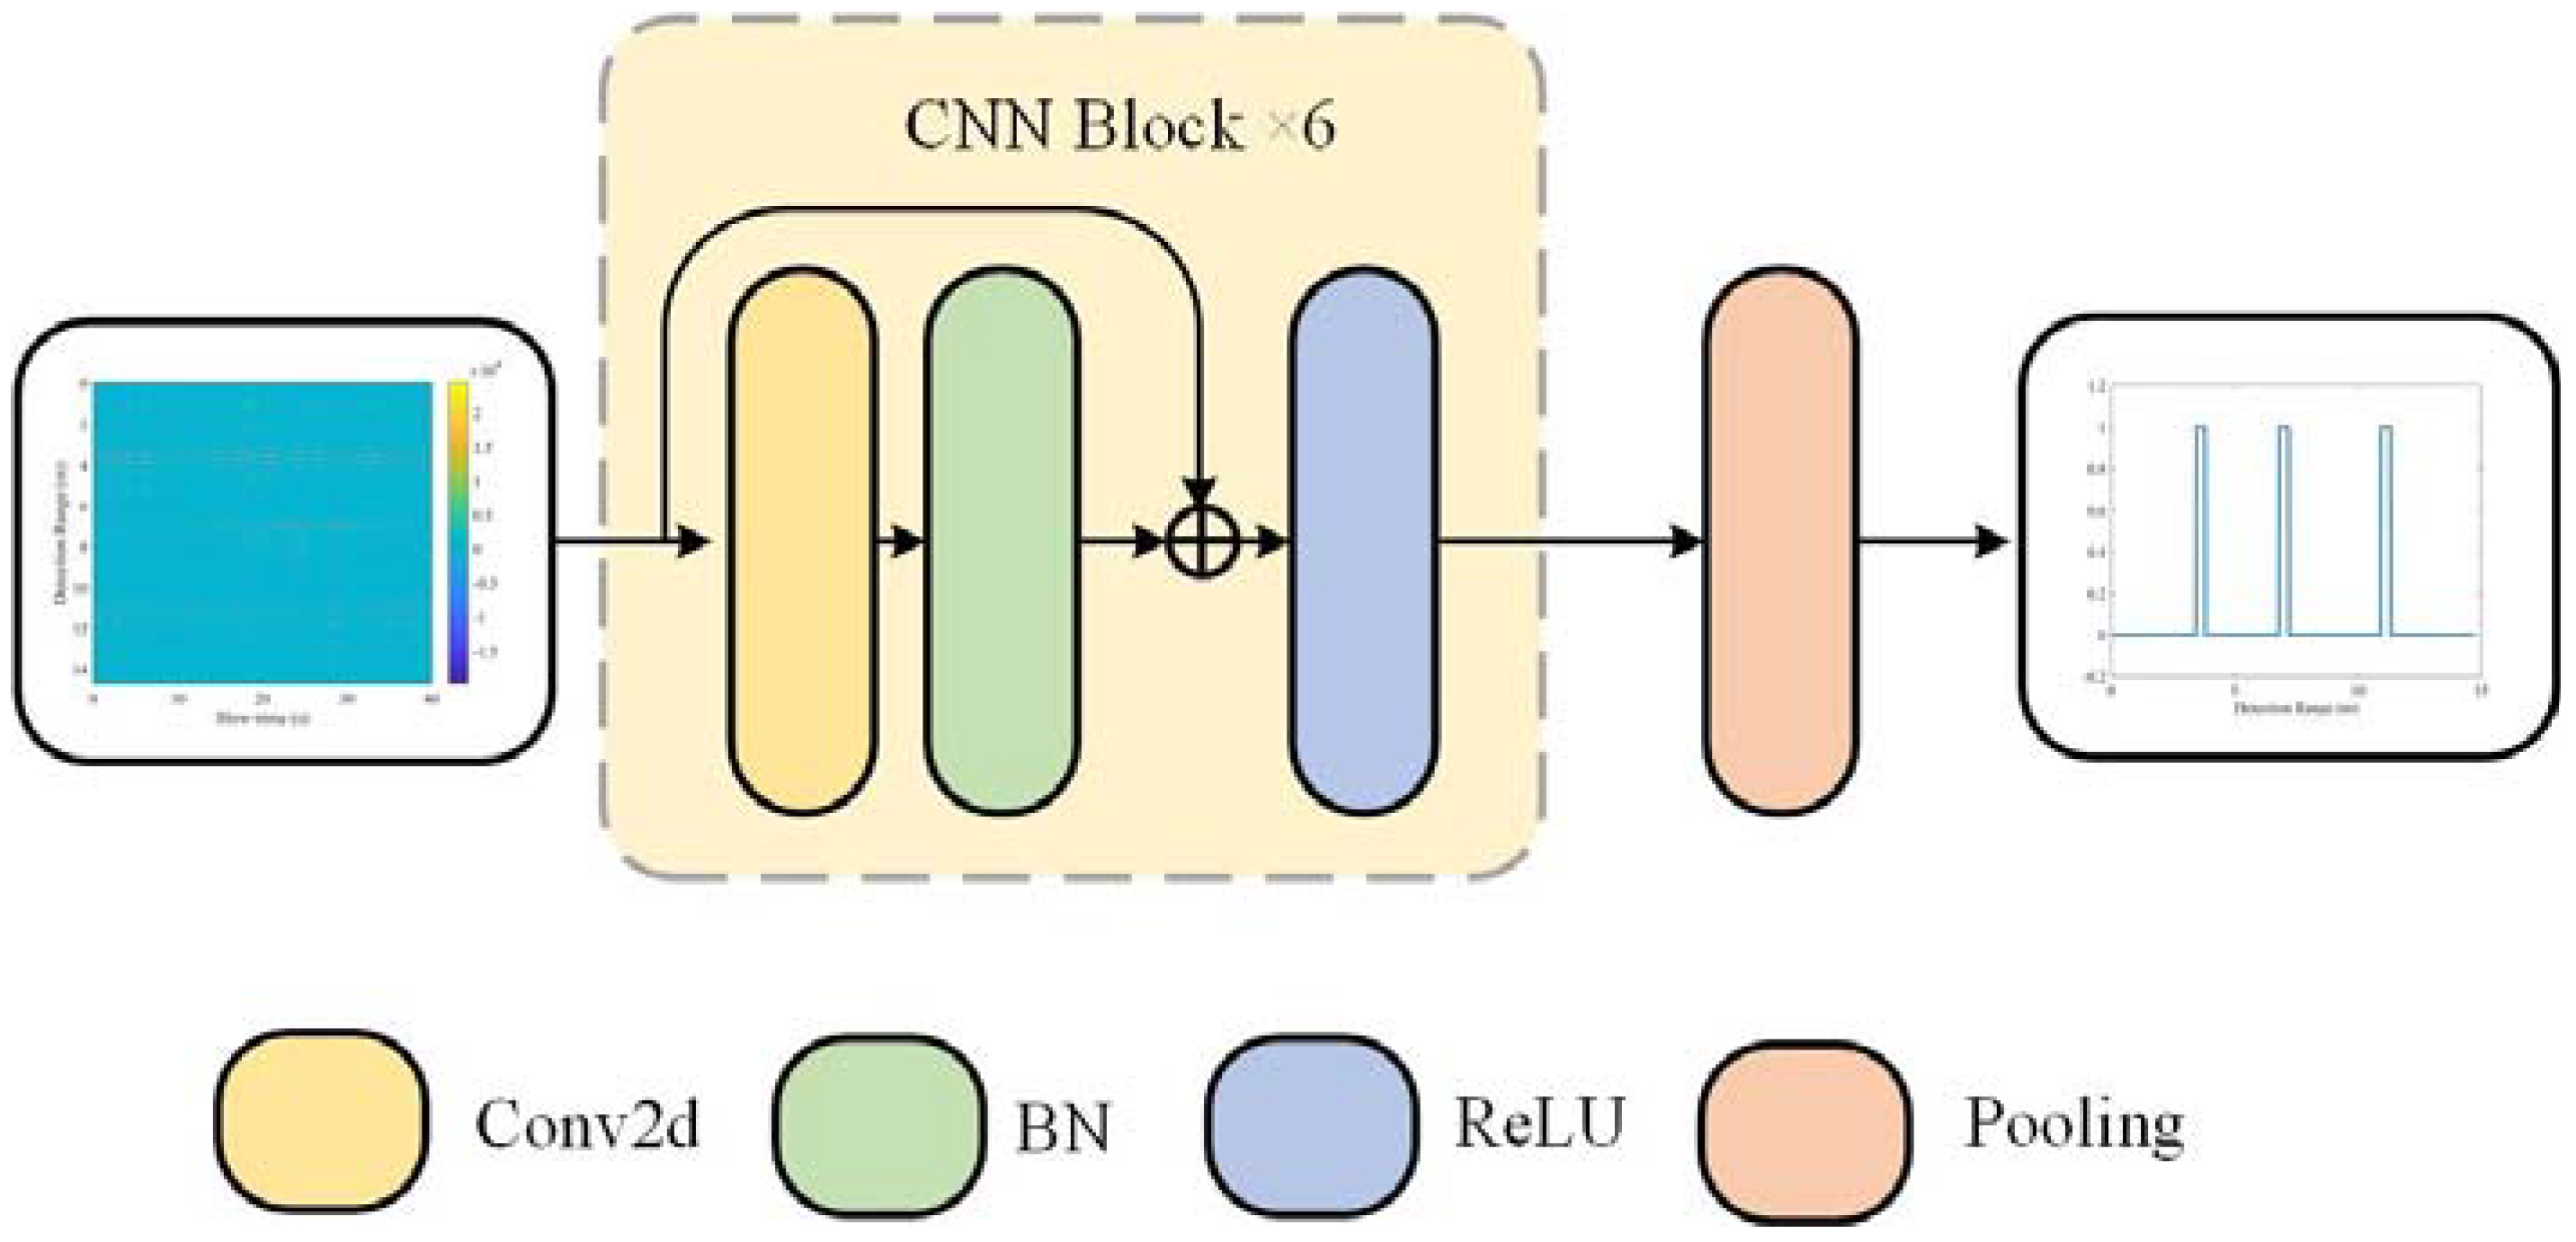
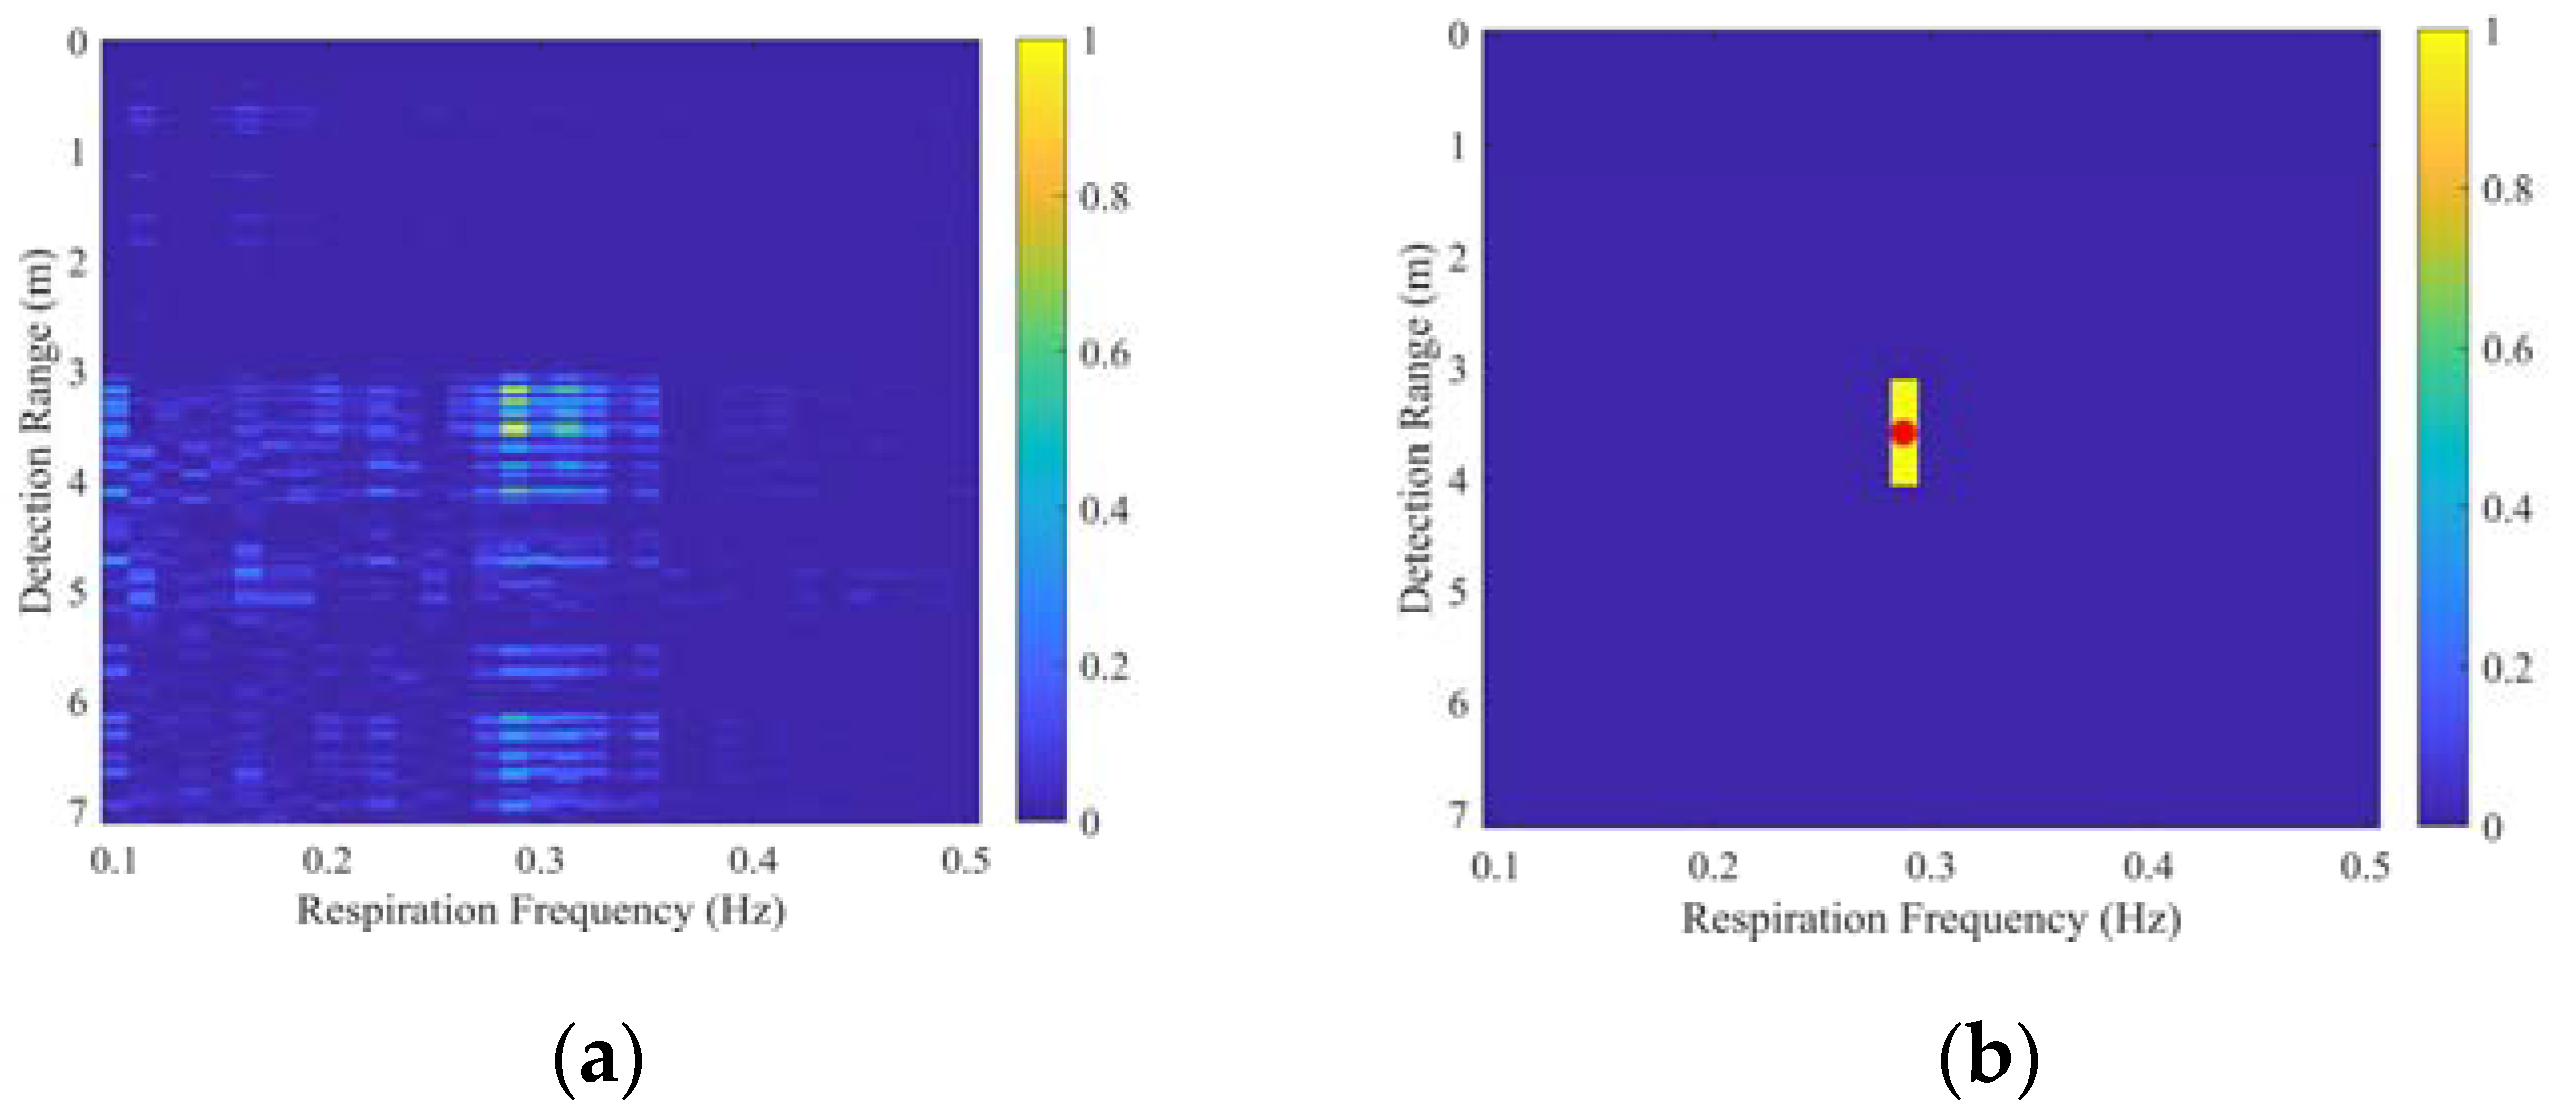
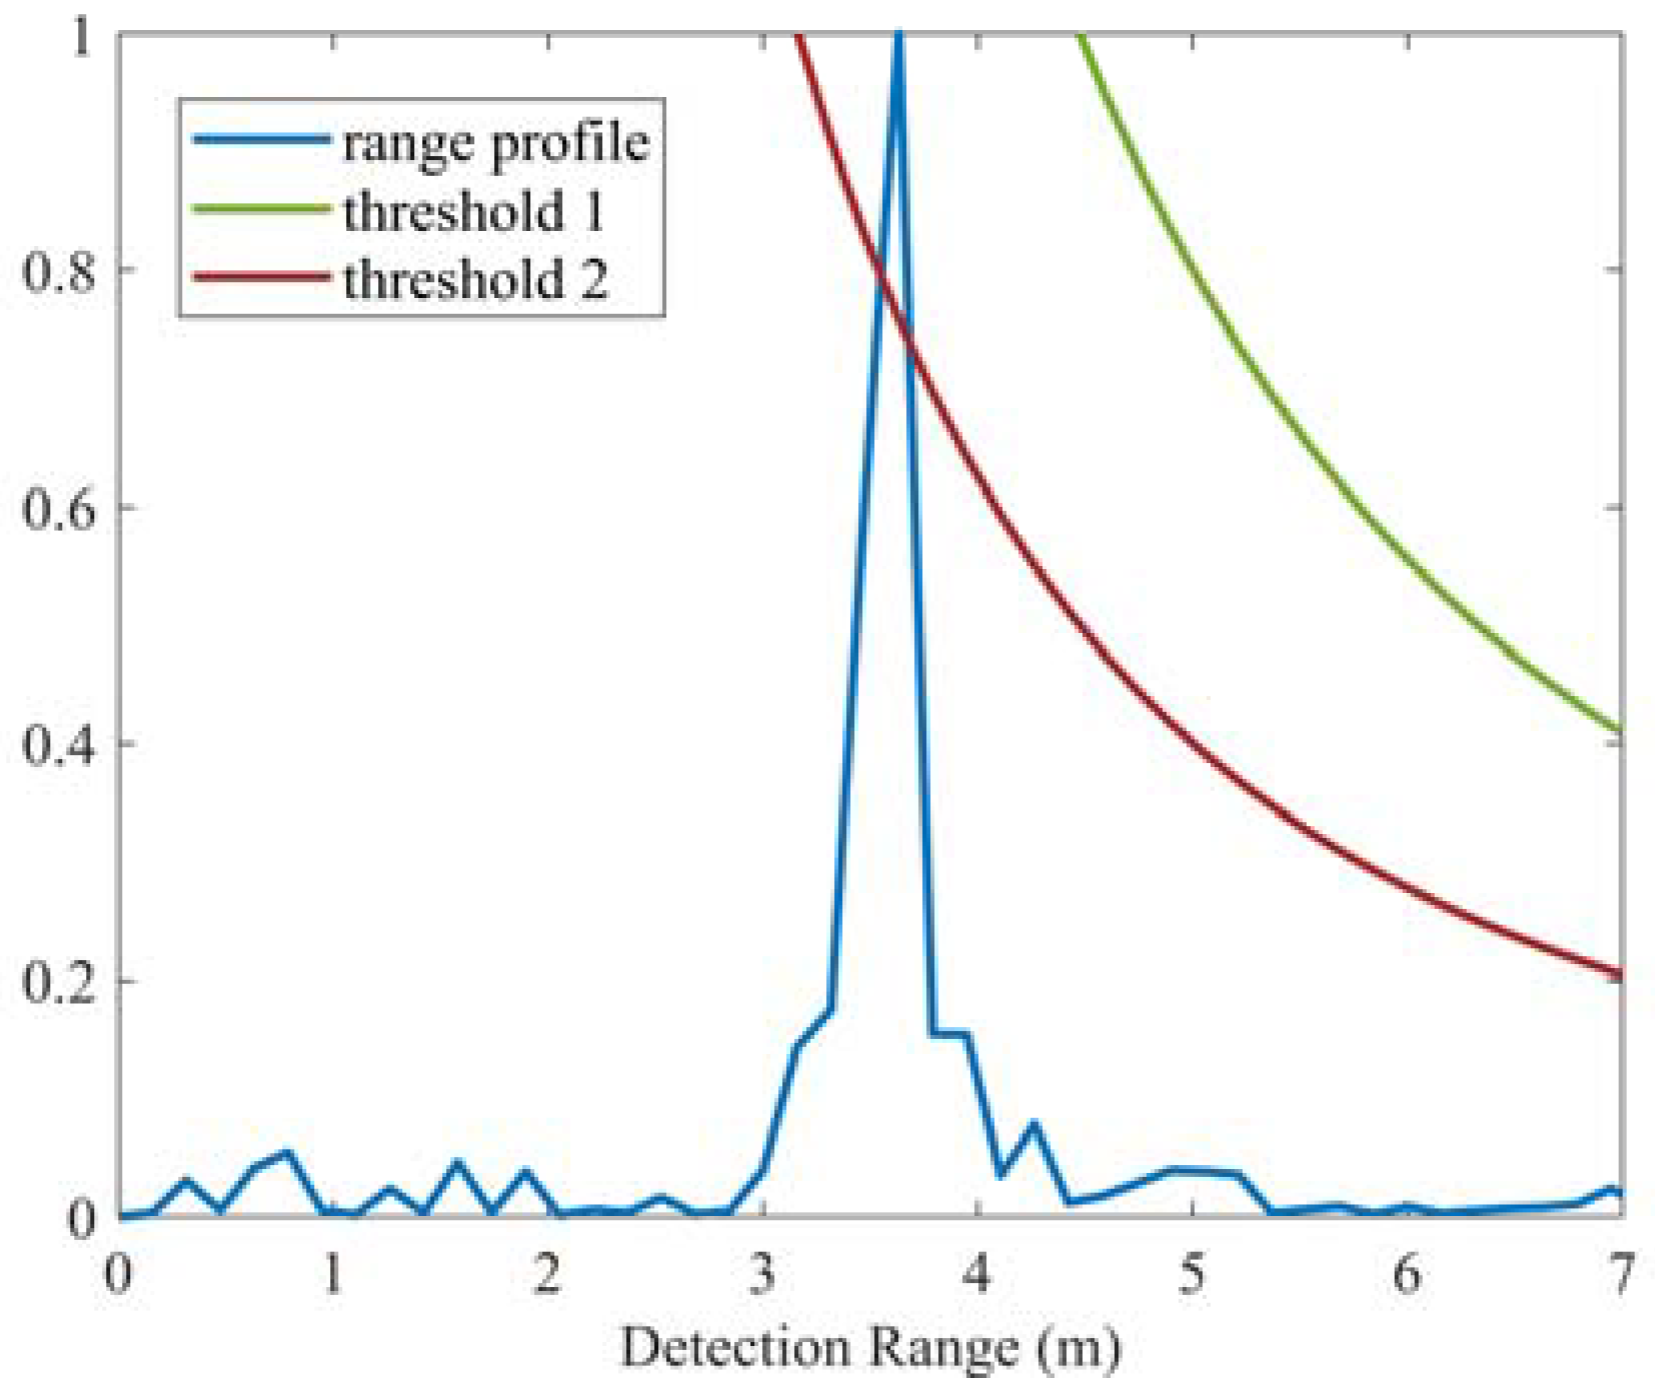
3.2. Step B: TPOI Extraction

Convolutional neural network is a classic method in deep learning. It is inquired from the idea that neuron connection from the animal’s brain. CNN have been shown to produce state-of-the art results in areas such as speech recognition [48], visual object detection [49], and image classification [50]. The proposed convolutional neural network architecture for TPOI extraction is shown in Figure 2. The range-slow-time matrix obtained after the pre-processing step is used as the input of the model. The size of the matrix is 800 × 600, that is, it contains 600 impulse responses, and each impulse response contains 800 sampling points. The goal of this model is to extract the TPOIs in the range dimension from the data matrix, using the characteristic difference between the respiration signal and other signals in the slow-time dimension.
The CNN architecture has a stack of six blocks. Each block is composed of three layers: a convolutional layer, a batch normalization (BN) layer, and a rectified linear unit (ReLU) layer. For a 2D convolutional (Conv2d) layer, let Z i be the ith 2D input, and K j be the jth filter kernel of size σ k × σ k . The jth output feature map Y j is the sum of convolutions of the 2D inputs Z i with the filter kernel K j , then added with a trainable bias b. Mathematically, the output feature map can be computed as:
Y j = i K j Z i + b ,
where is the 2D convolution operation.
The distribution of each layer’s inputs changes during training, as the parameters of the previous layers change [51]. We introduce a BN layer to perform the normalization for each training mini-batch, which allows us to set a higher learning rate and be less careful about parameter initialization. To make the gradient backpropagate further in the deeper network, a shortcut is introduced after the BN layer. The activation function can introduce non-linearity and enhance the feature learning ability of the network. We adopt ReLU as our activation function, which is mathematically expressed as [52]:
f ReLU ( x ) = max ( 0 , x ) .
The CNN architecture ends with a max-pooling operation. The output of CNN is an 800-sized vector, where a value of 1 means this range bin has a TPOI and 0 means no TPOI. The detailed overall CNN architecture parameters are shown in Table 1.

3.3. Step C: TPOI Clustering

If there is no TPOI in the output of step B, we decide that there is no human target in the detection area. If there are TPOIs in the output of step B, the clustering algorithm is performed to obtain the number and range information of human targets.
The K-mean clustering [53] is used in our proposed method. Assume that the output result of step B contains N T targets with N s TPOIs ( s 1 , s 2 , , s N s ) , where s i r is the range location index of the ith TPOI s i . First, randomly set N T centroids ( T 1 , T 2 , , T N T ) , where T j r is the range location index of the jth centroid T j . Then, the centroid which is nearest to each TPOI is searched using the Euclidean distance as:
D i j = s i r T j r 2 .
The centroid is updated using its near TPOIs:
T j r = 1 m j i O j s i r ,
where O j is the set of m j TPOI indices which is near to the jth centroid. Finally, an iterative procedure is used to update the centroids of TPOIs. The sum of the square error between centroids and their corresponding TPOIs is:
J = j = 1 N T i O j ( s i r T j r ) 2 .
The centroids are continuously updated using Equation (10), and the iteration is stopped when the value of J reaches a minimum. The range information of human targets can be obtained by the final range indices of the centroids.

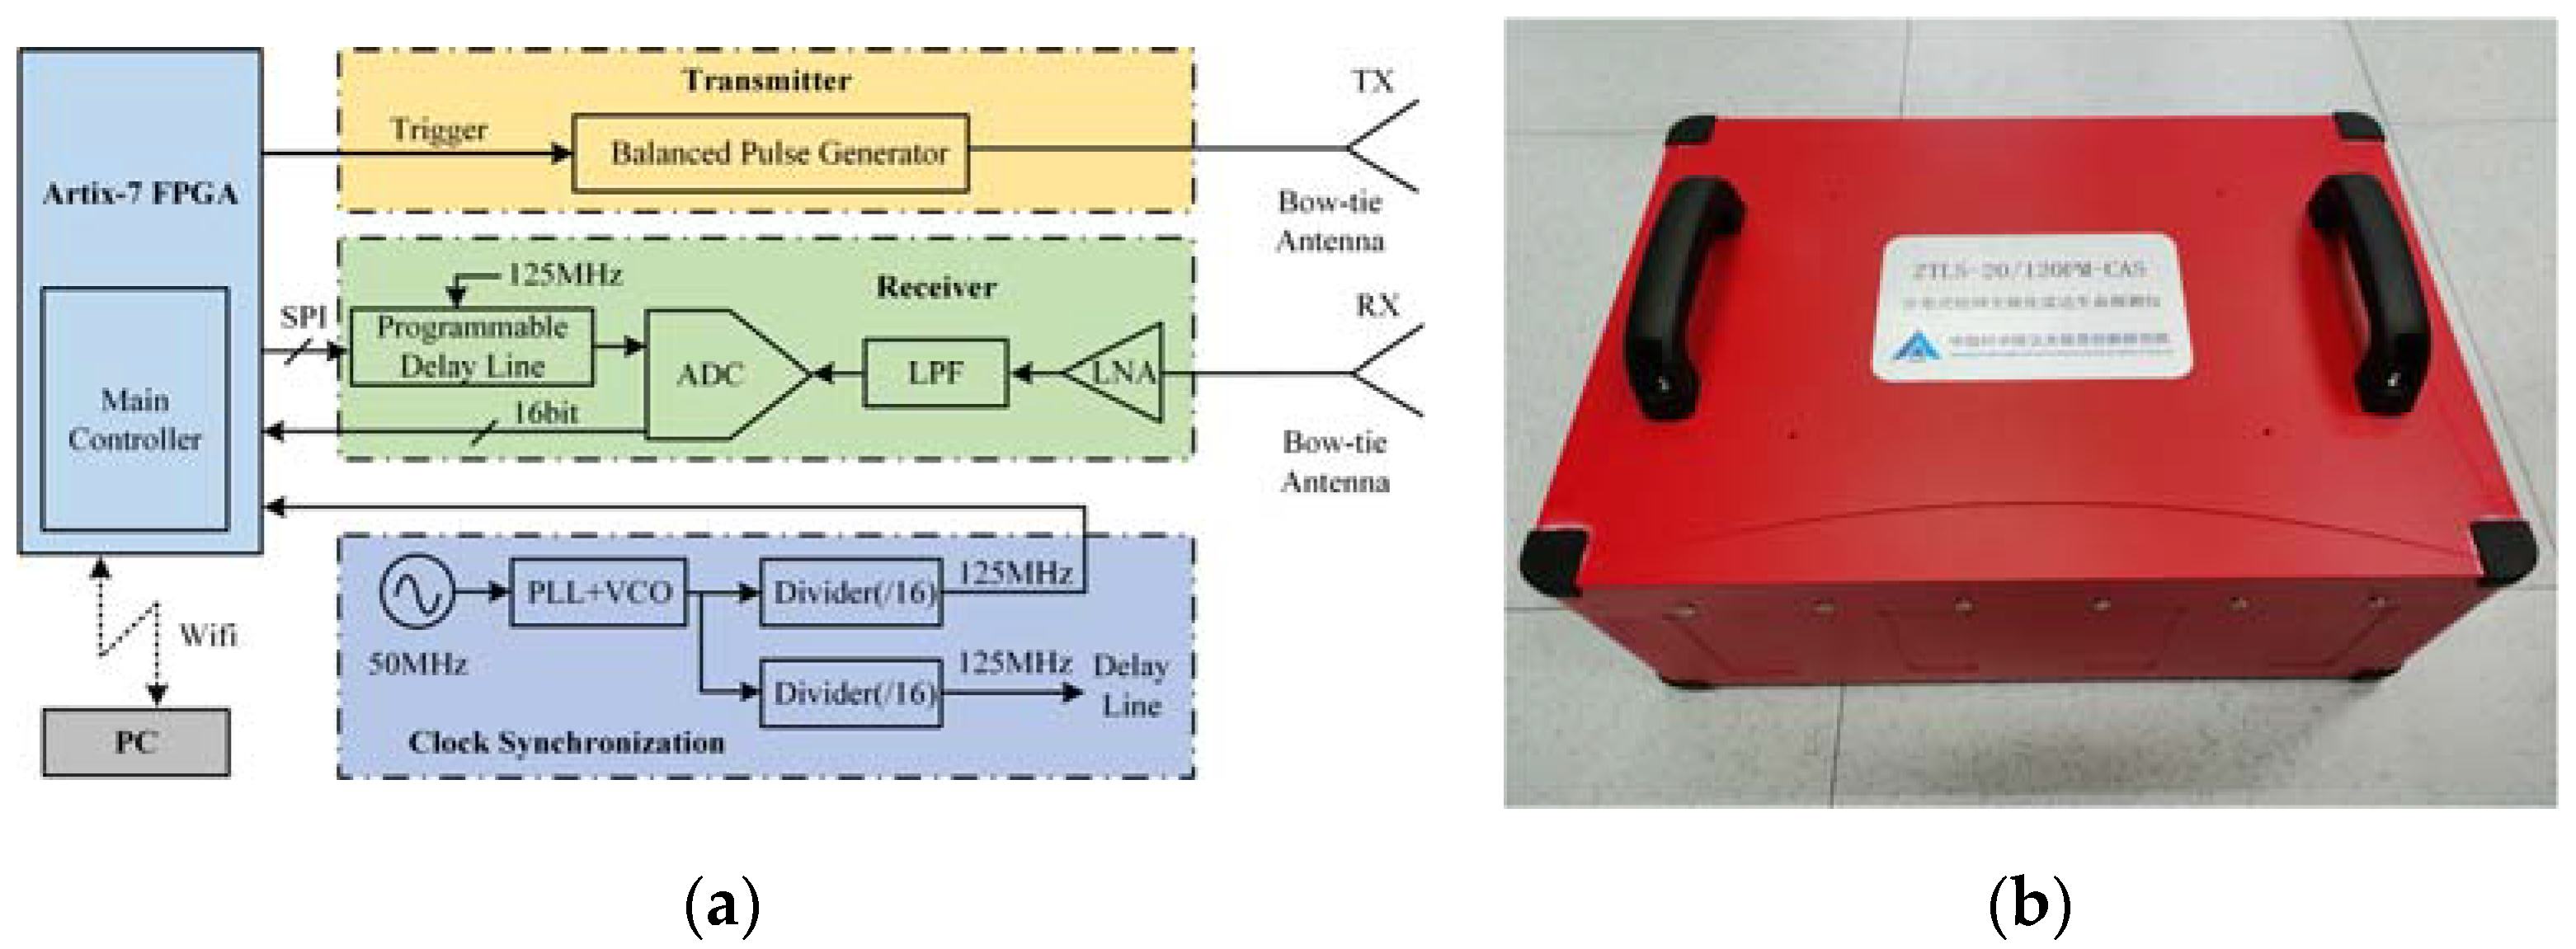
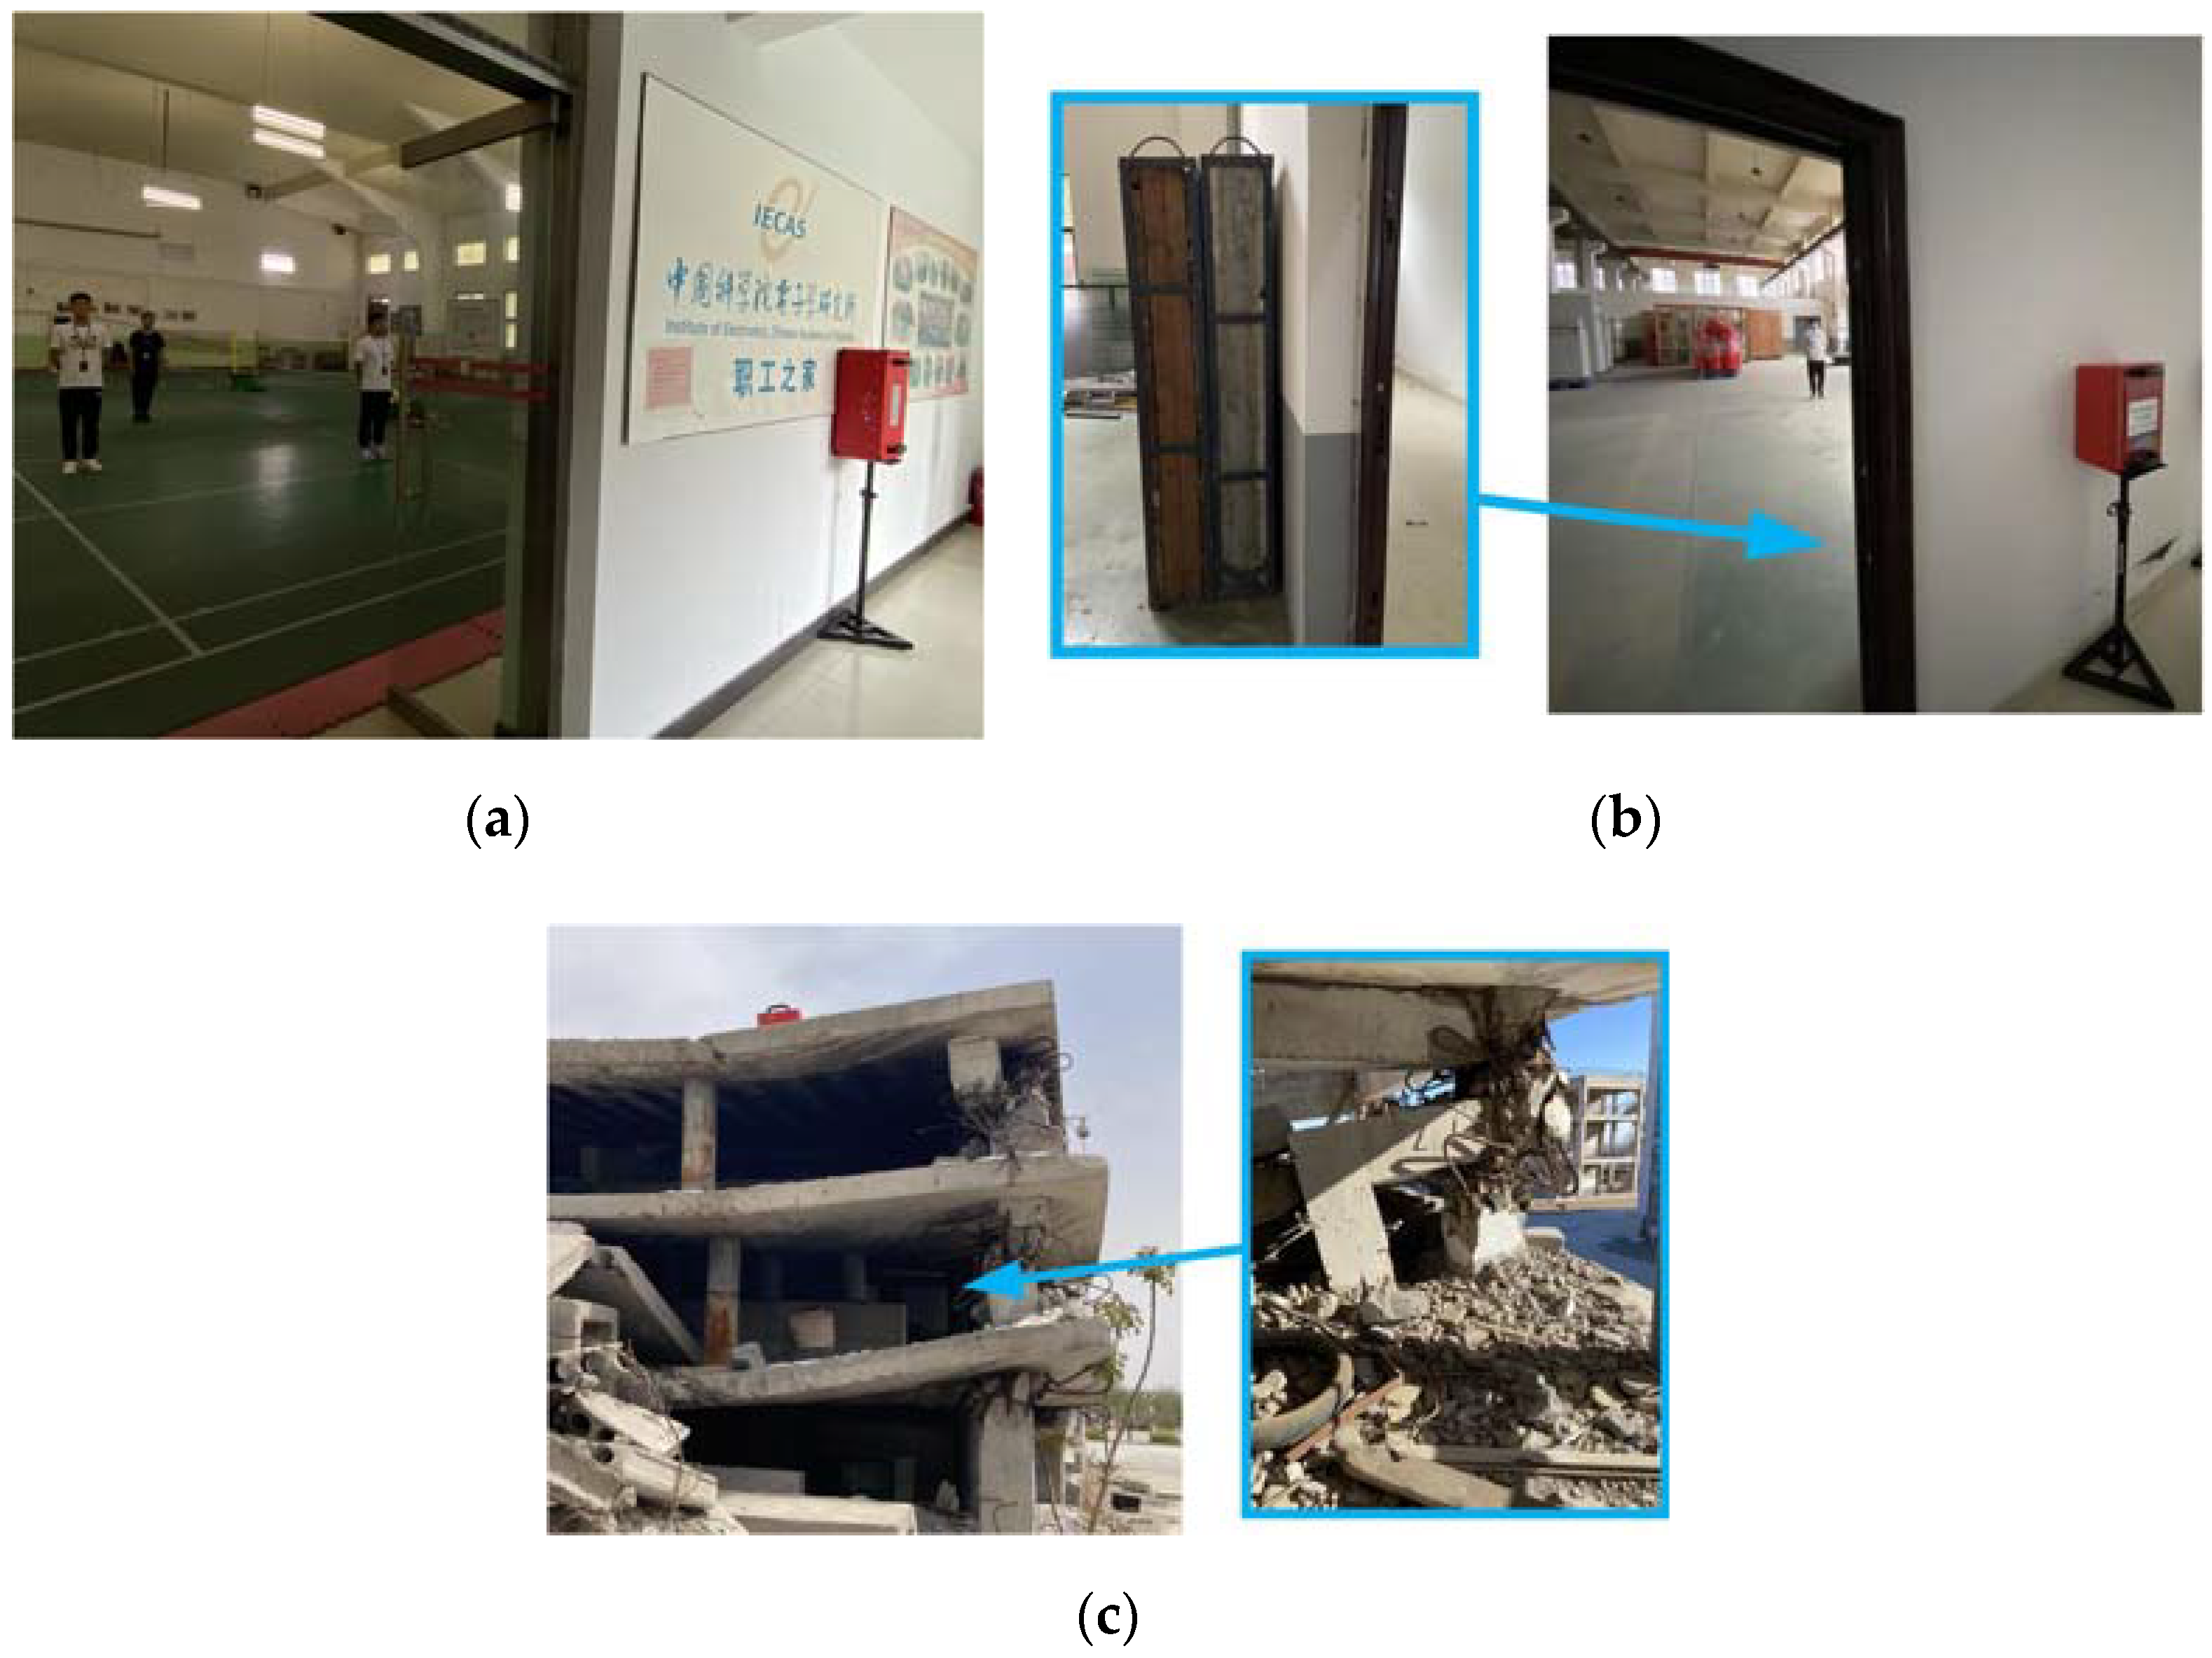
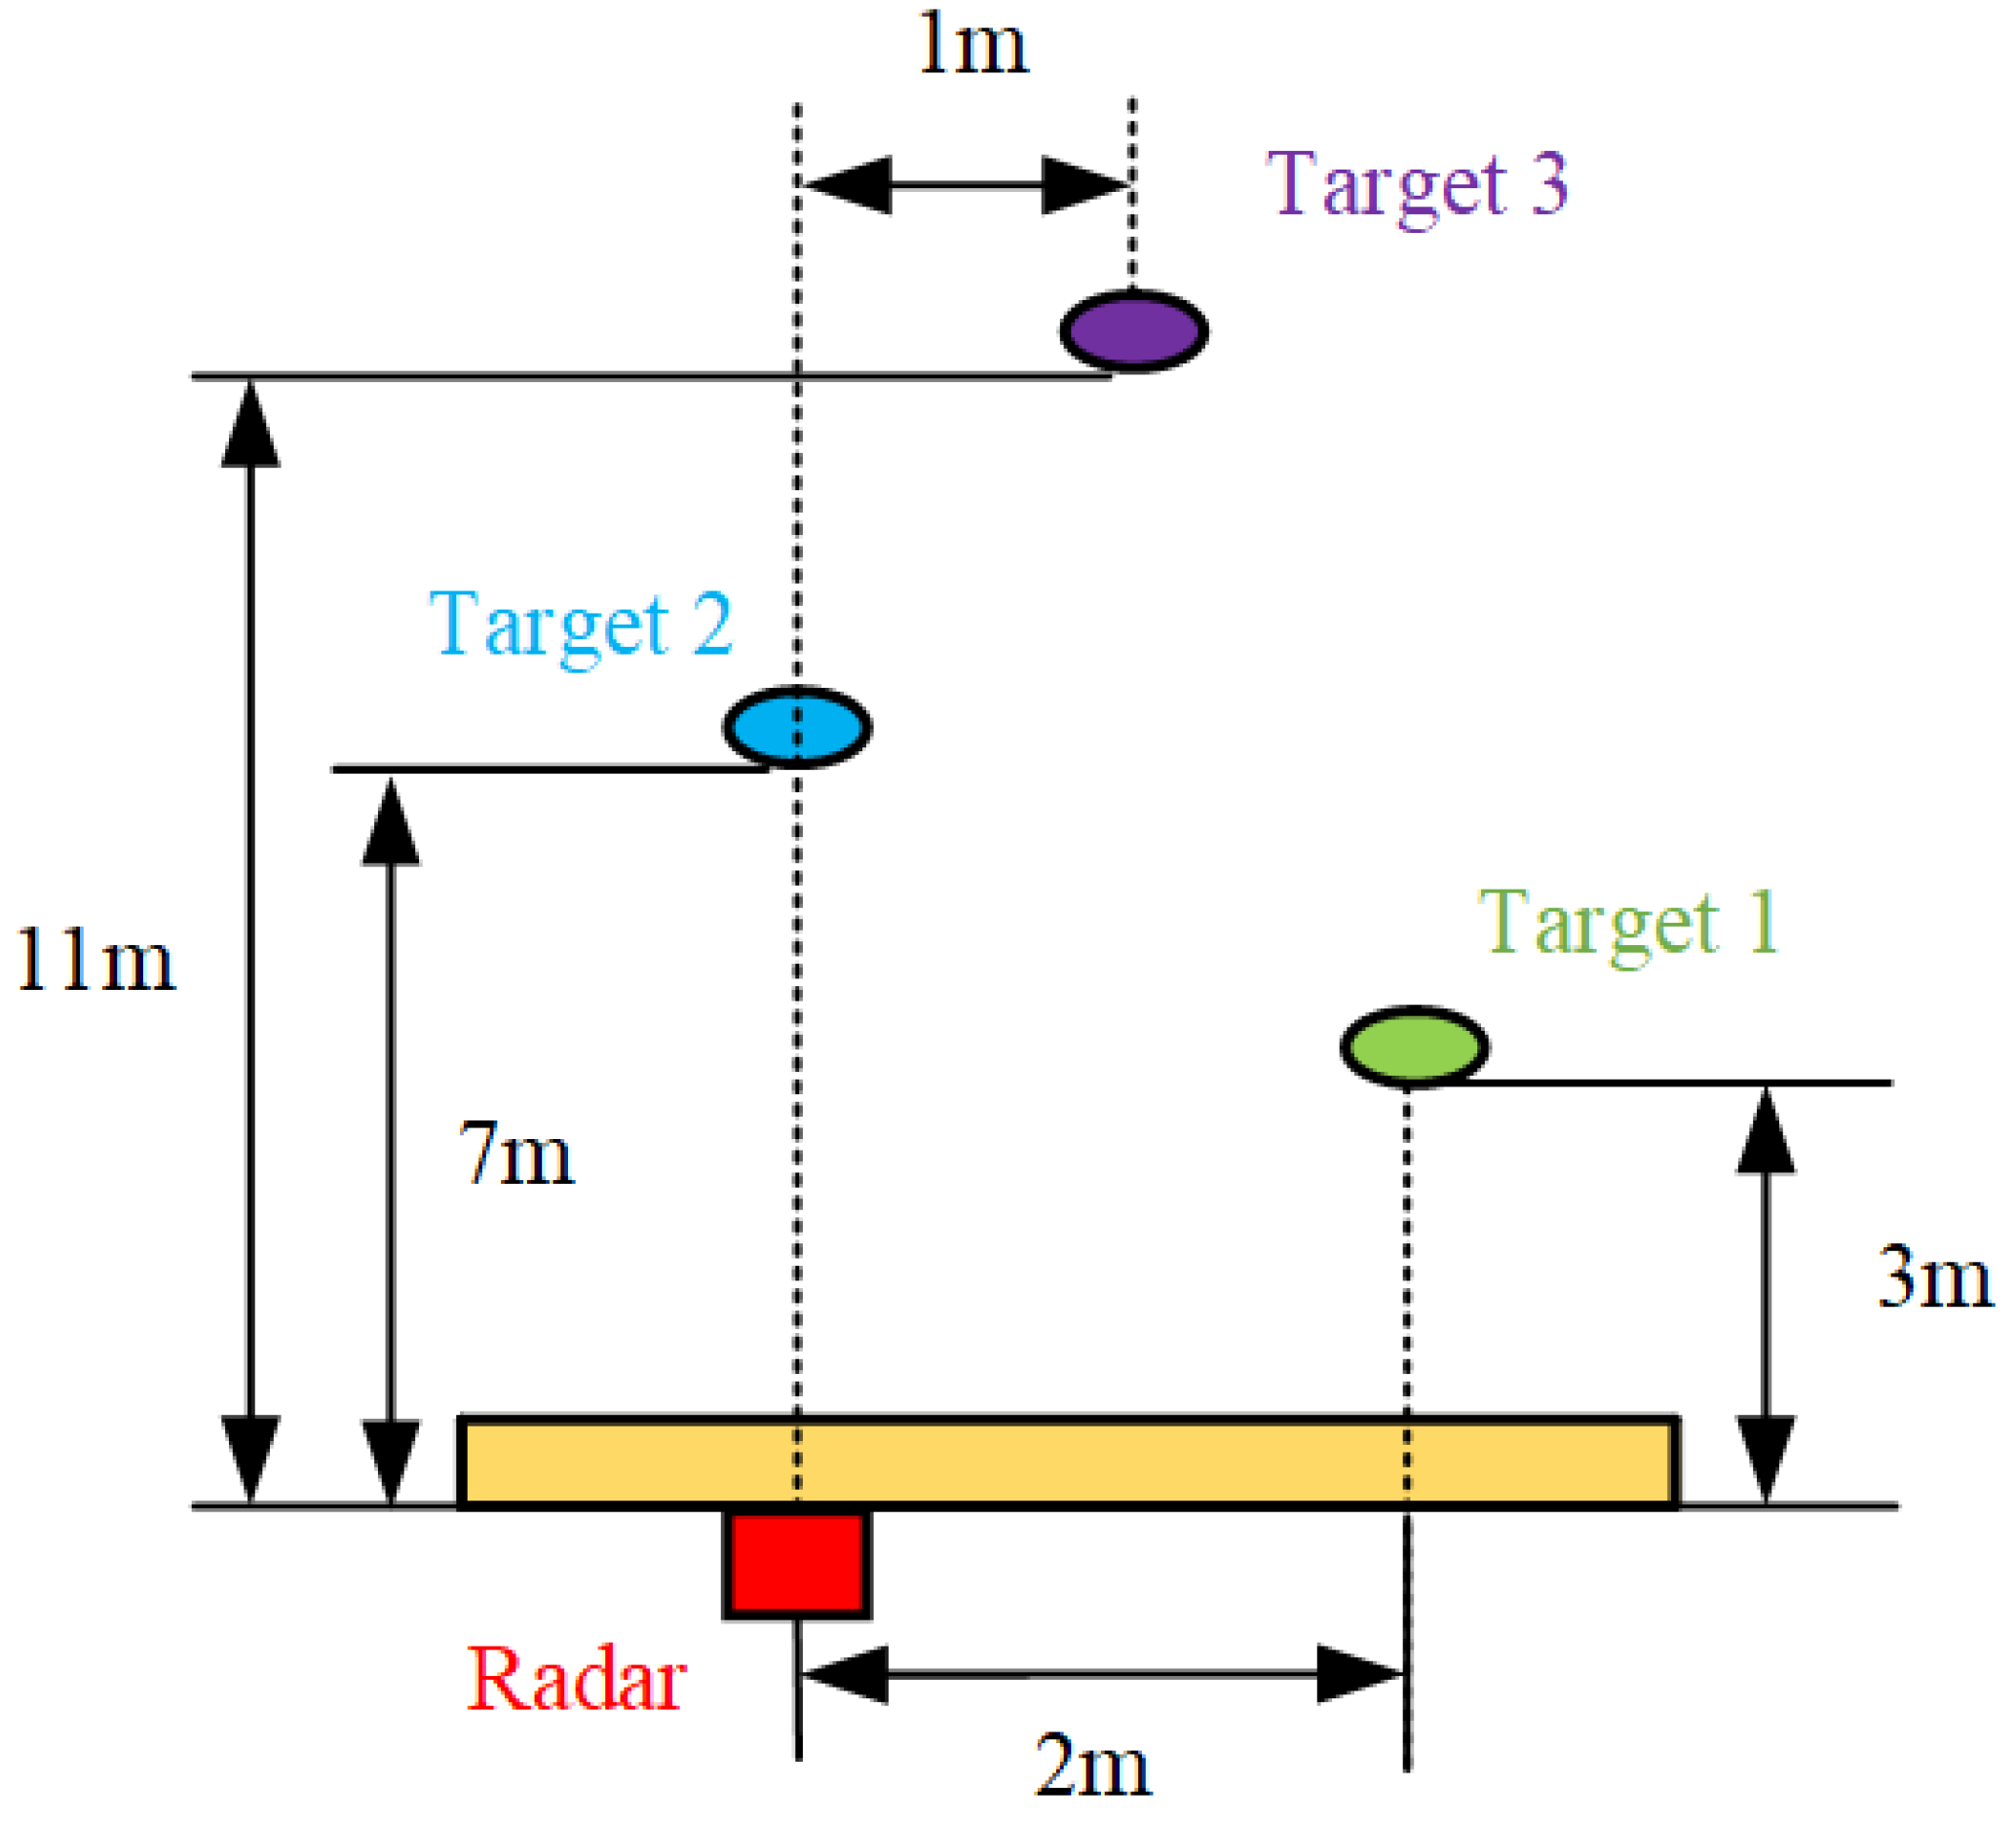
4. Dataset and Experimental Setups

We use a self-developed UWB impulse radar for the experiments. The UWB impulse radar used consists of a pair of bow-tie antennas, a balanced pulse generator, a receiver, and a clock synchronization module, as shown in Figure 3. The balanced pulse generator is based on a Step Recovery Diode (SRD). At the receiver, the signal from the antenna is fed into the low noise amplifier (LNA), and the output is recorded by a 16-bit analog to digital converter (ADC) with a maximal sampling rate of 160 Mbps and a full-power bandwidth of 1.4 GHz. To reduce the system cost and improve the spurious-free dynamic range (SFDR), the equivalent-time sampling technique was adopted. One Micrel’s SY89297U programmable delay line, which can achieve a maximal delay of 5 ns with 5 ps fine increments, was used to provide a fine delay to the ADC sampling clock. Additionally, a Xilinx Artix-7 Field Programmable Gate Array (FPGA) was used to control the entire system and provide trigger signals to the transmitter, ensuring the synchronization of the whole system by locking these signals to the common clock. A pair of folded bow-tie antennas were used for electromagnetic radiation and reception, whose basic geometry is combined by a novel acorn-shaped bent bow-tie patch and a hollowed stepped back cavity [54]. The UWB impulse radar can be operated remotely for target detection experiments. In this way, there is no operator interference during experiments.
The key parameters of the UWB impulse radar used are shown in Table 2. The slow-time sampling rate reaches 15 Hz, which is fast enough to acquire the respiratory signal of the human target according to the Nyquist theorem. To improve the SCNR of the radar echo data, each range profile is obtained by averaging 128 range profiles.
The scenarios for dataset collection are shown in Figure 4. We conduct dataset collection in three scenarios. Scenario 1 is a standard brick wall in a gymnasium. The thickness of the wall is 40 cm. Up to three stationary human targets are breathing steadily in the detection area. The UWB impulse radar is placed on the other side of the wall for data collection. In each experiment, the location of the target is random. The maximum range between the target and the radar is 11 m, and the maximum angle is 60°. The minimum spacing between targets is 30 cm. The wall in Scenario 2 consists of three media, namely, brick wall, floor, and wood. The thickness of each medium is 30 cm, and the total thickness of the wall is 90 cm. Similar to Scenario 1, the UWB impulse radar is placed on one side of the wall, and human targets are on the other side of the wall. Scenario 3 is the actual ruin, which is a collapsed building. There is a lot of wood, steel, and bricks in the ruins. The UWB impulse radar is placed on the top floor, and human targets are hidden in the ruins. Each of the 3 scenarios has a measuring duration of 40 s, so as to ensure that the collected data contain multiple cycles of respiratory signals. We have collected 26,939 samples in Scenario 1, 6542 samples in Scenario 2, and 2845 samples in Scenario 3. The collected dataset has a total of 36,326 samples. Each sample contains 600 impulse responses, and the fast-time sampling points is 800, so the size of each sample is 800 × 600. The ground truth for every target is set to five range bins. The label of each sample is a vector of size 800, where target range bins are set to 1, and non-target range bins are set to 0. In order to train the model and analyze the results, these samples are randomly divided into two datasets according to the ratio of 8:2, namely, the training set and the validation set.
All the implementations of the method are developed on PyTorch. The training parameter mini-batch size and total epoch number are set to 32 and 200. The learning rate is set as 0.001 initially and decreases 10% every 10 epochs. All the experiments are run on one NVIDIA GeForce GTX3090Ti GPU card (with a 24 GB memory) with CUDA for acceleration.

5. Results

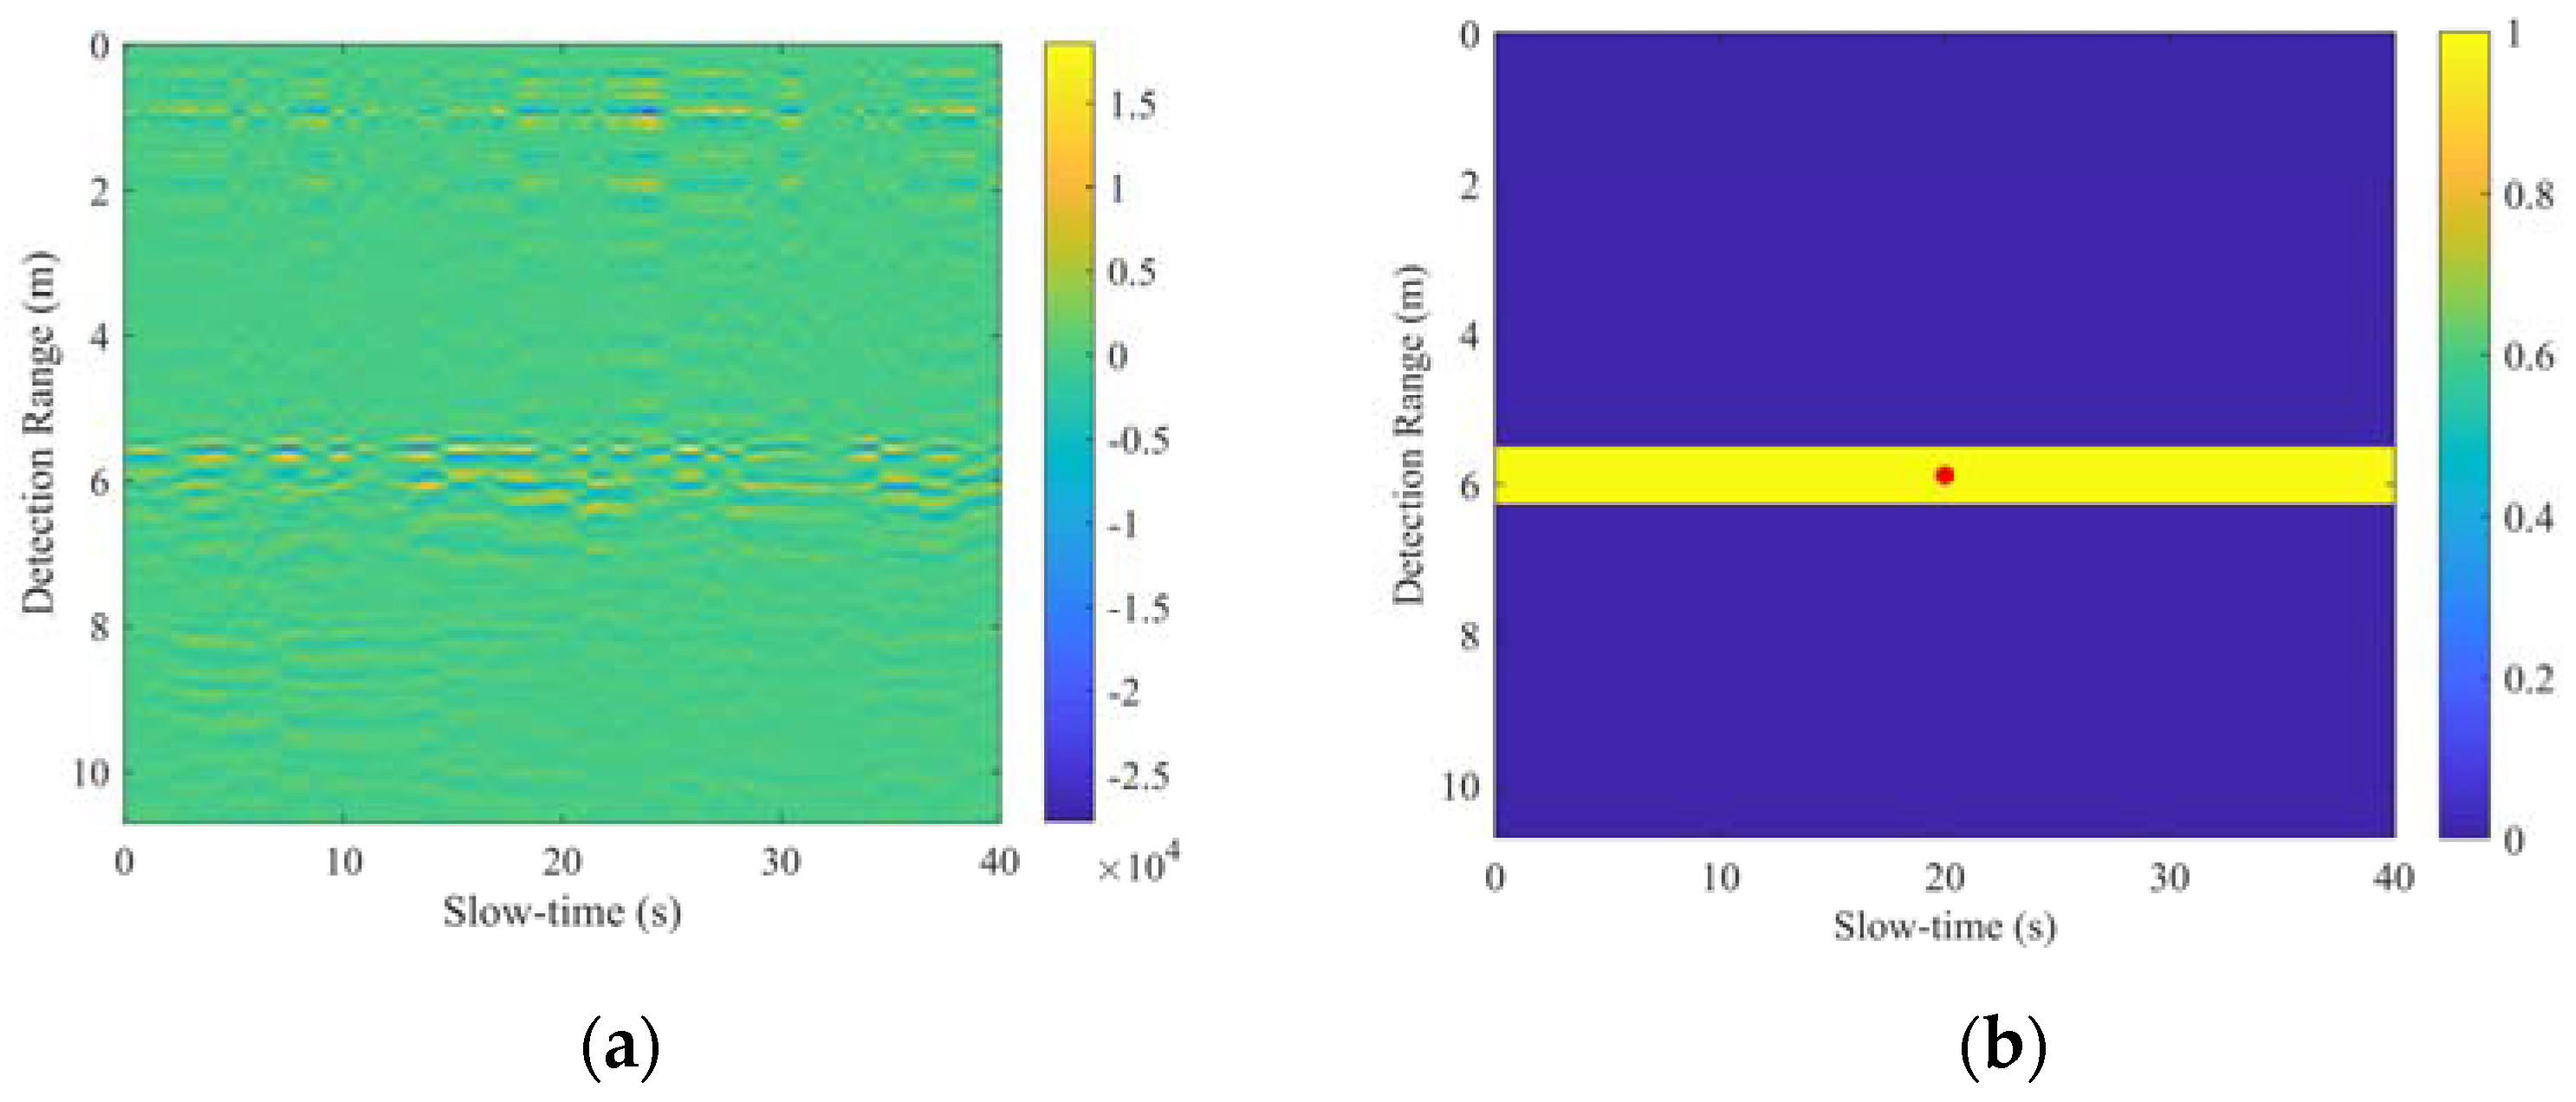
5.1. Experiment with a Single Target

A human target stands 3.6 m away from the UWB impulse radar. The raw radar data are shown in Figure 5. Due to the strong scattered energy of the background, the raw data contain many static strips in the measuring time. The human respiration signal with a range of 3.6 m is overwhelmed by the background and noise signal, and the human target information cannot be directly extracted from the raw radar data. The result processed by our proposed method is shown in Figure 6. Figure 6a shows the result obtained after step A. After pre-processing, such as static background removal, high-frequency noise suppression, and signal enhancement, periodically varying strips corresponding to the respiratory-motion response can be observed at 3 to 4 m. After the feature extraction of the convolutional neural network, the output TPOIs are shown in Figure 6b. It should be noted that the output of the convolutional neural network is an 800-sized vector. For a more intuitive display, we duplicate it to generate a matrix of size 800 × 600, keeping the same size as the range-slow-time matrix. The red dots represent the result of clustering, and the target range output by the method is 3.62 m.
Furthermore, the detection method based on a 1D range profile in [34], the detection method based on a 2D range-frequency matrix in [35], and the method in [36] were performed for comparison with the proposed method. Figure 7 shows the result of the method in [34]. The blue line represents the 1D range profile for detection. The peak at the range of 3.63 m is regarded as the detection unit. The green line represents the correlation coefficients between the signal at different distances and the signal at 3.63 m. The scaling factor F and the threshold ρ t h in [34] are set to 2 and 0.6, respectively. The detection unit at 3.63 m is regarded as the human target signal. The peak at the range of 0.79 m is used to estimate the clutter energy, and its correlation coefficient is 0.17, which is lower than the threshold of 0.6.
Figure 8 shows the processed result by the method in [35]. Figure 8a is the range-frequency matrix used for detection, which is obtained by Fast Fourier transform (FFT) in the slow-time dimension. Figure 8b is the result extracted by the 2D CFAR energy windows, and the red dot represents the target. The threshold T r in [35] is set to 1.5. It can be seen that the method in [35] also correctly extracts the human target, and the output target range is 3.59 m.
Figure 9 shows the processed result by the method in [36]. A range-dependent threshold signal is generated, and hard thresholding is applied to the range profile. For the threshold signal, ρ is an important parameter that determines the minimum detectable target amplitude. The green and red lines represent the threshold signals with ρ of 20 and 10, respectively. As can be seen from Figure 9, the threshold signal with ρ of 10 can extract the target at 3.63 m. In the single-target detection experiment, all four methods correctly extract the target range.

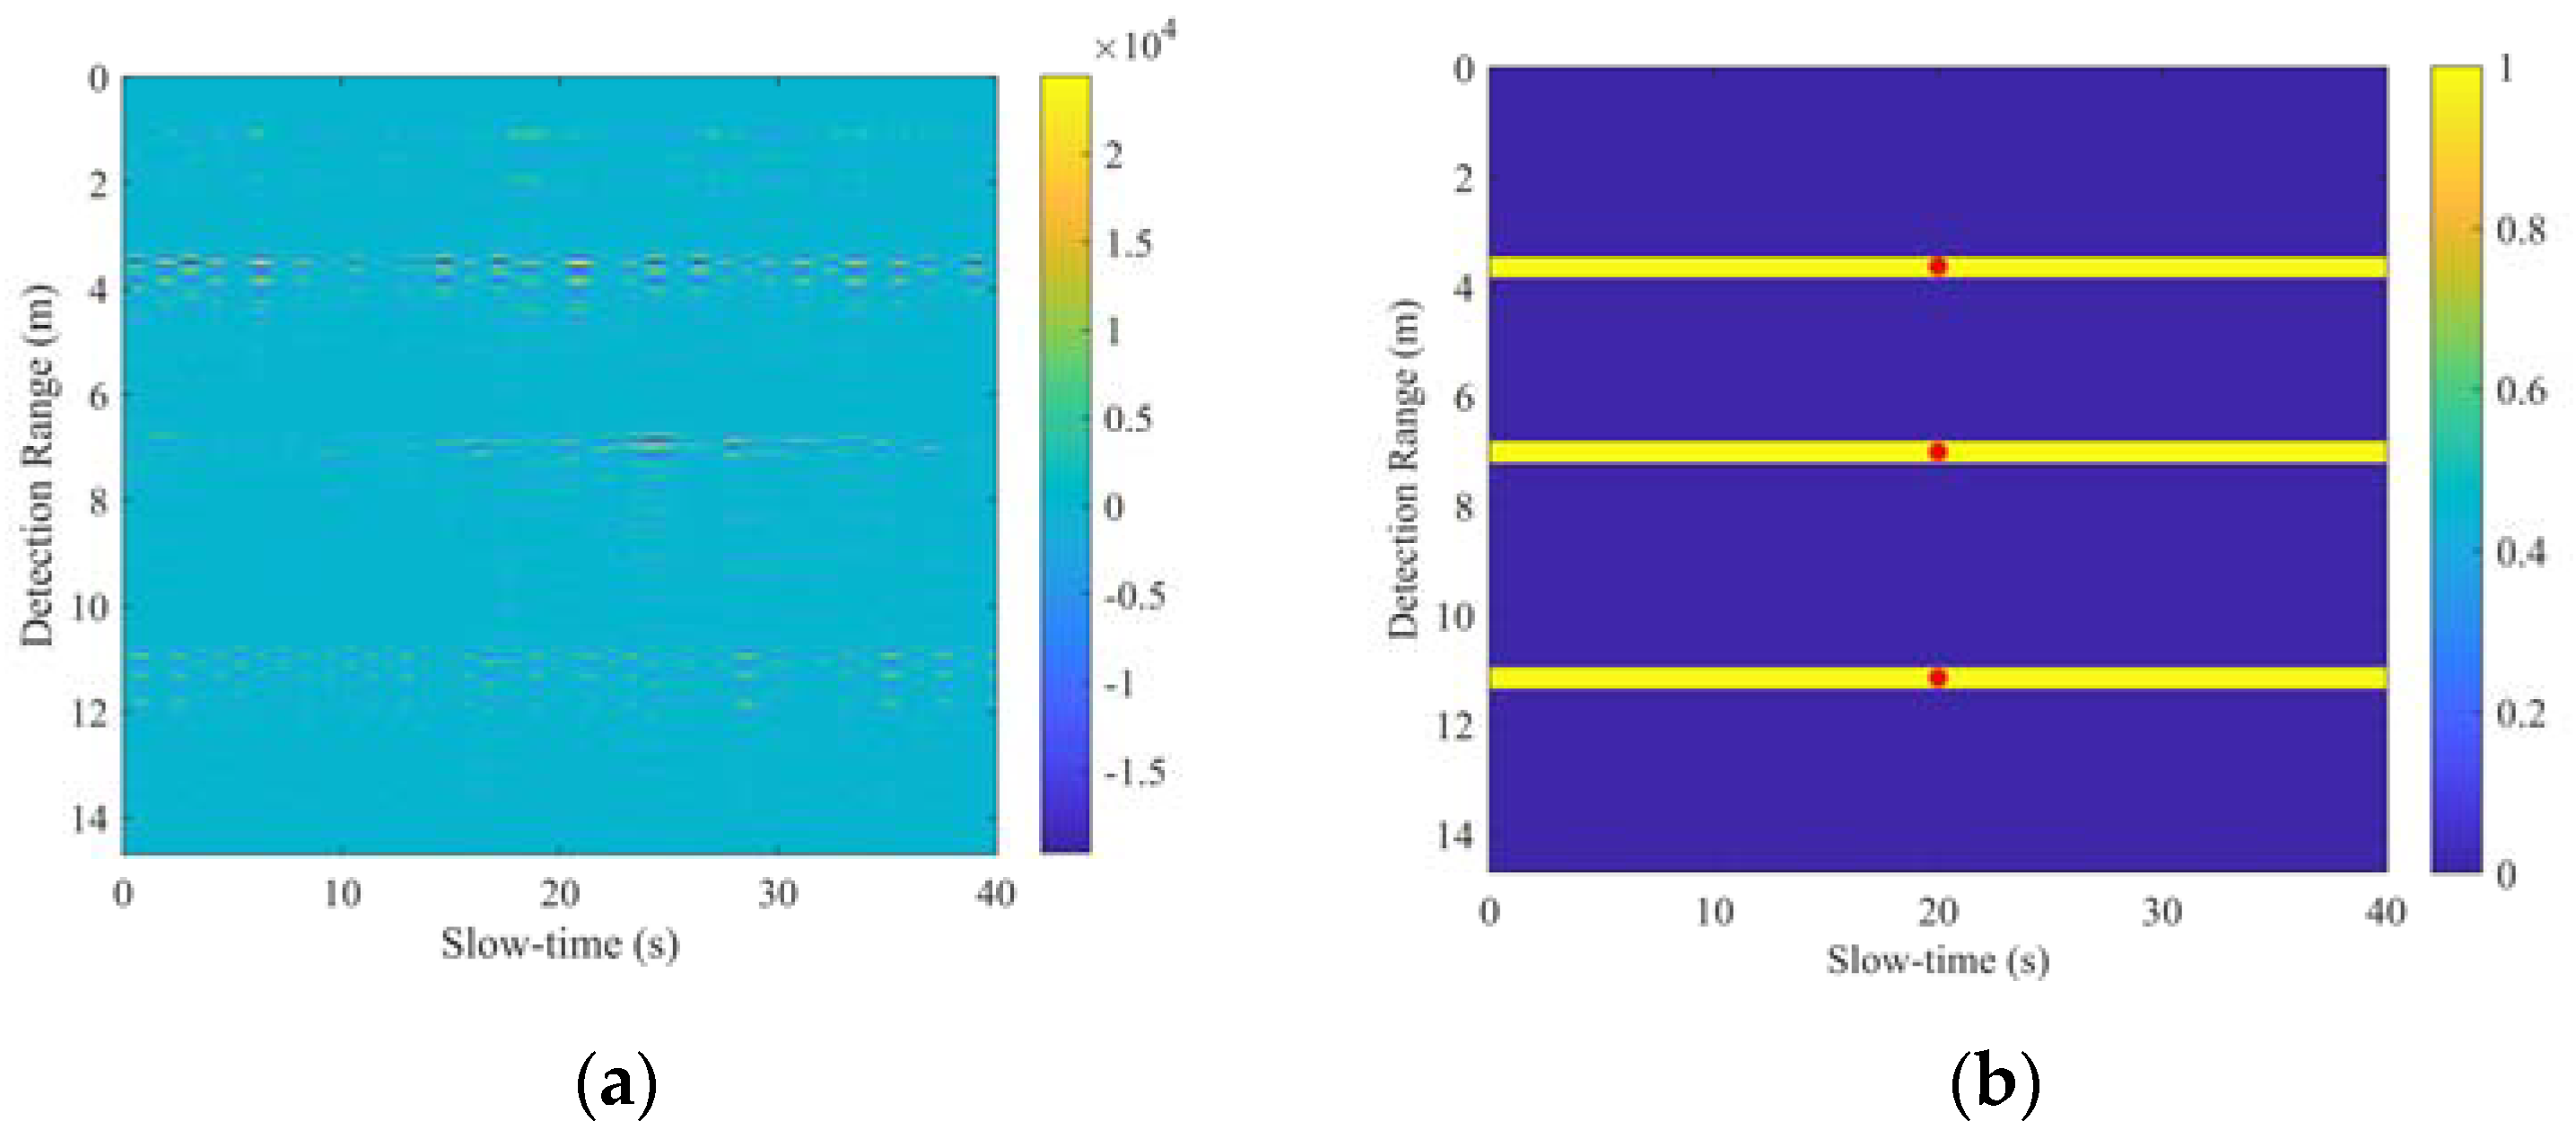
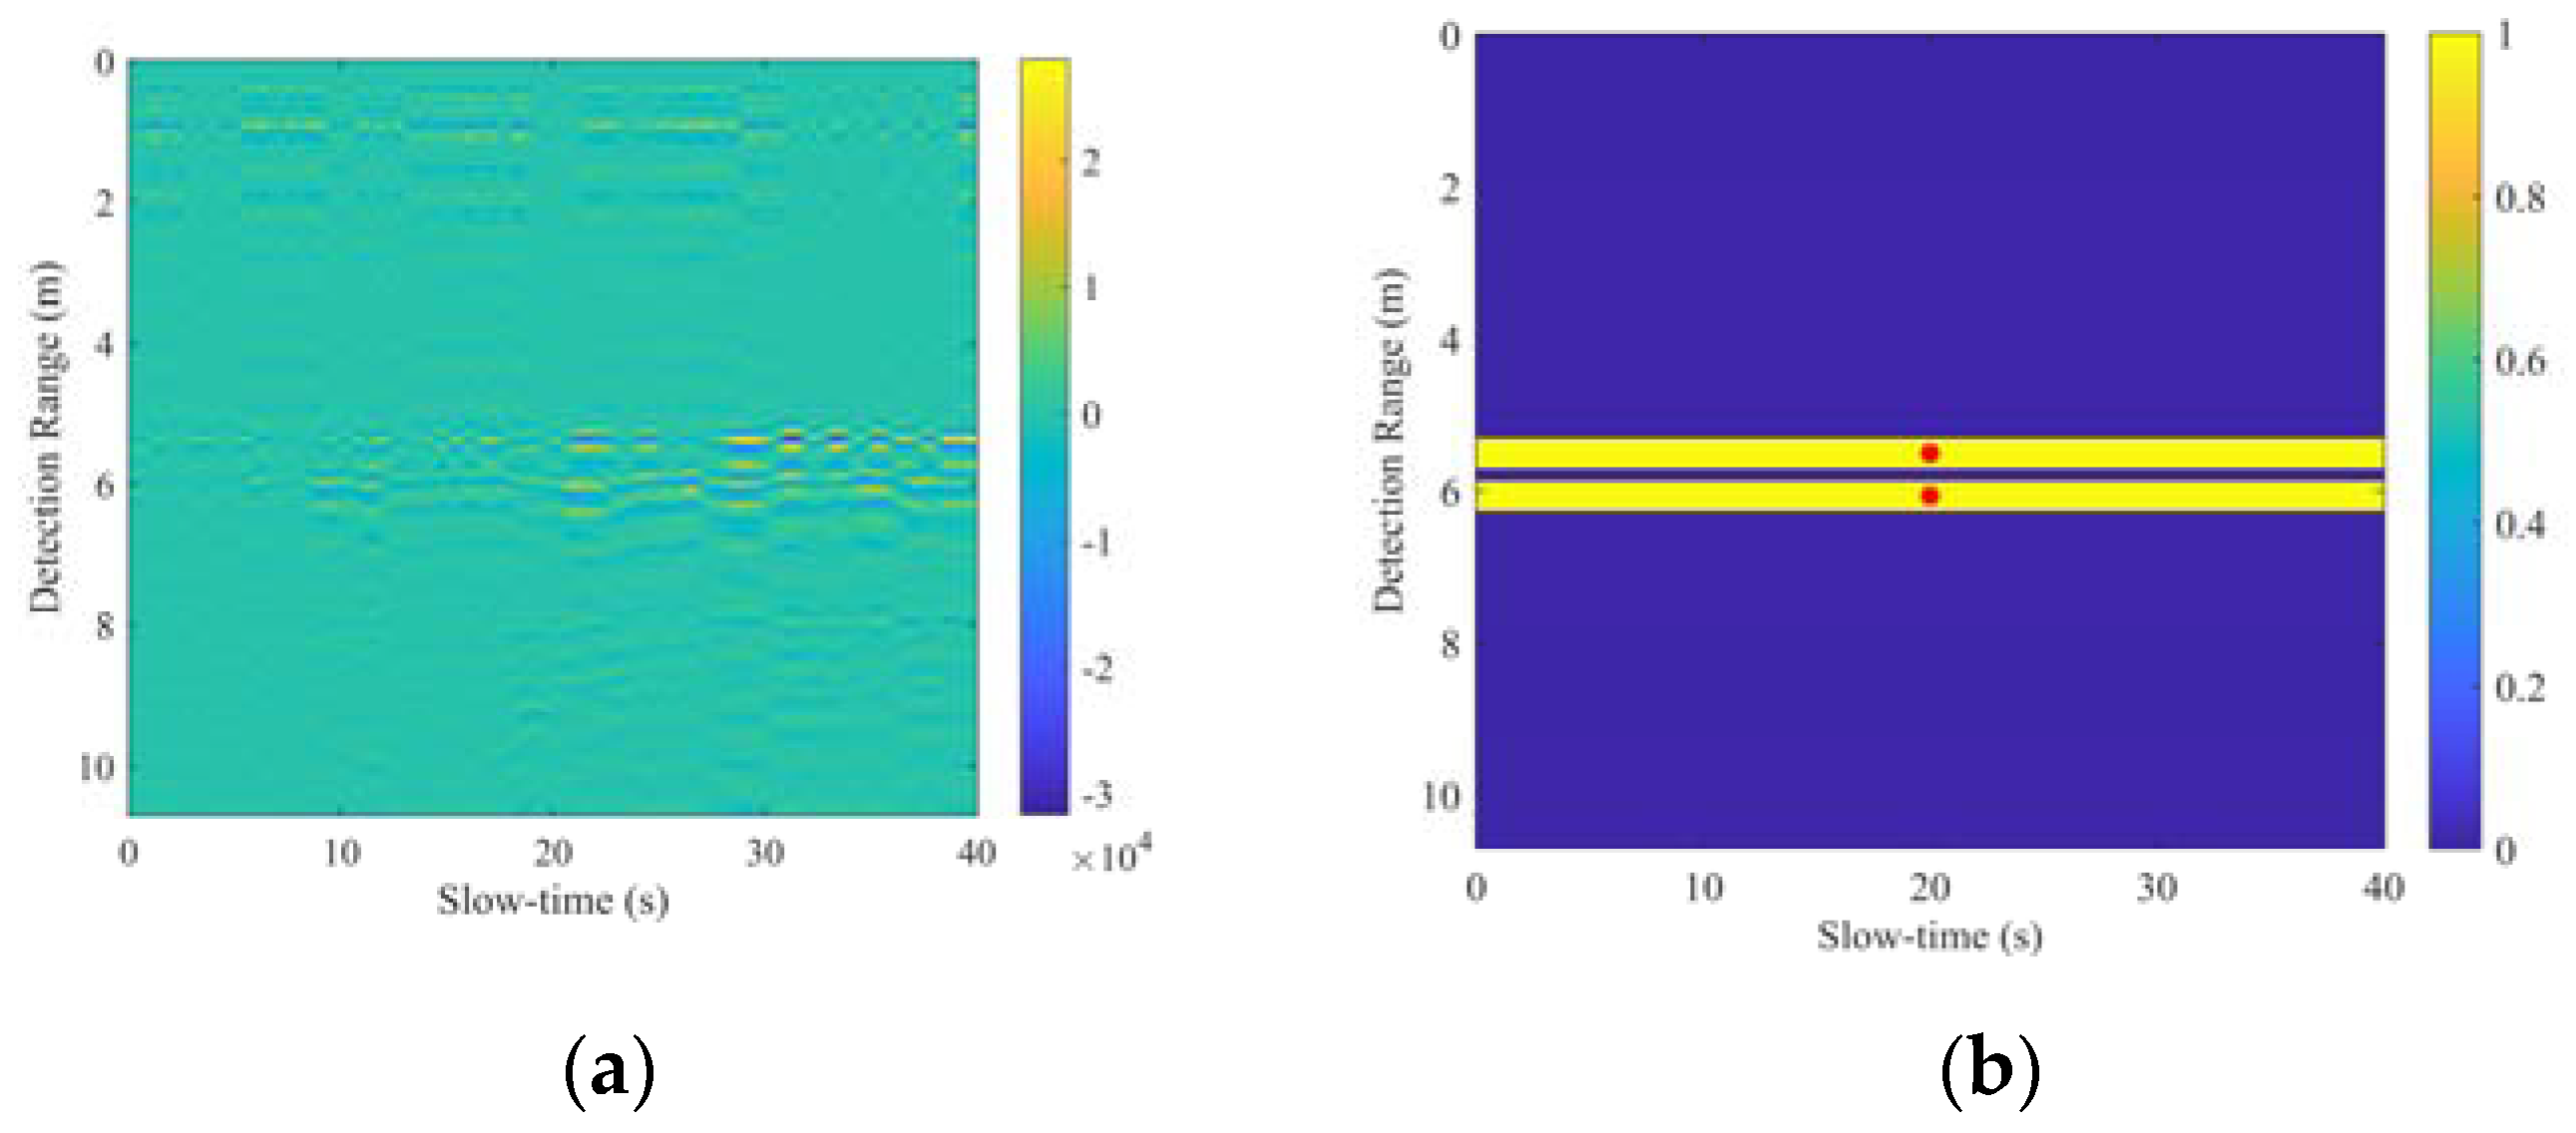
5.2. Experiment with Multiple Targets

In the multi-target detection experiment, three targets stood in the detection environment, and their ranges from the radar were 3.61 m, 7.00 m, and 11.05 m, respectively. The schematic diagram of the positions is shown in Figure 10.
The result processed by our proposed method is shown in Figure 11. After preprocessing, periodically varying strips related to the respiratory motion can be observed around 3.5 m, 7 m, and 11 m. The closer the target is, the stronger the energy scattered by the target. In addition, the frequency and intensity of the target’s respiratory motion will also affect the intensity of the electromagnetic wave energy scattered by the target. After being processed by CNN, the features related to the respiratory movement are detected. Three clusters of TPOIs are extracted in the range dimension. After simplifying the TPOIs using the clustering algorithm, the output target ranges are 3.62 m, 7.00 m, and 11.13 m, respectively. The average range error is 3 cm.
Figure 12 shows the result processed by the method in [34]. The energy at the range of 3.83 m is the highest, which is regarded as the detection unit by the method. At the same time, there are energy spikes at the ranges of 1.07 m, 7.04 m, and 11.48 m. The correlation coefficients between them and the detection unit are all below the threshold of 0.6. They are all identified by the method as background clutter signals. Finally, the method only extracted Target 1, and the range error is 0.22 m. Target 2 and Target 3 were missed and have not been extracted.
Figure 13 shows the result processed by the method in [35]. It can be seen that the method in [35] only extracts two targets. The output range of Target 1 is 3.64 m with a range error of 0.03 m, and the output range of Target 3 is 11.36 m with a distance range of 0.31 m. Target 2 was missed. Since the method in [35] is an energy-based extraction method, the accuracy of its extraction result largely depends on the energy intensity scattered by the target. From the range-frequency matrix, the signal of Target 2 can be observed at the range of about 7 m. However, the energy ratio here is much lower than the detection threshold T r due to the weak energy compared to other targets. Therefore, Target 2 is not recognized as a target by the algorithm, and the algorithm gives an incorrect decision.
Figure 14 shows the processed result by the method in [36]. The green and red lines represent the threshold signals with ρ of 20 and 10, respectively. It can be seen that because the threshold signal with ρ of 20 has a high detectable target amplitude, only Target 3 is extracted. The threshold signal with ρ of 10 has a low detectable target amplitude. All targets can be extracted, but there are false alarms at about 12 m. Since the energy scattered by the target is not only related to the range, the frequency and intensity of the target’s respiratory motion will also affect the energy scattered by the target. Therefore, there are missed alarms and false alarms in multi-target detection through the range-dependent threshold.
We randomly select 50 sample data from the validation set, and the results of the target extraction from the sample data by different methods are summarized in Table 3, in which the target is correctly extracted when the range error is within 30 cm. As can be seen from Table 3, compared with the other three methods, our proposed method extracts the targets more accurately and obtains the lowest missed alarm rate. The calculation time of different methods is summarized in Table 4. The computer with one AMD Ryzen 5 CPU and one NVIDIA GeForce GTX3090Ti GPU card (with a 24 GB memory). The calculation time of our proposed method is about 0.14 s, which meets the need of real-time data processing.

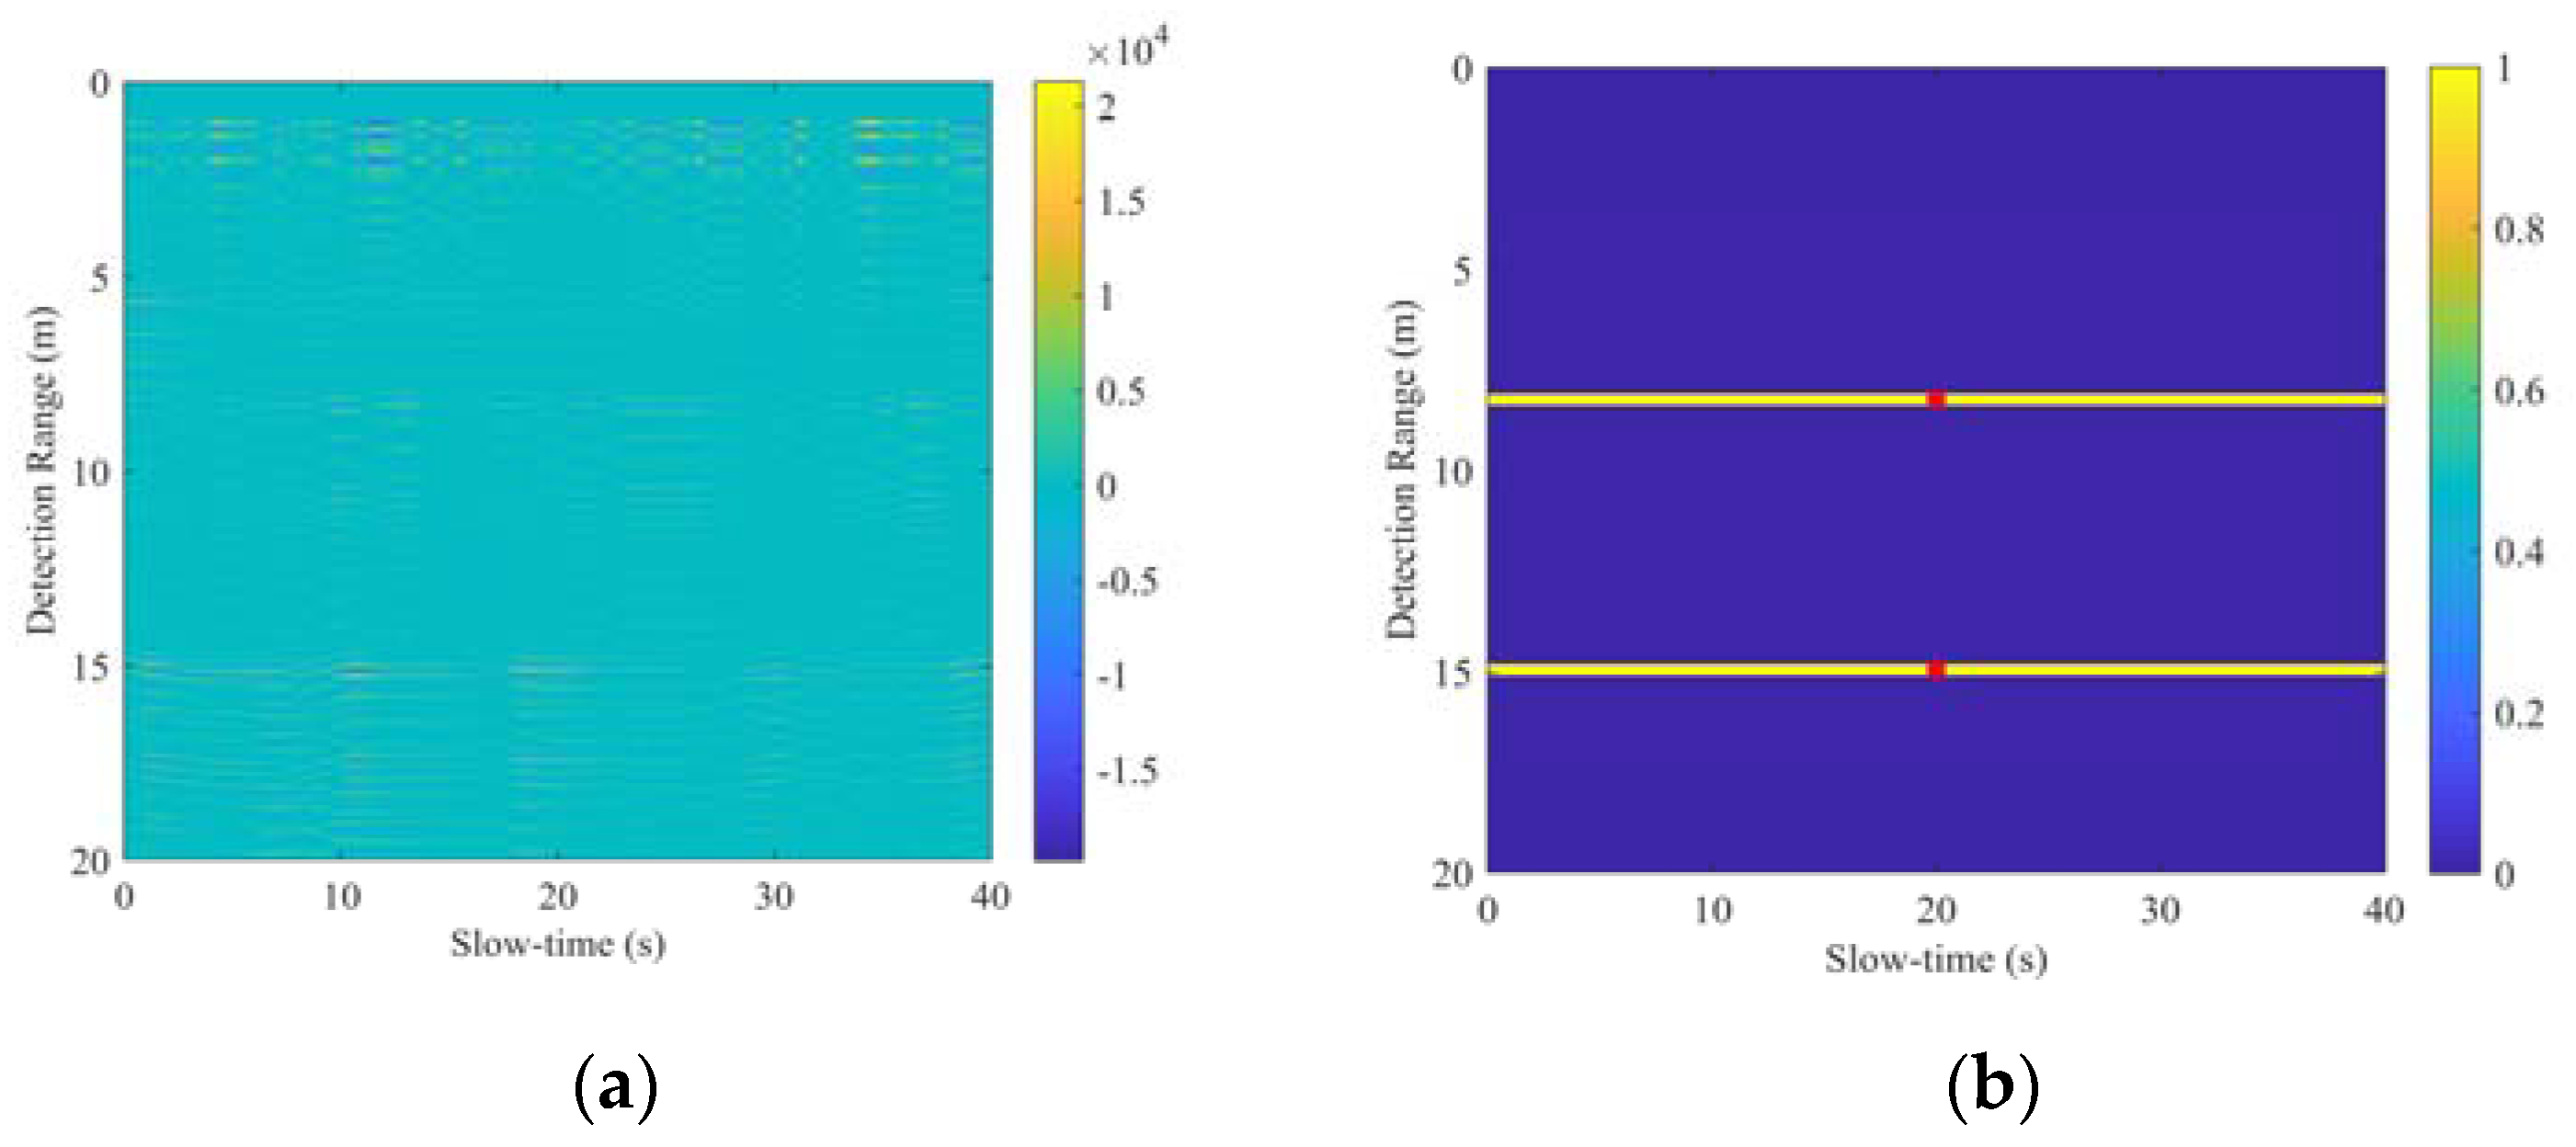
5.3. Experiments with Different Target Intervals

To evaluate the method performance for different human target intervals, three experimental results with three target intervals are provided in this subsection. For these three experiments, two human targets stand in the normal direction of the UWB impulse radar, in which target 2 is fixed at 6 m, and target 1 is standing at 5 m, 5.5 m, and 5.7 m, respectively. Therefore, the intervals between two targets correspond to 1 m, 0.5 m, and 0.3 m, respectively. For simplification, experiments with intervals of 1 m, 0.5 m, and 0.3 m are represented separately by Experiment 5.1, 5.2, and 5.3, respectively. The experimental results are provided in Figure 15, Figure 16 and Figure 17 for Experiments 5.1–5.3, respectively. The target ranges extracted for each experiment are shown in Table 5. It can be seen that when the target interval is 1 m or 0.5 m, both targets can be detected by the proposed method with a maximum range error of 7 cm. Limited by the range resolution of UWB impulse radar, when the interval between two targets is shortened to 30 cm, the proposed method only extracts one target.

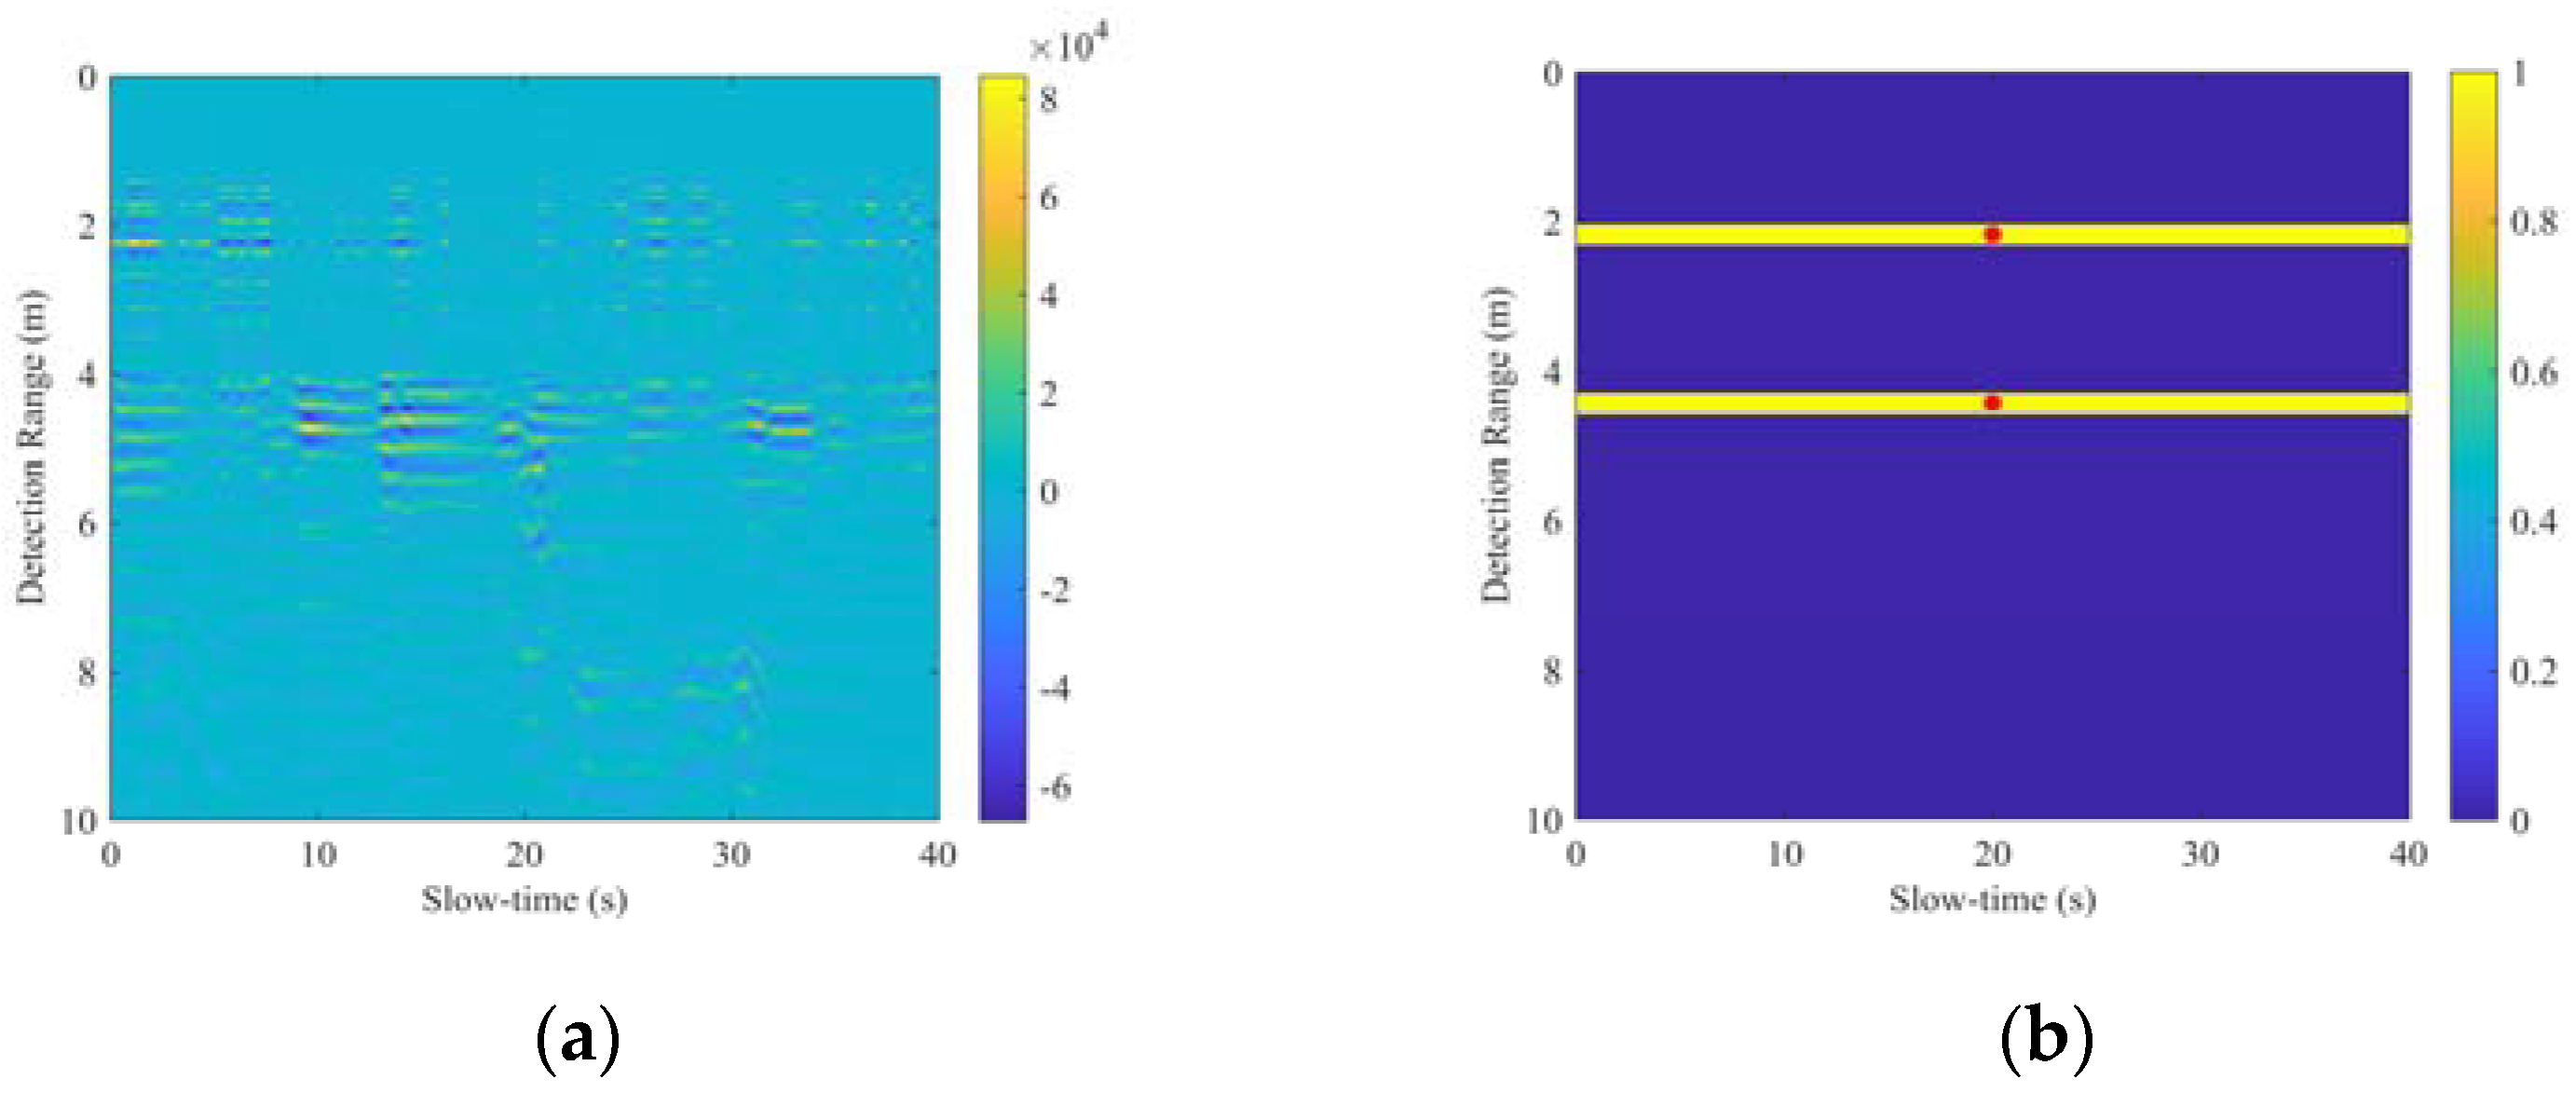
5.4. Experiments in Different Scenarios

The above experiments are all carried out in Scenario 1 to test the robustness of our proposed method in different scenarios, we present the processed results of the multi-layer medium scenario (Scenario 2) and the actual ruin scenario (Scenario 3), respectively. Figure 18 shows the target detection result in Scenario 2, where the actual ranges of the two targets are 8.2 m and 15.0 m, respectively. From the range-slow-time matrix obtained after step A represented in Figure 18a, it can be seen that due to the multiple scattering of electromagnetic waves between the media, strong clutter is exhibited within 0~2 m. The respiration signals of the two targets are weak, especially the target at 8 m, which cannot be observed. After the feature extraction of CNN, the output TPOIs are shown in Figure 18b. The output target ranges are 8.24 m and 14.94 m, respectively. The range errors are 4 cm and 6 cm, respectively.
Figure 19 shows the target detection result in Scenario 3, where the actual ranges of the two targets are 2.0 m and 4.2 m, respectively. From the range-slow-time matrix represented in Figure 19a, it can be seen that although the two targets are in close range to the radar, due to the energy attenuation and multipath scattering of various obstacles, there is a lot of clutter in the matrix. In addition, the respiration signal extends in the range dimension. After the feature extraction of CNN, the output TPOIs are shown in Figure 19b. The output target ranges are 2.18 m and 4.43 m, respectively, which are consistent with the actual situation.

6. Conclusions

When using the UWB impulse radar for through-wall multiple stationary human target detection, the automatic detection method based on energy has the situation of missed alarms. Factors such as the range of the target, the intensity of the respiratory movement, and the shadow effect will make a difference between the energy scattered by targets. Targets with strong scattered energy obscure targets with weak scattered energy, so that only the strong targets can be detected, and the weak targets are missed. We proposed a multiple stationary human targets detection method based on CNN. Using the powerful feature extraction capability of CNN to automatically extract features related to the respiratory movement. In the actual multi-target experimental data, compared with the other three commonly used automatic detection methods, the proposed method can obtain more accurate results and obtain the lowest missed alarm rate. This will improve the performance of the UWB impulse radar in human detection under NLOS conditions.

Author Contributions

Conceptualization, C.S. and Z.-K.N.; methodology, C.S.; software, S.Y.; validation, J.P. and Z.Z.; formal analysis, C.S.; investigation, J.P.; resources, G.F.; data curation, S.Y.; writing—original draft preparation, C.S.; writing—review and editing, Z.-K.N. and J.P.; visualization, Z.Z.; supervision, S.Y.; project administration, G.F.; funding acquisition, G.F. All authors have read and agreed to the published version of the manuscript.

Funding

This work was supported in part by the Strategic Priority Research Program of the Chinese Academy of Sciences under XDA288050300 and in part by the National Key Research and Development Program of China under 2018YFC0810202 and in part by the National Natural Science Foundation of China under Grant 61827803.

Institutional Review Board Statement

Not applicable.

Informed Consent Statement

Not applicable.

Data Availability Statement

Data sharing is not applicable to this article.

Conflicts of Interest

The authors declare no conflict of interest.

References

  1. Vu, V.T.; Sjogren, T.K.; Pettersson, M.I.; Gustavsson, A.; Ulander, L. Detection of moving targets by focusing in UWB SAR—Theory and experimental results. IEEE Trans. Geosci. Remote Sens. 2010, 48, 3799–3815. [Google Scholar] [CrossRef]
  2. Huang, Q.; Qu, L.; Wu, B.; Fang, G. UWB through-wall imaging based on compressive sensing. IEEE Trans. Geosci. Remote Sens. 2009, 48, 1408–1415. [Google Scholar] [CrossRef]
  3. Le, C.; Dogaru, T.; Nguyen, L.; Ressler, M. Ultrawideband (UWB) radar imaging of building interior: Measurements and predictions. IEEE Trans. Geosci. Remote Sens. 2009, 47, 1409–1420. [Google Scholar] [CrossRef]
  4. Yarovoy, A.G.; Ligthart, L.P.; Matuzas, J.; Levitas, B. UWB radar for human being detection. IEEE Aerosp. Electron. Syst. Mag. 2006, 21, 10–14. [Google Scholar] [CrossRef] [Green Version]
  5. Lv, H.; Lu, G.H.; Jing, X.J.; Wang, J. A new ultra-wideband radar for detecting survivors buried under earthquake rubbles. Microw. Opt. Technol. Lett. 2010, 52, 2621–2624. [Google Scholar] [CrossRef]
  6. Liu, L.; Fang, G. A novel UWB sampling receiver and its applications for impulse GPR systems. IEEE Geosci. Remote Sens. Lett. 2010, 7, 690–693. [Google Scholar] [CrossRef]
  7. Zhuge, X.; Yarovoy, A.G. A sparse aperture MIMO-SAR-based UWB imaging system for concealed weapon detection. IEEE Trans. Geosci. Remote Sens. 2010, 49, 509–518. [Google Scholar] [CrossRef]
  8. Wu, S.; Tan, K.; Xu, Y.; Chen, J.; Meng, S.; Fang, G. A simple strategy for moving target imaging via an experimental UWB through-wall radar. In Proceedings of the 2012 14th International Conference on Ground Penetrating Radar (GPR), Shanghai, China, 4–8 June 2012; pp. 961–965. [Google Scholar]
  9. Rohman, B.P.A.; Andra, M.B.; Nishimoto, M. Through-the-Wall Human Respiration Detection Using UWB Impulse Radar on Hovering Drone. IEEE J. Sel. Top. Appl. Earth Obs. Remote Sens. 2021, 14, 6572–6584. [Google Scholar] [CrossRef]
  10. Ma, Y.; Qi, F.; Wang, P.; Liang, F.; Lv, H.; Yu, X.; Li, Z.; Xue, H.; Wang, J.; Zhang, Y. Multiscale residual attention network for distinguishing stationary humans and common animals under through-wall condition using ultra-wideband radar. IEEE Access 2020, 8, 121572–121583. [Google Scholar] [CrossRef]
  11. Shen, H.; Xu, C.; Yang, Y.; Sun, L.; Cai, Z.; Bai, L.; Clancy, E.; Huang, X. Respiration and heartbeat rates measurement based on autocorrelation using IR-UWB radar. IEEE Trans. Circuits Syst. II Express Briefs 2018, 65, 1470–1474. [Google Scholar] [CrossRef]
  12. Sachs, J.; Aftanas, M.; Crabbe, S.; Drutarovsky, M.; Klukas, R.; Kocur, D.; Nguyen, T.T.; Peyerl, P.; Rovnakova, J.; Zaikov, E. Detection and tracking of moving or trapped people hidden by obstacles using ultra-wideband pseudo-noise radar. In Proceedings of the 2008 European Radar Conference, Amsterdam, The Netherlands, 30–31 October 2008; pp. 408–411. [Google Scholar]
  13. Yan, K.; Wu, S.; Ye, S.; Fang, G. A Novel Wireless-Netted UWB Life-Detection Radar System for Quasi-Static Person Sensing. Appl. Sci. 2021, 11, 424. [Google Scholar] [CrossRef]
  14. Pan, J.; Ye, S.; Shi, C.; Yan, K.; Liu, X.; Ni, Z.; Yang, G.; Fang, G. 3D imaging of moving targets for ultra-wideband MIMO through-wall radar system. IET Radar Sonar Navigat. 2021, 15, 261–273. [Google Scholar] [CrossRef]
  15. Xia, Z.; Fang, G.; Ye, S.; Zhang, Q.; Chen, C.; Yin, H. A novel handheld pseudo random coded UWB radar for human sensing applications. IEICE Electron. Expr. 2014, 11, 20140981. [Google Scholar] [CrossRef] [Green Version]
  16. Charvat, G.L.; Kempel, L.C.; Rothwell, E.J.; Coleman, C.M.; Mokole, E. A through-dielectric radar imaging system. IEEE Trans. Antennas Propag. 2010, 58, 2594–2603. [Google Scholar] [CrossRef]
  17. Harikesh, D.; Chauhan, S.S.; Basu, A.; Abegaonkar, M.P.; Koul, S.H. Through the Wall Human Subject Localization and Respiration Rate Detection Using Multichannel Doppler Radar. IEEE Sens. J. 2020, 21, 1510–1518. [Google Scholar] [CrossRef]
  18. Wang, G.; Munoz-Ferreras, J.M.; Gu, C.; Li, C.; Gomez-Garcia, R. Application of linear-frequency-modulated continuous-wave (LFMCW) radars for tracking of vital signs. IEEE Trans. Microw. Theory Tech. 2014, 62, 1387–1399. [Google Scholar] [CrossRef]
  19. Wang, G.; Gu, C.; Inoue, T.; Li, C. A hybrid FMCW-interferometry radar for indoor precise positioning and versatile life activity monitoring. IEEE Trans. Microw. Theory Tech. 2014, 62, 2812–2822. [Google Scholar] [CrossRef]
  20. Charvat, G.L.; Kempel, L.C.; Rothwell, E.J.; Coleman, C.M.; Mokole, E.L. A through-dielectric ultrawideband (UWB) switched-antenna-array radar imaging system. IEEE Trans. Antennas Propag. 2012, 60, 5495–5500. [Google Scholar] [CrossRef]
  21. Browne, K.E.; Burkholder, R.J.; Volakis, J.L. Through-wall opportunistic sensing system utilizing a low-cost flat-panel array. IEEE Trans. Antennas Propag. 2010, 59, 859–868. [Google Scholar] [CrossRef]
  22. Liu, L.; Liu, S. Remote detection of human vital sign with stepped-frequency continuous wave radar. IEEE J. Sel. Top. Appl. Earth Obs. Remote Sens. 2014, 7, 775–782. [Google Scholar] [CrossRef]
  23. Lu, B.; Song, Q.; Zhou, Z.; Wang, H. A SFCW radar for through wall imaging and motion detection. In Proceedings of the 2011 8th European Radar Conference, Manchester, UK, 12–14 October 2011; pp. 325–328. [Google Scholar]
  24. Lu, B.; Song, Q.; Zhou, Z.; Zhang, X. Detection of human beings in motion behind the wall using SAR interferogram. IEEE Geosci. Remote Sens. Lett. 2012, 9, 968–971. [Google Scholar]
  25. Lazaro, A.; Girbau, D.; Villarino, R. Analysis of vital signs monitoring using an IR-UWB radar. Progr. Electromagn. Res. 2010, 100, 265–284. [Google Scholar] [CrossRef] [Green Version]
  26. Sharafi, A.; Baboli, M.; Eshghi, M.; Ahmadian, A. Respiration-rate estimation of a moving target using impulse-based ultra wideband radars. Australas. Phys. Eng. Sci. Med. 2012, 35, 31–39. [Google Scholar] [CrossRef] [PubMed]
  27. Liu, L.; Liu, Z.; Barrowes, B.E. Through-wall bio-radiolocation with UWB impulse radar: Observation, simulation and signal extraction. IEEE J. Sel. Top. Appl. Earth Obs. Remote Sens. 2011, 4, 791–798. [Google Scholar] [CrossRef]
  28. Staderini, E.M. UWB radar in medicine. IEEE AESS Syst. Mag. 2002, 17, 13–18. [Google Scholar] [CrossRef]
  29. Venkatesh, S.; Anderson, C.R.; Rivera, N.V.; Buehrer, R.M. Implementation and analysis of respiration-rate estimation using impulse-based UWB. In Proceedings of the 2005 IEEE Military Communications Conference, Atlantic City, NJ, USA, 17–20 October 2005; pp. 3314–3320. [Google Scholar]
  30. Nezirovic, A. Stationary clutter-and linear-trend suppression in impulse-radar-based respiratory motion detection. In Proceedings of the 2011 IEEE International Conference on Ultra-Wideband (ICUWB), Bologna, Italy, 14–16 September 2011; pp. 331–335. [Google Scholar]
  31. Nezirovic, A.; Yarovoy, A.G.; Ligthart, L.P. Signal processing for improved detection of trapped victims using UWB radar. IEEE Trans. Geosci. Remote Sens. 2009, 48, 2005–2014. [Google Scholar] [CrossRef]
  32. Xu, Y.; Dai, S.; Wu, S.; Chen, J.; Fang, G.Y. Vital sign detection method based on multiple higher order cumulant for ultrawideband radar. IEEE Trans. Geosci. Remote Sens. 2011, 50, 1254–1265. [Google Scholar] [CrossRef]
  33. Zhang, Y.; Chen, F.; Xue, H.; Li, Z.; An, Q.; Wang, J. Detection and identification of multiple stationary human targets via Bio-Radar based on the cross-correlation method. Sensors 2016, 16, 1793. [Google Scholar] [CrossRef] [Green Version]
  34. Lv, H.; Li, W.; Li, Z.; Zhang, Y.; Jiao, T.; Xue, H.; Liu, M.; Jing, X.; Wang, J. Characterization and identification of IR-UWB respiratory-motion response of trapped victims. IEEE Trans. Geosci. Remote Sens. 2014, 52, 7195–7204. [Google Scholar] [CrossRef]
  35. Xu, Y.; Shao, J.; Chen, J.; Fang, G.Y. Automatic detection of multiple trapped victims by ultra-wideband radar. IEEE Geosci. Remote Sens. Lett. 2013, 10, 1498–1502. [Google Scholar] [CrossRef]
  36. Acar, Y.E.; Saritas, I.; Yaldiz, E. An experimental study: Detecting the respiration rates of multiple stationary human targets by stepped frequency continuous wave radar. Measurement 2021, 167, 108268. [Google Scholar] [CrossRef]
  37. Song, Y.; Jin, T.; Dai, Y.; Song, Y.; Zhou, X. Through-wall human pose reconstruction via UWB MIMO radar and 3D CNN. Remote Sens. 2021, 13, 241. [Google Scholar] [CrossRef]
  38. Li, X.; He, Y.; Fioranelli, F.; Jing, X.; Yarovoy, A.; Yang, Y. Human motion recognition with limited radar micro-Doppler signatures. IEEE Trans. Geosci. Remote Sens. 2020, 59, 6586–6599. [Google Scholar] [CrossRef]
  39. Lai, G.; Lou, X.; Ye, W. Radar-Based Human Activity Recognition With 1-D Dense Attention Network. IEEE Geosci. Remote Sens. Lett. 2021, 19, 1–5. [Google Scholar] [CrossRef]
  40. Chen, P.; Guo, S.; Li, H.; Wang, X.; Cui, G.; Jiang, C.; Kong, L. Through-wall human motion recognition based on transfer learning and ensemble learning. IEEE Geosci. Remote Sens. Lett. 2021, 19, 1–5. [Google Scholar] [CrossRef]
  41. Li, H.; Cui, G.; Guo, S.; Kong, L.; Yang, X. Human target detection based on FCN for through-the-wall radar imaging. IEEE Geosci. Remote Sens. Lett. 2020, 18, 1565–1569. [Google Scholar] [CrossRef]
  42. Zhang, J.; Tao, J.; Shi, Z. Doppler-radar based hand gesture recognition system using convolutional neural networks. In Proceedings of the International Conference in Communications, Signal Processing, and Systems, Harbin, China, 14–17 July 2017; pp. 1096–1113. [Google Scholar]
  43. Jia, Y.; Guo, Y.; Song, R.; Wang, G.; Chen, S.; Zhong, X.; Cui, G. ResNet-based counting algorithm for moving targets in through-the-wall radar. IEEE Geosci. Remote Sens. Lett. 2020, 18, 1034–1038. [Google Scholar] [CrossRef]
  44. Hu, J.; Jiang, T.; Cui, Z.; Hou, T. Design of UWB pulses based on Gaussian pulse. In Proceedings of the 2008 3rd IEEE International Conference on Nano/Micro Engineered and Molecular Systems, Sanya, China, 6–9 January 2008; pp. 651–655. [Google Scholar]
  45. Nahar, S.; Phan, T.; Quaiyum, F.; Ren, L.; Fathy, A.E.; Kilic, O. An electromagnetic model of human vital signs detection and its experimental validation. IEEE J. Emerg. Sel. Top. Circuits Syst. 2018, 8, 338–349. [Google Scholar] [CrossRef]
  46. Zetik, R.; Crabbe, S.; Krajnak, J.; Peyerl, P.; Sachs, J.; Thoma, R. Detection and localization of persons behind obstacles using M-sequence through-the-wall radar. In Proceedings of the Sensors, and Command, Control, Communications, and Intelligence (C3I) Technologies for Homeland Security and Homeland Defense V, Orlando, FL, USA, 10 May 2006; p. 6201. [Google Scholar]
  47. Wu, S.; Yao, S.; Liu, W.; Tan, K.; Xia, Z.; Meng, S.; Chen, J.; Fang, G.; Yin, H. Study on a novel UWB linear array human respiration model and detection method. IEEE J. Sel. Top. Appl. Earth Obs. Remote Sens. 2016, 9, 125–140. [Google Scholar] [CrossRef]
  48. Du, G.; Wang, X.; Wang, G.; Zhang, Y.; Li, D. Speech recognition based on convolutional neural networks. In Proceedings of the 2016 IEEE International Conference on Signal and Image Processing (ICSIP), Beijing, China, 13–15 August 2016; pp. 708–711. [Google Scholar]
  49. Dumitru, E.; Christian, S.; Alexander, T.; Dragomir, A. Scalable object detection using deep neural networks. In Proceedings of the IEEE Conference on Computer Vision and Pattern Recognition, Columbus, OH, USA, 23–28 June 2014; pp. 2147–2154. [Google Scholar]
  50. LeCun, Y.; Bengio, Y.; Hinton, G. Deep learning. Nature 2015, 521, 436–444. [Google Scholar] [CrossRef]
  51. Ioffe, S.; Szegedy, C. Batch normalization: Accelerating deep network training by reducing internal covariate shift. In Proceedings of the 32nd International Conference on Machine Learning, Lille, France, 6–11 July 2015; pp. 448–456. [Google Scholar]
  52. Glorot, X.; Bordes, A.; Bengio, Y. Deep sparse rectifier neural networks. In Proceedings of the Fourteenth International Conference on Artificial Intelligence and Statistics, Fort Lauderdale, FL, USA, 11–13 April 2011; pp. 315–323. [Google Scholar]
  53. Wilpon, J.; Rabiner, L. A modified K-means clustering algorithm for use in isolated work recognition. IEEE Trans. Signal Process. 1985, 33, 587–594. [Google Scholar] [CrossRef]
  54. Yang, G.; Ye, S.; Ji, Y.; Zhang, X.; Fang, G. Radiation Enhancement of an Ultrawideband Unidirectional Folded Bowtie Antenna for GPR Applications. IEEE Access 2020, 8, 182218–182228. [Google Scholar] [CrossRef]
Figure 1. Flowchart of the proposed method.
Applsci 12 04720 g001
Figure 2. Pipeline of the proposed CNN architecture for TPOI extraction.
Applsci 12 04720 g002
Figure 3. The block diagram and appearance photo of the used UWB impulse radar: (a) the block diagram and (b) appearance photo.
Applsci 12 04720 g003
Figure 4. The scenarios for dataset collection: (a) Scenario 1: the standard brick wall; (b) Scenario 2: the multi-layer medium; (c) Scenario 3: the actual ruin.
Applsci 12 04720 g004
Figure 5. Raw radar data of the experiment with a single target.
Applsci 12 04720 g005
Figure 6. Results of the experiment with a single target: (a) range-slow-time matrix obtained after step A; (b) TPOIs extracted by CNN.
Applsci 12 04720 g006
Figure 7. Comparison result processed by the method in [34] of the experiment with a single target, where the blue line represents 1D range profile used for detection and the green line represents the normalized correlation.
Applsci 12 04720 g007
Figure 8. Comparison result processed by the method in [35] of the experiment with a single target: (a) range-frequency matrix used for detection; (b) result extracted by the 2D CFAR energy windows.
Applsci 12 04720 g008
Figure 9. Comparison result processed by the method in [36] of the experiment with a single target.
Applsci 12 04720 g009
Figure 10. Schematic diagram of the positions of the multi-target experiment.
Applsci 12 04720 g010
Figure 11. Results of the experiment with multiple targets: (a) range-slow-time matrix obtained after step A; (b) TPOIs extracted by CNN.
Applsci 12 04720 g011
Figure 12. Comparison result processed by the method in [34] of the experiment with multiple targets, where the blue line represents 1D range profile used for detection and the green line represents the normalized correlation.
Applsci 12 04720 g012
Figure 13. Comparison result processed by the method in [35] of the experiment with multiple targets: (a) range-frequency matrix used for detection; (b) result extracted by the 2D CFAR energy windows.
Applsci 12 04720 g013
Figure 14. Comparison result processed by the method in [36] of the experiment with multiple targets.
Applsci 12 04720 g014
Figure 15. Results of Experiment 5.1: (a) range-slow-time matrix obtained after step A; (b) TPOIs extracted by CNN.
Applsci 12 04720 g015
Figure 16. Results of Experiment 5.2: (a) range-slow-time matrix obtained after step A; (b) TPOIs extracted by CNN.
Applsci 12 04720 g016
Figure 17. Results of Experiment 5.3: (a) range-slow-time matrix obtained after step A; (b) TPOIs extracted by CNN.
Applsci 12 04720 g017
Figure 18. Results of Scenario 2: (a) range-slow-time matrix obtained after step A; (b) TPOIs extracted by CNN.
Applsci 12 04720 g018
Figure 19. Results of Scenario 3: (a) range-slow-time matrix obtained after step A; (b) TPOIs extracted by CNN.
Applsci 12 04720 g019
Table 1. Detailed overall CNN architecture parameters.
IndexInput SizeOperatorKernel SizeStridePaddingOutput Size
11 × 800 × 600Conv2d3 × 31 × 11 × 164 × 800 × 600
264 × 800 × 600Conv2d3 × 31 × 11 × 1128 × 800 × 600
3128 × 800 × 600Conv2d3 × 31 × 11 × 1256 × 800 × 600
4256 × 800 × 600Conv2d3 × 31 × 11 × 1128 × 800 × 600
5128 × 800 × 600Conv2d3 × 31 × 11 × 164 × 800 × 600
664 × 800 × 600Conv2d3 × 31 × 11 × 11 × 800 × 600
71 × 800 × 600Pooling---1 × 800 × 1
Table 2. Parameters of the developed UWB impulse radar.
ParameterValue
Pulse waveformGaussian pulse
−10 dB bandwidth400 MHz
Pulse repeated frequency32 kHz
Average number128
Fast-time sampling rate16 GHz
Slow-time sampling rate15 Hz
Sampling points4096
Table 3. Results of 50 sample data processed by different methods.
MethodMissed Alarm RateAverage Range Error
The method in [34]65%15 cm
The method in [35]39%17 cm
The method in [36]44%15 cm
The proposed method3%6 cm
Table 4. Calculation time of different methods.
MethodCalculation Time
The method in [34]0.18 s
The method in [35]0.42 s
The method in [36]0.12 s
The proposed method0.14 s
Table 5. Extracted results for experiments with different target intervals.
ExperimentActual RangeExtracted Range
Experiment 5.15.00 m, and 6.00 m4.94 m, and 6.07 m
Experiment 5.25.50 m, and 6.00 m5.50 m, and 6.06 m
Experiment 5.35.70 m, and 6.00 m5.88 m
Publisher’s Note: MDPI stays neutral with regard to jurisdictional claims in published maps and institutional affiliations.

