Article

A Method to Improve the Accuracy of Pavement Crack Identification by Combining a Semantic Segmentation and Edge Detection Model

1
Yunnan Key Laboratory of Disaster Reduction in Civil Engineering, Faculty of Civil Engineering and Mechanics, Kunming University of Science and Technology, Kunming 650500, China
2
Faculty of Civil Aviation and Aeronautics, Kunming University of Science and Technology, Kunming 650500, China
3
Yunnan Jiantou Boxin Engineering Construction Center Test Co., Ltd., Kunming 650217, China
*
Author to whom correspondence should be addressed.
Appl. Sci. 2022, 12(9), 4714; https://doi.org/10.3390/app12094714
Submission received: 24 March 2022 / Revised: 1 May 2022 / Accepted: 4 May 2022 / Published: 7 May 2022
(This article belongs to the Topic Artificial Intelligence (AI) Applied in Civil Engineering)

Abstract

:
In recent years, deep learning-based detection methods have been applied to pavement crack detection. In practical applications, surface cracks are divided into inner and edge regions for pavements with rough surfaces and complex environments. This creates difficulties in the image detection task. This paper is inspired by the U-Net semantic segmentation network and holistically nested edge detection network. A side-output part is added to the U-Net decoder that performs edge extraction and deep supervision. A network model combining two tasks that can output the semantic segmentation results of the crack image and the edge detection results of different scales is proposed. The model can be used for other tasks that need both semantic segmentation and edge detection. Finally, the segmentation and edge images are fused using different methods to improve the crack detection accuracy. The experimental results show that mean intersection over union reaches 69.32 on our dataset and 61.05 on another pavement dataset group that did not participate in training. Our model is better than other detection methods based on deep learning. The proposed method can increase the MIoU value by up to 5.55 and increase the MPA value by up to 10.41 when compared to previous semantic segmentation models.

1. Introduction

Highway pavements are affected by many factors such as the natural environment, load conditions, structural combinations, materials, construction techniques, and technical levels, which can produce various types of distress. With the construction of highways, pavement maintenance has begun increasing sharply. Accurate pavement distress detection results can provide reliable and effective technical support for pavement maintenance management decision making, improve highway pavement service performance, and reduce traffic accidents. However, traditional manual detection methods are often affected by subjective judgment in detecting highway pavement distress. There were considerable errors and low detection efficiencies. Therefore, automatic distress recognition and feature measurement of collected pavement images are the mainstream means of pavement detection.
The adoption of information management technology is an inevitable way to improve the level of highway maintenance management and realize efficient and orderly organization and management. For example, for common cracks on the highway, the development of an effective pavement crack identification algorithm can evaluate the pavement condition in advance and provide the basic data for maintenance decision making for the highway maintenance management department. The commonly used equipment for collecting pavement crack information include digital cameras, depth cameras, and lasers. Many researchers have studied pavement performance by using the images taken by digital cameras. At this stage, it has been applied to pavement crack detection [1], asphalt mixture crack detection [2], and concrete elements deformation tests [3]. Many researchers have recently begun to apply depth imaging technology to pavement detection engineering [4,5,6]. Unlike the traditional 2D camera, the depth camera can obtain depth information and provide the color image details in the 2D camera [7]. In addition, laser scanning is often used to detect pavement damage [8,9]. Laser scanning technology was used to extract cracks in concrete [10]. Although the depth camera and laser scanner can extract the three-dimensional information of the pavement and more accurately identify the distresses. The use of these two devices is limited due to the high purchase cost of the equipment, the complex post-processing process of 3D data, and inconvenient daily maintenance.
Pavement cracks usually appear as curved configurations with different widths in an image. They can be characterized by the edge detection and image segmentation methods in computer vision. In the ideal case, for such deep cracks with good continuity and no other noise interference, the traditional method can efficiently segment the crack from the image. Lu et al. [11]. proposed a new double-threshold algorithm to obtain detailed information on the crack number and width. Peng et al. [12]. proposed a triple-threshold pavement crack detection method using a random structured forest. However, in an actual detection task, different types of pavement types, shadows, and foreign objects will lead to a decline in the detection accuracy of the traditional methods. In addition to the automatic threshold segmentation method, there are crack detection methods based on spatial filtering and wavelet analysis; however, they have some disadvantages such as high requirements for equipment, complex operation, and environmental impact [13,14,15,16].
In recent years, convolutional neural networks (CNNs) have been proposed and applied to computer vision tasks such as image classification [17,18,19], target detection [20,21,22], and semantic segmentation [23,24,25]. Simultaneously, a CNN-based method has also been applied to pavement distress detection. Hoanga et al. [26] demonstrated the performance of the traditional and intelligent methods based on CNN in the pavement crack detection task. The experimental results show that the CNN-based crack detection methods are promising alternatives to regular methods. Majidifard et al. [27] developed a hybrid model by integrating the Yolo and U-Net models to classify pavement distresses and simultaneously quantify their severity. Jia et al. [28]. proposed a method based on Deeplabv3+ and a pixel-level quantization algorithm for crack detection. Park et al. [29] The CNN composed segmentation and classification modules to extract pavement cracks and remove the elements interfering in the image. Flah et al. [30] proposed a nearly automated detection model based on image processing and deep learning to detect defects in areas where concrete structures usually cannot enter. In summary, traditional methods based on digital image processing have been widely used in pavement damage detection and have laid a theoretical foundation for methods based on deep learning. Methods based on deep learning have strong potential, are more accurate and convenient than traditional methods, and will be the mainstream methods for detecting pavement distress in the future.
In the pavement crack detection task, the semantic segmentation model can be used to calculate the area occupied by cracks. It predicts the cracks pixel-by-pixel and segments the cracks from the image. The existing neural network models perform very well in the defect detection task, similar to the pavement crack detection task. For example, the U-Net semantic segmentation network was applied to the defect detection task in the industry [31,32,33,34]. Inspired by the above methods and the U-Net network structure, we herein improve the U-Net convolutional neural network and apply it to crack identification in complex pavement conditions. When measuring the characteristics of cracks, calculating the width is necessary. The width calculation is related to the edge line, and the edge detection algorithm is used to extract it. Classical edge detection algorithms in computer vision include the Roberts operator, Sobel operator, and Canny operator [35]. These classical algorithms have also been applied to crack detection tasks. Wang et al. [36] designed a local adaptive algorithm for Otsu threshold segmentation and proposed an improved Sobel operator to extract crack edge lines. Qiang et al. [37] proposed an adaptive Canny edge detection algorithm that achieved good results in crack detection. In addition to these modified traditional algorithms, some edge detection algorithms based on deep learning are also present.
Holistically nested edge detection (HED) [38] and side-output residual networks (SRN) [39] are two relatively new edge detection networks, and both adopt the method of deep supervision to improve the training effect. Liu et al. [40] continued the idea of deep supervision and proposed a Deepcrack for crack detection in multiple scenes. Similar to Heider et al. [41], by combining the two networks of HED and U-Net, we proposed an end-to-end method for coast and coastline detection. Traditional edge detection algorithms are easily disturbed by environmental factors. Especially in the pavement surface images, factors such as rough surfaces, vehicle shadows, water stains, and uneven lighting brightness affect the edge detection accuracy. In addition, the edge detection algorithm cannot recognize the meaning of objects inside and outside the edge line; however, the combination of semantic segmentation and edge detection results can solve this problem.
Therefore, a fusion model is proposed to segment cracks and simultaneously identify crack edge lines. The model uses a U-Net structure for image segmentation. It continues the idea of deep supervision in the HED and SRN networks. As the model uses the side-output method for edge line detection, it is called a side-output U-Net (SoUNet).
The remainder of this paper is organized as follows. The second section presents the proposed network model and the evaluation indicators in detail. The third section describes the collection and production of data and introduces the process and details of training. Section four provides the numerical results and intuitive prediction results. Our model was also compared with existing methods. The final section provides concluding statements.

2. Proposed Method

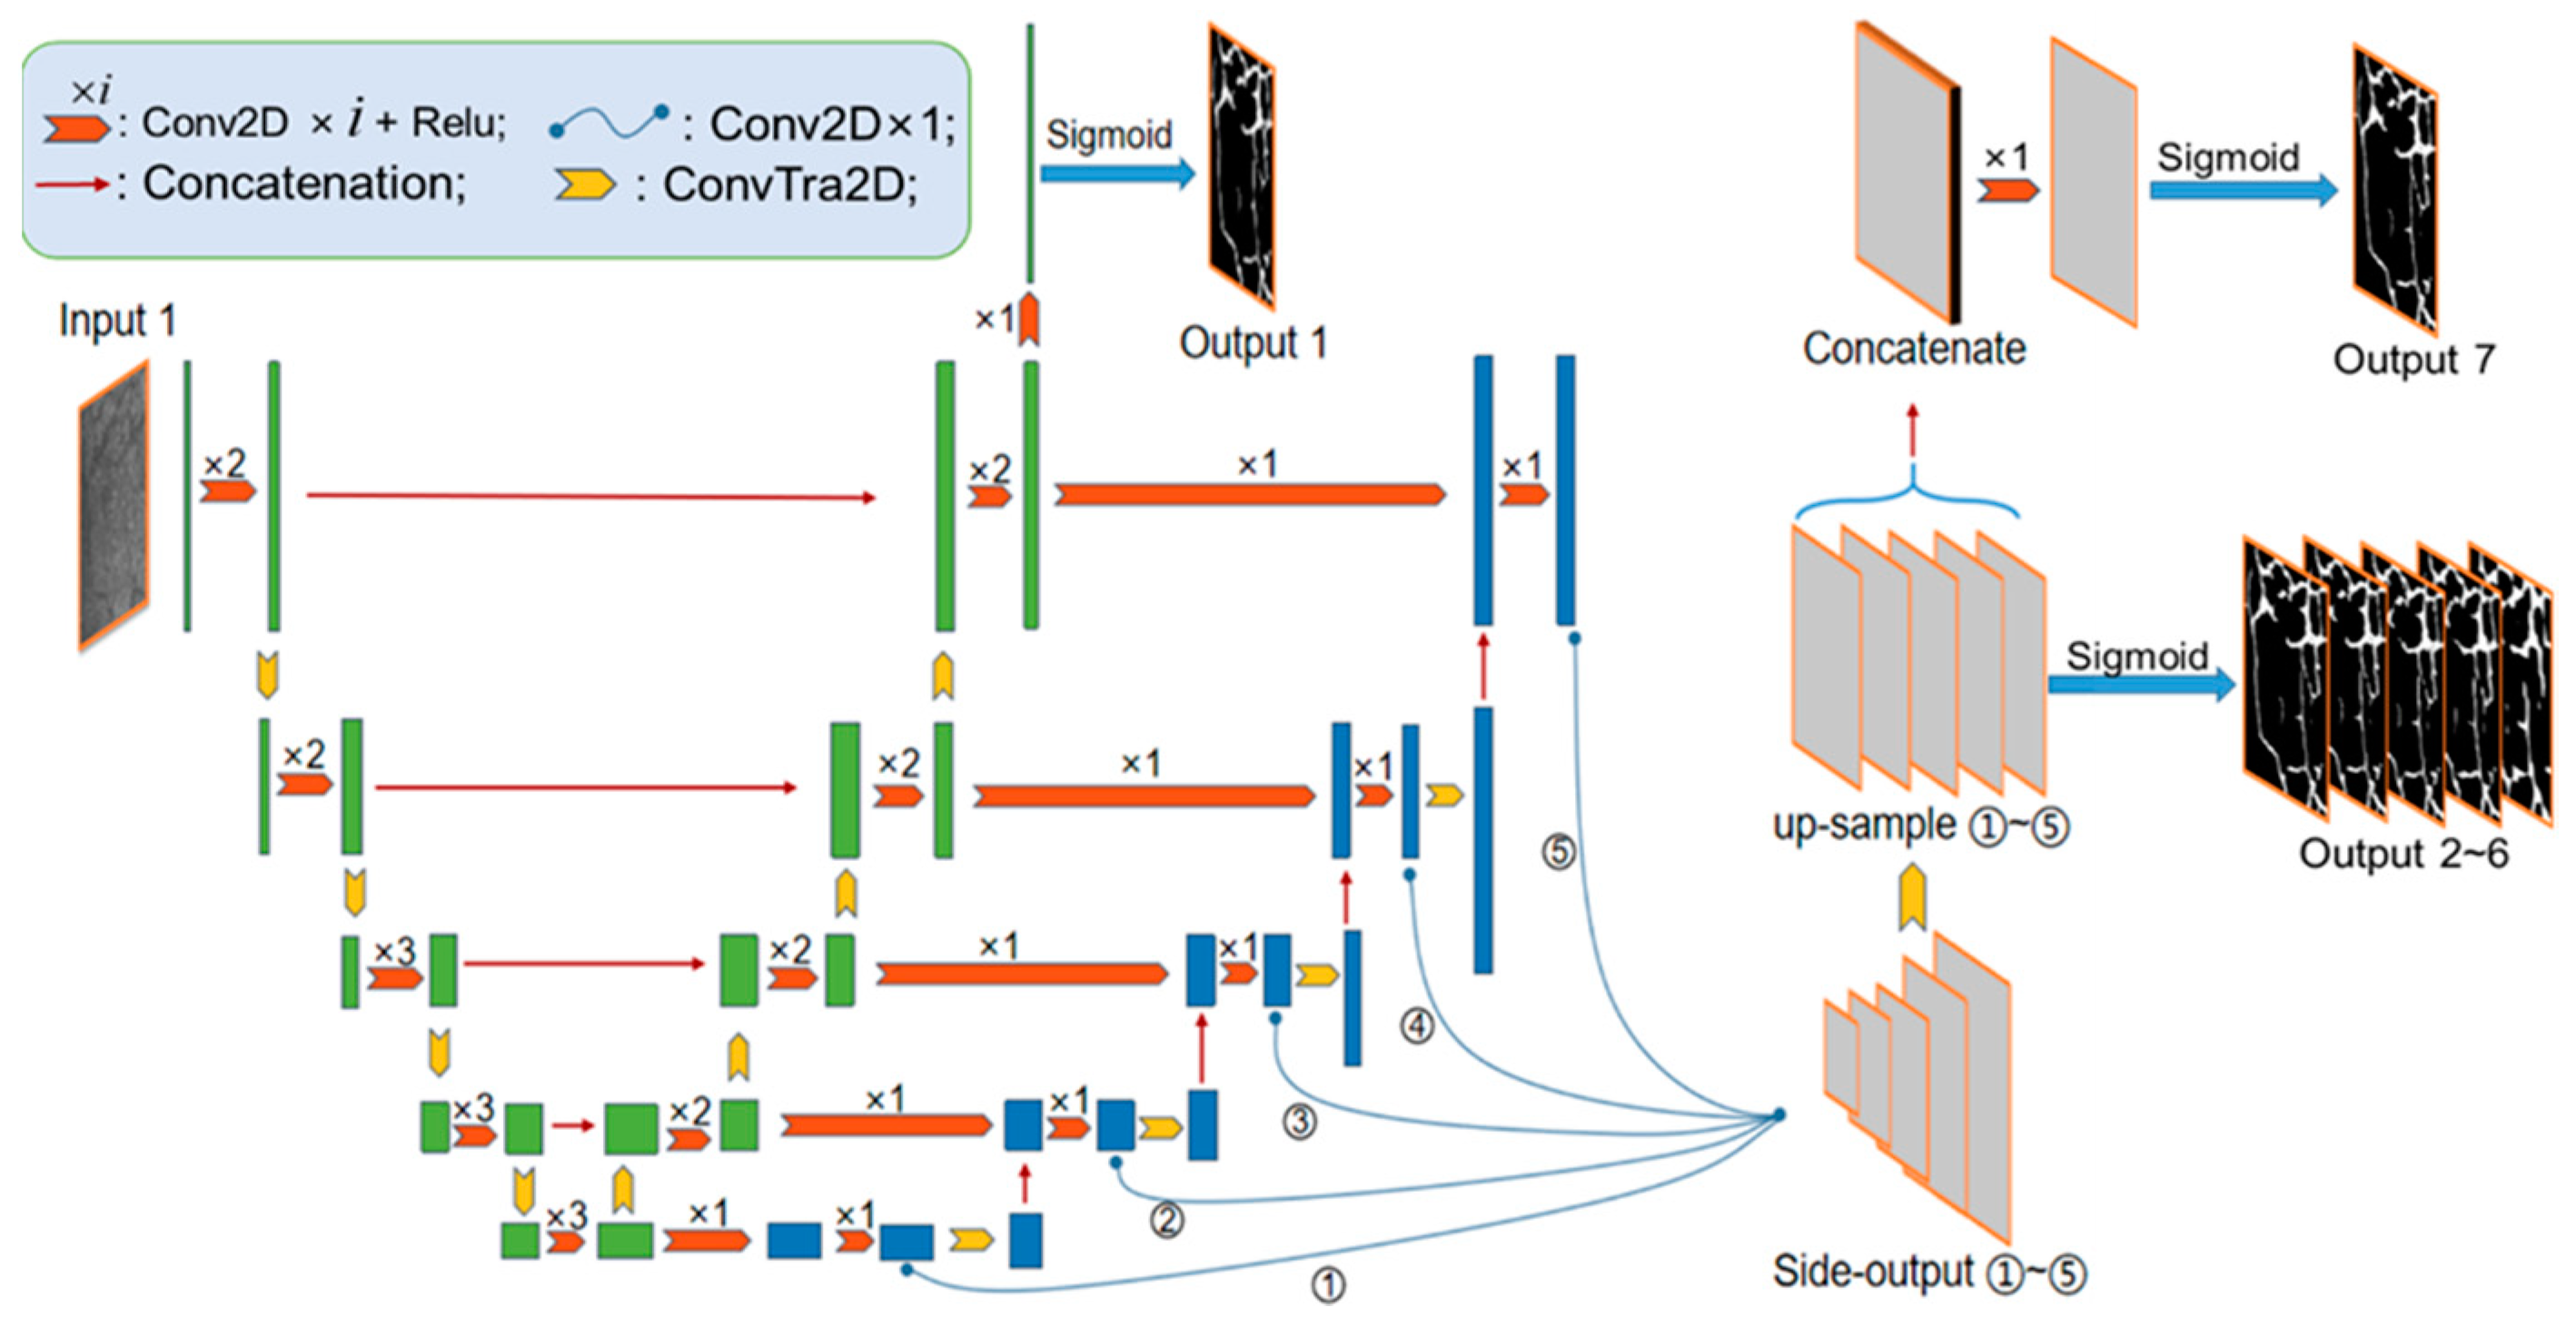
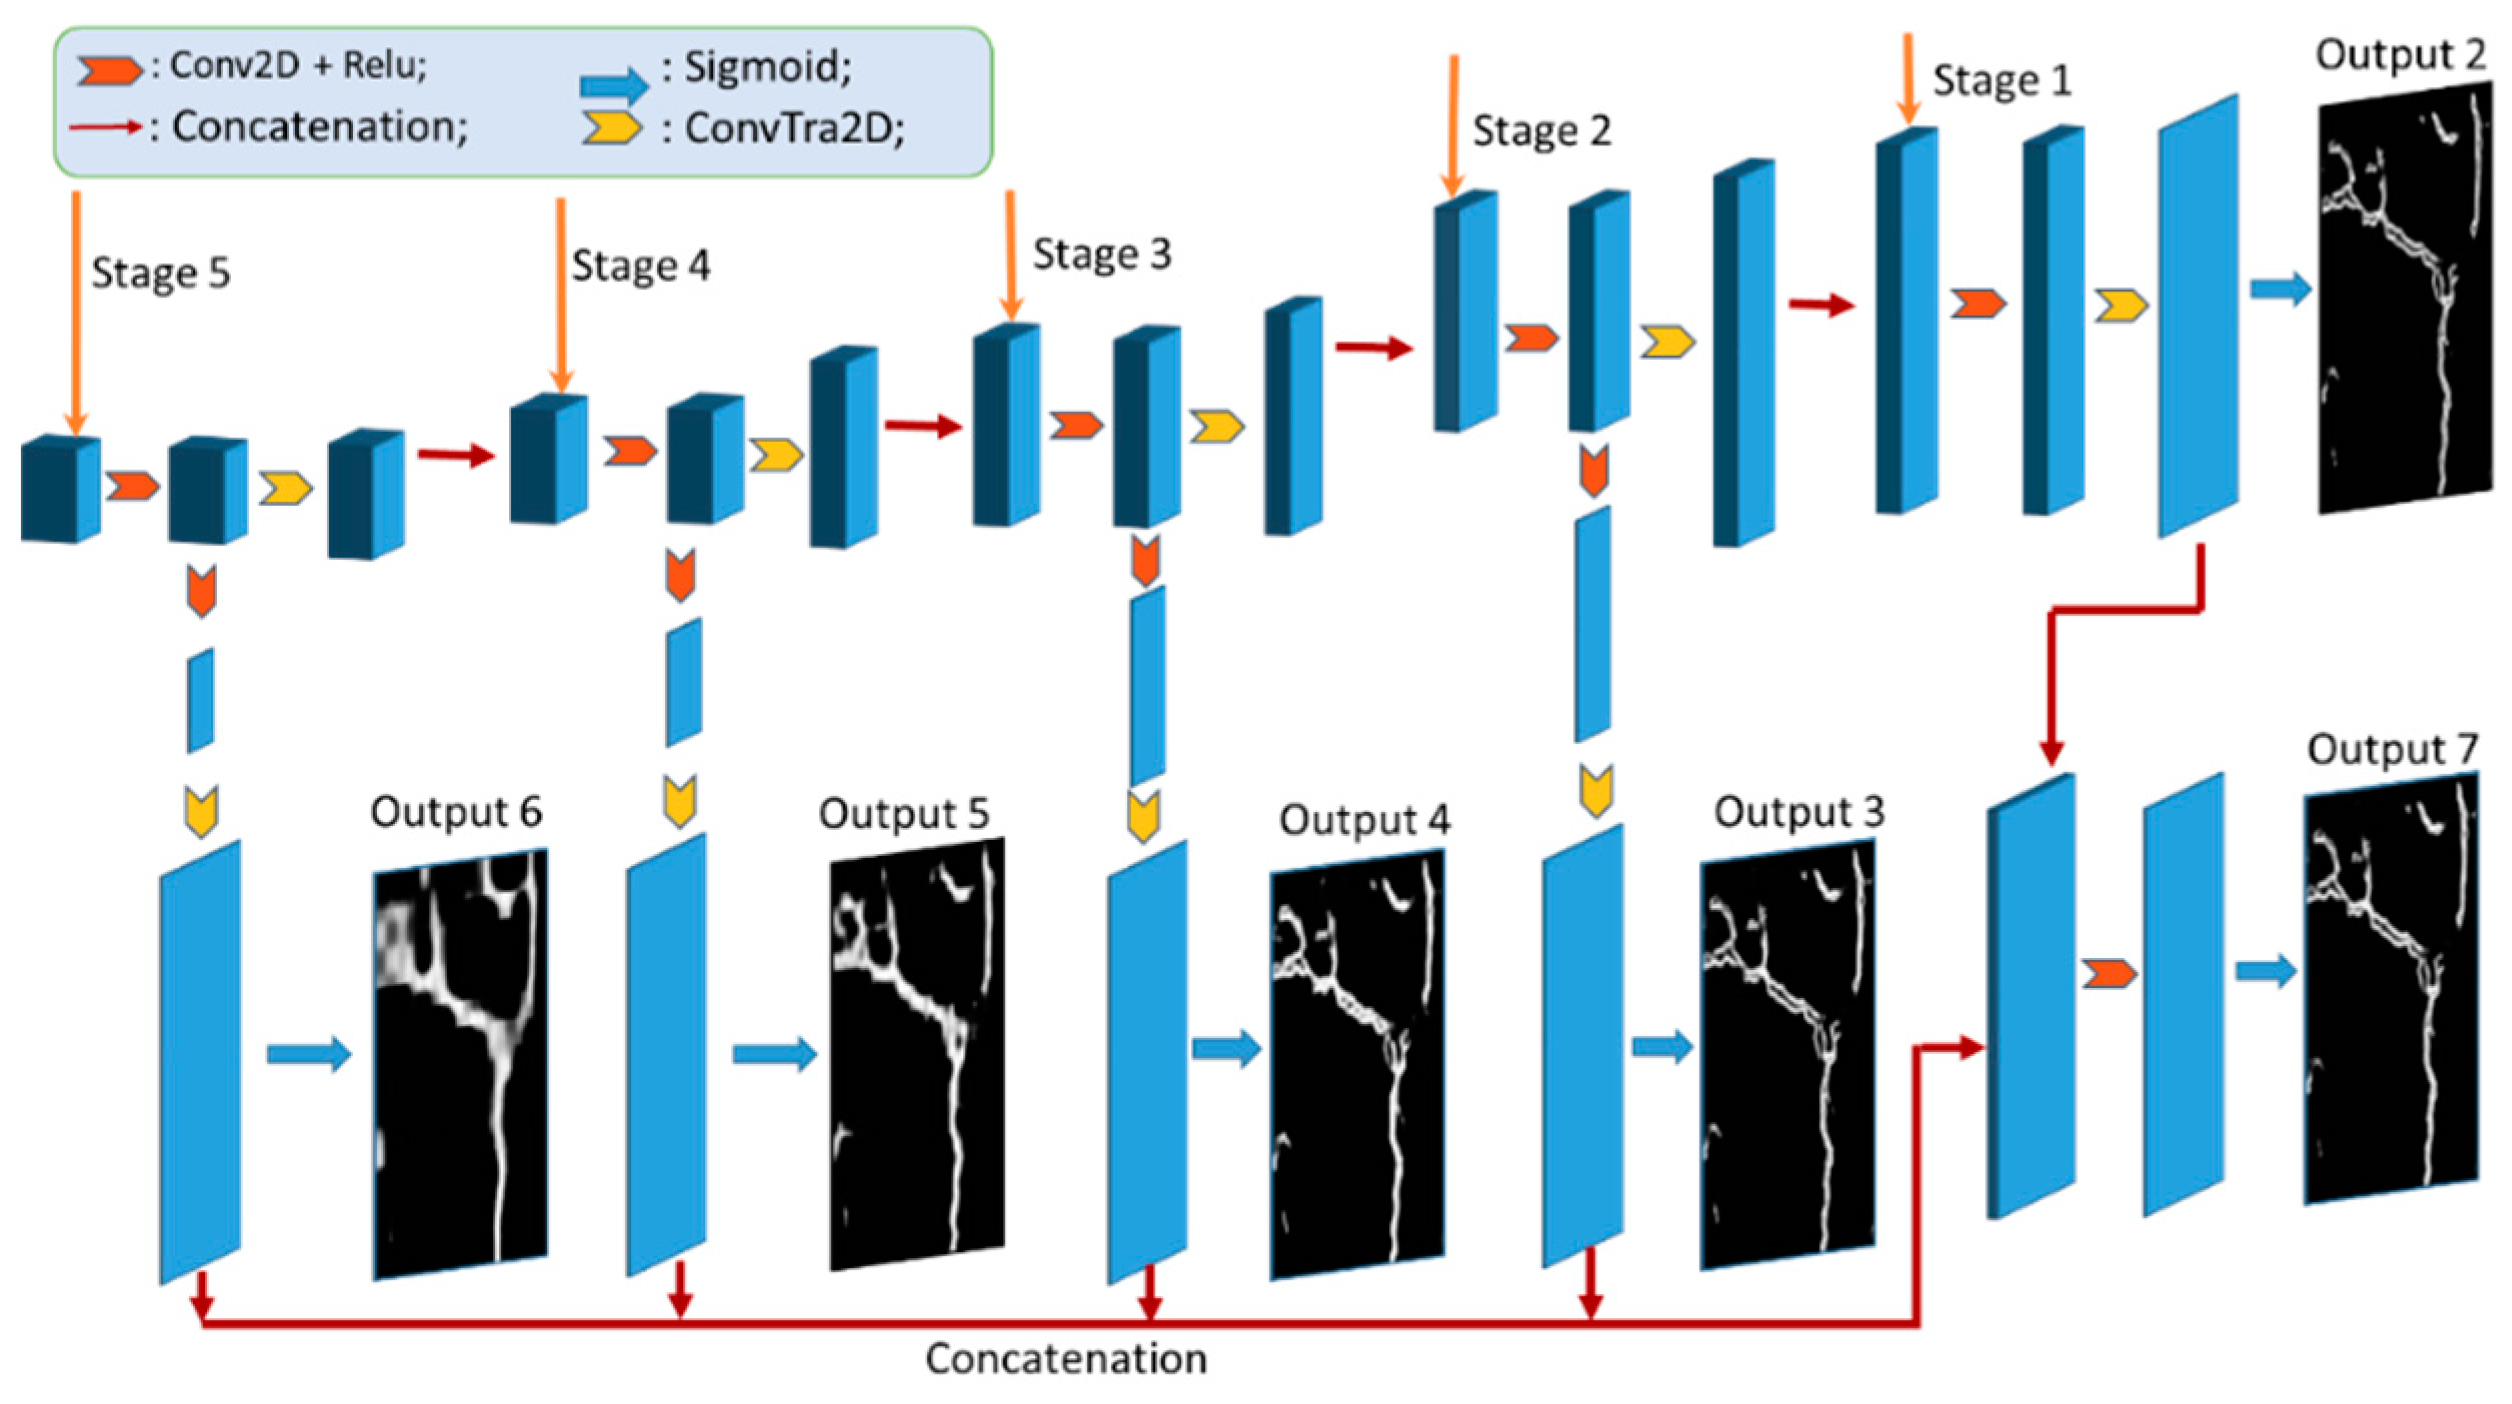
2.1. Model Architecture

Based on the U-Net semantic segmentation network model, we herein improve it and add a side-output module. We call the network model SoUNet. The traditional U-Net has a residual connected encoder–decoder architecture. The encoder part can obtain the low-resolution feature map after downsampling the high-resolution input image many times. This part is mainly used to extract the image features, and each layer is called the feature extraction layer. The decoder part includes several operations of feature concatenation, convolution, and deconvolution. It enlarges the low-resolution image outputted by the encoder through deconvolution, concatenates the same resolution image outputted by each feature extraction layer, and finally outputs the binary image through activation.
The structure of SoUNet is divided into two parts: the basic U-Net structure and the side-output structure. The structure of the network is shown in Figure 1. The first part is a semantic segmentation task. We removed the last 3 layers of VGG16 and used the first 13 layers as the encoder, which contained 13 convolution layers and 4 max-pooling layers. The max-pooling layer can downsample high-resolution images into low-resolution images, and there are five resolutions from high to low. The max-pooling layer enables the network model to learn semantic features at different resolutions and improve the learning efficiency of the model. The decoder includes nine convolution layers and four deconvolution layers. The deconvolution layer can restore the low-resolution feature map to a high-resolution one, and the feature map of the same resolution requires feature fusion in the decoder. In the entire U-Net structure, the kernel size of each convolution layer and deconvolution layer was set to 3 × 3. The rectified linear unit (Relu) was used as the activation function after the convolution layer. Only the last convolution layer uses a 1 × 1 kernel size, followed by the sigmoid activation function layer. The sigmoid function activates the input image after passing through the encoder–decoder structure. The final output image is output 1, and its size is the same as that of the input image. Output 1 is the result of the semantic segmentation task and is the probability map. The value of each pixel is between 0 and 1, indicating the probability that the pixel belongs to a category. The area with a high pixel value is a crack, and the area with a low pixel value is the background. We used 0.5 as the global threshold to transform the obtained probability map into a binary image.
The second part of SoUNet is the side-output module, which performs the edge detection task, as shown in Figure 2. We extract the feature maps of different resolutions in the decoder and make them pass through two convolution layers of 3 × 3 kernel size. After enlarging the size, the lower-resolution feature map was deconvoluted and fused with the higher-resolution feature map. The feature maps of five resolutions were obtained by convolution, and then they were processed by convolution with a 1 × 1 kernel size. The feature map of each resolution was restored to the original image size after the deconvolution operation. Therefore, the side-output module was divided into five stages, corresponding to five feature maps of different scales. Five types of feature maps with the original size are sent to the sigmoid function for activation, and five images are denoted as Outputs 2–6. In addition, the feature maps of the five resolutions are fused into one size. It is sent to the sigmoid activation function after it passes through the convolution layer with a 1 × 1 kernel size. Finally, output the image called Output 7. The maximum ODS value was taken as the segmentation threshold to generate a binary image.
In this paper, we introduce a batch normalization (BN) layer [42] into the network architecture. When the depth of the network model gradually deepens, the model is more sensitive to changes in hyperparameters, and the model becomes more challenging to train. However, the BN operation enables the model to be trained with a large learning rate. It reduces the requirements of parameter initialization, decays the oscillation of the loss function, and accelerates the training process. The ReLU function is used as the activation function in each convolution block of the middle architecture. The network was constructed in the order of convolution layer, BN layer, and ReLU layer.
By observing the pixel value distribution of the original crack image and the labeled image, it was observed that most cracks were composed of internal and edge areas. The inspectors captured photographs of pavement cracks with a monocular camera, which was mounted at the rear of the detection vehicle and had a fixed shooting distance and angle. Therefore, image quality is easily affected by the pavement environment. Identifying the crack width and length for road sections with limited daylighting conditions and rough surfaces is difficult. The crack gradually transits from the edge area to the internal area of the image. This means that the crack is composed of the inside and the edge. As shown in Figure 3, the cracks affected by environmental factors are divided into two distinct areas.
SoUNet can output both segmentation results and edge line results for the input image. The linear fusion of the two results can effectively improve image segmentation accuracy. Output 1 is the crack segmentation image, and Outputs 2–7 are the crack edge line images. The detection accuracy can be improved by linear fusion of Output 1 and Outputs 2–7, respectively. In addition, the refinement method of guided filtering can improve the identification accuracy of the network [41,43]. Output 1 and Output 3 are the input image and guide image, respectively, and it sets the parameters of the guide filter as the kernel radius r = 5 and the penalty ε = 1 × 10 6 . Therefore, the following three methods must be considered. These are (1) adding a BN layer to the network, (2) linear fusion of output results, and (3) processing the output results via guided filtering. We compared the segmentation accuracy of these methods in Section 4.2.

2.2. Loss Function

The purpose of image segmentation is to segment the cracks from the background. In the labeled image, the pixel value of the crack is 1, and the pixel value of the background is 0. It outputs the probability that each pixel is a crack after the input image passes through the encoder and decoder. The network model is more likely to extract the background in the training process because the area of the crack accounts for a small proportion of the entire image, which is less than 10% in most images. The imbalance of categories leads to a decline in the segmentation effect. We apply the loss function in HED [38] that can self-adaptively balance positive and negative samples. This cross-entropy loss function with category balance is defined by Equation (1):
L ( y ^ ) = β j Y log y ^ j ( 1 β ) j Y + log ( 1 y ^ j )  
The predicted pixel is y ^ for a single-input image. There are β = | Y + | | Y | and 1 β = | Y | | Y | on the corresponding labeled image.   | Y + | and | Y | represent the pixels of the crack and background areas, respectively, and | Y | represents the total number of pixels. This loss function can be used for segmentation and edge detection tasks, which are unbalanced categories.

2.3. Metrics

In the field of computer vision, MIoU and MPA have extensively used evaluation indicators for semantic segmentation tasks. Many conventional image segmentation algorithms use the mean intersection over union (MIoU) and the mean pixel accuracy (MPA) as evaluation indicators [23,24,25,34,44,45,46].
Accuracy indicators adopted in the training process: The MIoU) can be used as the evaluation metrics for the image segmentation task of unbalanced category samples. It is also an accuracy indicator for monitoring the training process, as shown in Equation (2):
M I o U = 1 k + 1 i = 0 k N i i j = 0 k N i j + j = 0 k N j i N i i  
The intersection union (IoU) is the ratio of the overlapping part to the merged part of the two regions. This is a general measurement method for semantic segmentation tasks. k + 1 is defined as the number of categories to be classified, where   k + 1 is 2 (the types include the fracture area and background area). N i i is the number of pixels that are predicted correctly, N i j is the number of pixels that class i is predicted as class j , and N is the total number of pixels. We use pixel error to monitor the training process for the edge detection task, as shown in Equation (3):
P i x e l   E r r o r = i = 0 k j = 0 k N i j N   ( i j )  
Other accuracy indicators: After the model was trained, the prediction accuracy was evaluated on the test set. In addition to using the MIoU evaluation for crack segmentation results, the MPA can also be used. It calculates the average value of the percentage of correctly predicted pixels for each category, as shown in Equation (4):
M P A = 1 k + 1 i = 0 k N i i j = 0 k N i j  
We use OIS-F and ODS-F to evaluate the boundary detection results. The training process and training results will be evaluated and presented in Section 3.4 and Section 4.2, respectively.

3. Experiment

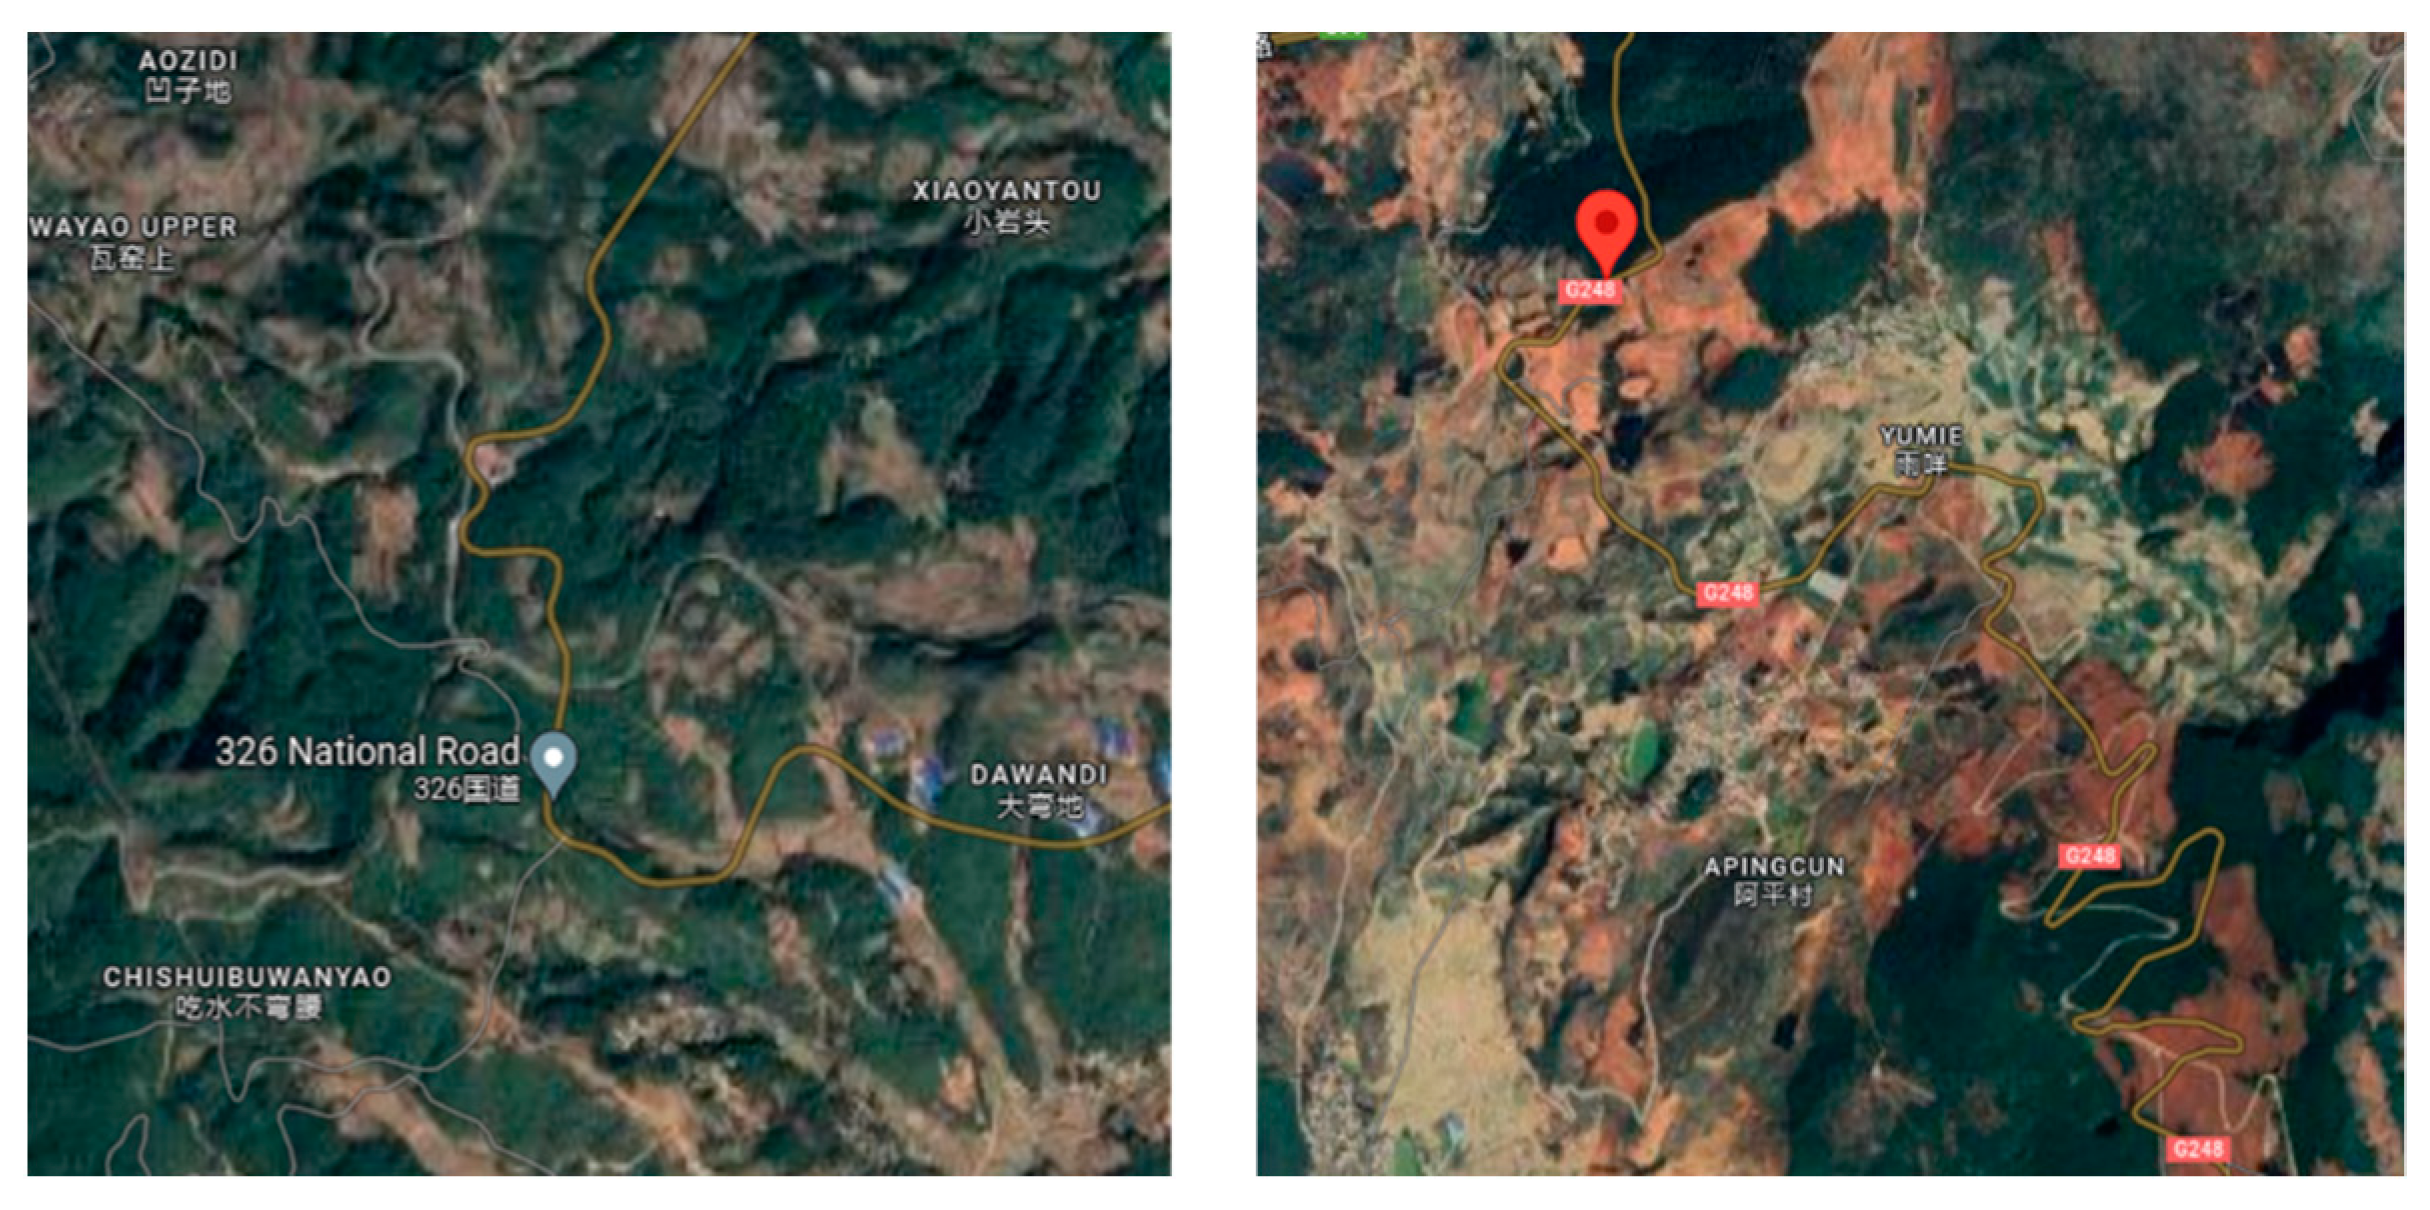
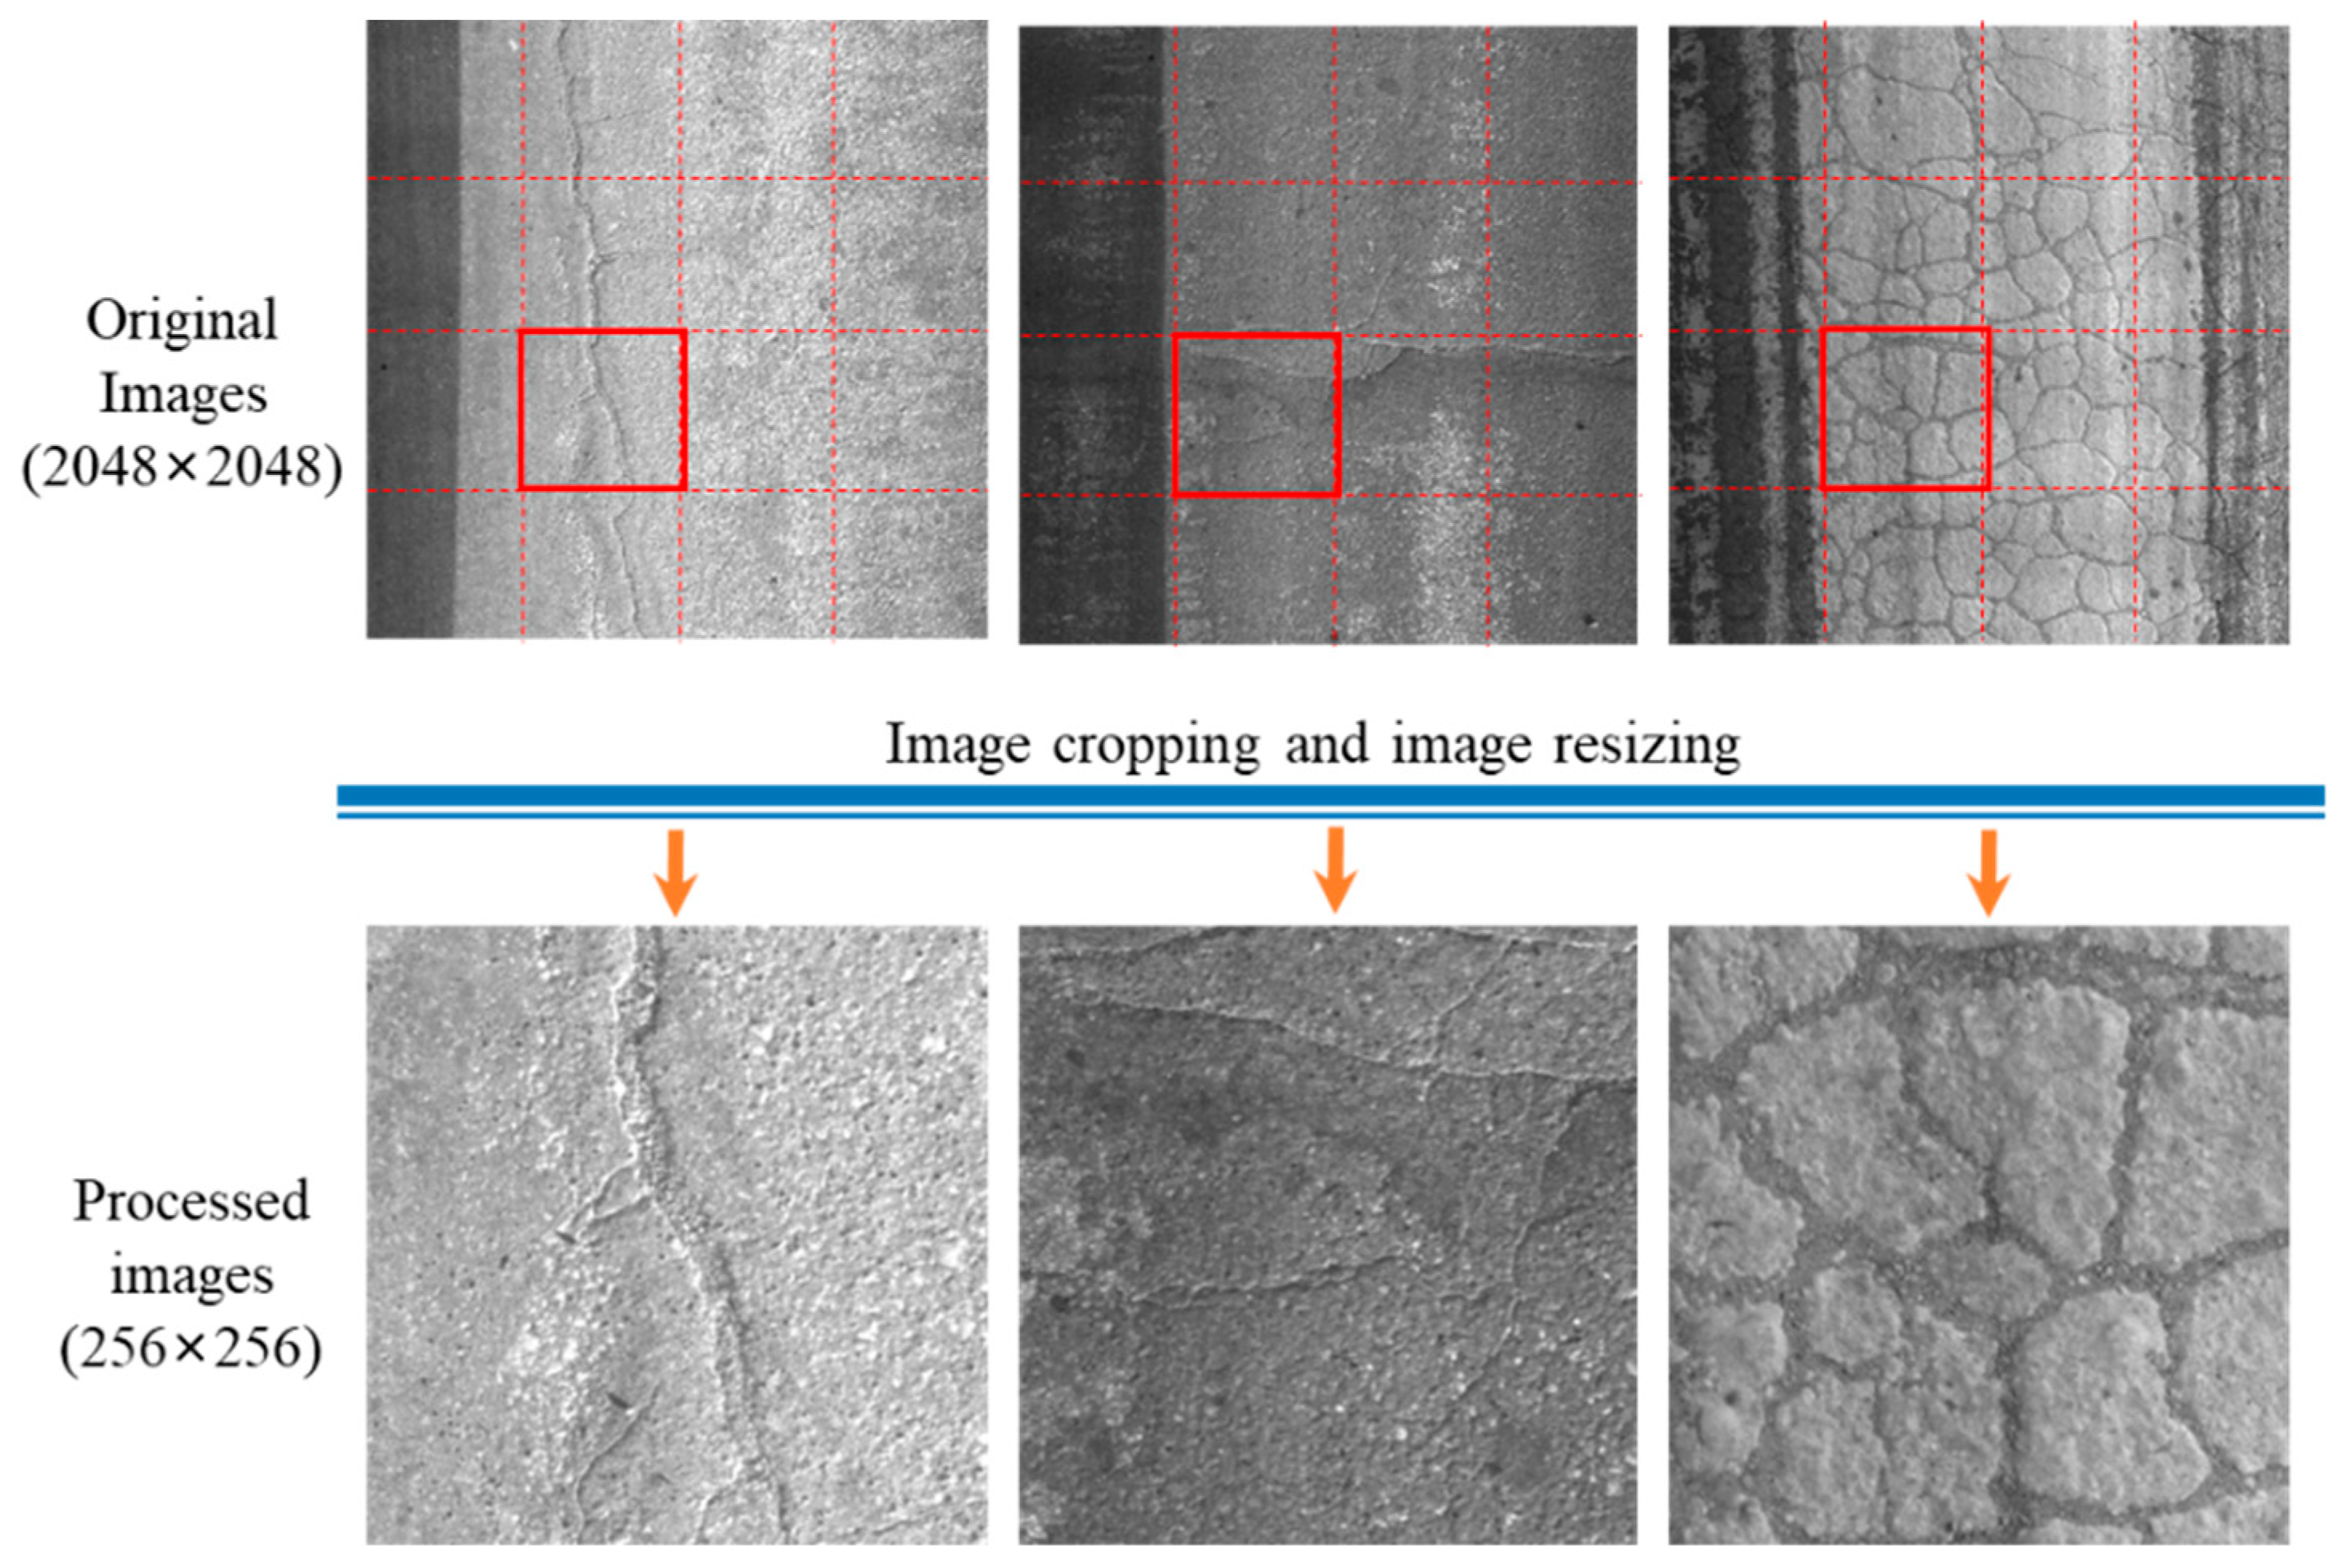
3.1. Image Collection
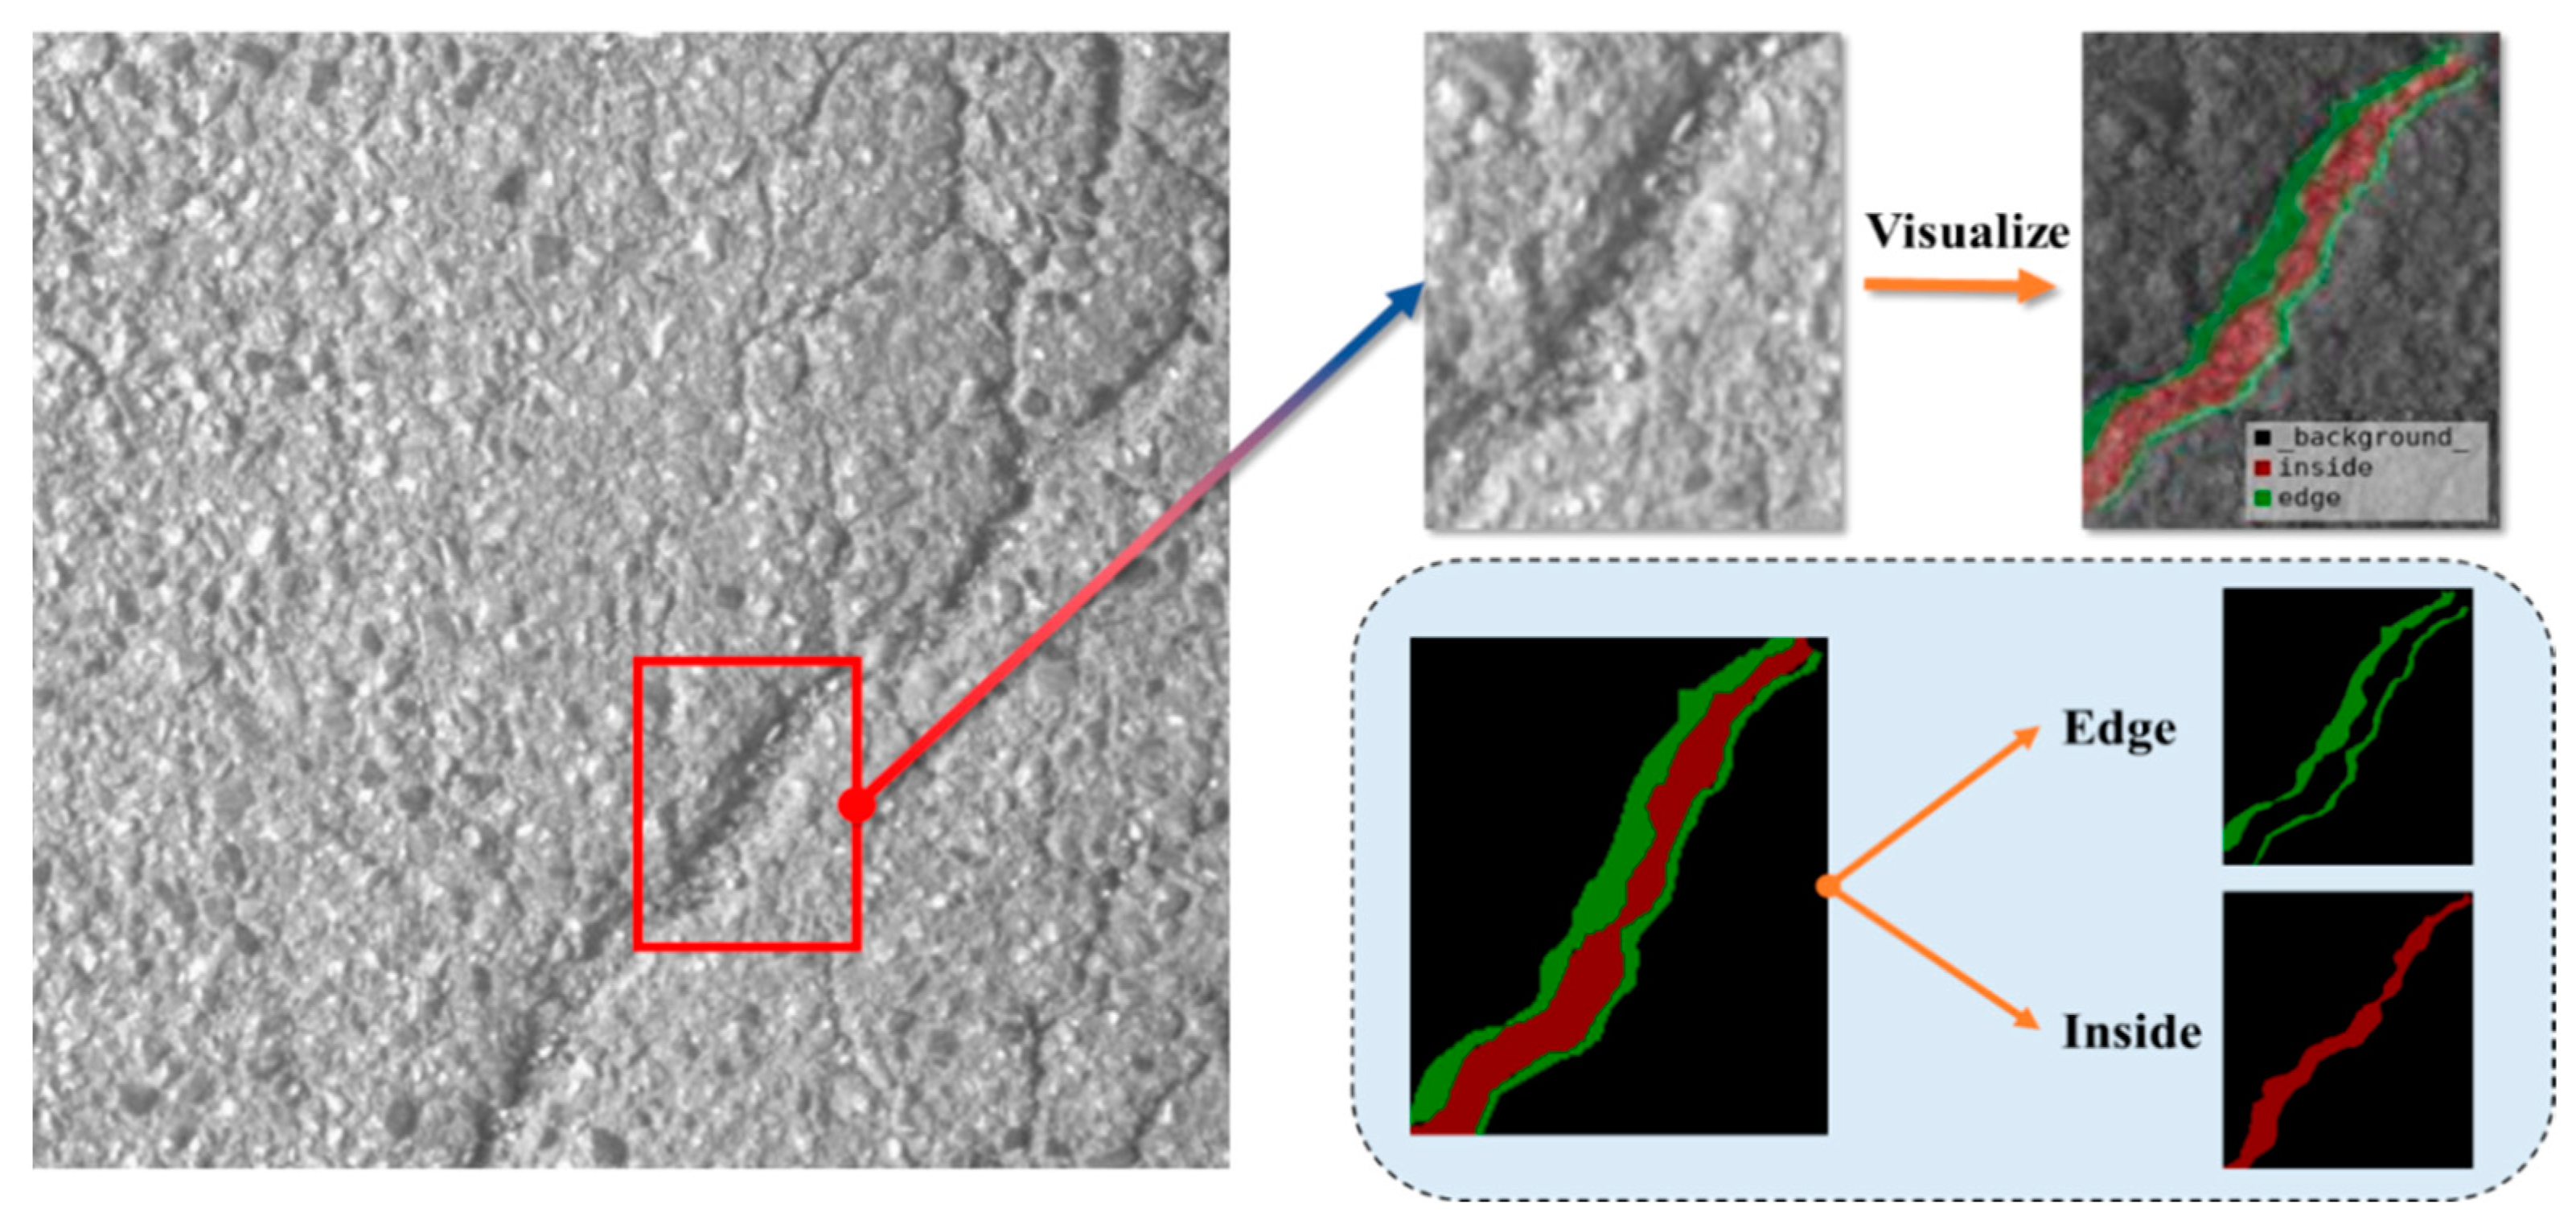
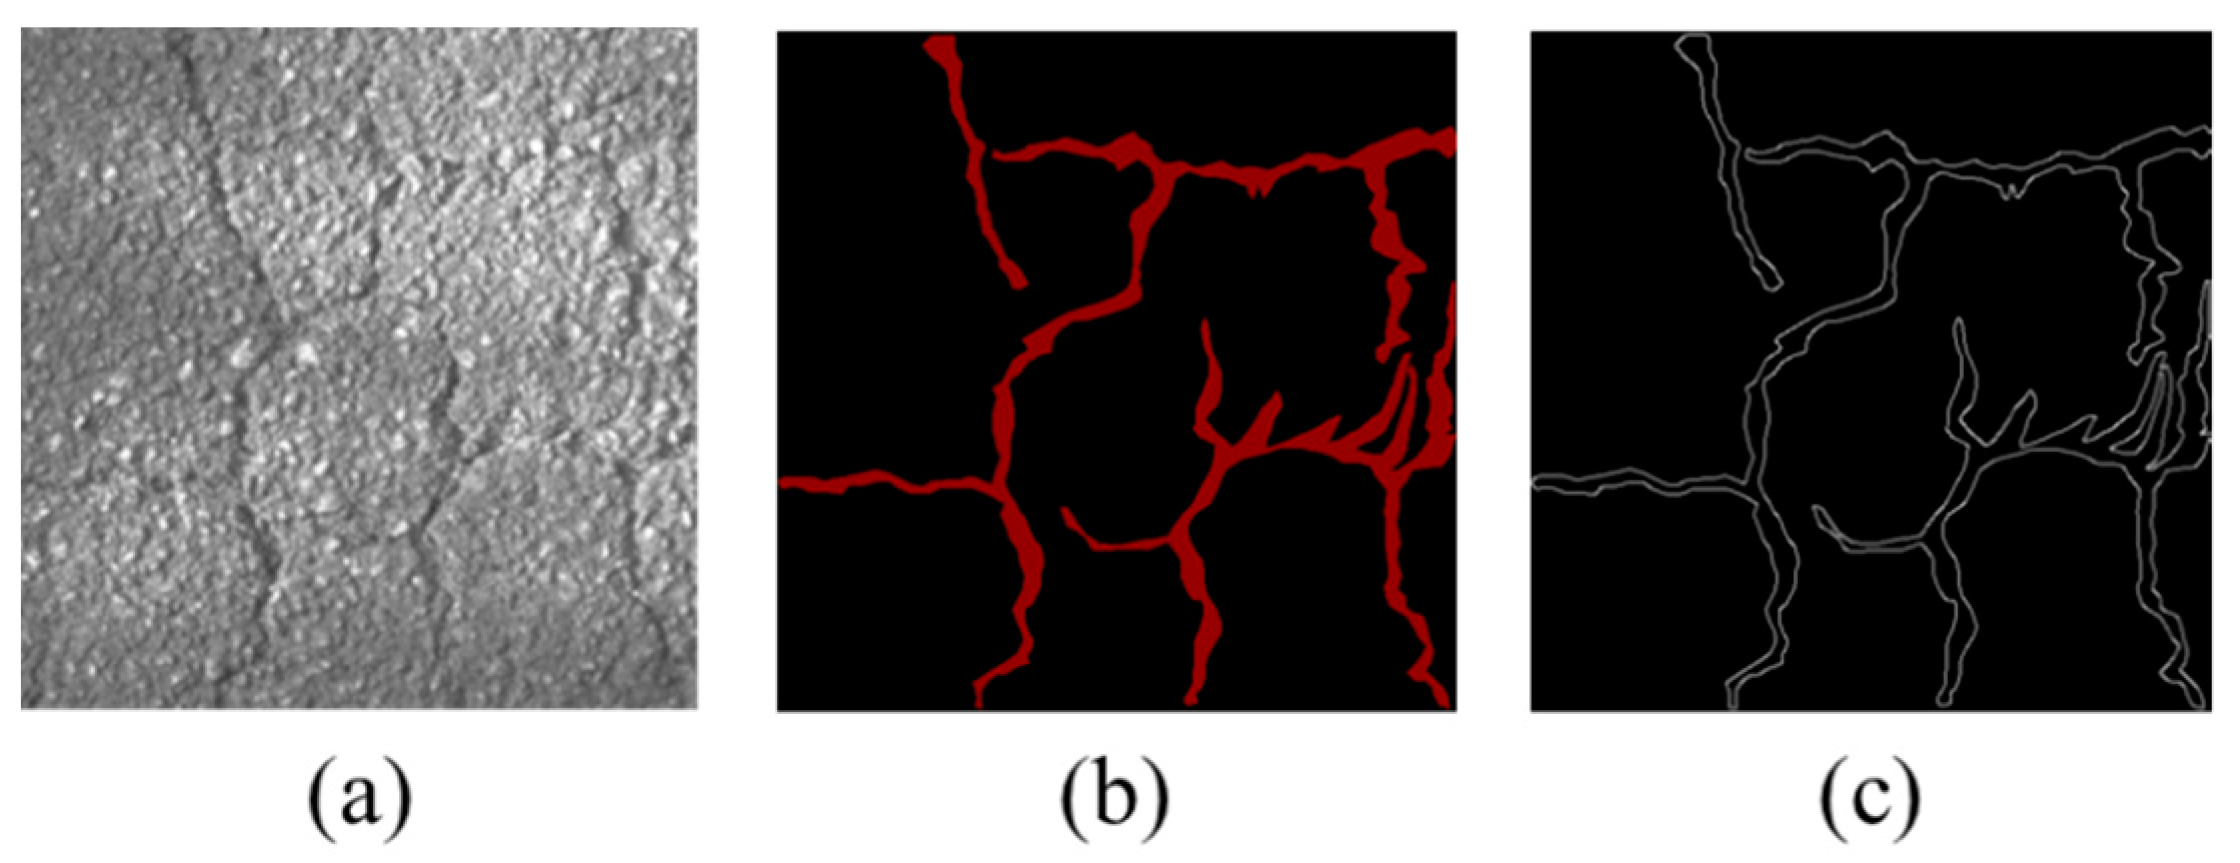
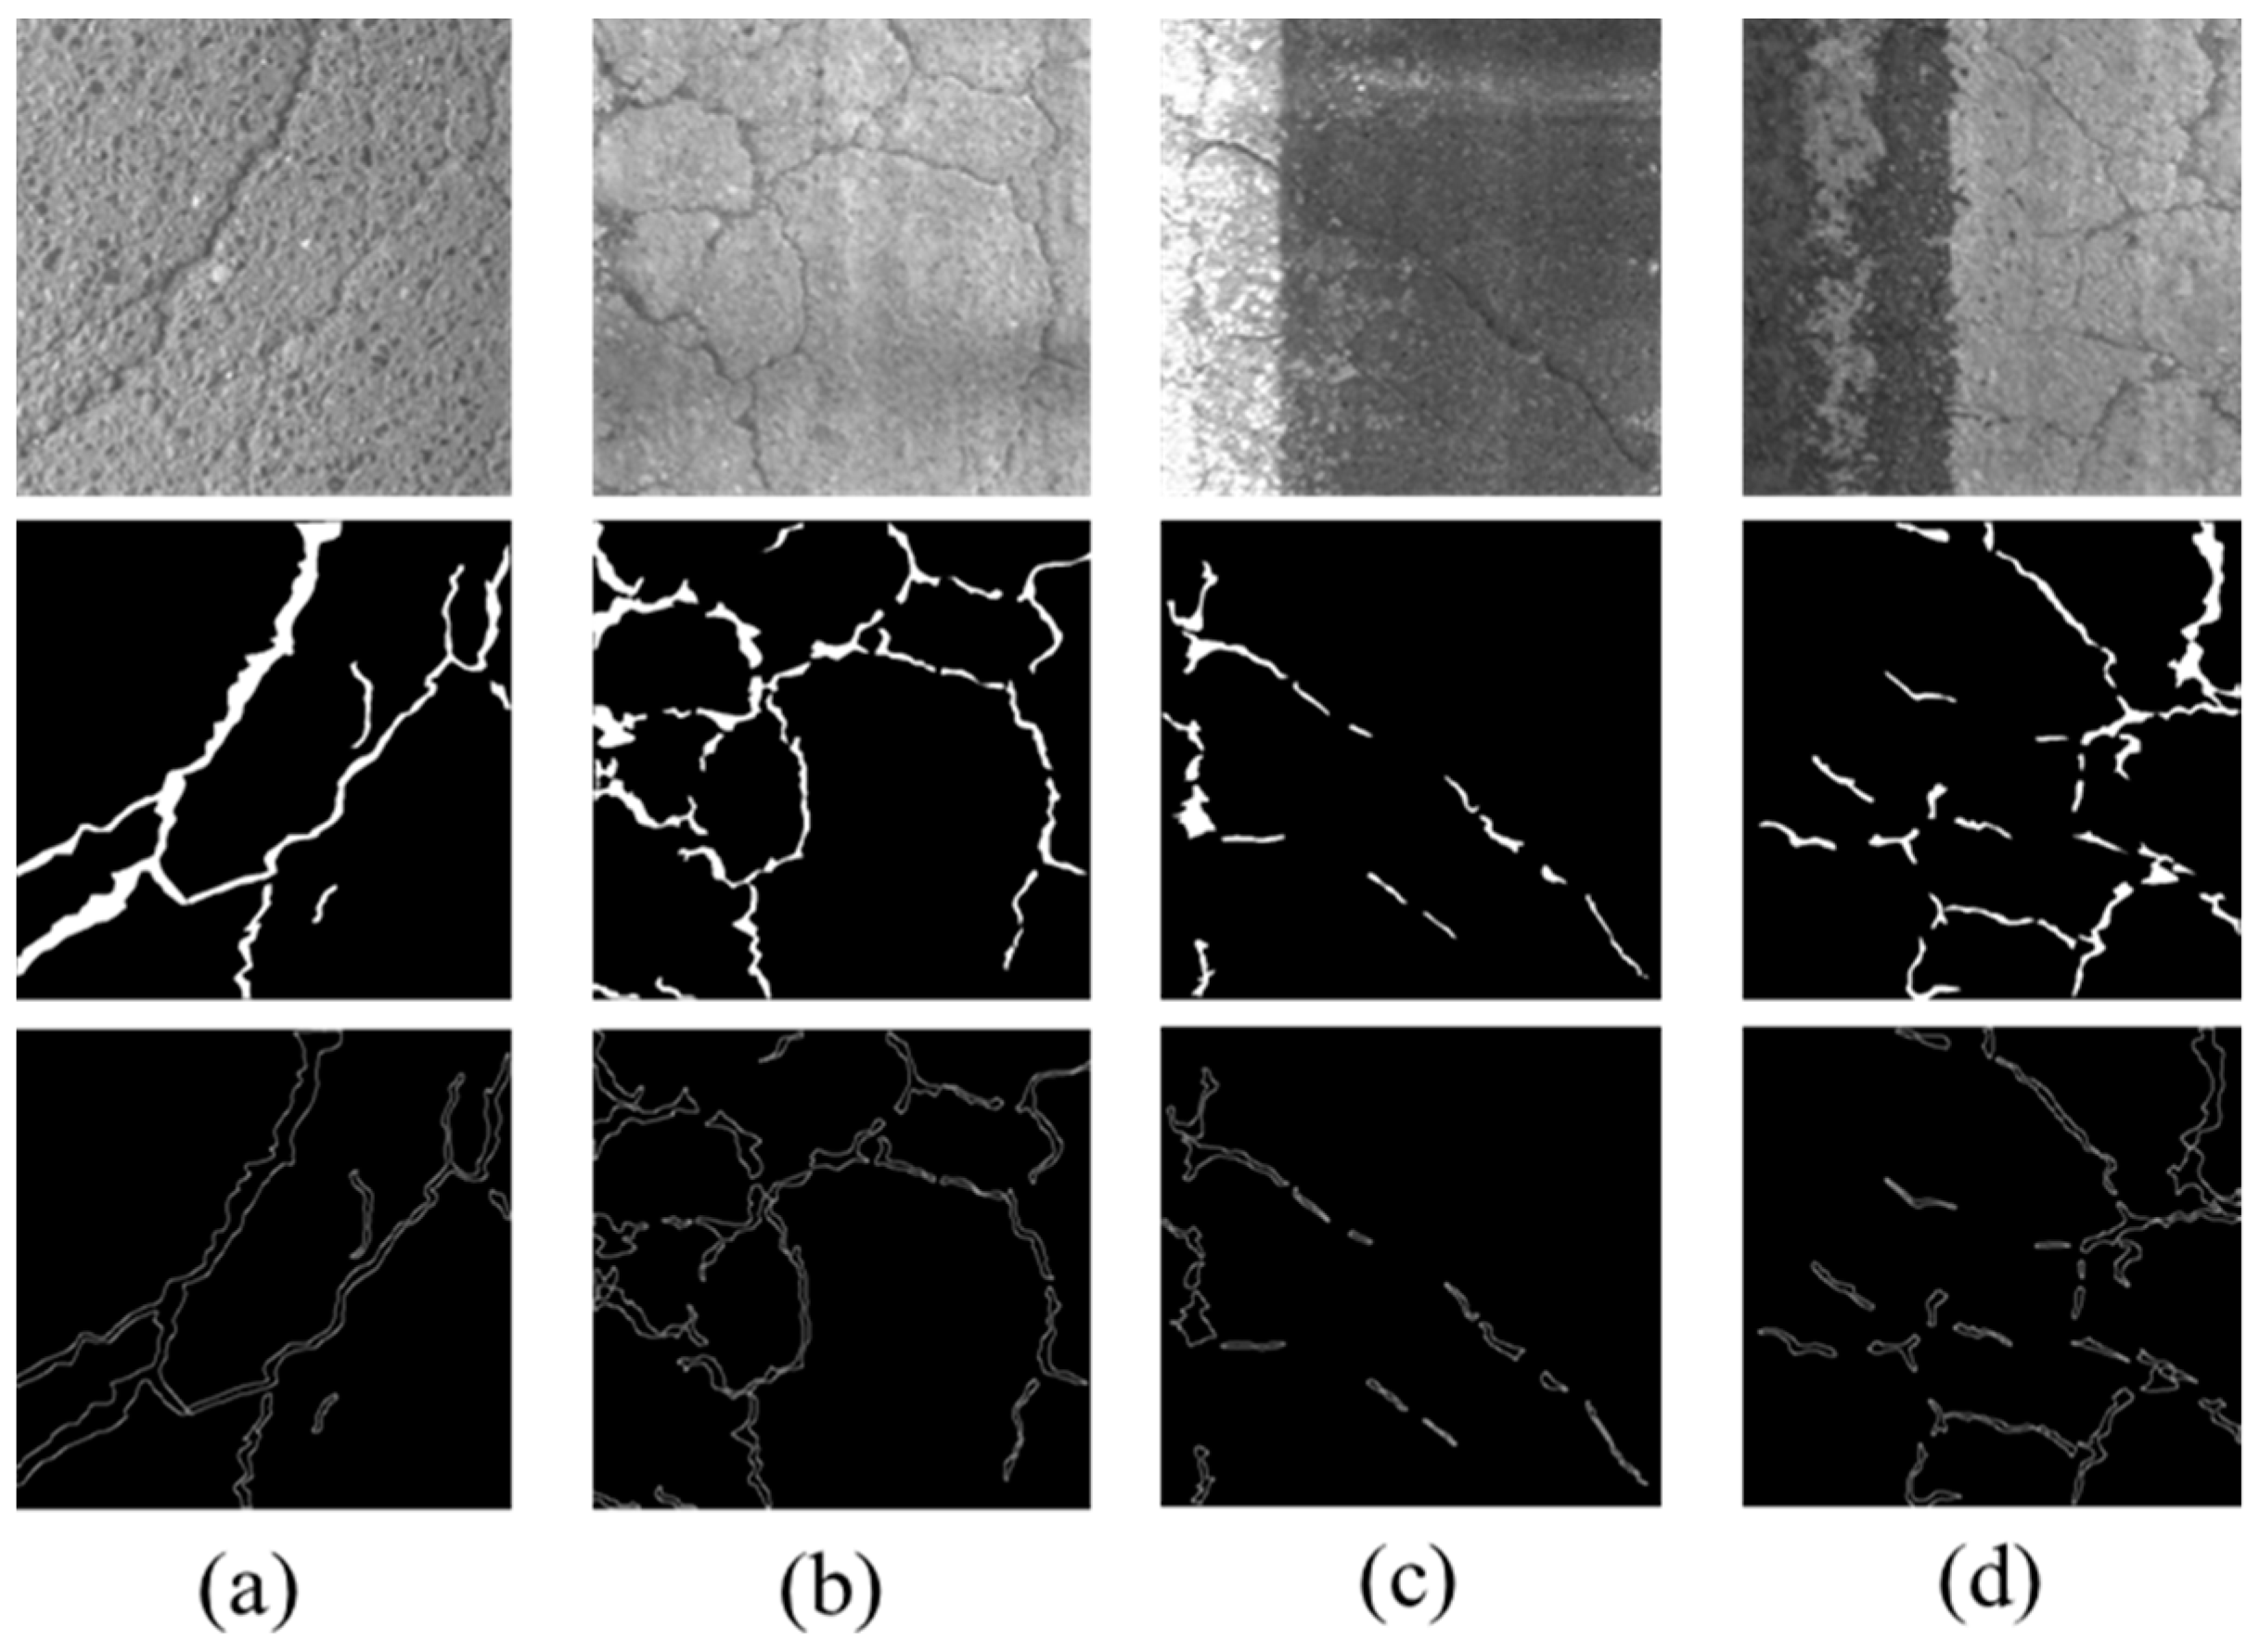
The image data of pavement distresses used in this experimental study were provided by the Yunnan Highway Science and Technology Research Institute. There are mainly net-shaped cracks, longitudinal cracks, and transverse cracks in the image data. Fatigue failure is the most common source of net-shaped cracks. The asphalt pavement structure eventually loses its bearing capacity due to repeated vehicle loads, and fatigue failure occurs. Uneven subgrade settlement and fatigue failure are the principal causes of longitudinal cracks. They will eventually develop into net-shaped cracks if not maintained. The most typical causes of transverse cracks are temperature changes and reflection cracks. Transverse cracks grow from top to bottom due to low-temperature shrinking. Reflection cracks develop from the bottom up, penetrating the road structure. The information offer basis for subsequent maintenance work.
We used the Teledyne Dalsa S3-24-02k40, which is a high-response, high-speed linear array industrial digital camera with a 2048 × 2048 picture resolution. A Camera Link is included within the camera. It can sustain a fast transmission speed while dealing with enormous amounts of picture data and high bandwidth needs. At the same time, the camera’s improved user interface makes data collecting personnel’s following image processing job easier. After the images are gathered on-site, the cracks are manually identified as mesh cracks, longitudinal cracks, and transverse cracks, and then images including single cracks, multiple cracks, and mesh cracks are picked.
It contains 3000 pictures collected by the road detection vehicle, with a pixel resolution of 2048 × 2048, and the format is a single-channel gray image. The images were collected at the K1209 + 080 − K1210 + 096 Xiuhe section of the No. 326 State Road and K1904 + 350 − K1902 + 300 Lanma section of the No. 248 State Road. Figure 4 shows the information about the roads. The selected road section included both cement and asphalt pavements. Owing to the influence of the driving load and natural environment, there are different types of cracks on the pavement. These complex data contents cause some difficulties in the crack identification task. We attempted to classify the degree of distress in the original road image using a convolution neural network. However, owing to shadows, water stains, and other foreign objects in the image, the identification accuracy can only reach around 75%, which does not accomplish the desired impact. We plan to improve the distress categorization method, as well as the accuracy and automation of pavement detection, in the future study. Water stains are caused by a portion of the road surface becoming wet. Many provinces are connected by the No. 326 State Road, and the No. 248 State Road, and trucks are frequently seen on the route. The sprinkler must constantly cool the heat brake pads and tires to guarantee driving safety. Wet strip tire imprints are frequently observed on the road. Some trucks will also be transporting wet goods, resulting in some partial wetness on the road surface. These create certain challenges for the task of detecting pavement cracks using digital images.
The convolutional neural network model we constructed can only train images with a pixel resolution of 256 × 256 due to the computing capability of the computer. The open-source computer vision software OpenCV is used to resize the image to match it with the network model’s input. The original collected images were pretreated. The image with a pixel resolution of 2048 × 2048 was cropped to the image with a pixel resolution of 512 × 512, which is one-sixteenth of the original image. The image needs to be resized to 256 × 256 pixels to match the input port of the network model. If we immediately compress the image of 2048 × 2048 pixels to 256 × 256 pixels, the original image’s crack information is significantly lost, resulting in a decrease in identification accuracy. The original image and the processing procedure are depicted in Figure 5.

3.2. Image Dataset

The open-source tool LabelMe [47] was downloaded for semantic annotation, obtained from GitHub [48]. The annotated information is saved as a JSON file containing the marked image name, labeled type, coordinate points, and others. Extracting the information in a file can generate a binary image for training. The original image, manually labeled crack, and crack edge images are shown in Figure 6. Six hundred images with cracks were selected randomly from the dataset for the pixel-level annotation. The dataset included 420 images as the training set, 120 as the validation set, and 60 as the test set. The ratio of the training set, validation set, and test set was 7:2:1. Table 1 lists the percentages of the crack and non-crack pixels in the dataset. The table shows that the crack images only account for a small number, and the task is image segmentation with an unbalanced category. The labeled dataset includes asphalt pavement and cement pavement, and some images contain interference factors of water stains and shadow changes. Figure 7 shows labeled images in different environments. Table 2 shows the proportion of asphalt pavement and cement pavement images in the dataset and the proportion of images in different environments.

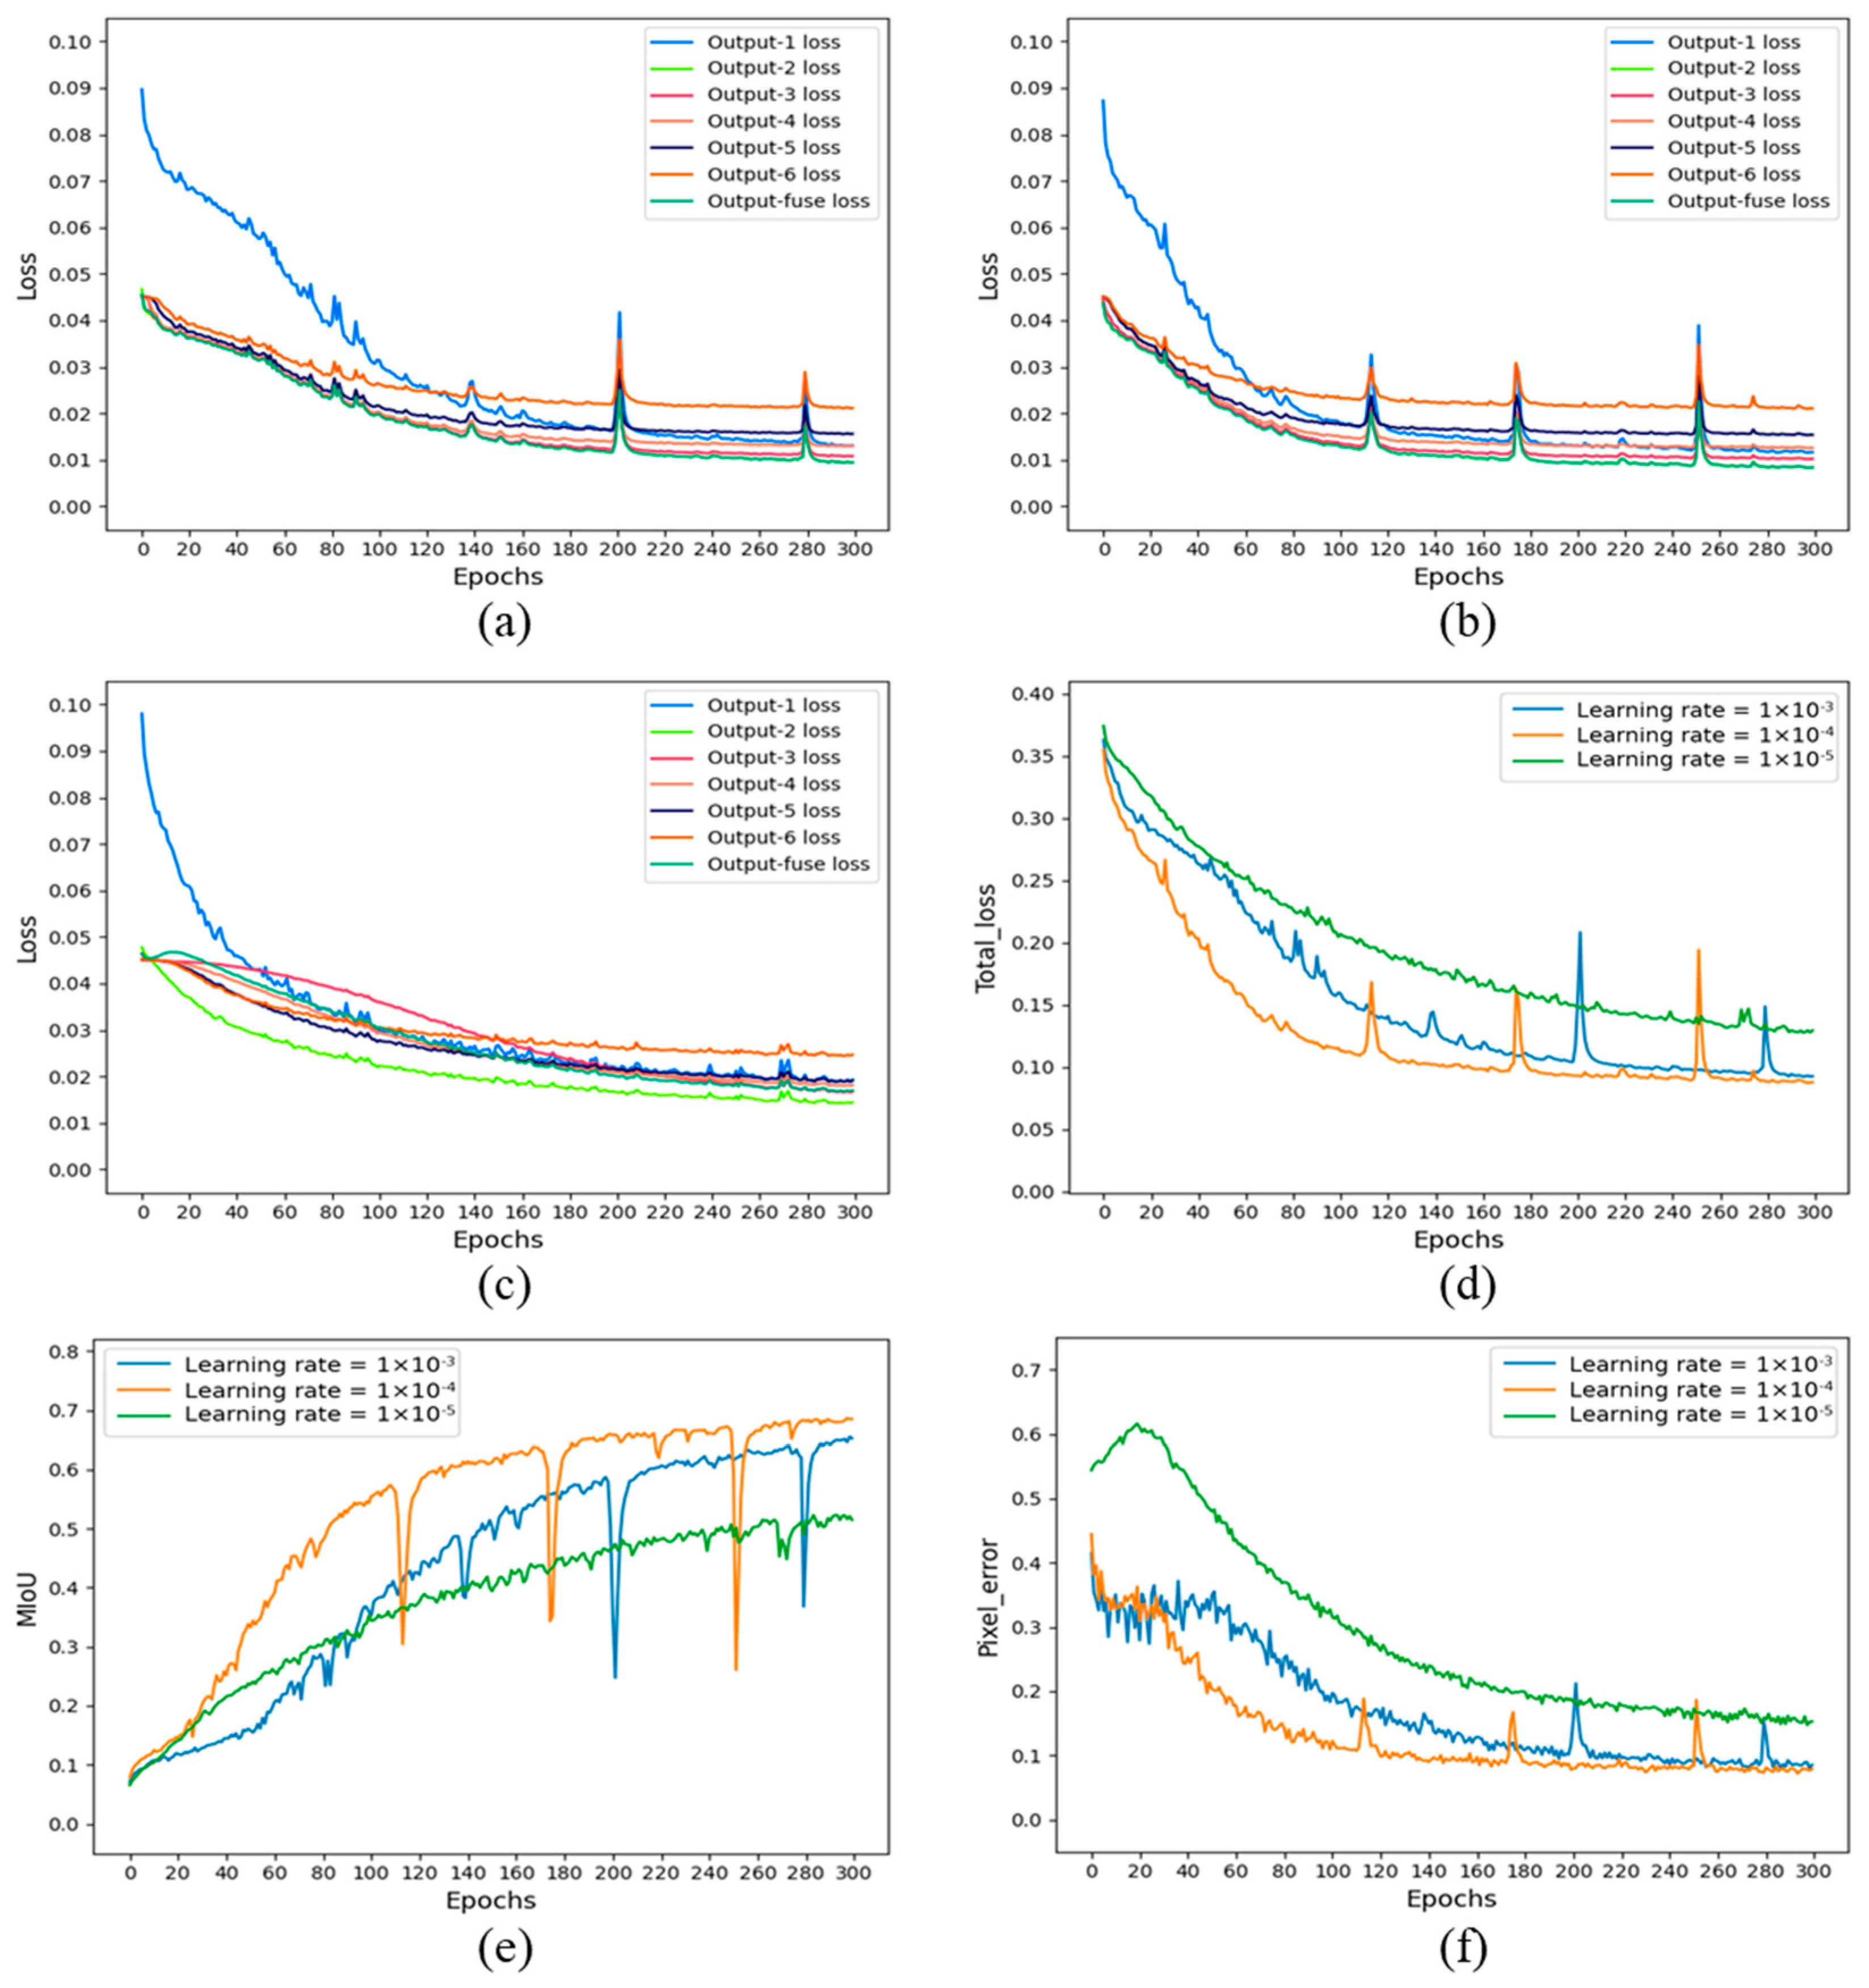
3.3. Training Details

The training platform was performed on a workstation with an Intel(R) Core i9-10900k CPU and an NVIDIA 3090, 24G GPU. This study uses TensorFlow, which is Google’s open source deep learning framework, to build and train the network. The software configuration was as follows: Windows 10, CUDA 11.1, cuDNN-v8.0.4, TensorFlow-GPU-2.4, and Python 3.8.
A total of 420 labeled images were taken as the training set, and the data of eight images in each batch were input into the SoUNet network after shuffling the training set. In the training process, the cross-entropy loss function with category balance in Equation (1) is used as the loss function. The adaptive moment estimation (Adam) optimizer [49] was selected for optimization. The optimizer adjusts the learning rate in the training process and changes the weight parameters and bias values in the network. The initial learning rates were set to 1 × 10 3 , 1 × 10 4 , and 1 × 10 5 , respectively, and the training epochs were set to 300. The accuracy indicators monitored during training are the MIoU value and pixel error, respectively.

3.4. Training Process

The model was trained after setting the parameters, and the entire training process was monitored. Figure 8 shows the training process of the model for different learning rates. It includes the variation curves of four variables measured on the training set, which are seven loss values, overall loss values, MIoU, and pixel error. Figure 8a–c show that the seven loss values continue to decline under different learning rates. We chose to stop training at 300 rounds to prevent overfitting. As shown in Figure 8d–f. When the initial learning rate was set to 1 × 10 4 , the overall loss value of the network decreased the fastest in the training process and reached the lowest value at the end of the training. Simultaneously, the MIoU value and pixel error measured in the training set can reach the optimal value. Therefore, the most effective model was selected in the training process when the learning rate was set to 1 × 10 4 .

4. Training Result and Comparison

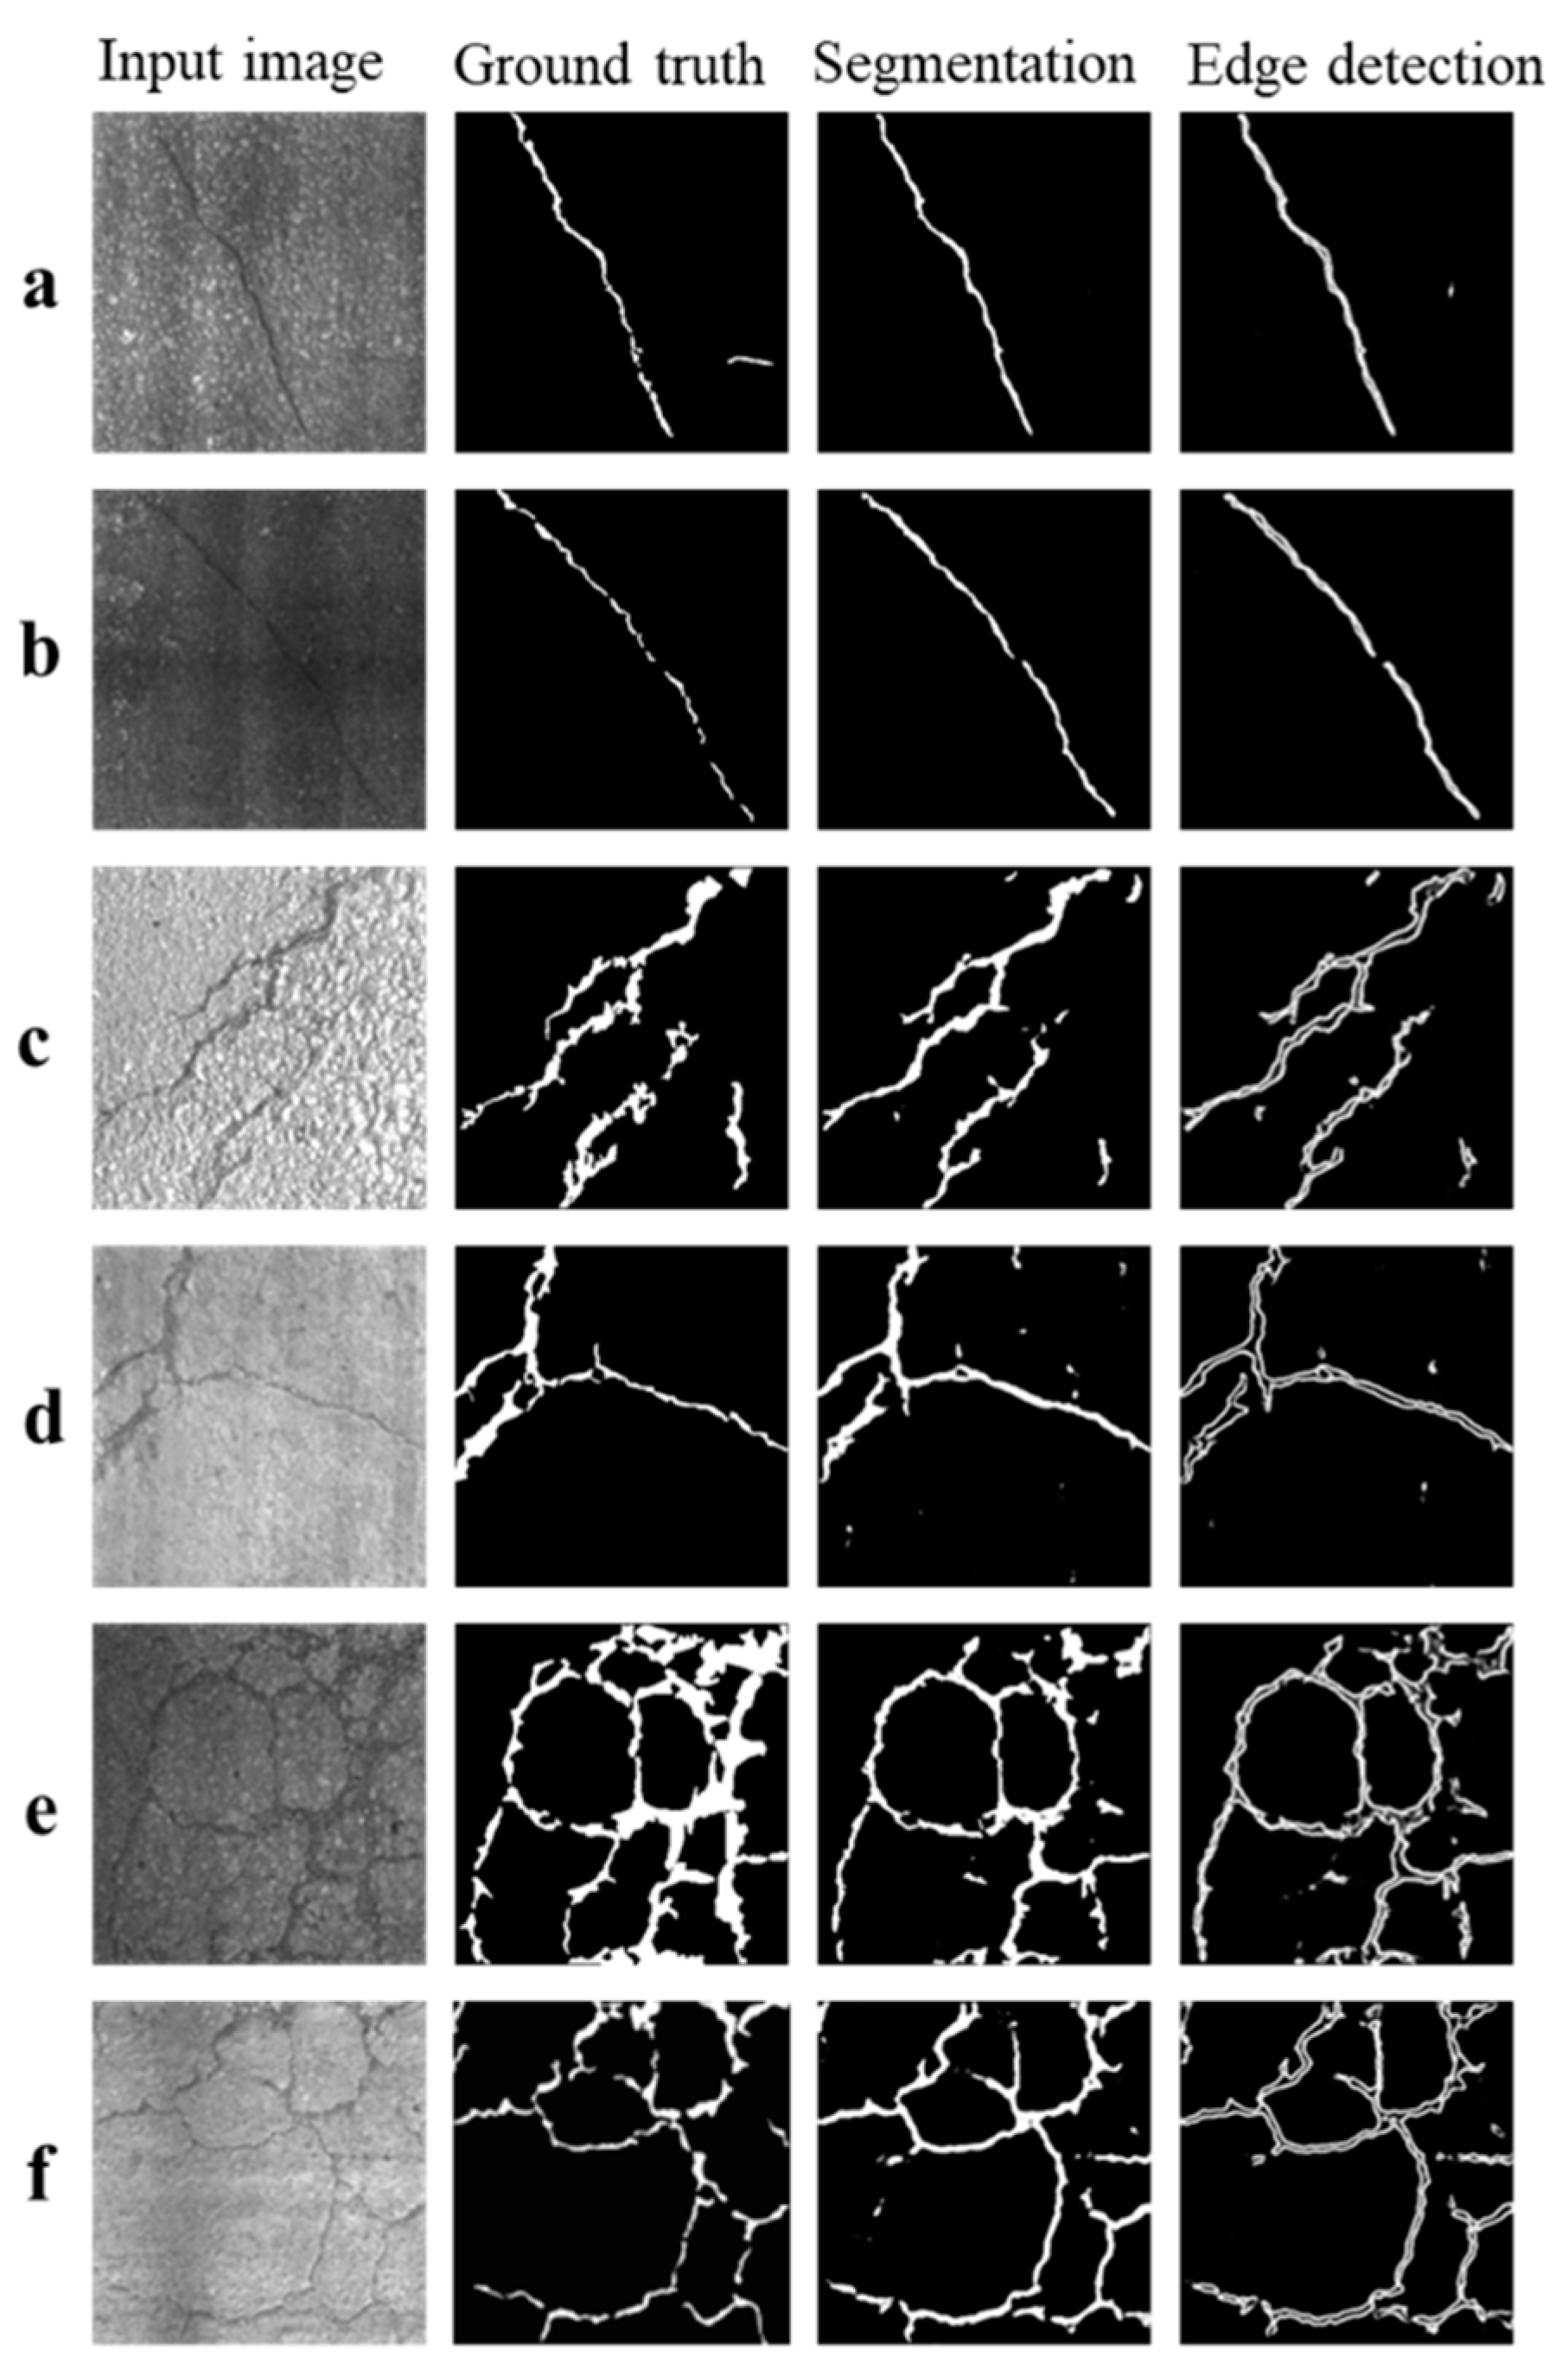
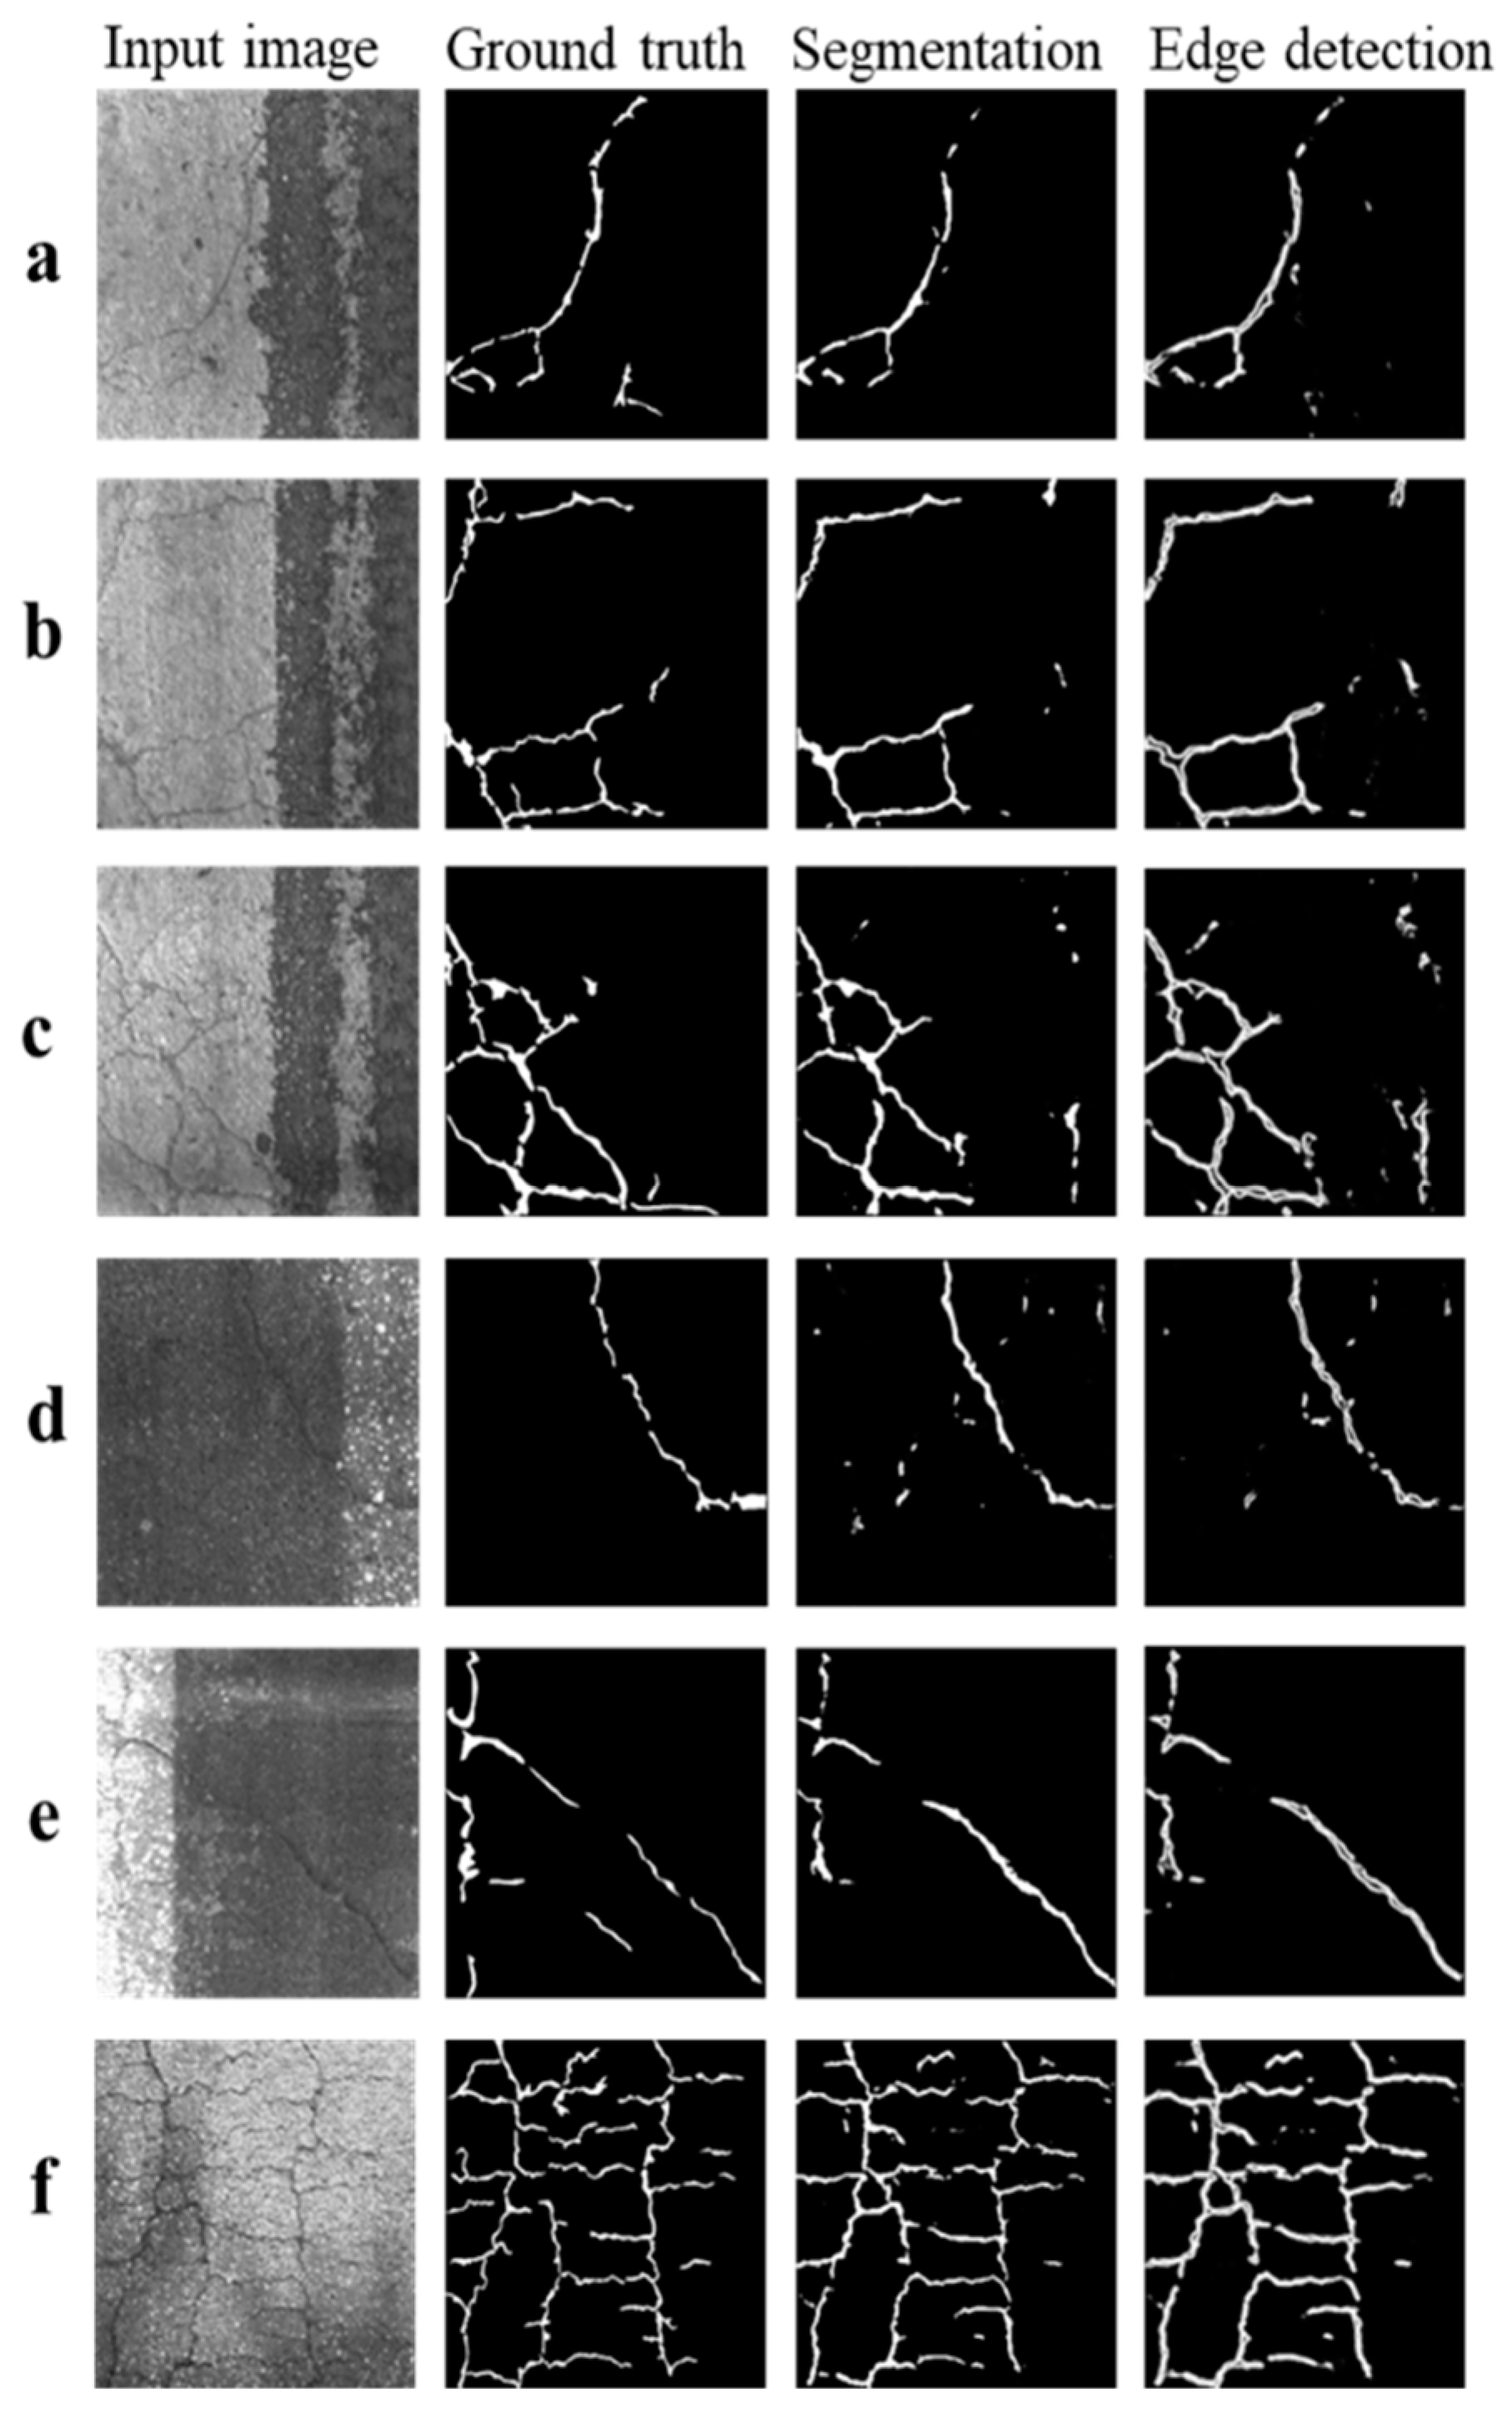
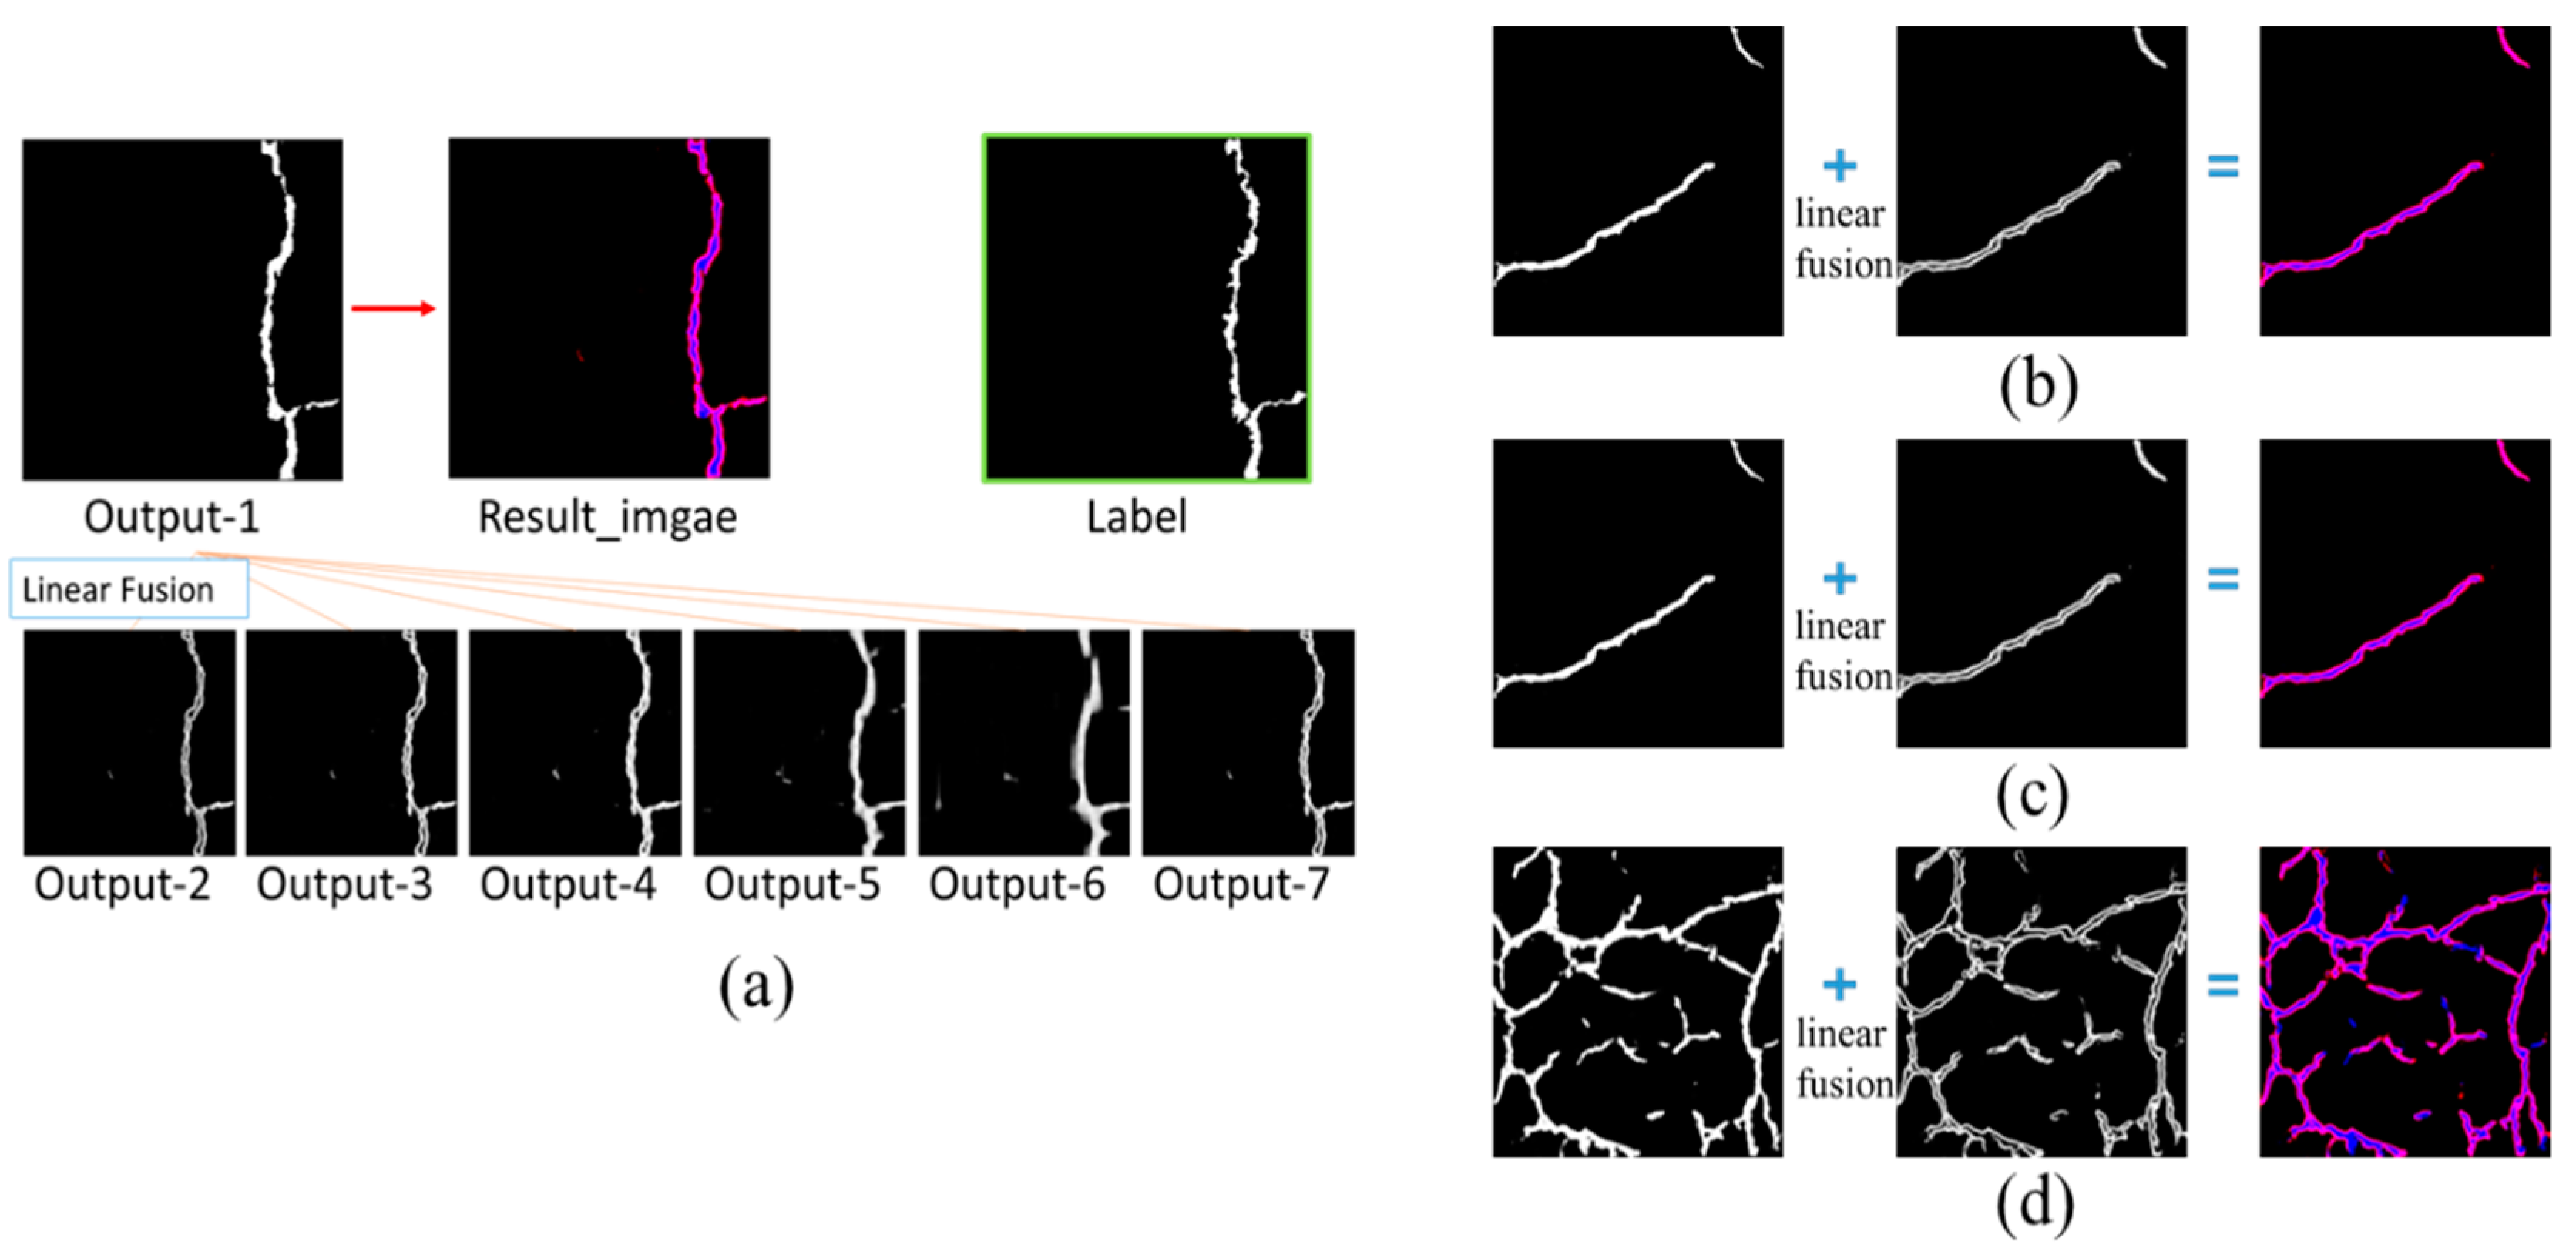
4.1. Training Result

TensorFlow 2 has the function of saving the optimal model. The best network model for the validation set was extracted. This model was used to predict the test set. Figure 9 shows the crack segmentation results and edge extraction results of SoUNet for different types of pavement images. The model has a good segmentation effect on a single crack of both asphalt pavement and cement pavement. The effect of edge detection is normal, but the two edge lines tend to overlap for areas with narrow widths.
The model performs well for multiple cracks and net-shaped cracks, but there are many problems such as noise points, incomplete segmentation, and blurred areas. The recognition effect of the model on the cement pavement image is good, and there is more noise and missed detections in the recognition results of asphalt pavement. Figure 10 shows the prediction results under the interference of water stains and shadows. There are many cases of noise and missed detection in areas with water stains, and other missed detections occur at the borders of the shadows. Water stains have a greater impact on the prediction results. In general, the proposed model was effective. It shows a certain potential in detecting images with interference, and the MIoU is greater than 50%. According to the data statistics in Table 2, only 20.7% of the images contained water stains, and only 9.2% of the images contained shadow interference in our dataset. In the future, we can increase the number of such data and use more images with different interferences to participate in the training process to enhance the accuracy and robustness of recognition.

4.2. Evaluated Model

SoUNet can output both the crack segmentation image and the crack edge line image. The optimal model was extracted to predict the test set, and the segmentation and edge detection images were output. An input image corresponds to one segmentation image and six edge line images. One segmented image was linearly fused with the other six edge line images to optimize the segmentation results. The fusion images and fusion results are presented in Figure 11. Table 3 lists the MIoU, mean pixel accuracy, ODS-F, and OIS-F measured using different methods. SoUNet-Output-1 is the output of the semantic segmentation network in SoUNet, which is the image of Output 1. SoUNet-Fusion-ij is the linear fusion of outputs i and j. The numerical value shows that the linear fusion of the semantic segmentation results and edge line detection results can effectively improve the crack segmentation accuracy. The MIoU value increased by 2.47%, and the MPA value increased by 9.58%. SoUNet-Fusion-13 has high MIoU and MPA values and is the most stable under various accuracies from the result of the comprehensive comparison. The results are compared with those of other semantic segmentation models in Section 4.3.
We selected 30 crack pictures from the test set and measured the width of the initial position, middle position, and end position of the crack. The measurement direction is perpendicular to the crack trend, as shown in Figure 12a. The same method is used to measure the crack width in the label image, SoUNeT result image, and U-NET result image, respectively. Taking the crack width measured in the label image as the actual width, the width error statistical charts of SoUNet and U-NET are obtained. As shown in Figure 12b, S1–3 in the figure shows the SoUNet initial position, middle position, and end position of the crack, respectively. U1–3 indicates the U-Net initial position, middle position, and end position of the crack, respectively. It can be seen from Figure 12b that the width error measured by SoUNet is about 2 pixels, and the measurement error is less than that of U-Net.

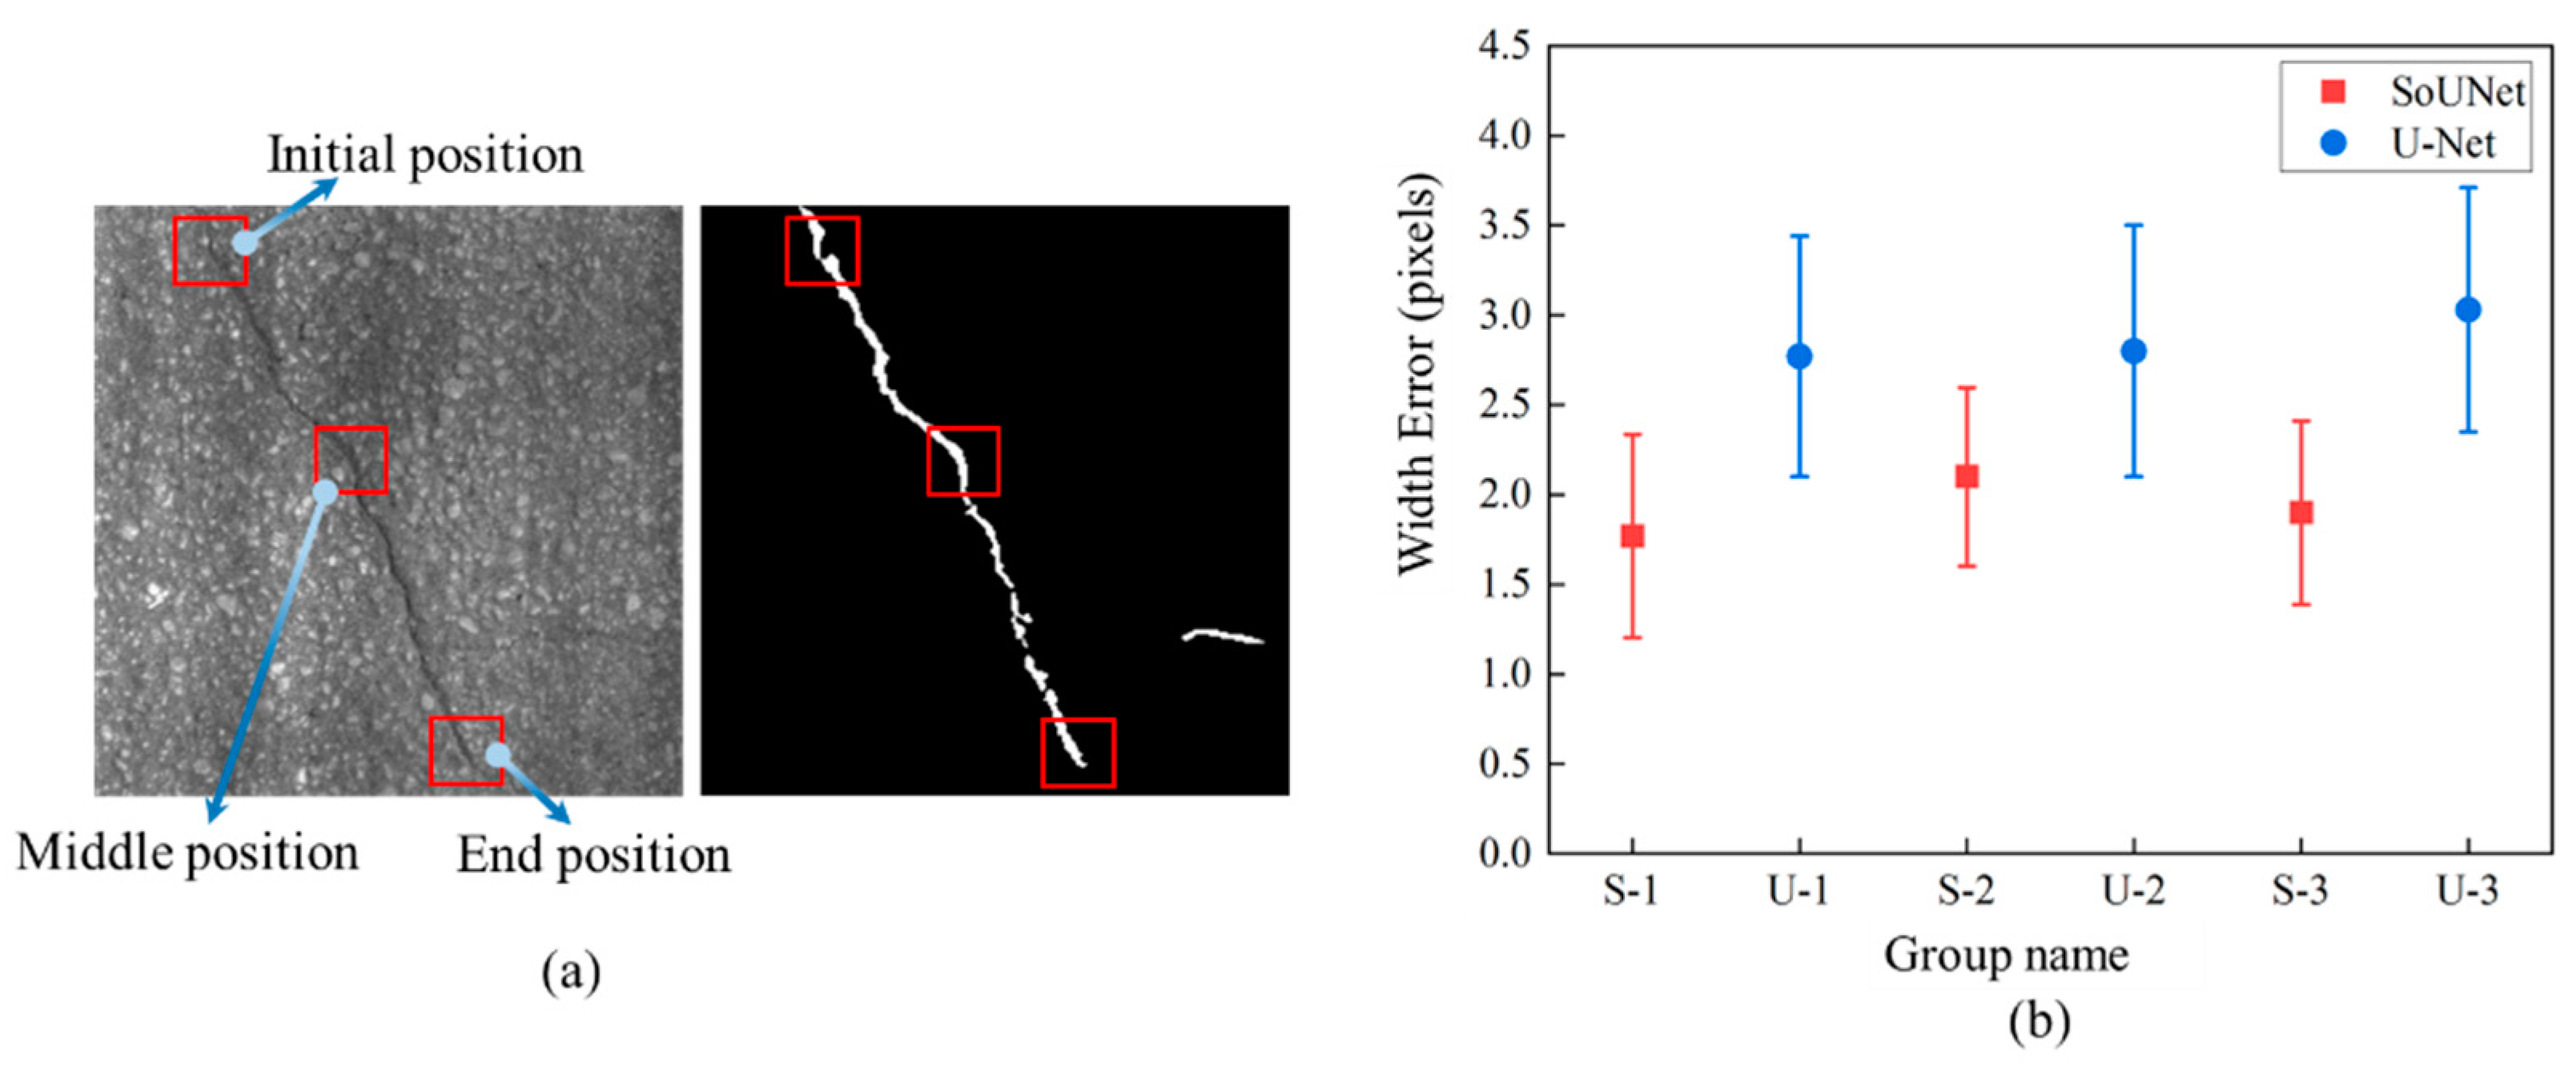
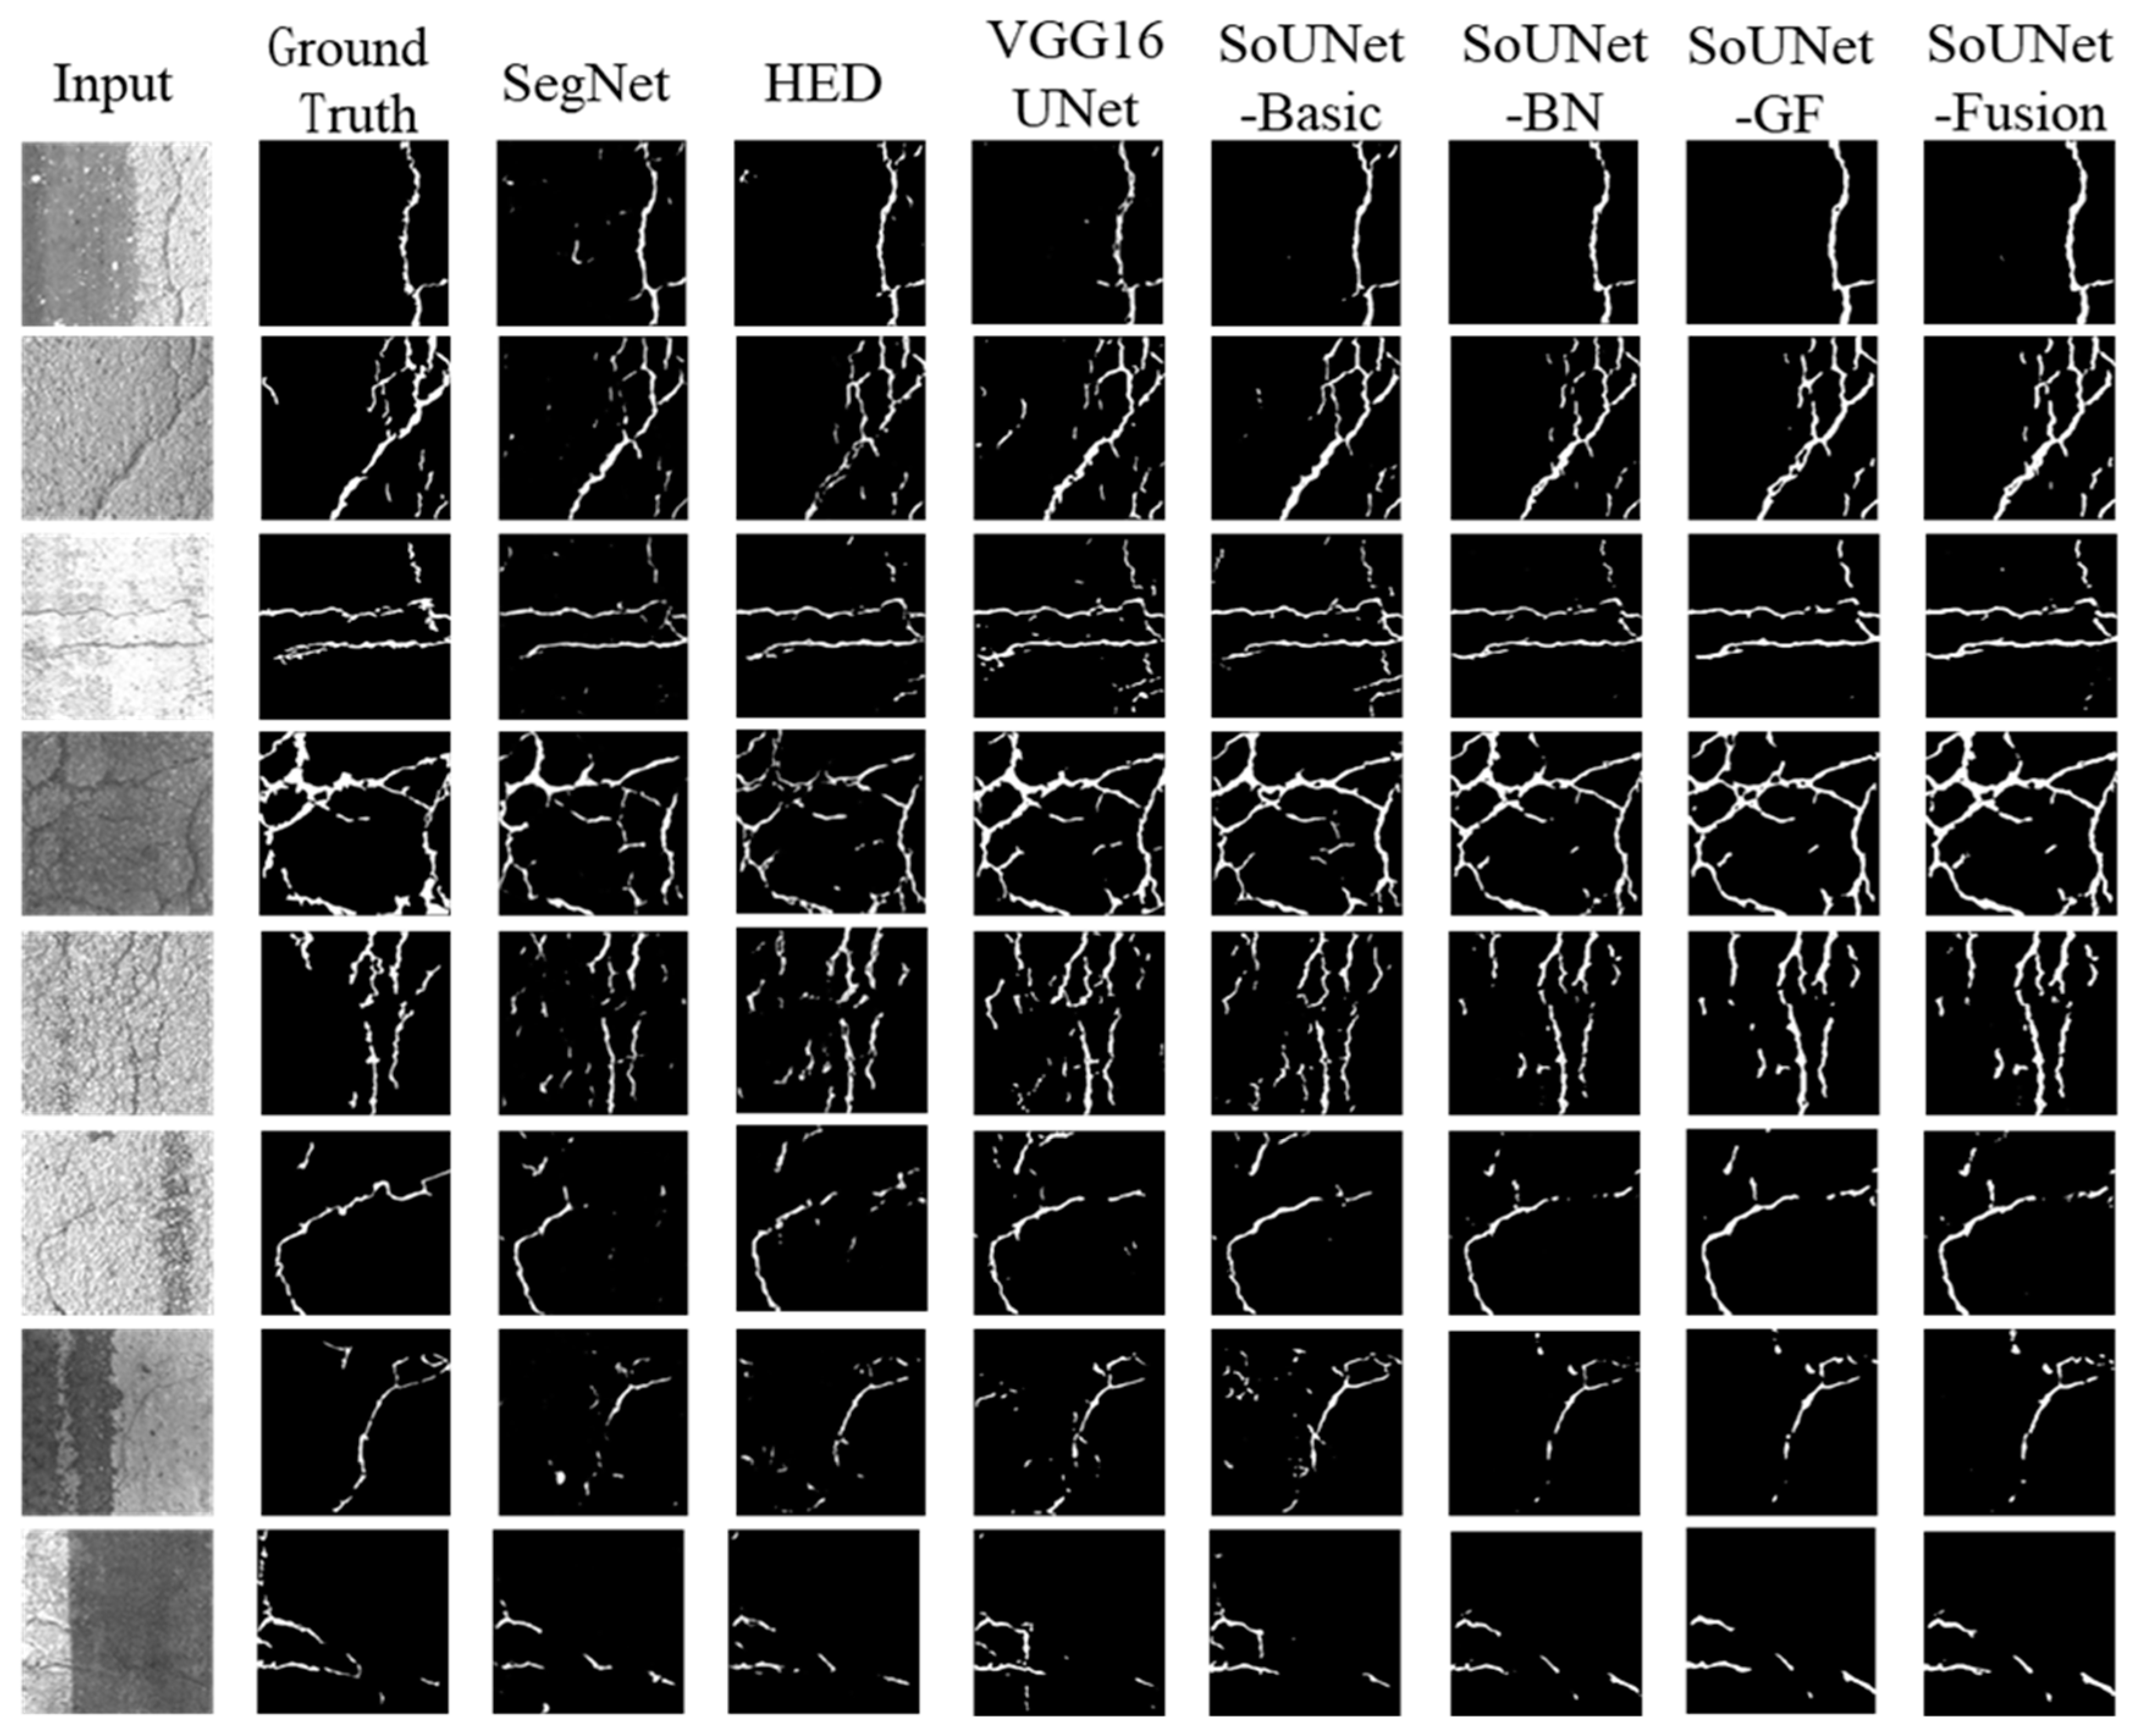
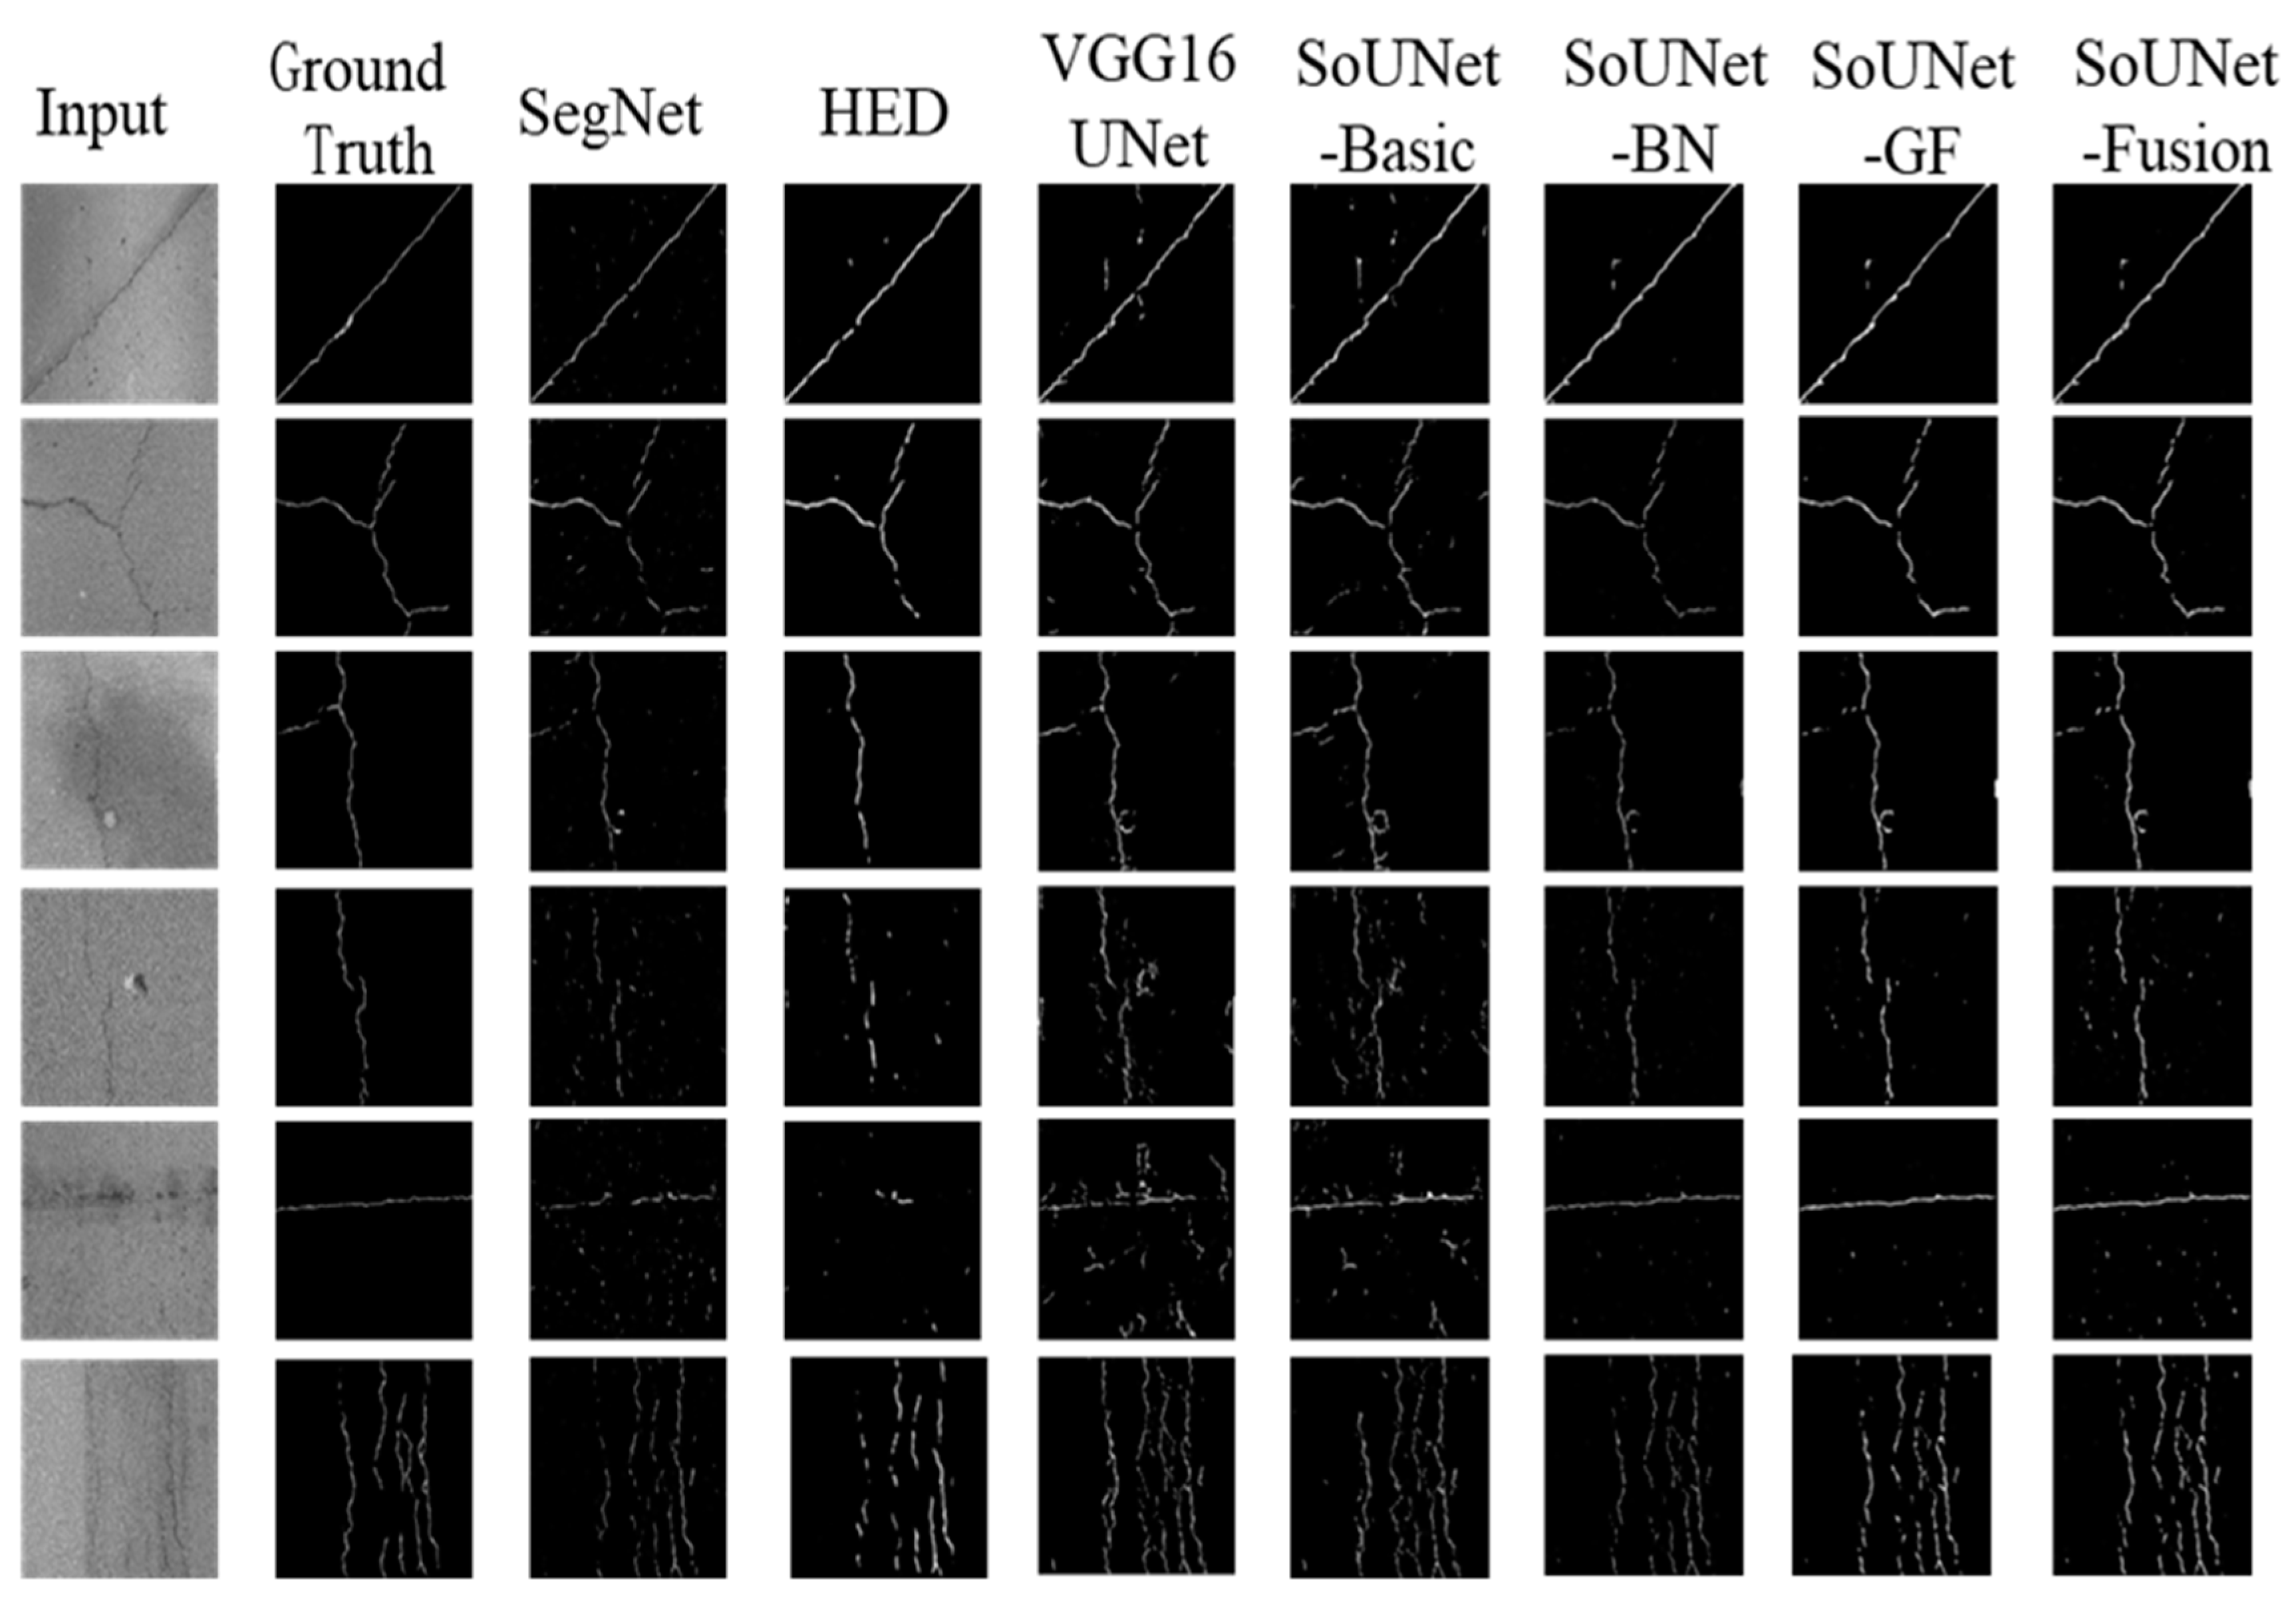
4.3. Comparative Study

To test the performance of SoUNet, we selected four methods based on deep learning for comparative study: (1) SegNet [24] is a fully convolutional network, which was used for semantic segmentation. It has also been proposed for crack identification of concrete pavement, asphalt pavement, and bridge deck [44]; (2) HED [38], which is an edge detection model with high performance that can also be used for crack detection; (3) VGG16-U-Net [45]: U-Net is a high-performance semantic segmentation network [25]. Its improved structure, VGG16 U-Net, has been used to detect surface defects in concrete and asphalt [46]. Comparing the recognition performance of the following strategies for the proposed SoUNet model is necessary: (1) SoUNet-Basic: The basic side-output U-Net structure, the side-output part plays the role of deep supervision and improves the model learning efficiency; (2) SoUNet-BN: Adding a batch normalization layer based on SoUNet-Basic. The BN layer can accelerate the training process; (3) SoUNet-GF: A and B are taken as the original image and guide image, respectively, from the outputs of SoUNet-BN and then perform the guided filter operation; (4) SoUNet-Fusion: This is the same as SoUNet-Fusion-13 in Table 3 of Section 4.2.
Deep-learning-based methods can be applied to image recognition tasks, but these methods are only suitable for specific scenes and tasks in most cases. Poor generalization performance is one of the main drawbacks of these methods. To further test the generalization performance of SoUNet in the crack detection task, the FISSURES dataset [50] was downloaded. This dataset is similar to our dataset. The preprocessing method in Section 3.1 is used to process the dataset and make those sizes suitable for the network model. Finally, they were sent to the trained model to view the results. Table 4 shows the evaluation results of the seven methods on the two datasets. Our test set is divided in Section 3.2, accounting for one-tenth of the original dataset. None of the images for the prediction evaluation in this section participated in the training process. The linear fusion method performs better than the other methods on its own test set and FISSURES dataset.
Figure 13 shows the prediction results of the seven methods on our dataset. In the case of no interference, the segmentation integrity of SoUNet-fusion is better than that of other methods, and the noise produced is less than other results. In addition, our method performs well on rough asphalt pavement that is difficult to identify, and the segmentation results are relatively complete, but there are some false positive areas and a small number of noise points. Shadows and water stains are not misjudged as cracks, but the segmentation accuracy decreases, and the results are incomplete. Figure 14 shows the test results for the FISSURES dataset. The asphalt pavement in the FISSURES dataset was relatively flat, but the crack depth was shallow, and the width was narrow, so the noise of the segmentation result was relatively small. Segmentation integrity is investigated in this section. SoUNet-fusion has good segmentation integrity in the images of single cracks, multiple cracks, and net-shaped cracks. There were relatively few misjudged areas. When interference occurs, the crack area can still be completely segmented.

5. Conclusions

In this paper, we introduce a model that can simultaneously perform semantic segmentation and edge detection. The proposed convolutional neural network SoUNet was used to output the crack segmentation images and crack edge images. Finally, the two output results were linearly fused to improve detection accuracy. When compared to previous semantic segmentation models, our method can increase the MioU value by up to 5.55 and increase the MPA value by up to 10.41.
The semantic segmentation part of SoUNet is based on the U-Net structure of the vgg16. The convolution feature map on each scale was fused in pairs, and the low-resolution fusion feature map was further fused to a higher resolution after passing through the convolution layer. The edge detection part extracts the feature map of each scale based on the U-Net. The low-resolution feature maps were trained and fused to the high-resolution features, and the crack edge image was outputted. The edge detection part is also the side-output part of the entire network. In addition, the crack dataset contains the pavement surface of cement and asphalt, and it also contains images of water stains and shadows. Therefore, the dataset is closer to the actual situation. The experimental results demonstrate that the edge detection part of the proposed method achieves ODS-F 33.14, OIS-F 34.11 on our dataset. Its MioU, the semantic segmentation evaluation indicator, reaches a value of 69.32. Both the intuitive and numerical results are better than those of other segmentation methods based on deep learning. The experimental results also show that SoUNet performs well in rough asphalt pavement images, is less affected by water stains and shadows, and has the potential to deal with multi-interference pavement conditions.
In the future, we plan to develop a new pavement detection network that is more accurate for identifying types of pavement cracks. We will enrich the pavement dataset and add crack images of various scenes to make the dataset closer to the actual situation. In addition, we will also use the model for other tasks that need both semantic segmentation and edge detection, such as pit contour detection in pavement distress detecting task, road edge line detection in an automatic driving task, and diseased organ contour recognition in picture medicine.

Author Contributions

Conceptualization, H.X.; methodology, P.L.; software, P.L.; validation, B.Z.; investigation, B.Z. and F.Y.; resources, F.Y.; writing—original draft preparation, P.L.; writing—review & editing, H.X.; visualization, P.L.; supervision, R.G.; project administration, H.X.; funding acquisition, R.G. All authors have read and agreed to the published version of the manuscript.

Funding

This work was supported by the National Natural Science Foundation of China (11862008).

Institutional Review Board Statement

Not applicable.

Informed Consent Statement

Not applicable.

Data Availability Statement

Data sharing not applicable.

Conflicts of Interest

The authors declare no conflict of interest.

Abbreviations

MIoUMean intersection over union
MPAMean pixel accuracy
ODS-FOptimal dataset scale F-score
OIS-FOptimal image scale F-score
CNNConvolutional neural network
HEDHolistically nested edge detection network
SegNetA deep convolutional encoder-decoder architecture for image segmentation
U-NetU-shaped Convolutional networks for image segmentation
BNBatch normalization
GFGuided filter operation

References

  1. Ayenu-Prah, A.; Attoh-Okine, N. Evaluating Pavement Cracks with Bidimensional Empirical Mode Decomposition. EURASIP J. Adv. Signal Process. 2008, 2008, 861701. [Google Scholar] [CrossRef] [Green Version]
  2. Doll, B.; Ozer, H.; Rivera-Perez, J.J.; Al-Qadi, I.L.; Lambros, J. Investigation of viscoelastic fracture fields in asphalt mixtures using digital image correlation. Int. J. Fract. 2017, 205, 37–56. [Google Scholar] [CrossRef]
  3. Tan, Y.Q.; Zhang, L.; Guo, M.; Shan, L. Investigation of the deformation properties of asphalt mixtures with DIC technique. Constr. Build. Mater. 2012, 37, 581–590. [Google Scholar]
  4. Grabowski, D.; Szczodrak, M.; Czyzewski, A. Economical methods for measuring road surface roughness. Metrol. Measurem. Syst. 2018, 25, 533–549. [Google Scholar]
  5. Jahanshahi, M.R.; Jazizadeh, F.; Masri, S.F.; Becerik-Gerber, B. Unsupervised Approach for Autonomous Pavement-Defect Detection and Quantification Using an Inexpensive Depth Sensor. J. Comput. Civ. Eng. 2013, 27, 743–754. [Google Scholar] [CrossRef]
  6. Cui, X.; Zhou, X.; Lou, J.; Zhang, J.; Ran, M. Measurement method of asphalt pavement mean texture depth based on multi-line laser and binocular vision. Int. J. Pavement Eng. 2017, 18, 459–471. [Google Scholar] [CrossRef]
  7. Ni, Z.; Shen, Z.; Guo, C.; Xiong, G.; Nyberg, T.; Shang, X.; Li, S.; Wang, Y. The Application of the Depth Camera in the Social Manufacturing: A review. In Proceedings of the 2016 IEEE International Conference on Service Operations and Logistics, and Informatics, Beijing, China, 10–12 July 2016; IEEE: New York, NY, USA, 2016; pp. 66–70. [Google Scholar]
  8. Rahkonen, J.; Jokela, H. Infrared Radiometry for Measuring Plant Leaf Temperature during Thermal Weed Control Treatment. Biosyst. Eng. 2003, 86, 257–266. [Google Scholar] [CrossRef]
  9. Tsai, Y.-C.J.; Li, F. Critical Assessment of Detecting Asphalt Pavement Cracks under Different Lighting and Low Intensity Contrast Conditions Using Emerging 3D Laser Technology. J. Transp. Eng. 2012, 138, 649–656. [Google Scholar] [CrossRef]
  10. Janowski, A.; Nagrodzka-Godycka, K.; Szulwic, J.; Ziółkowski, P. Modes of Failure Analysis in Reinforced Concrete Beam Using Laser Scanning and Synchro-Photogrammetry How to apply optical technologies in the diagnosis of reinforced concrete elements? In Proceedings of the International Conference on Advances in Civil, Structural and Environmental Engineering—ACSEE-2014, Zurich, Switzerland, 21–22 September 2014. [Google Scholar]
  11. Lu, C.; Yu, J.; Leung, C.K.Y. An improved image processing method for assessing multiple cracking development in Strain Hardening Cementitious Composites (SHCC). Cem. Concr. Compos. 2016, 74, 191–200. [Google Scholar] [CrossRef]
  12. Peng, C.; Yang, M.; Zheng, Q.; Zhang, J.; Wang, D.; Yan, R.; Wang, J.; Li, B. A triple-thresholds pavement crack detection method leveraging random structured forest. Constr. Build. Mater. 2020, 263, 120080. [Google Scholar] [CrossRef]
  13. Mardasi, A.G.; Wu, N.; Wu, C. Experimental study on the crack detection with optimized spatial wavelet analysis and windowing. Mech. Syst. Signal Process. 2018, 104, 619–630. [Google Scholar] [CrossRef]
  14. Lakshmi, K. Detection and quantification of damage in bridges using a hybrid algorithm with spatial filters under environmental and operational variability. Structures 2021, 32, 617–631. [Google Scholar] [CrossRef]
  15. Liebold, F.; Maas, H.-G. Advanced spatio-temporal filtering techniques for photogrammetric image sequence analysis in civil engineering material testing. ISPRS J. Photogramm. Remote Sens. 2016, 111, 13–21. [Google Scholar] [CrossRef]
  16. Li, Q.; Zou, Q.; Zhang, D.; Mao, Q. FoSA: F* Seed-growing Approach for crack-line detection from pavement images. Image Vis. Comput. 2011, 29, 861–872. [Google Scholar] [CrossRef]
  17. Simonyan, K.; Zisserman, A. Very deep convolutional networks for large-scale image recognition. arXiv 2014, arXiv:1409.1556. [Google Scholar]
  18. He, K.; Zhang, X.; Ren, S.; Sun, J. Deep Residual Learning for Image Recognition. In Proceedings of the 2016 IEEE Conference on Computer Vision and Pattern Recognition (CVPR), Las Vegas, NV, USA, 27–30 June 2016; pp. 770–778. [Google Scholar] [CrossRef] [Green Version]
  19. Huang, G.; Liu, Z.; Van Der Maaten, L.; Weinberger, K.Q. Densely Connected Convolutional Networks. In Proceedings of the 2017 IEEE Conference on Computer Vision and Pattern Recognition (CVPR), Honolulu, HI, USA, 21–26 July 2017; pp. 2261–2269. [Google Scholar] [CrossRef] [Green Version]
  20. Ren, S.; He, K.; Girshick, R.; Sun, J. Faster R-CNN: Towards Real-Time Object Detection with Region Proposal Networks. IEEE Trans. Pattern Anal. Mach. Intell. 2017, 39, 1137–1149. [Google Scholar] [CrossRef] [PubMed] [Green Version]
  21. Redmon, J.; Divvala, S.; Girshick, R.; Farhadi, A. You Only Look Once: Unified, Real-Time Object Detection. In Proceedings of the 2016 IEEE Conference on Computer Vision and Pattern Recognition (CVPR), Las Vegas, NV, USA, 27–30 June 2016; pp. 779–788. [Google Scholar] [CrossRef] [Green Version]
  22. Liu, W.; Anguelov, D.; Erhan, D.; Szegedy, C.; Reed, S.; Fu, C.; Berg, A.C. SSD: Single Shot MultiBox Detector. In Computer Vision—ECCV 2016; Lecture Notes in Computer Science; Springer: Cham, Switzerland, 2016; Volume 9905, pp. 21–37. [Google Scholar] [CrossRef] [Green Version]
  23. Long, J.; Shelhamer, E.; Darrell, T. Fully Convolutional Networks for Semantic Segmentation. In Proceedings of the 2015 IEEE Conference on Computer Vision and Pattern Recognition (CVPR), Boston, MA, USA, 7–12 June 2015; pp. 640–651. [Google Scholar] [CrossRef] [Green Version]
  24. Badrinarayanan, V.; Kendall, A.; Cipolla, R. SegNet: A Deep Convolutional Encoder-Decoder Architecture for Image Segmentation. IEEE Trans. Pattern Anal. Mach. Intell. 2017, 39, 2481–2495. [Google Scholar] [CrossRef] [PubMed]
  25. Ronneberger, O.; Fischer, P.; Brox, T. U-Net: Convolutional Networks for Biomedical Image Segmentation; Springer International Publishing: Berlin/Heidelberg, Germany, 2015. [Google Scholar] [CrossRef] [Green Version]
  26. Nhat-Duc, H.; Nguyen, Q.; Tran, V. Automatic recognition of asphalt pavement cracks using metaheuristic optimized edge detection algorithms and convolution neural network. Autom. Constr. 2018, 94, 203–213. [Google Scholar] [CrossRef]
  27. Hamed, M.; Peng, J.; Yaw, A.; William, B. Pavement Image Datasets: A New Benchmark Dataset to Classify and Densify Pavement Distresses. Transp. Res. Rec. J. Transp. Res. Board 2020, 2674, 328–339. [Google Scholar] [CrossRef] [Green Version]
  28. Ji, A.; Xue, X.; Wang, Y.; Luo, X.; Xue, W. An integrated approach to automatic pixel-level crack detection and quantification of asphalt pavement. Autom. Constr. 2020, 114, 103176. [Google Scholar] [CrossRef]
  29. Park, S.; Bang, S.; Kim, H.; Kim, H. Patch-Based Crack Detection in Black Box Images Using Convolutional Neural Networks. J. Comput. Civ. Eng. 2019, 33, 04019017. [Google Scholar] [CrossRef]
  30. Flah, M.; Suleiman, A.R.; Nehdi, M.L. Classification and quantification of cracks in concrete structures using deep learning image-based techniques. Cem. Concr. Compos. 2020, 114, 103781. [Google Scholar] [CrossRef]
  31. Pratt, L.; Govender, D.; Klein, R. Defect detection and quantification in electroluminescence images of solar PV modules using U-net semantic segmentation. Renew. Energy 2021, 178, 1211–1222. [Google Scholar] [CrossRef]
  32. Lin, D.; Li, Y.; Prasad, S.; Nwe, T.L.; Dong, S.; Oo, Z.M. CAM-guided Multi-Path Decoding U-Net with Triplet Feature Regularization for Defect Detection and Segmentation. Knowl. Based Syst. 2021, 228, 107272. [Google Scholar] [CrossRef]
  33. Rong-qiang, L.; Ming-hui, L.; Jia-chen, S.; Yi-bin, L. Fabric Defect Detection Method Based on Improved U-Net. J. Phys. Conf. Ser. 2021, 1948, 012160. [Google Scholar] [CrossRef]
  34. Zhong, Q.; Zhang, J.; Xu, Y.; Li, M.; Shen, B.; Tao, W.; Li, Q. Filamentous target segmentation of weft micro-CT image based on U-Net. Micron 2021, 146, 102923. [Google Scholar] [CrossRef]
  35. Deriche, R. Using Canny’s criteria to derive a recursively implemented optimal edge detector. Int. J. Comput. Vis. 1987, 1, 167–187. [Google Scholar] [CrossRef]
  36. Wang, Y.; Zhang, J.Y.; Liu, J.X.; Zhang, Y.; Chen, Z.P.; Li, C.G.; He, K.; Yan, R.B. Research on Crack Detection Algorithm of the Concrete Bridge Based on Image Processing. Procedia Comput. Sci. 2019, 154, 610–616. [Google Scholar] [CrossRef]
  37. Qiang, S.; Guoying, L.; Jingqi, M.; Hongmei, Z. An Edge-Detection Method Based on Adaptive Canny Algorithm and Iterative Segmentation Threshold. In Proceedings of the 2016 2nd International Conference on Control Science and Systems Engineering, Singapore, 27–29 July 2016; pp. 64–67. [Google Scholar] [CrossRef]
  38. Xie, S.; Tu, Z. Holistically-Nested Edge Detection. Int. J. Comput. Vis. 2017, 125, 3–18. [Google Scholar] [CrossRef]
  39. Wei, K.; Jie, C.; Jianbin, J.; Guoying, Z.; Qixiang, Y. SRN: Side-Output Residual Network for Object Reflection Symmetry Detection and Beyond. IEEE Trans. Neural Netw. Learn. Syst. 2021, 32, 1881–1895. [Google Scholar]
  40. Liu, Y.; Yao, J.; Lu, X.; Xie, R.; Li, L. DeepCrack: A deep hierarchical feature learning architecture for crack segmentation. Neurocomputing 2019, 338, 139–153. [Google Scholar] [CrossRef]
  41. Konrad, H.; Lichao, M.; Celia, B.; Andreas, D.; Xiang, Z. HED-UNet: Combined Segmentation and Edge Detection for Monitoring the Antarctic Coastline. IEEE Trans. Geosci. Remote Sens. 2021, 60, 4300514. [Google Scholar] [CrossRef]
  42. Sergey, L.; Christian, S. Batch normalization: Accelerating deep network training by reducing internal covariate shift. In Proceedings of the 32nd International Conference on International Conference on Machine Learning, Lille, France, 6–11 July 2015; pp. 448–456. [Google Scholar]
  43. He, K.; Sun, J.; Tang, X. Guided Image Filtering. IEEE Trans. Pattern Anal. Mach. Intell. 2013, 35, 1397–1409. [Google Scholar] [CrossRef] [PubMed]
  44. Chen, T.; Cai, Z.; Zhao, X.; Chen, C.; Liang, X.; Zou, T.; Wang, P. Pavement crack detection and recognition using the architecture of segNet. J. Ind. Inf. Integr. 2020, 18, 100144. [Google Scholar] [CrossRef]
  45. Wen, Z.; Wang, H.; Yuan, H.; Liu, M.; Guo, X. A method of pulmonary embolism segmentation from CTPA images based on U-net. In Proceedings of the 2019 IEEE 2nd International Conference on Computer and Communication Engineering Technology (CCET), Beijing, China, 16–18 August 2019; pp. 31–35. [Google Scholar] [CrossRef]
  46. Li, D.; Duan, Z.; Hu, X.; Zhang, D. Pixel-Level Recognition of Pavement Distresses Based on U-Net. Adv. Mater. Sci. Eng. 2021, 2021, 5586615. [Google Scholar] [CrossRef]
  47. Russell, B.C.; Torralba, A.; Murphy, K.P.; Freeman, W.T. LabelMe: A Database and Web-Based Tool for Image Annotation. Int. J. Comput. Vis. 2008, 77, 157–173. [Google Scholar] [CrossRef]
  48. Wada, K. LabelMe. Github. 2019. Available online: https://github.com/wkentaro (accessed on 15 March 2021).
  49. Kingma, D.P.; Ba, J. Adam: A Method for Stochastic Optimization. arXiv 2014, arXiv:1412.6980. [Google Scholar]
  50. Chambon, S.; Moliard, J. Automatic Road Pavement Assessment with Image Processing: Review and Comparison. Int. J. Geophys. 2011, 2011, 989354. [Google Scholar] [CrossRef] [Green Version]
Figure 1. Illustration of our proposed Side-output U-Net architecture.
Applsci 12 04714 g001
Figure 2. Illustration of a side-output module.
Applsci 12 04714 g002
Figure 3. Cracks of rough pavement are divided into two parts: the edge and the interior.
Applsci 12 04714 g003
Figure 4. Selected detection part of the No. 326 State Road and the No. 248 State Road.
Applsci 12 04714 g004
Figure 5. The original images and the processed images.
Applsci 12 04714 g005
Figure 6. Annotation at pixel level using LabelMe tool: (a) original image; (b) labeled crack binary image; (c) labeled crack edge binary image.
Applsci 12 04714 g006
Figure 7. Labeled images under different conditions: (a) asphalt pavement; (b) cement pavement; (c) shadow interference; (d) water stain interference.
Applsci 12 04714 g007
Figure 8. Training process of network model: (ac) are the variation curves of 7 loss values with the epochs when the learning rate is equal to 1 × 10 3 , 1 × 10 4 , and 1 × 10 5 , respectively; (d) Variation curve of overall loss value with the epochs under different learning rates; (e) Variation curve of MIoU value measured on the training set; (f) Variation curve of pixel error measured on the training set.
Applsci 12 04714 g008
Figure 9. Identification results of different pavement types: (a) single crack in asphalt pavement; (b) single crack in cement pavement; (c) multiple cracks in asphalt pavement; (d) multiple cracks in cement pavement; (e) net-shaped crack in asphalt pavement; (f) net-shaped crack in cement pavement.
Applsci 12 04714 g009
Figure 10. Identification results under the interference of different environmental conditions: (ac) are single crack, multiple cracks, and net-shaped crack in water interference, respectively; (df) are single crack, multiple cracks, and net-shaped crack in shadow interference, respectively.
Applsci 12 04714 g010
Figure 11. Fusion process and result of segmented image and edge image: (a) Linear fusion process of output images for (b) single crack, (c) multiple cracks, (d) net-shaped crack.
Applsci 12 04714 g011
Figure 12. Statistics of the crack’s width at different positions: (a) the width of the initial position, middle position, and end position of the crack; (b) the width error statistical charts of SoUNet and U-NET.
Applsci 12 04714 g012
Figure 13. Comparison of prediction results on our dataset.
Applsci 12 04714 g013
Figure 14. Comparison of prediction results on the FISSURES dataset.
Applsci 12 04714 g014
Table 1. Proportion of crack and non-crack annotations in the dataset.
QuantityCrack Pixels (%) Non-Crack Pixels (%)
Training data4206.7993.21
Validation data1204.1495.86
Test data606.5293.48
Table 2. Proportion of images in different pavement types and environmental conditions.
PavementEnvironment
TypesConcreteAsphaltNormal BrightnessLow BrightnessHigh BrightnessShadowWater Stain
Percentage (%)21.678.481.813.05.29.220.7
Table 3. Evaluation results of the model.
MethodsMetrics
MIoUMPAODS-FOIS-F
SoUNet-Output-167.1772.31
SoUNet-Fusion-1269.6478.2531.5232.99
SoUNet-Fusion-1369.3280.3333.1434.11
SoUNet-Fusion-1468.2981.5432.0833.15
SoUNet-Fusion-1565.9281.8929.4630.63
SoUNet-Fusion-1660.3981.5125.6626.73
SoUNet-Fusion-1769.4280.1433.0834.08
Table 4. Evaluation and comparison results of different methods on two datasets.
DatasetsOur Test DatasetsFISSURES Datasets
MetricsMIoUMPAMioUMPA
SegNet63.7769.9256.3460.65
HED64.5670.7058.3065.86
VGG16-U-Net66.9974.5759.1267.66
SoUNet-Basic67.4675.5959.1568.45
SoUNet-BN68.4674.6560.0765.56
SoUNet-GF68.4177.2861.0467.81
SoUNet-Fusion69.3280.3361.0568.60
Publisher’s Note: MDPI stays neutral with regard to jurisdictional claims in published maps and institutional affiliations.

