Article

Identification of 3D Lip Shape during Japanese Vowel Pronunciation Using Deep Learning

1
Division of Informatics, Tokyo City University, 1-28-1 Tamazutsumi, Setagaya-ku, Tokyo 1588557, Japan
2
Department of Computer Science, Tokyo City University, 1-28-1 Tamazutsumi, Setagaya-ku, Tokyo 1588557, Japan
*
Author to whom correspondence should be addressed.
Appl. Sci. 2022, 12(9), 4632; https://doi.org/10.3390/app12094632
Submission received: 28 March 2022 / Revised: 2 May 2022 / Accepted: 3 May 2022 / Published: 5 May 2022
(This article belongs to the Special Issue Applications of Deep Learning and Artificial Intelligence Methods)

Abstract

:
People with speech impediments and hearing impairments, whether congenital or acquired, often encounter difficulty in speaking. Therefore, to acquire conversational communication abilities, it is necessary to practice lipreading and imitation so that correct vocalization can be achieved. In conventional lipreading methods using machine learning, model refinement and multimodal processing are the norm to maintain high accuracy. However, since 3D point clouds can now be obtained using smartphones and other devices, it is becoming viable to consider methods that use 3D information. Therefore, given the obvious relation between vowel pronunciation and three-dimensional (3D) lip shape, in this study, we propose a method of extracting and discriminating vowel features via deep learning using 3D point clouds of the lip region. For training, we created two datasets: mixed-gender and male-only datasets. The results of the experiment showed that the average accuracy rate of the k-fold cross-validation exceeded 70% for both the mixed-gender and male-only data. In particular, although the proposed method was ~3.835% less accurate than the machine learning results for 2D images, the training parameters were reduced by 92.834%, and the proposed method succeeded in obtaining vowel features from 3D lip shapes.

1. Introduction

People with speech impediments and hearing impairments, whether congenital or acquired, often encounter difficulty in speaking [1]. Therefore, it is necessary to practice vocalizations, so that they can speak correctly [2]. In this way, they can acquire conversational speaking abilities that are common to otherwise healthy people. Communication also requires listening. For this, many people are required to acquire lipreading skills to interpret the movements of other people’s mouths and determine the contents of conversations [3]. In particular, Japanese, as a 50-syllable language, is composed of a combination of consonants and vowels to form a single sound, so research on inferring consonants from vowel sequences and inferring words has been active in the field of natural language [4]. This is rooted in the fact that the lipreader actually understands the language by looking at the shape of the mouth and the order in which it moves. Therefore, in Japanese, vowel identification is important in lipreading, in learning in developmental training, and in machine lipreading.
In Japanese speech practice, it is fundamental to learn the pronunciation of vowels [5] that are phonetically formed by mouth shapes. To practice vowels, an instructor presents the shape of the mouth for pronunciation, and the trainee imitates the shape [3].
In recent years, as smartphones and cameras have become mainstream, machine learning lipreading techniques have been actively researched using algorithmic methods to identify specific words with high accuracy [6,7]. This makes it possible for healthy, speech-impaired, or hearing-impaired people to imitate what the other person is saying on a display, such as a smartphone, simply by silently changing the shape of their mouth [7]. However, this technique only accounts for the listening part of a conversation and is a tool that can be used by people who can vocalize well.
Even today, there are few tools for learning correct pronunciation, and vocal practice with a trainer is the norm. Many proposed training methods that use information processing are multimodal and use multiple processing devices, images, sounds, and vocal fold sensors, which impose a heavy burden during training [8]. Therefore, the authors believe that the three-dimensional (3D) shapes of the mouth can play a leading role in machine-learning-assisted pronunciation training. Hence, we have been studying the identification of vowels using 3D point clouds [9]. TOF cameras that use infrared sensors emit infrared light of a specific wavelength and measure the distance to an object according to its time of flight [10]. Since only specific wavelengths are detected, it is possible to acquire a 3D point cloud robust to the lighting environment of the shooting environment [11]. The use of a 3D point cloud is also expected to be a recognition method as previously reported, as it is robust to the effects of facial orientation if the area to be identified can be captured [12]. As a conventional vowel recognition method based on two-dimensional (2D) images, a method has been proposed to recognize the shape of lips as a feature of frontal 2D images of faces [13]. However, the identification rate of the method using the polyline lip region is 59.8%, whereas that of the method using the spline curve lip region is 61.6%. Using only 2D images has the problem of misrecognizing mouth shapes similar to “a” and “e”, resulting in a low identification rate. In the method proposed by the authors, a 3D point cloud was acquired using a time-of-flight (ToF) camera for vowel identification, and it was confirmed that a high identification rate was obtained by adding depth information to the frontal image. The 3D point cloud comprises the shape information of the lips, obtained via 3D images of the lips; such information is not available in 2D images. Therefore, a different method is required for identification, instead of the feature points used from color information. However, their original method lacked versatility because it was necessary to save each trainee’s mouth shape as model data.
In this study, we aimed to capture and identify mouth features as vowels, excluding features related to each person’s vocalization, by learning the shape of the mouth through deep learning using a 3D point cloud.

2. Materials and Methods

The five Japanese vowels are phonetically distinct and rely on well-known and easy-to-practice changes in mouth shape [14]. Hence, simple resonant vocalization can be used to create the basic phonemes. The characteristics of speech resonance can be extracted from recorded speech signals by manipulating the amplitude spectrum. Peak resonance frequency measurement is the norm [15]. The formant frequencies are called the first formant (F1), second formant (F2), and third formant (F3) in descending order, and it has been reported previously that Japanese vowels can be distinguished mainly by F1 and F2 [16]. As the formant frequency of Japanese vowels is determined by the shape of the mouth, a three-dimensional (3D) interpretation of mouth shape should be capable of discriminating vowels. In the proposed method, the mouth shapes of the five vowels pronounced by a healthy Japanese subject were acquired as 3D point clouds. Next, using a model that can learn 3D point clouds, we divided the 3D point clouds acquired by learning into five classes. Finally, the unknown mouth shapes of the vowels were identified and evaluated.

2.1. Acquisition of 3D Point Cloud of Mouth Shape during Vowel Pronunciation

First, landmarks of a person’s face were detected from a video acquired using a color camera, and the lip region was then determined based on visual landmarks. Figure 1 shows an example of lip-region detection. Dlib’s FaceLandmark Detector was used for landmark detection in Figure 1. Dlib’s FaceLandmark is capable of acquiring 68 points for facial contours, eyebrows, eyes, and other parts of the face. The detection accuracy and speed are high as it corresponds to the orientation and size of the face using a machine learning model. The 68 points to be acquired include the contours of the face, nose, eyes, and mouth. Even if the position of the lips cannot be accurately captured due to a mustache, etc., the position of the lips can be estimated and detected from other feature points. In this case, 20 points of Dlib’s FaceLandmark adjacent to the lip contours were used. From these 20 points, we could obtain the boundary (contour) of the lips by connecting the adjacent points to the outside and inside of the lips, respectively. Next, a 3D sensor was used to acquire a 3D point cloud. By mapping the coordinates of the 3D sensor and the color camera to both in advance, the color image and the coordinates on the 3D point cloud were matched. This made it possible to use the coordinates of the lip area acquired from the color camera as coordinates in the 3D point cloud. Figure 2 shows an example of the lip region extracted from a 3D point cloud. Figure 2 shows an example of a lip point cloud cut from a face point cloud based on the lip contour obtained in Figure 1. The 3D sensor used in this study uses the ToF method [10] rather than a stereo camera method [17] because the mouth shape was photographed at a short distance and the lips had little color change. With stereo imaging, it may not be possible to detect feature points. The ToF method is a 3D sensor that measures the distance using the time it takes for the ultrashort pulses to be reflected by the measuring object and return to the light-receiving device without using feature points. As lip color varies considerably from person to person, the color information is not stored because it may affect identification processes.

2.2. Identification and Learning of Lip Area via 3D Point Cloud

The properties of 3D point clouds include permutation and transformation invariance of points. Therefore, it is possible to design a model with a high degree of freedom for identification by maintaining these properties and performing deep learning. Permutation invariance means that even if the order of input values changes, the output value can be handled by a fixed function, such as sum, average, or maximum value selection. In deep learning networks, maximum pooling is the hierarchy of the network that corresponds to the property of permutation invariance. In transformation invariance, the shape of the point cloud appears to be different depending on the viewpoint from which it is taken, but the relationship between the points in the point cloud remains the same, regardless of the viewpoint. Thus, it minimizes the effect during training. The effort required in the learning process can be minimized.
The classification of the proposed method uses a model for 3D point clouds called PointNet [18]. Figure 3 shows the training model used in the proposed method. The ‘n’ in Figure 3 indicates the number of point clouds. In the learning model, the input transform first performed an affine transformation on the input point cloud (input points) to approximate the movement invariance. Thereafter, features were extracted from the affine-transformed point cloud with a multilayer perceptron composed by PyTyorch’s nn. Linear, feature transform was used to apply affine transformation to the extracted features. The multilayer perceptron was used again to extract feature data. Max pooling was then used to extract feature data that were sequentially invariant. Global features were used for segmentation as well as classification, but since this paper only performed classification, it was necessary to perform a final transformation. The features were transformed into the number of classes k using a multilayer perceptron and classified accordingly. Final class identification was performed using SoftMax. The bold square indicates the feature array size of the processed point cloud or array. At this time, the multilayer perceptron shared the weights among the points and maintained them, and the number of points was arbitrary since max pooling was applied to extract the strongest features from the point cloud.
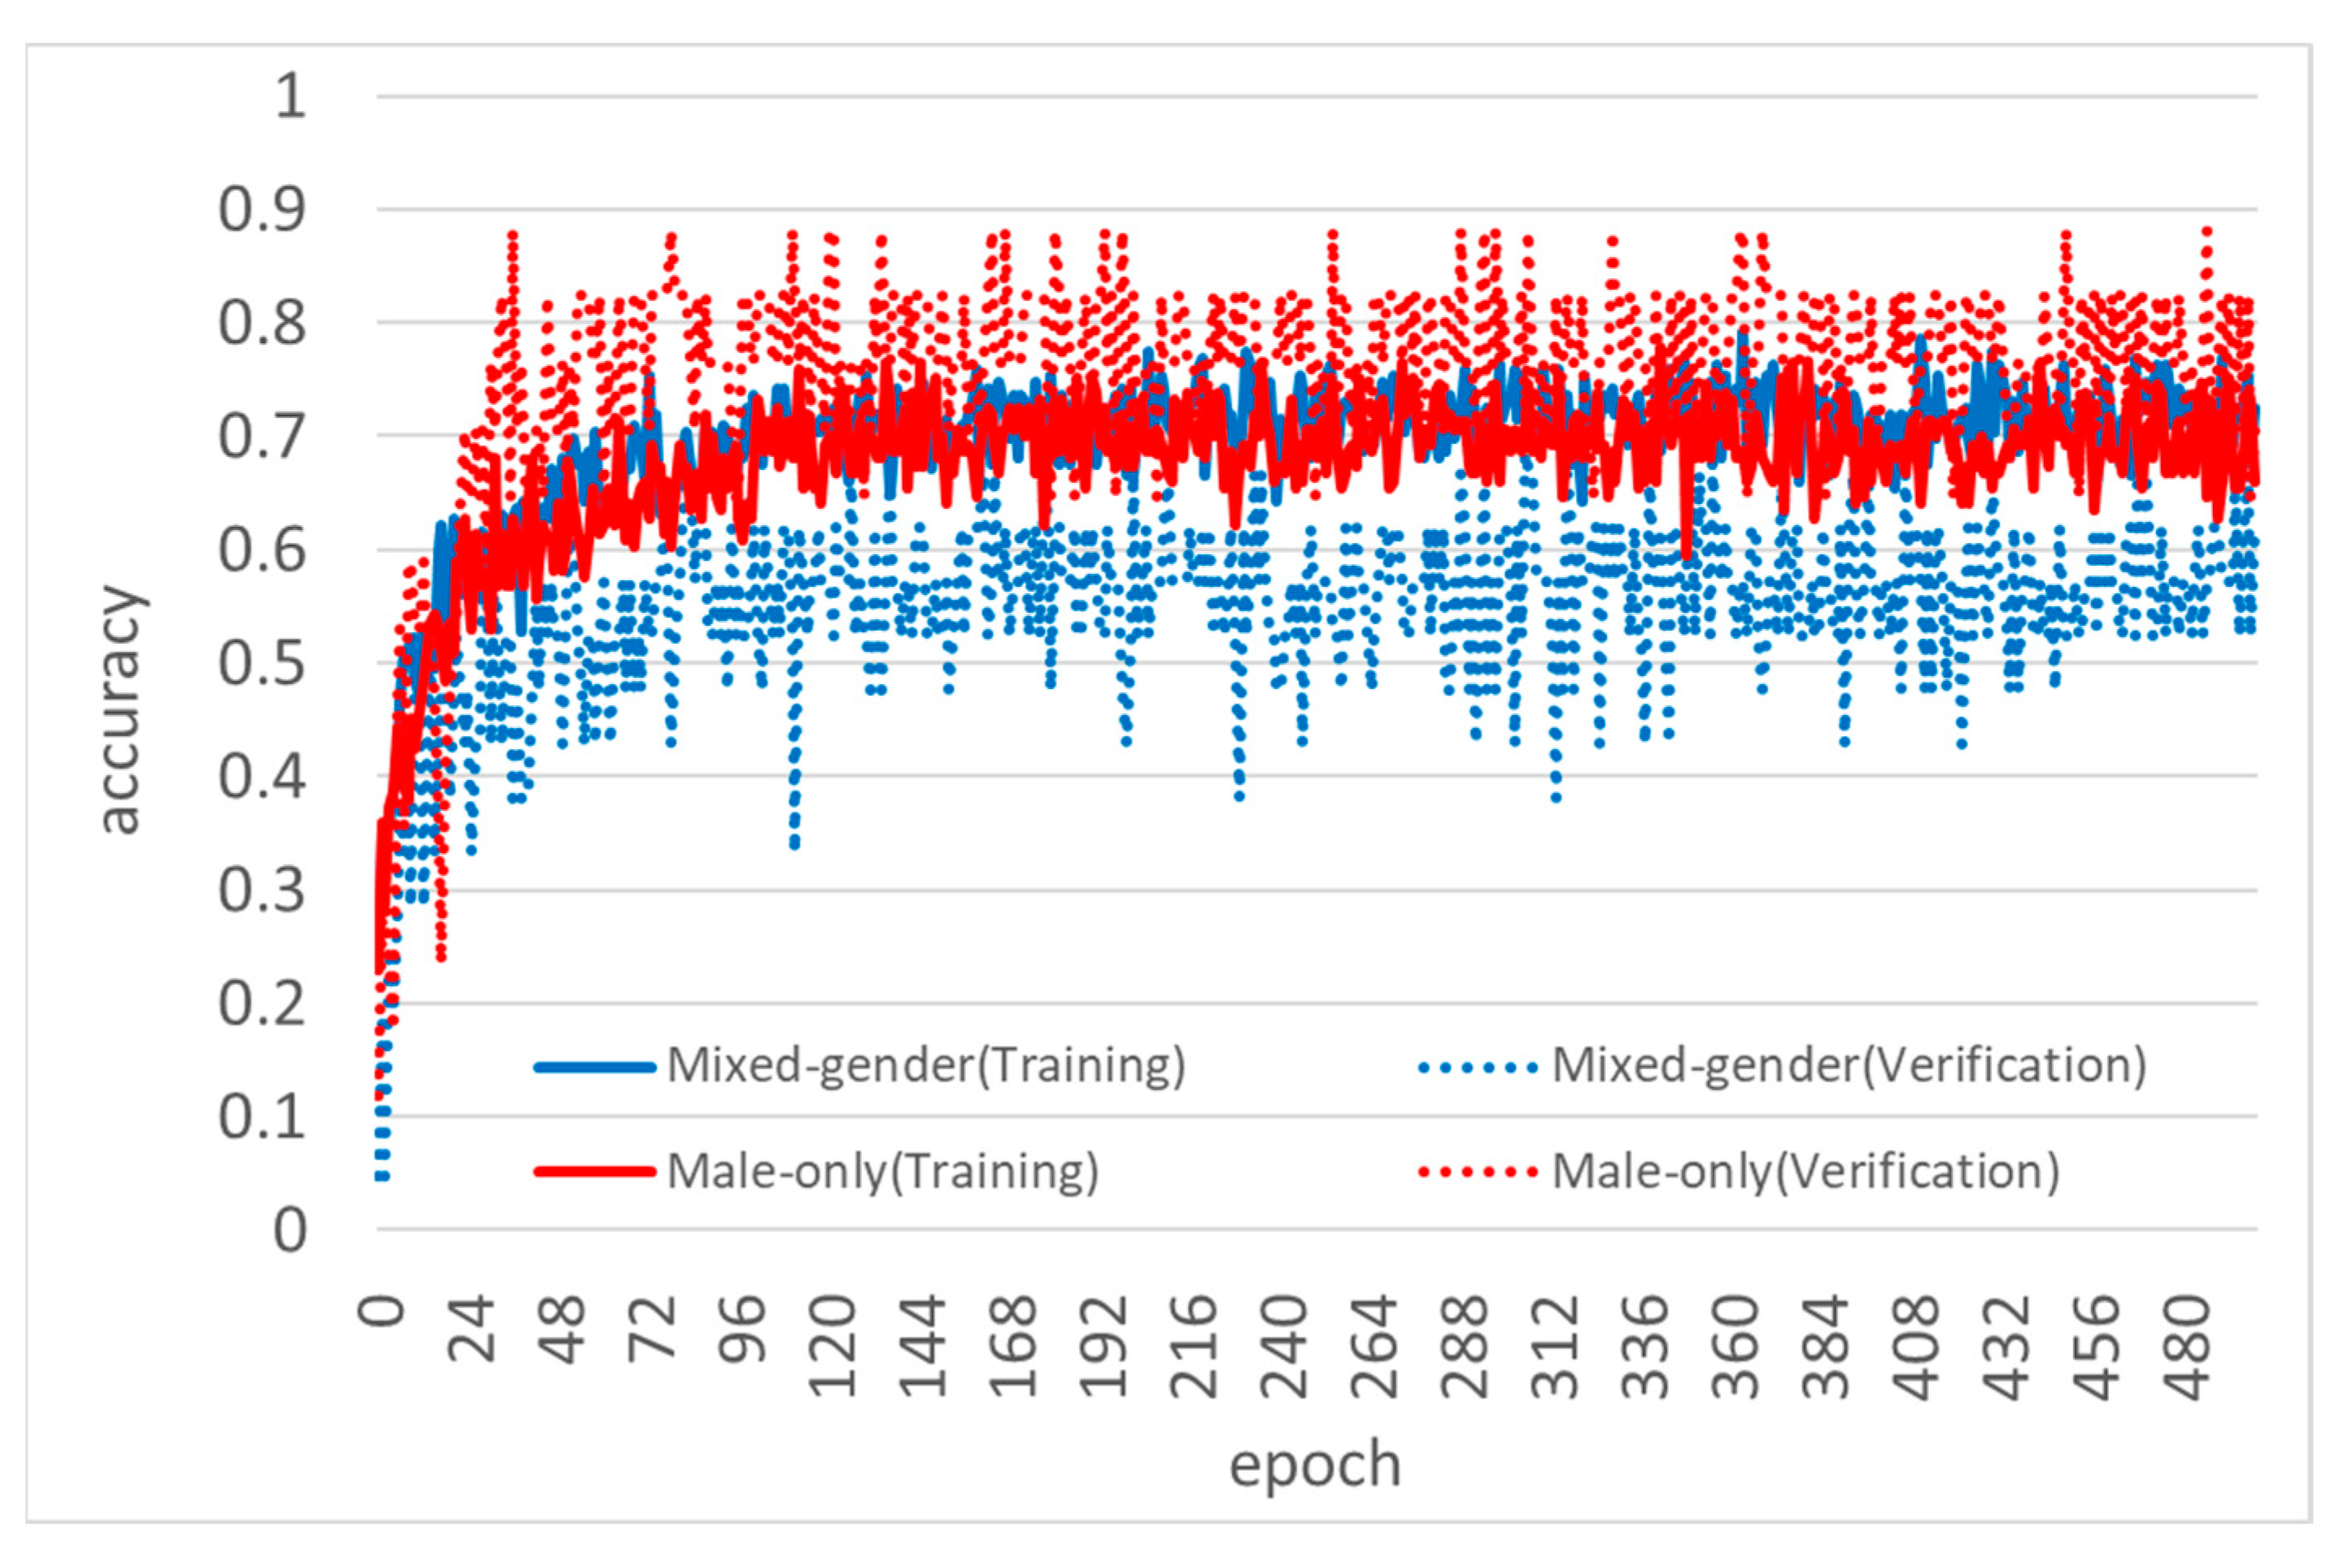
3. Results

3.1. Dataset

As two-dimensional (2D) images are the mainstream for identifying Japanese speech information and no dataset of Japanese vowels captured in 3D has yet been made public, we asked our laboratory students to cooperate in creating a dataset. The dataset was created by obtaining data from 16 male and female students in their 20s (13 males and 3 females). One mouth shape acquired equals one record, and the correspondence between the acquired subjects and the records is shown in Table 1. “A”, “I”, “U”, “E”, and “O” shapes were acquired in succession. The total number of records acquired was 245 (each vowel: 49).
To acquire the records, we first used Vzense’s DCAM710 as the 3D sensor, for which DCAM710 has a built-in color camera and a ToF camera, and the mapping method was provided by the manufacturer’s software development kit to align the coordinates between each camera. Table 2 shows the specifications of the DCAM710 used in the experiment. The subject was placed on a forehead stand, as shown in Figure 4, and the distance between the ToF camera and the subject was set to 0.50 m. The subject was instructed by the measurer to pronounce clearly with a mouth shape in which the basic mouth shape is clearly distinguishable, and the measurement timing was performed by the measurer. For landmark acquisition in the lip region, we used the face landmark detector from Dlib [19]. The face was illuminated from the front to ensure accurate landmark acquisition.

3.2. Experimental Environment

Using the prepared dataset, we trained PointNet, which was programmed using Python and PyTorch. Nvidia’s CUDA toolkit was introduced for fast graphical processing unit (GPU)-based training. Table 3 shows the computer environment in which training and identification were performed.

3.3. Experimental Method

K-fold cross-validation was used in the experiment to examine the relationship between 3D mouth shape and vowel class identification. The prepared dataset was divided into training, validation, and test sets. The number of records of training, validation, and test sets is presented in Table 4. In k-fold cross-validation, k = 10, the training set and validation set were interchanged. The training set, validation set, and test set were divided such that each vowel had the same number of records. The record no. used as the test data is shown in Table 5. Records other than those in Table 5 were used for k-fold cross-validation. Additionally, two types of training and testing were conducted: mixed-gender and male-only datasets. The combination of formant frequencies of male and female vowels is very different, and it is possible to discriminate between males and females according to frequency of pitch [20]; the purpose of this experiment was to determine the effect of gender on pitch frequency. The training epoch was set at 500, and the bit size was set at 16. The optimizer for the machine learning model was Adam [21], and the loss function was F.cross_entropy() from PyTorch. The training data should be used without padding. In order to compare the results with conventional methods, 2D images taken simultaneously during the acquisition of the 3D point cloud dataset were used to compare the results with those obtained using Xception [22]. Xception is considered to be one of the most accurate methods for classifying 2D images.

3.4. Experimental Results

The results of the k-fold cross-validation are shown in Table 6 and Table 7. In addition, from the fold no., one validation result from each of the two experiments was selected (mixed-gender and male-only: rows in bold in Table 6 and Table 7). The accuracy percentage during the learning process is shown in Figure 5, and losses are shown in Figure 6. The solid and dotted lines represent the results for the training and validation data, respectively. The test data were divided using the respective post-training models; the corresponding confusion matrices are presented in Table 8 and Table 9. The results of the validation using the Xception model, a conventional method, are shown in Table 10 and Table 11. The learning time was 36 min and 6 s for a mixed-gender case and 34 min and 26 s for a male-only case to learn one fold, compared to 2 h, 2 min, and 49 s for a mixed-gender case and 1 h, 24 min, and 40 s for a male-only case with the Xception model, which is the conventional method.

4. Discussion

Table 6 and Table 7 show that the accuracy rate of k-fold cross-validation exceeded 70% in both the mixed-gender and male-only experiments. As shown in Table 8 and Table 9, the accuracy of the test data identification results was 82.67% for the mixed-gender experiment and 85.20% for the male-only experiment. From the training results using 2D images (the conventional method: Table 10 and Table 11) and those from 3D point clouds (the proposed method: Table 6 and Table 7), it can be seen that in the mixed results, accuracy, recall, and F-measure decreased by 2.945%, 3.835%, and 3.458%, respectively, while precision increased by 0.404% in accuracy compared to the conventional method. The male-only results show that the accuracy, precision, recall, and F-measure decreased by 2.538%, 0.487%, 2.795%, and 2.689%, respectively. The total parameters of the Xception model used in the experiment was 22,960,173, while the total number of parameters of the proposed method was 1,645,385. The total parameters of the proposed method was 92.834% less than that of the conventional method. The proposed method uses only the coordinates of the point cloud and does not use pixel information, while the conventional method uses image coordinates and pixel information. Therefore, the input information was reduced, contributing to a reduction in the number of parameters. In addition, by generating a training model for vowel identification using a 3D point cloud, it is possible to maintain the order independence that provides degrees of freedom in the input array of point clouds. A point cloud of only the lip region can extract lip shape features with a few parameters and achieve 3.835% accuracy, as compared to conventional methods. In machine learning methods, models with a huge number of parameters have been proposed to improve accuracy, and research has also been conducted to reduce the number of parameters and decrease the computational cost [22]. Xception, which was used as a conventional method in this study, is also known as a method that reduces the number of parameters while maintaining a highly accurate model [22]. In the proposed method, by changing the input data from 2D images to 3D point clouds in the same way, it was confirmed that the number of parameters can be reduced, and identification can be performed with a high degree of accuracy.
A hidden-Markov-model-based method has been proposed for identifying Japanese vowels [23]. In this conventional method [23], as in the proposed method, only the lip region is extracted for recognition; the average vowel identification rate from the lip region alone was 75.4%. Another method, the dynamic-contour-model-based vowel recognition method, extracts the lip shape and uses this information to recognize vowels [24]; the average discrimination rate of this method was 72.3%. The identification rate of the proposed method using the male-only dataset was 4.48% higher than that of the HMM-based approach and 8.96% higher than that of the DCM-based approach.
In recent years, multimodal methods have been reported for Japanese speech recognition [25]. This method uses speech information, color images, and depth images for training, and the best recognition rate (79.1%) was achieved using all three. Table 6 and Table 7 show that the proposed method discriminated 71.3% of the test data with k-fold cross-validation accuracy for the mixed-gender dataset and 78.8% for the male-only dataset, indicating that the proposed method is more accurate than the conventional method in terms of the discrimination rate of the test data. From this result, it can be claimed that the accuracy of the proposed method and that of the conventional method are comparable. However, unlike the conventional method, the proposed method is a discrimination method using only 3D depth point clouds. The noise in the depth image of the conventional method may have affected the accuracy of the conventional method. 
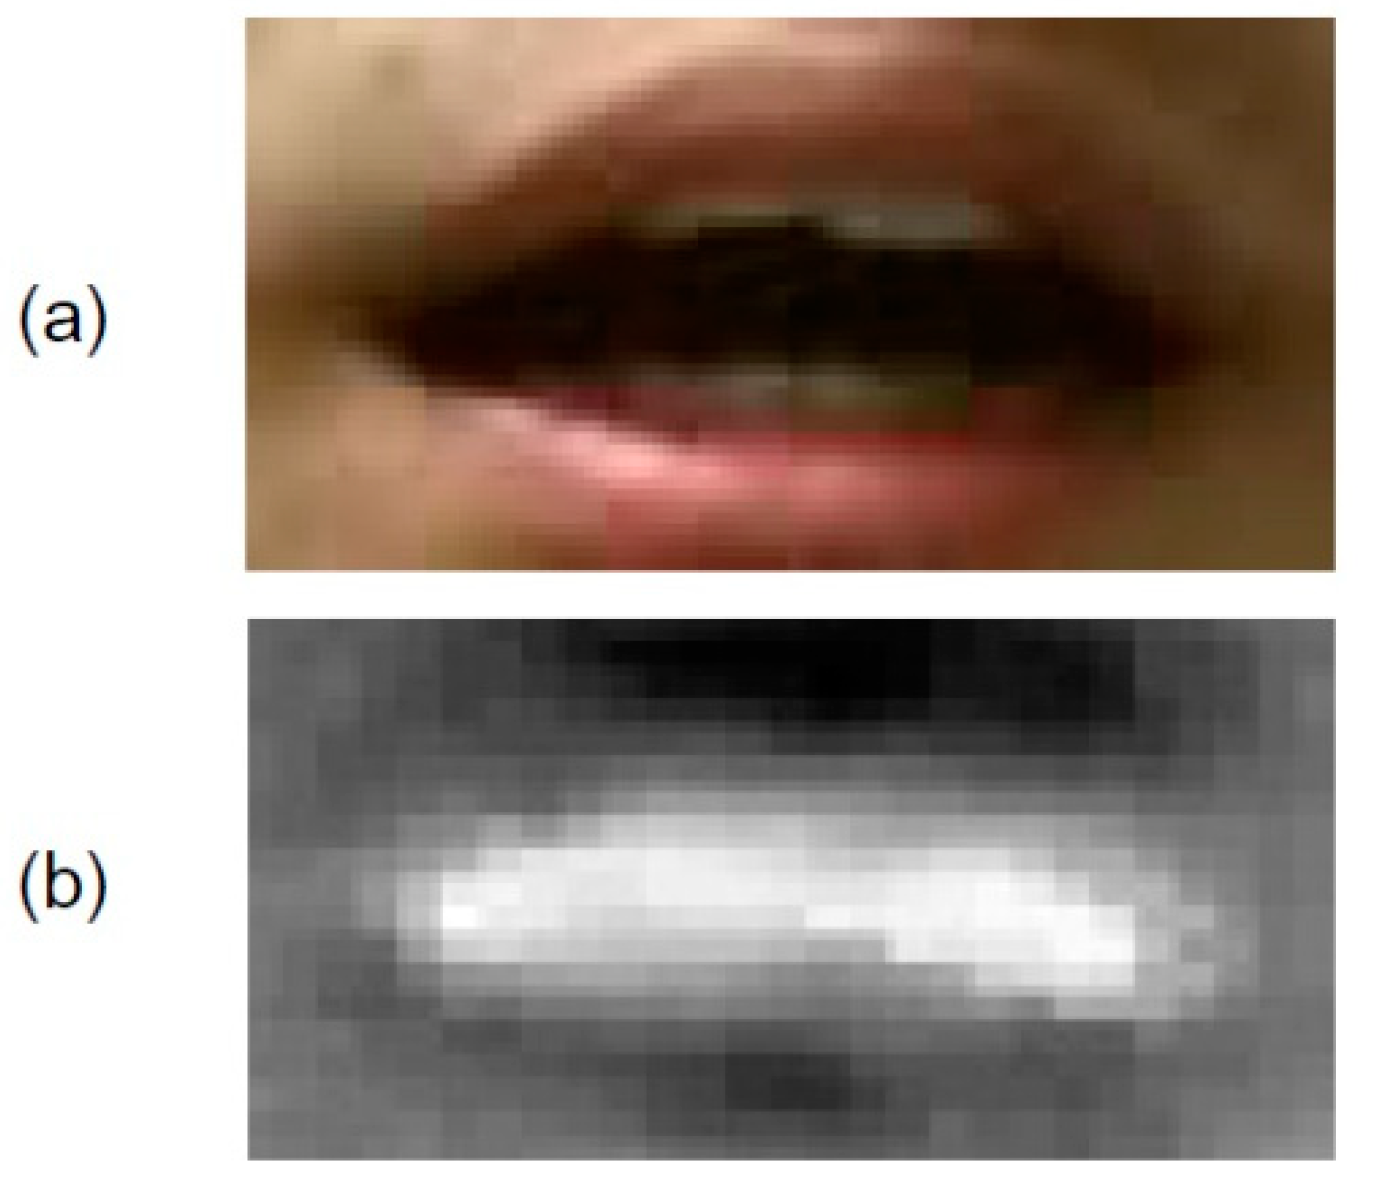
Figure 7 shows the depth image used for training in the conventional method. Figure 7 shows that depth data other than those of the lip region are included. It is thought that the depth noise outside the lip region affects the discrimination rate. In our proposed method, we removed the learning noise other than that for the lips by learning with a 3D point cloud of only the lip region, as shown in Figure 2. Furthermore, by treating the 3D data as a point cloud, we achieved a more robust recognition of lip movements.
Table 6 and Table 7 indicate that the results of the male-only experiment were better than those of the mixed-gender experiment for all parameters. From the training process shown in Figure 5, the accuracy rate during validation was higher than that during training when using the male-only dataset. In other words, the model trained on a training dataset with a large number of data correctly answered a larger number of validation data. Conversely, in the case of the mixed-gender dataset, the accuracy rate during validation decreased more than that during training. This can be explained by the fact that there were many data that did not fit the trained model. In other words, the mixed-gender model was over-trained for the training dataset and could not make correct judgments on the data at the time of validation. For the male-only dataset, the model parameters obtained from the training data were appropriate, and the accuracy rate increased during validation. The reason for the change in the learning state depending on the dataset is thought to be related to the differences in the skeletal structure of men and women. In fact, in the field of phonetics, a difference in formant frequency between males and females has been reported [14]. In other words, it is thought that the shape of the mouth, the factor that causes changes in formant frequency, also differs significantly between men and women. Hence, this factor was thought to cause overfitting during the study.
In the future, the proposed method is expected to be implemented in smartphones equipped with stereo cameras and TOF cameras, which have been increasing steadily in recent years and are capable of facial recognition [26]. Combined with natural language processing, which identifies vowels in real time and estimates words based on vowel sequences, the proposed method could contribute to the development of systems in which subtitles and letters can be typed without speech. In addition, since the number of parameters was significantly reduced and the training time was also shortened by using the proposed method, it can be assumed that the machine specs used for identification can be implemented even in small mobile devices such as smartphones.

5. Conclusions

Speech- and hearing-impaired persons often have difficulty speaking. Therefore, in order to learn how to communicate through conversation, they require practice to achieve correct vocalization. For efficient practice, it is important to understand the features related to the pronunciation of each language. In this study, we used deep learning to learn the features of vowel and consonant vocalizations from a 3D point cloud in the lip region, and the following three points were confirmed as a result:
  • Vowel identification is possible with a classifier model using a 3D point cloud as well as with a 2D image.
  • Comparison with the learning results of conventionally used 2D images showed that the accuracy error was within 3.835%, and that the number of learning parameters could be reduced by 92.834%.
  • The accuracy, precision, reproducibility, and F-value of the training results for male-only data were higher than those for mixed-sex data.
  • In Japanese, there is a difference in the shape of the mouth in the pronunciation of males and females, so when imitating the shape of the mouth, practice by two people of the same gender is the best way to learn the correct shape.

Author Contributions

Conceptualization, Y.S.; methodology, Y.S.; software, Y.S.; validation, Y.S. and Y.B.; formal analysis, Y.S.; investigation, Y.S.; resources, Y.S.; data curation, Y.S. and Y.B.; writing—original draft preparation, Y.S.; writing—review and editing, Y.B.; visualization, Y.S.; supervision, Y.B.; project administration, Y.B.; funding acquisition, Y.B. All authors have read and agreed to the published version of the manuscript.

Funding

This research received no external funding.

Institutional Review Board Statement

Not applicable.

Informed Consent Statement

Not applicable.

Data Availability Statement

Not applicable.

Acknowledgments

This work was supported by JSPS KAKENHI (Grant Number JP20K11220). This work was supported by JST SPRING (Grant Number JPMJSP2118).

Conflicts of Interest

The authors declare no conflict of interest.

References

  1. Kariyasu, M.; Toyama, M.; Matsuhira, Y. Epidemiology of Communication Disorders—Prevalence and Estimates. Bull. Fac. Health Med. Sci. 2016, 1, 1–12. [Google Scholar] [CrossRef]
  2. Hoshina, N. A Study of Phonetic Functions of Hearing Impaired Students. Niigata Med. J. 1987, 101, 577–593. Available online: https://hdl.handle.net/10191/36694 (accessed on 15 April 2022).
  3. Ito, T.; Ito, M.; Yamamoto, T. Development and Evaluation of Auditory Perception Training in Elementary School with Resource Rooms: Toward the elimination of the troubled feeling of children who are difficult to hear words. Bull. Saitama Univ. 2018, 67, 215–223. [Google Scholar] [CrossRef]
  4. Miyazaki, T.; Nakashima, T. Recognition Method of Utterance Word for Machine Lip-reading Based on Mouth Shape. IPSJ DICOMO Tech. Rep. 2014, 1, 896–902. Available online: http://id.nii.ac.jp/1001/00104974/ (accessed on 15 April 2022).
  5. Matsuoka, K.; Furuya, T.; Kurosu, K. Speech Recognition by Image Processing of Lip Movements: Discrimination of the Vowels and Its Application to Word Recognition. Trans. Soc. Instr. Contr. Eng. 1986, 22, 191–198. [Google Scholar] [CrossRef] [Green Version]
  6. Saitoh, T.; Konishi, R. Real-Time Word Lip Reading System Based on Trajectory Feature. IEEJ Trans. Electr. Electron. Eng. 2011, 6, 289–291. [Google Scholar] [CrossRef]
  7. Nishikawa, S.; Takahashi, H.; Kobayashi, M.; Ishihara, Y.; Shibata, K. Real-Time Japanese Captioning System for the Hearing Impaired Persons. Trans. Inst. Electron. Info. Comm. Eng. 1995, 78, 1589–1597. Available online: https://ci.nii.ac.jp/naid/110003227376/en/ (accessed on 15 April 2022).
  8. Kobayashi, N.; Hirose, H.; Koike, M.; Hara, Y.; Yamaguchi, H. Voice Therapy for Spasmodic Dysphonia. Jap. J. Logo. Phoni. 2001, 42, 348–354. [Google Scholar] [CrossRef]
  9. Sato, Y.; Bao, Y.; Shiraishi, S. Three-dimension Machine Lip-reading Using Point Pair Feature. Information 2018, 21, 1625–1636. Available online: http://www.information-iii.org/PDF/2105/2105-16.pdf (accessed on 15 April 2022).
  10. Ringbeck, T. A 3D time of flight camera for object detection. In Proceedings of the 8th Conference Optical 3-D Measurement Techniques, Zurich, Switzerland, 9–12 July 2007; Available online: http://hdl.handle.net/20.500.11850/6913 (accessed on 15 April 2022).
  11. Koch, R.; Schiller, I.; Bartczak, B.; Kellner, F.; Köser, K. MixIn3D: 3D Mixed Reality with ToF-Camera. In Proceedings of the Dynamic 3D Imaging: DAGM 2009 Workshop, Jena, Germany, 9 September 2009; Volume 5742, pp. 126–141. [Google Scholar] [CrossRef] [Green Version]
  12. Sato, Y.; Bao, Y. 3D Face Recognition without Using the Positional Relation of Facial Elements. J. Image Graph. 2018, 6, 33–38. [Google Scholar] [CrossRef] [Green Version]
  13. Saitoh, T.; Hisagi, M.; Konishi, R. Analysis of Features for Efficient Japanese Vowel Recognition. IEICE Trans. D 2007, 90, 1889–1891. [Google Scholar] [CrossRef]
  14. Kasuya, H.; Suzuki, H.; Kido, K. Changes in Pitch and first three Formant Frequencies of Five Japanese Vowels with Age and Sex of Speakers. J. Acoust. Soc. Jap. 1968, 24, 355–364. [Google Scholar] [CrossRef]
  15. Furui, S. Digital Speech Processing; Tokai University Press: Tokyo, Japan, 1985; ISBN 4-486-00896-0. [Google Scholar]
  16. Potter, R.K.; Steinberg, J.C. Toward the Specification of Speech. J. Acoust. Soc. Am. 1950, 22, 807–820. [Google Scholar] [CrossRef]
  17. Xu, G. 3D Vision for Robot Manipulation. J. Soc. Instr. Contr. Eng. 2017, 56, 752–757. [Google Scholar] [CrossRef]
  18. Qi, C.R.; Su, H.; Mo, K.; Guibas, L.J. PointNet: Deep Learning on Point Sets for 3D Classification and Segmentation. Comput. Soc. Conf. Comput. Vis. Pattern Recognit. Workshops 2017, 56, 78–85. [Google Scholar] [CrossRef] [Green Version]
  19. Vahid, K.; Josephine, S. One Millisecond Face Alignment with an Ensemble of Regression Trees. In Proceedings of the Conference on Computer Vision and Pattern Recognition, Columbus, OH, USA, 23–28 June 2014; pp. 1867–1874. [Google Scholar] [CrossRef] [Green Version]
  20. Sato, Y.; Obuchi, C.; Kagomiya, T.; Ogane, S.; Shiroma, M.; Noguchi, Y.O.; Kaga, K. Gender categorization by children with normal hearing and children with cochlear implants. Audio Jap. 2020, 63, 181–188. [Google Scholar] [CrossRef]
  21. Kingma, D.P.; Ba, J. Adam: A Method for Stochastic Optimization. In Proceedings of the 3rd International Conference on Learning Representations, San Diego, CA, USA, 7–9 May 2015; Available online: http://arxiv.org/abs/1412.6980 (accessed on 23 March 2022).
  22. Chollet, F. Xception: Deep Learning with Depthwise Separable Convolutions. In Proceedings of the Conference on Computer Vision and Pattern Recognition (CVPR), Honolulu, HI, USA, 21–26 July 2017; pp. 1800–1807. [Google Scholar] [CrossRef] [Green Version]
  23. Ikeda, D.; Katsurada, K.; Iribe, Y.; Nitta, T. Comparison of Lipreading Performance Using Different Facial Regions. In Proceedings of the Human-Agent Interaction Symposium, Kyoto, Japan, 3–5 December 2011. II-2B-6. [Google Scholar]
  24. Nakamura, S.; Kawamura, T.; Sugahara, K. Vowel Recognition System by Lip-Reading Method Using Active Contour Models and its Hardware Realization. In Proceedings of the SICE-ICASE International Joint Conference, Busan, Korea, 18–21 October 2006; pp. 1143–1146. [Google Scholar] [CrossRef]
  25. Yasui, Y.; Iwano, K.; Inoue, N.; Shinoda, K. Multimodal Speech Recognition with Deep Autoencoder Using Depth Image of Lips. In Proceedings of the Asia-Pacific Signal and Information Processing Association Annual Summit and Conference (APSIPA ASC), Kuala Lumpur, Malaysia, 12–15 December 2017; p. 2017-SLP-117. Available online: http://id.nii.ac.jp/1001/00182779/ (accessed on 15 April 2022).
  26. Blahnik, V.; Schindelbeck, O. Smartphone imaging technology and its applications. Adv. Opt. Technol. 2021, 10, 145–232. [Google Scholar] [CrossRef]
Figure 1. Example of lip area detection with a color camera.
Applsci 12 04632 g001
Figure 2. Example of lip area extraction from 3D point cloud.
Applsci 12 04632 g002
Figure 3. Training model. “mlp:” multilayer perceptron.
Applsci 12 04632 g003
Figure 4. Capturing environment of 3D mouth.
Applsci 12 04632 g004
Figure 5. Progress of learning of training and validation data (accuracy).
Applsci 12 04632 g005
Figure 6. Progress of learning training and validation data (loss).
Applsci 12 04632 g006
Figure 7. (a) Color and (b) depth images used for training in conventional methods [25] (Figure 3).
Applsci 12 04632 g007
Table 1. Retrieved record information.
SubjectSexRecord_NoNumber
S00001Male1–5, 131–135, 241–24515
S00002Male6–10, 51–55, 171–175, 191–19520
S00003Male11–15, 61–65, 121–12515
S00004Male16–20, 56–60, 206–210, 216–22020
S00005Female21–25, 31–35, 161–165, 181–18520
S00006Female26–30, 226–230, 236–24015
S00007Male36–40, 76–80, 116–12015
S00008Male41–45, 106–110, 126–130, 136–14020
S00009Male46–50, 141–145, 151–15515
S00010Female66–70, 221–225, 231–23515
S00011Male71–75, 101–10510
S00012Male81–85, 111–115, 146–150, 196–20020
S00013Male86–90, 166–170, 186–19015
S00014Male91–955
S00015Male96–100, 201–205, 211–21515
S00016male156–160, 176–18010
Table 2. Specifications of DCAM710.
CameraContentsSpecifications
RGB ColorResolution640 × 480 (pixels)
FPS30
FOV73° (H) × 42° (V)
Output formatRGB MJPEG
TOFResolution640 × 480 (pixels)
FPS30
FOV69° (H) × 51° (V)
Output formatDepth RAW12
Laser (VCSEL)850 nm
Use Range0.35 m~1.50 m
Accuracy<1% (relative to the distance)
InterfaceUSB 2.0
Table 3. Computer environment in which learning and identification took place.
ContentsSpecifications
OSWindows Server 2016 Datacenter x64
CPUIntel i7-7820X @ 3.6 GHz
Memory48 GB
GPUNVIDIA GeForce GTX 1080 Ti 11 GB
PythonVersion 3.6.11
PyTorchVersion 1.7.0
CUDA ToolkitVersion 10.1.243
Table 4. Number of records used for training, validation, and testing.
TrainingVerificationTest
Mixed-gender1802045
Male-only1531725
Table 5. Record no. combinations of test data used in each experiment (training and verification data used for k-fold cross-validation used records other than those in this table).
Test DataNumber
Mixed-gender“A”1,21,36,56,71,111,116,121,1419
“I”37,67,87,127,132,147,157,177,1979
“U”38,43,48,53,73,123,168,208,2289
“E”4,9,49,69,114,124,164,179,1849
“O”35,75,95,165,170,180,190,215,2259
Male-only“A”11,96,116,121,2415
“I”7,72,192,197,2025
“U”83,93,98,128,2185
“E”44,59,64,84,895
“O”40,90,135,190,2205
Table 6. Accuracy, precision, recall, and F-measure of proposal method (mixed-gender).
Fold No.AccuracyPrecisionRecallF-Measure
10.6670.6430.6600.637
20.7920.8450.7800.785
30.7920.8520.7700.753
40.6250.5960.6100.588
50.7920.8000.7900.788
60.7500.7840.7500.758
70.5420.6830.5300.507
80.7080.6830.6900.673
90.7080.7440.7100.704
100.7500.8030.7500.748
Average0.7130.7430.7040.694
Table 7. Accuracy, precision, recall, and F-measure of proposal method (male-only).
Fold No.AccuracyPrecisionRecallF-Measure
10.7500.7700.7500.755
20.6500.6900.6500.650
30.8500.8700.8500.839
40.8000.8740.8000.790
50.8950.9330.8830.891
60.8000.8530.8000.773
70.8500.8930.8500.843
80.7000.7030.7000.681
90.6500.6870.6500.653
100.9330.9500.9330.931
Average0.7880.8220.7870.781
Table 8. Confusion matrix using test data (mixed-gender).
Predicted
“A”“I”“U”“E”“O”
Actual“A”787014
“I”3741111
“U”048600
“E”4536810
“O”7061166
Table 9. Confusion matrix using test data (male-only).
Predicted
“A”“I”“U”“E”“O”
Actual“A”460040
“I”044510
“U”054500
“E”221405
“O”035438
Table 10. Accuracy, precision, recall, and F-measure of Xception model (mixed-gender).
Fold No.AccuracyPrecisionRecallF-Measure
10.6000.6300.6000.609
20.7200.7340.7200.720
30.7600.8010.7600.758
40.8000.8350.8000.797
50.8000.8030.8070.791
60.5200.4250.5000.457
70.8400.8630.8470.842
80.6800.6050.6600.597
90.7200.7870.7200.710
100.9000.9200.9000.898
Average0.7340.7400.7310.718
Table 11. Accuracy, precision, recall, and F-measure of Xception model (male-only).
Fold No.AccuracyPrecisionRecallF-Measure
10.8000.8170.8100.803
20.7000.6770.7000.685
30.8500.8530.8500.848
40.6500.6530.6500.648
50.8500.8670.8500.846
60.8000.8530.8000.782
70.8500.8700.8430.848
80.8500.8800.8530.838
90.8000.8430.8000.793
100.9330.9500.9330.931
Average0.8080.8260.8090.802
Publisher’s Note: MDPI stays neutral with regard to jurisdictional claims in published maps and institutional affiliations.

