Article

Multi-Scale Upsampling GAN Based Hole-Filling Framework for High-Quality 3D Cultural Heritage Artifacts

1
School of Information Science and Technology, Northwest University, Xi’an 710127, China
2
National and Local Joint Engineering Research Center for Cultural Heritage Digitization, Xi’an 710127, China
*
Authors to whom correspondence should be addressed.
These authors contributed equally to this work.
Appl. Sci. 2022, 12(9), 4581; https://doi.org/10.3390/app12094581
Submission received: 14 March 2022 / Revised: 27 April 2022 / Accepted: 28 April 2022 / Published: 30 April 2022
(This article belongs to the Topic Machine and Deep Learning)

Abstract

:
With the rapid development of 3D scanners, the cultural heritage artifacts can be stored as a point cloud and displayed through the Internet. However, due to natural and human factors, many cultural relics had some surface damage when excavated. As a result, the holes caused by these damages still exist in the generated point cloud model. This work proposes a multi-scale upsampling GAN (MU-GAN) based framework for completing these holes. Firstly, a 3D mesh model based on the original point cloud is reconstructed, and the method of detecting holes is presented. Secondly, the point cloud patch contains hole regions and is extracted from the point cloud. Then the patch is input into the MU-GAN to generate a high-quality dense point cloud. Finally, the empty areas on the original point cloud are filled with the generated dense point cloud patches. A series of real-world experiments are conducted on real scan data to demonstrate that the proposed framework can fill the holes of 3D heritage models with grained details. We hope that our work can provide a useful tool for cultural heritage protection.

1. Introduction

With the emergence and development of 3D scanners and computer graphics technology, the way that cultural heritage artifacts (CHarts) are preserved has changed considerably. For example, CHarts can be restored in digital space and presented through the Internet. The virtual presentation of CHarts can be divided into three steps: obtaining the 3D fragments by 3D scanners, reassembling the 3D fragments, and finally transferring the virtual CHarts to the Internet. However, due to the physical and chemical erosion of the contact surfaces, the CHarts were often broken into fragments when they were discovered and the edges of the discovered fragments were often incomplete, resulting in the existence of holes on the reassembled 3D CHarts. Thus, how to fill these holes effectively and reconstruct high-quality 3D CHarts is an important issue in the field of archeology.
The traditional hole-filling methods are based on the structural information of 3D mesh models [1,2,3,4,5]. These methods can be generally categorized as template-based methods and mesh-based methods. The former methods are suitable when the holes are relatively large, and a similar 3D model from the 3D model database is selected to be the underlying surface and then used to fill the holes [6,7]. An effective template database is very important; the more 3D models of different shapes, the better the hole-filling effect. Sahay et al. [8]. proposed an online 2D depth database; they projected the 3D hole region into a 2D depth map, then searched the best-matched depth map from the depth-based database to complete the 2D hole region, and finally restored the 3D mesh model. Some studies [9,10,11] focus on the creation of 3D shape databases, which are used to retrieve the most relevant shape with holes to fill the missing region. However, if the best-matched template does not exist in the database, the completed task will fail. Other works used the non-local self-similarity of 3D mesh models to complete hole regions [12,13]. This method implicitly assumes there are local structures similar to the missing parts on the same model. Fu et al. [14] segmented a point cloud into cubes with a fixed size and iteratively searched for the most similar cubes from the non-hole area to fill the missing region. The main drawback of the template-based method is that it works only with an analogous template.
Different from the template-based methods, the mesh-based methods can reconstruct the hole regions based on the topological information, and these methods can obtain a satisfactory restoration result when the hole regions are relatively small. These methods [15,16,17] interpolated values in the hole to generate the latent surfaces directly. Li et al. [18] applied the Poisson equation to global fitting the input model surface to obtain the hole patch, and then adjusted the normal vectors of the hole boundary region to stitch better to the original hole model. Hanh et al. [19] reconstructed incomplete feature curves by extending salient features around the hole regions, and then split the original hole regions into smaller and more planar sub-holes, and completed those sub-holes. Similarly, Lin et al. proposed a surface-fitting reconstruction method based on tensor voting. By combining the fringe projection-based 3D reconstruction method [20,21] and the SFM method, Gai et al. [22] proposed an SFM-based hole-filling algorithm. They first extracted the hole boundary points based on the 2D phase map, and then recovered geometry information with SFM point cloud, which can effectively restore the complicated surface hole regions. However, if large curvature variations exist in the hole regions, the surface-based methods also cannot reconstruct the hole regions very well.
Recently, with the development of deep learning, learning-based methods have been proposed to process point clouds, as well as 3D models. These methods can generate 3D models from the learned latent features [23,24,25,26]. For the hole-filling task, the hole regions can be filled with the same parts of a complete 3D model, which is generated by a trained network. Therefore, the core task of deep learning-based methods is to build and train a network to generate a realistic 3D model. Depending on the type of 3D models, these generation-oriented methods can be further categorized into two classes: volume-based methods and point cloud-based methods. The volume-based method converts the input point cloud into a regular 3D voxel grid, over which the 3D convolutional neural networks (3D-CNNs) can be employed to learn the latent information in the voxel model without hole regions. Finally, the trained network is used to generate a complete voxel model [23,27,28]. However, the main limitation of volume-based methods is the quantization loss of the geometric information due to the low resolution enforced by voxelization. Since the original point cloud can represent 3D models more concisely, the point cloud-based methods, which can process the point cloud directly and obtain a better result compared to the volume-based methods, has become a hot topic. The first deep learning architecture for directly processing point cloud is PointNet t [29], and many other PointNet-based methods have also been proposed in recent years [30,31,32]. These methods can learn the latent features by using an encoder–decoder network, which can be used to generate point cloud data with similar shapes [33,34,35]. Chen et al. [36] combined an auto-encoder with a generative adversarial network (GAN) to generate point cloud by using the latent feature learned from the auto-encoder. To reduce the time consumption of the network, Sarmad et al. [37] introduced a real-time RL-GAN network to control GAN, which generated the latent representation of the shape that best fits the current input of incomplete point cloud. However, the point cloud-based methods required the size of the point cloud to be a constant value. For example, the input size was usually 1024 or 2048. Due to the complex and varied structures of 3D CHarts, it is impossible to input them into the point cloud-based network directly unless we down-sample the point cloud. Unfortunately, a large number of details will be eliminated through the downsampling process.
In this paper, a novel framework, named MU-GAN, is proposed to fill these hole regions of 3D CHarts. Firstly, a detecting hole method is proposed. Secondly, a point cloud patch with hole regions is extracted as the input of the trained MU-GAN to generate a dense and complete point cloud. Finally, the generated point cloud is used to fill the hole regions of the original point cloud. Experimental results demonstrate that our framework can achieve a complete point cloud with high quality. The main contributions of this work can be summarized as follows:
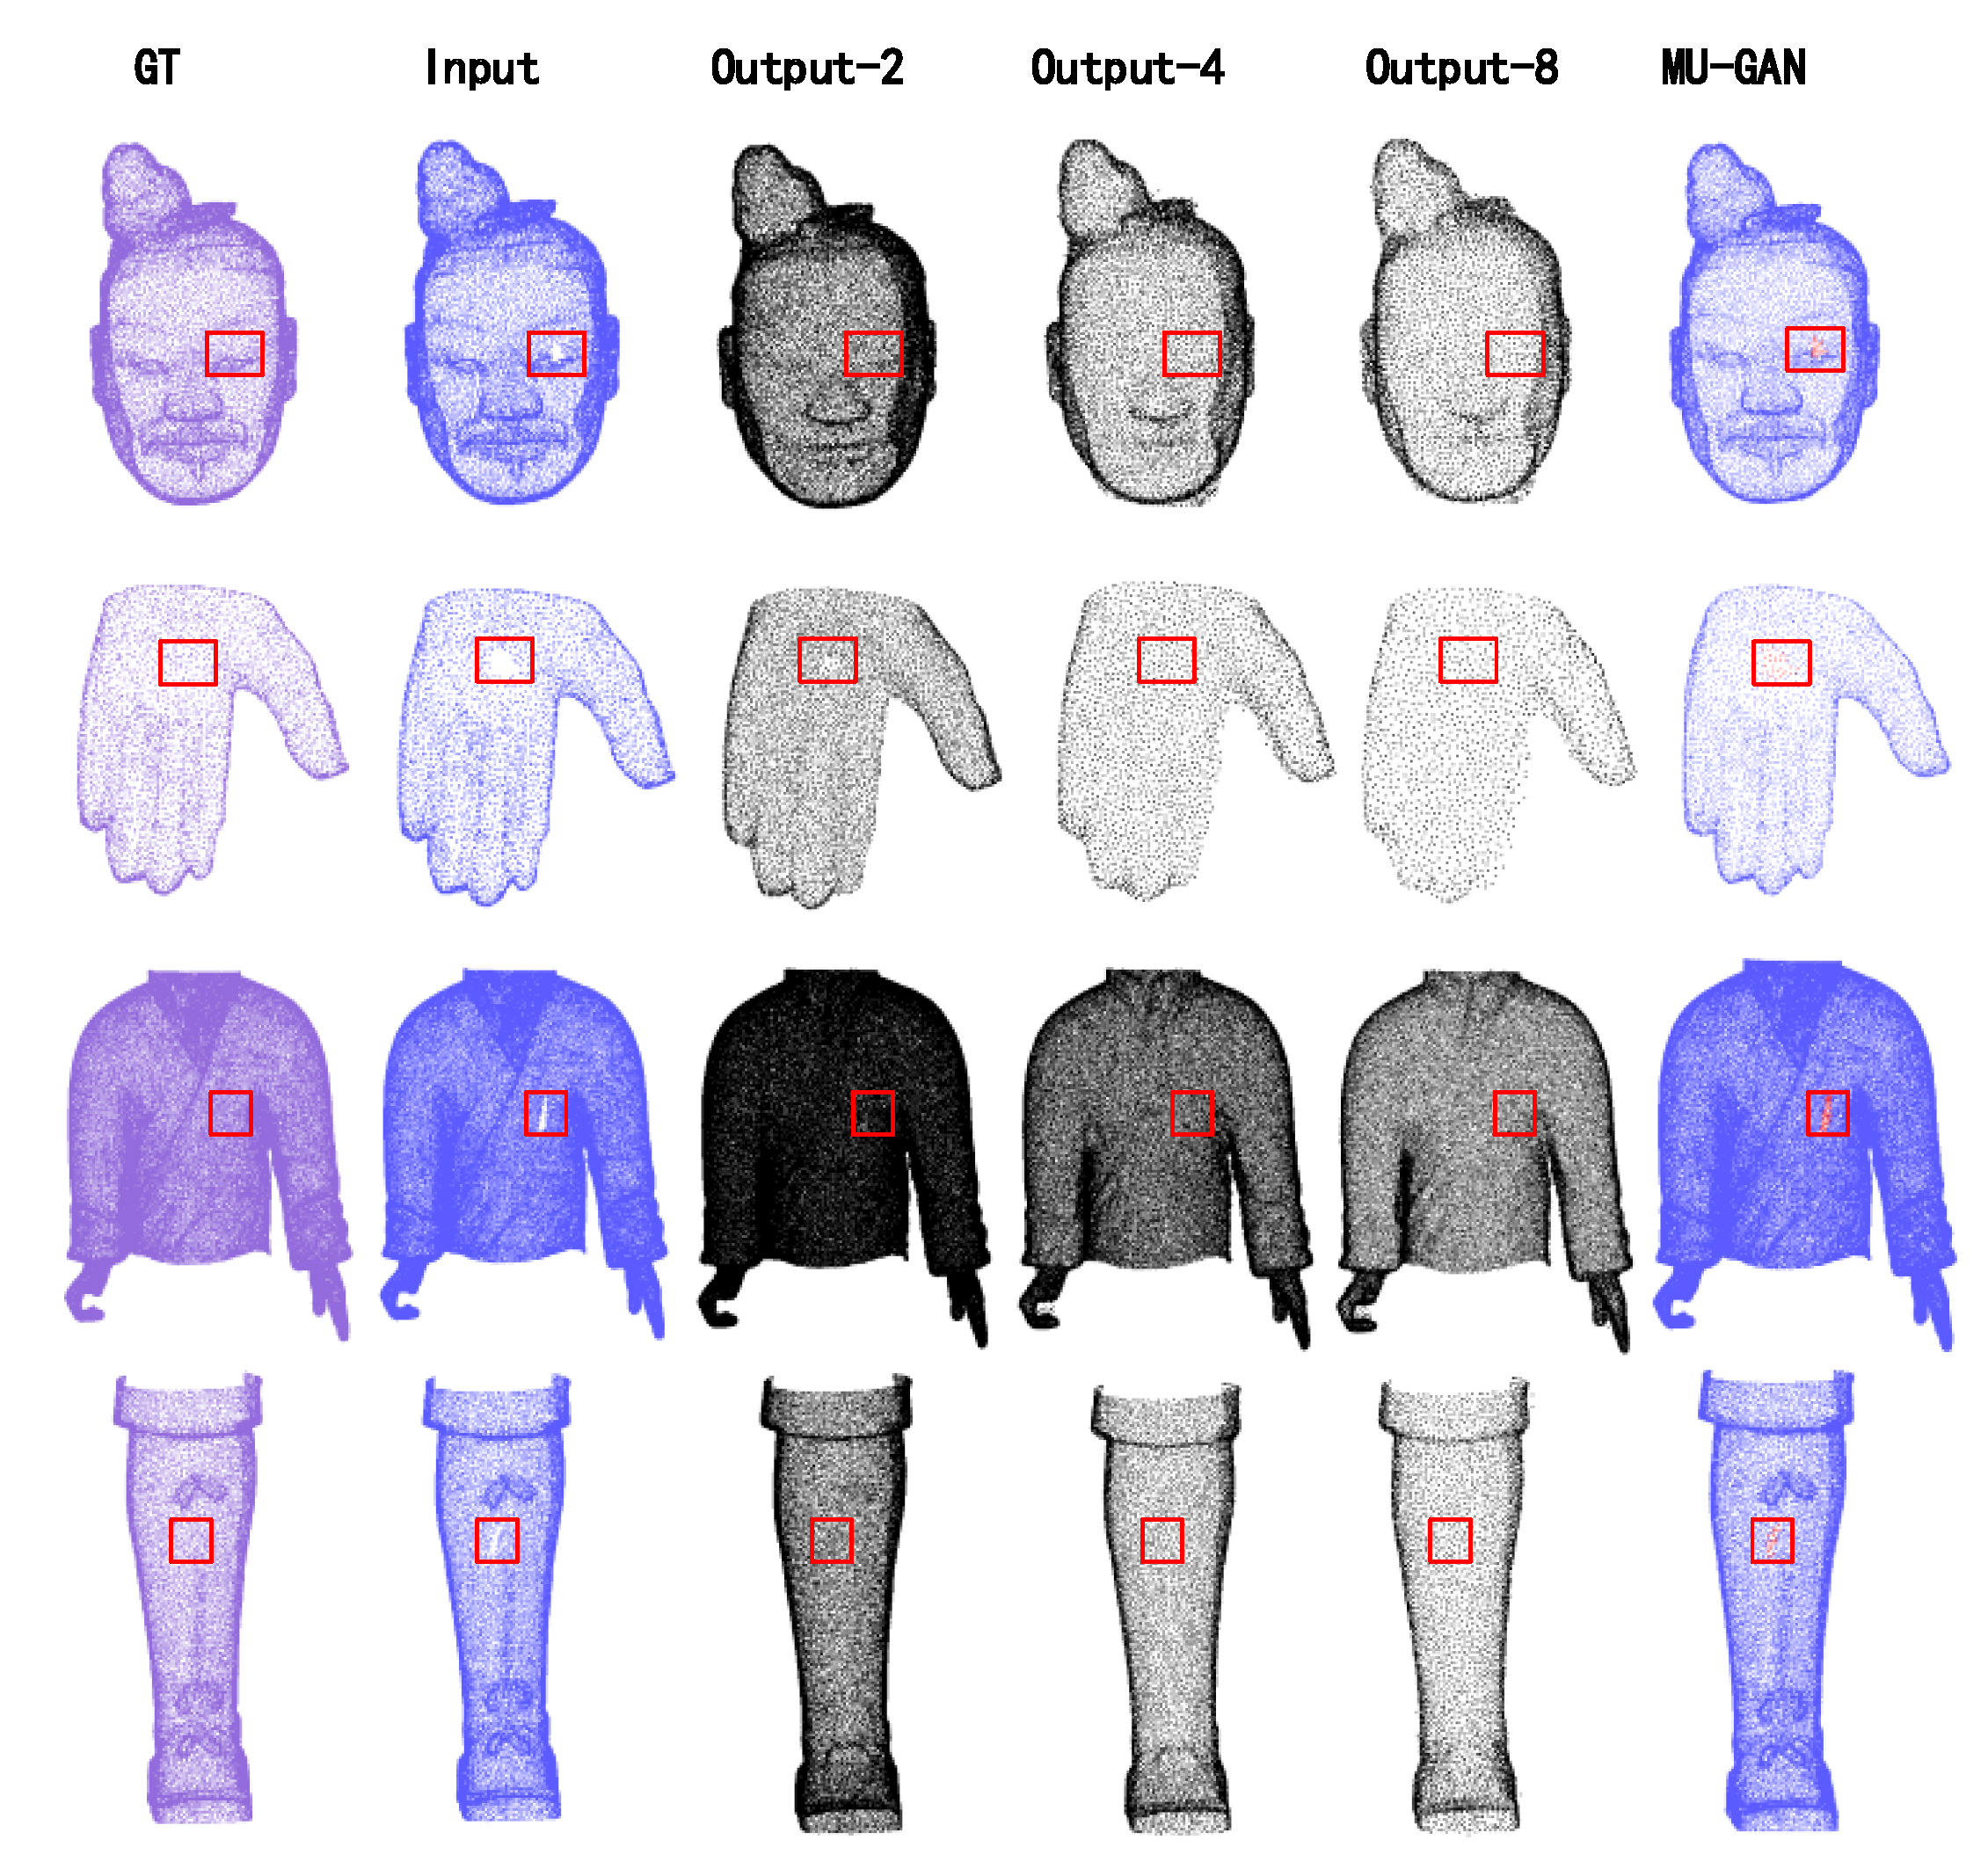
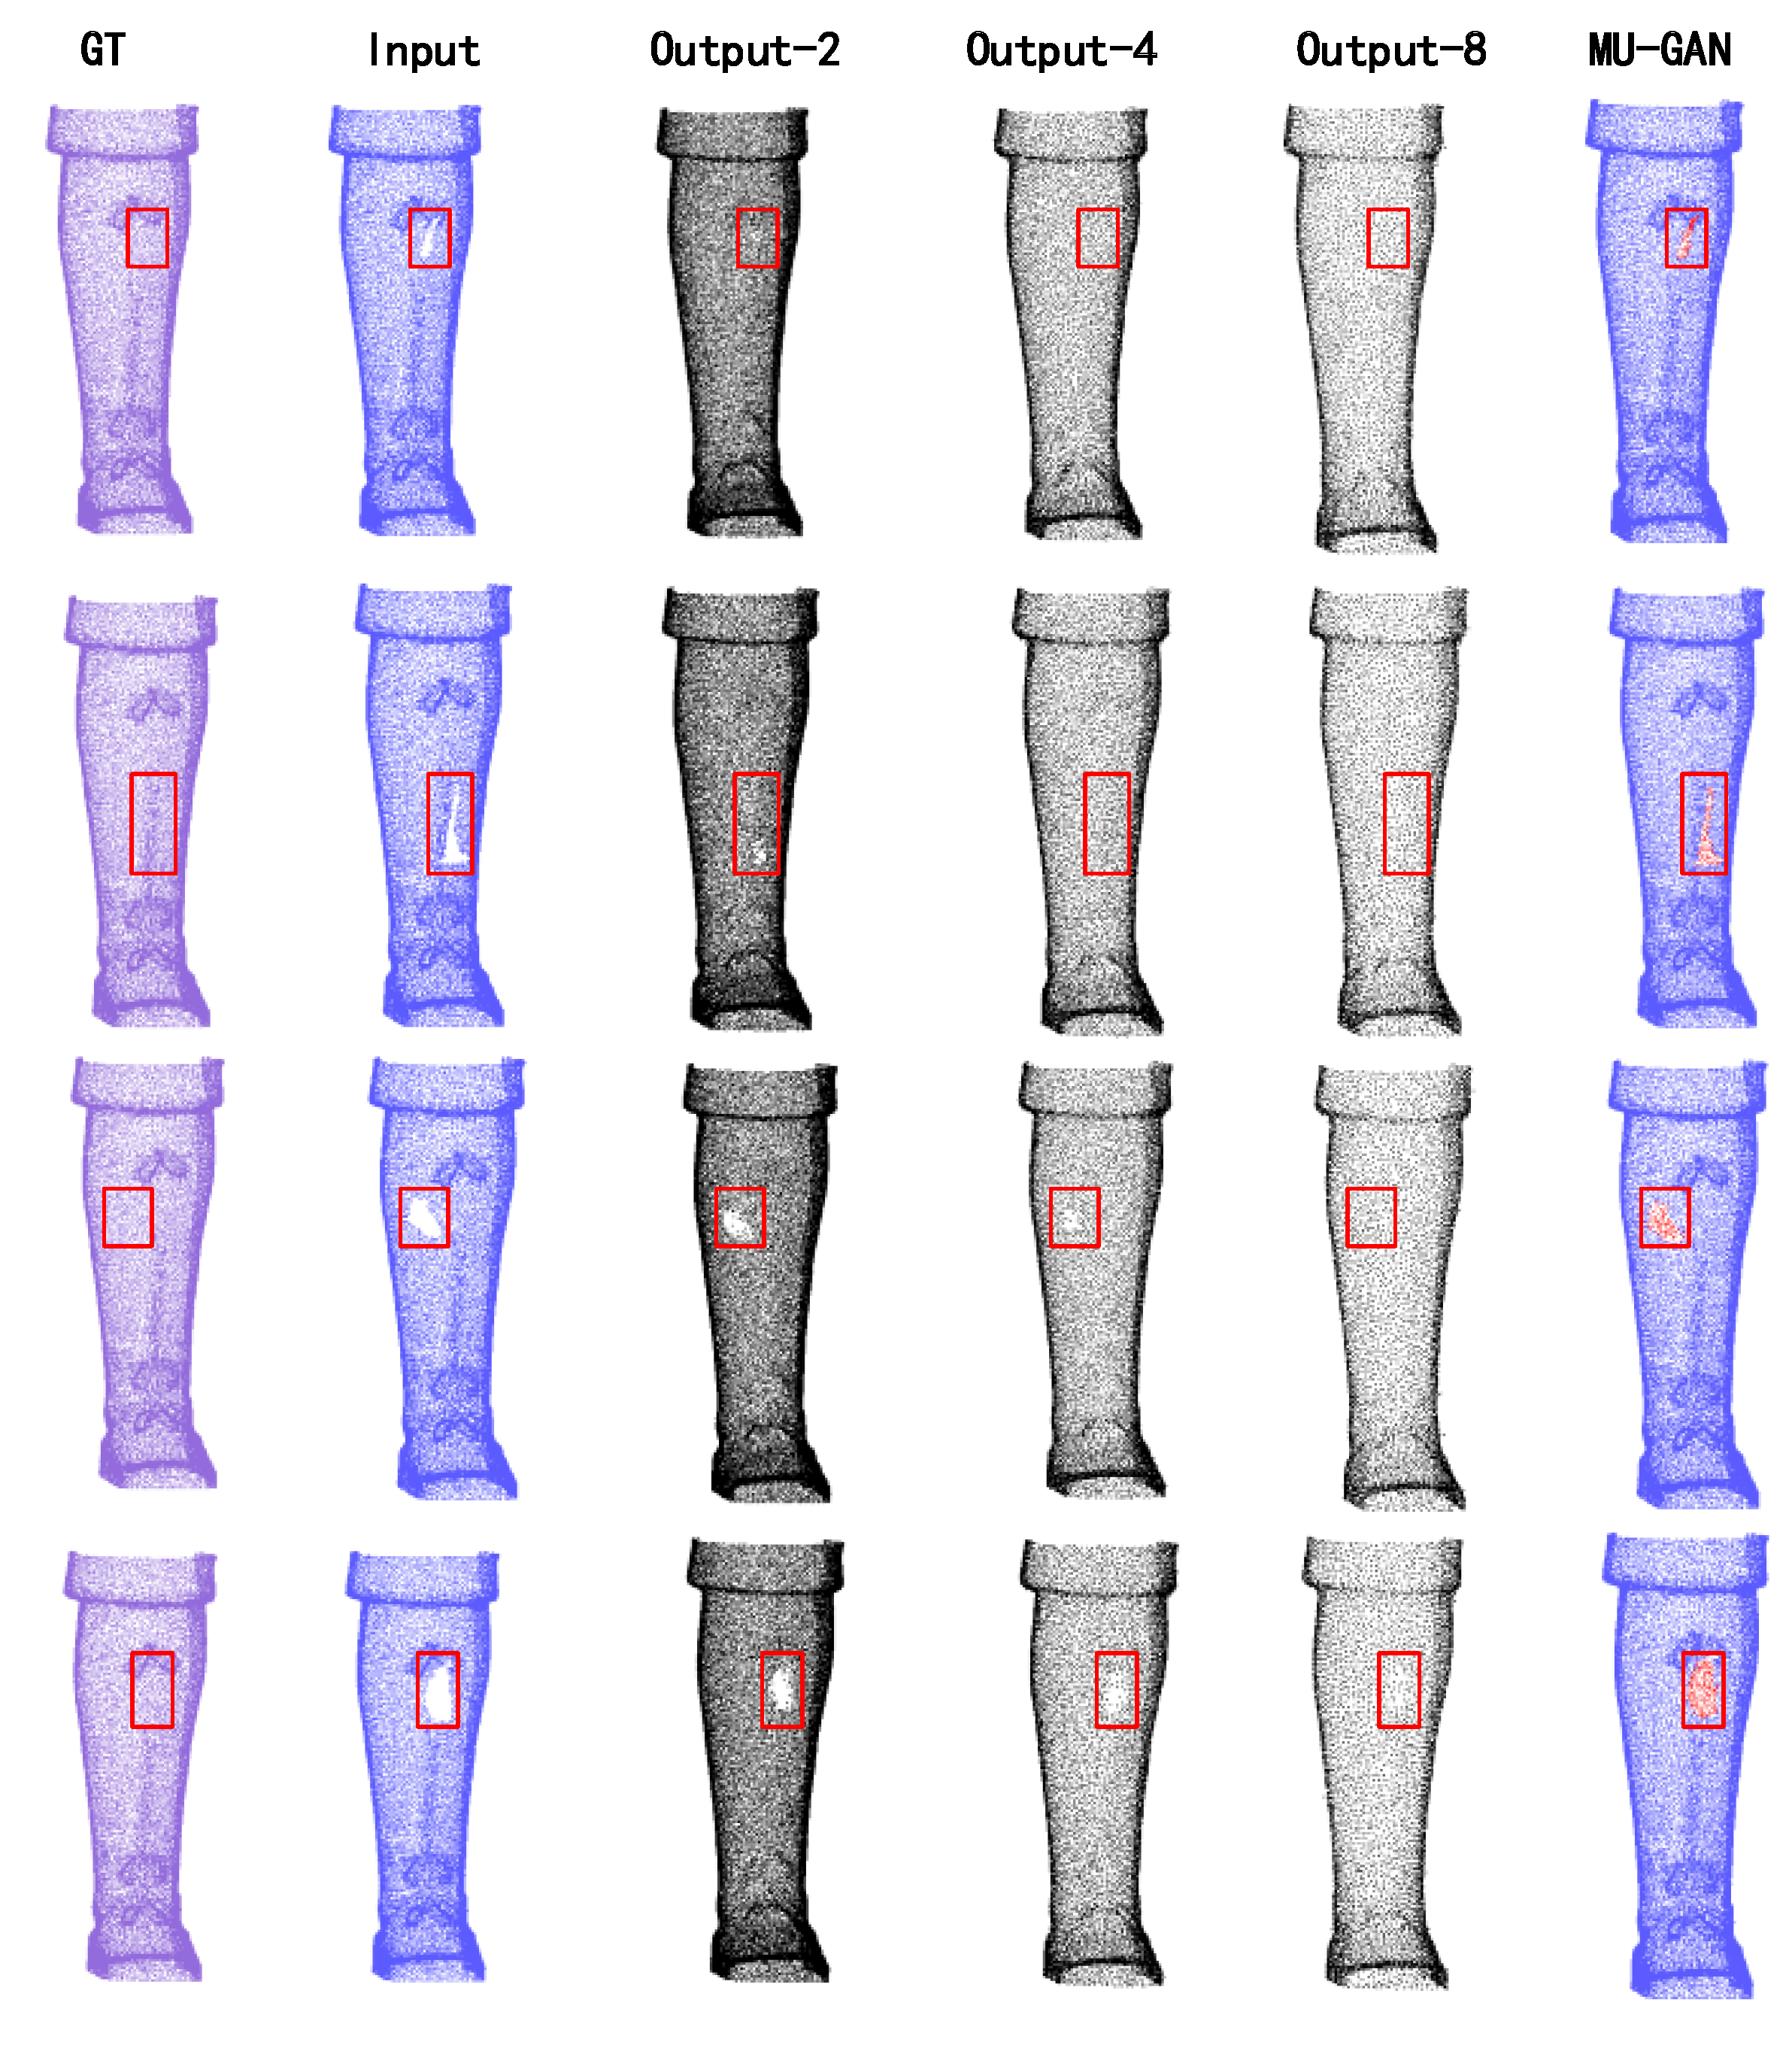
  • A multi-scale upsampling GAN (MU-GAN) is built to generate a dense point cloud to fill the hole regions.
  • To make the learned latent feature more robust, multi-scale point clouds are used to complete the incomplete models, which can restore the CHarts with more fine-grained details.
  • There are no limitations on the size of the input point cloud, indicating that the proposed framework is more suitable for the CHarts with a huge point number to preserve details.

2. Method

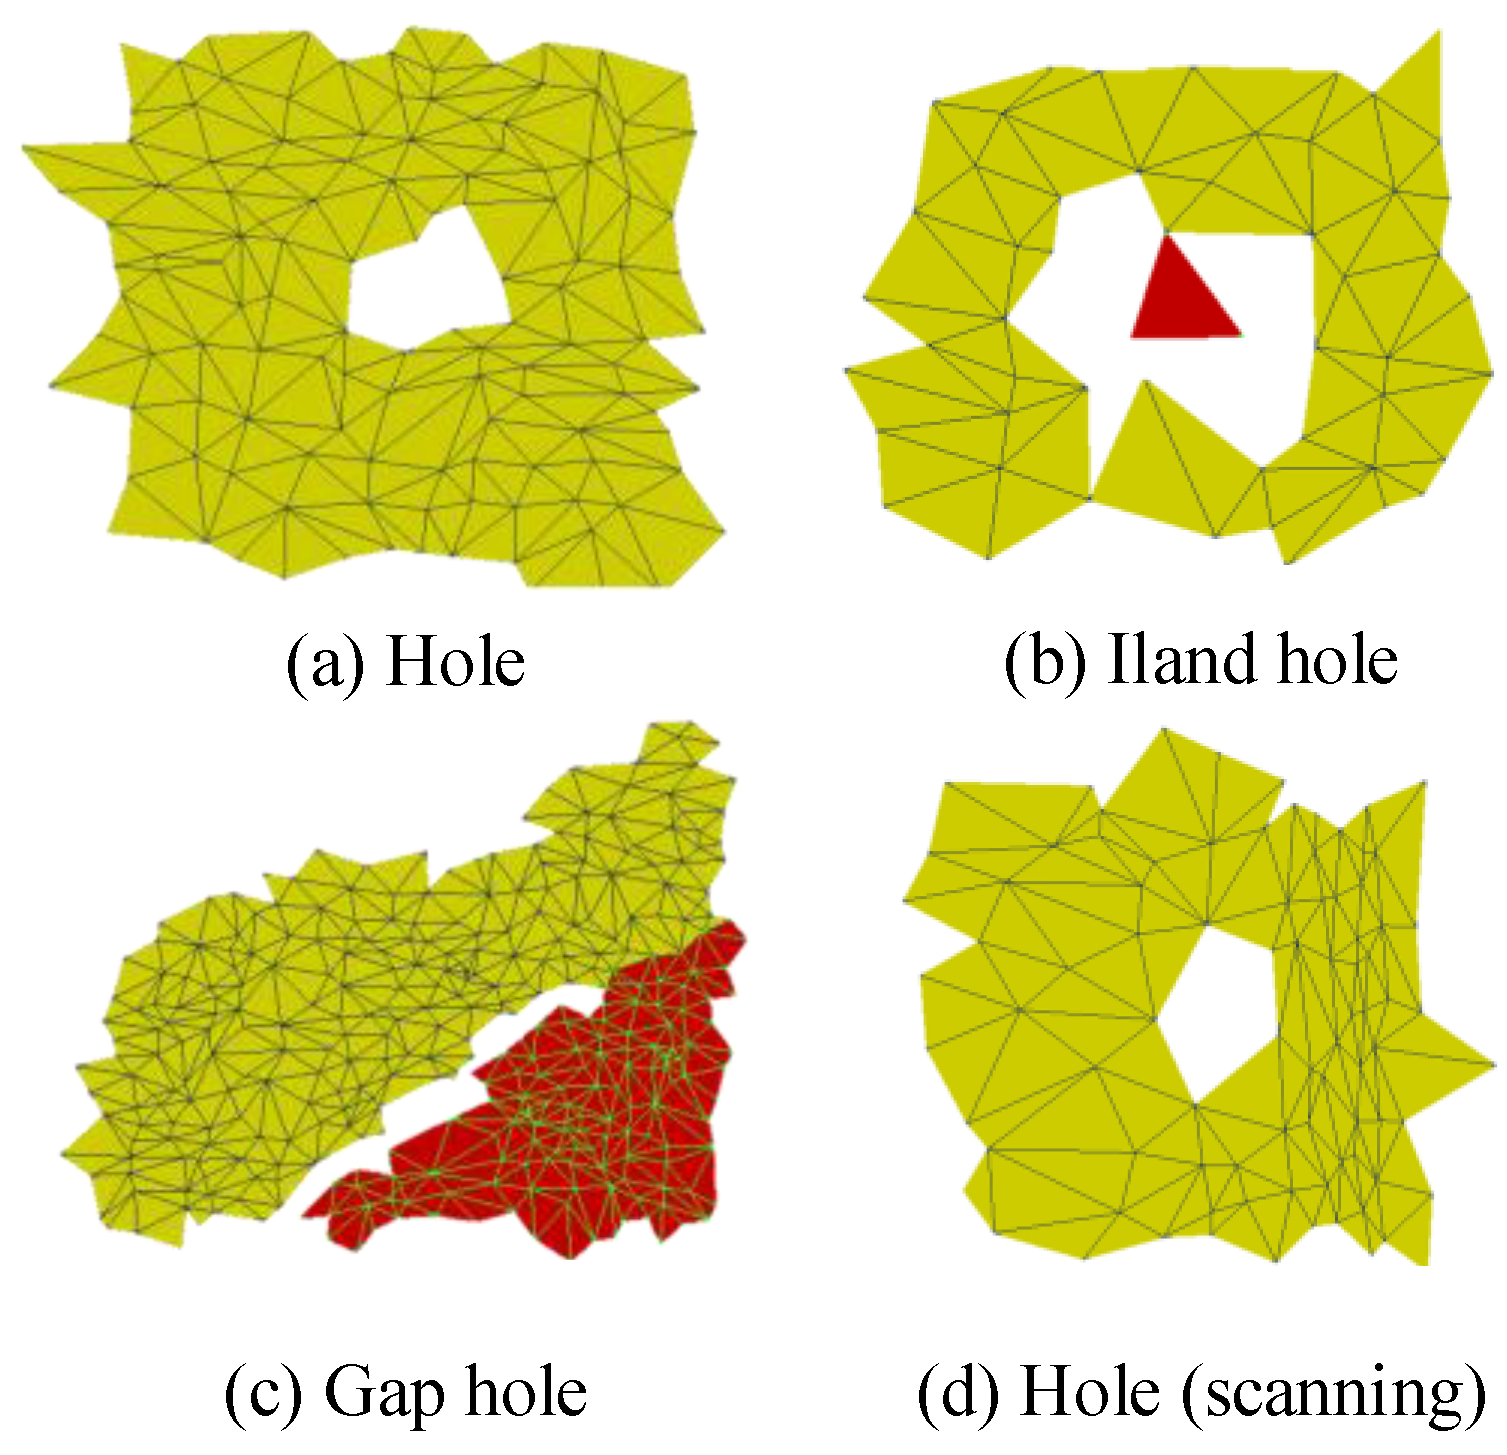
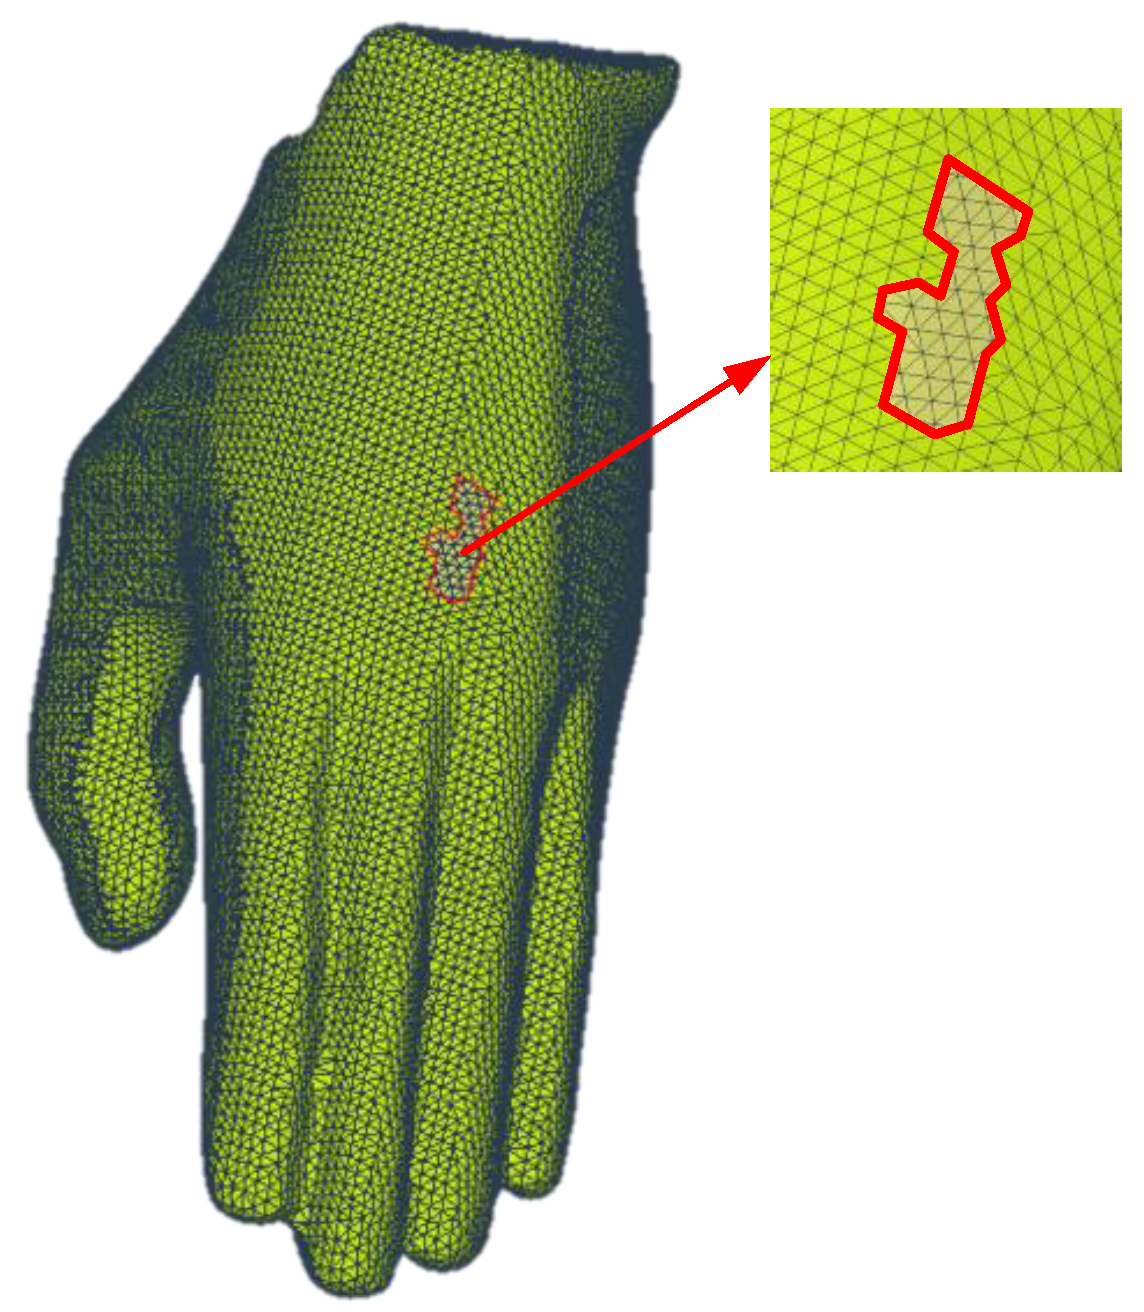
2.1. Hole Detection Method

The accurate detection of holes is a prerequisite for completing the 3D CHarts. Due to the physical and chemical erosion of the contact surfaces, the fractured surfaces of the fragments are often not completely consistent as they were just broken, resulting in holes on the reassembled 3D CHarts. The holes can be classified as simple holes and complex holes, as shown in Figure 1. Based on the triangular principle, we proposed an effective 3D mesh hole detection method. The details of the method are presented in Algorithm 1.
Algorithm 1: Hole detection method for 3D Charts
Initialize. The 3D mesh model of the 3D CHart is composed of a set of triangles, and the triangle contains vertices and edges.
Step 1: Traversing the 3d Mesh to get the number of adjacent triangles on each side to form a matrix M E , N , B , where E represents the side, N represents the number of triangles adjacent to the side, and B is a Boolean value, which identifies whether the current side has been traversed.
Step 2: Find the edge v 1 , v 2 whose N value is 1 in M E , N , B , which is defined as the hole points set φ = v 1 , v 2 .
Step 3: Utilizing depth-first-search (DFS) to traverse M along φ .
Step 4: Adding boundary vertices to the hole points set φ = v 1 , v 2 , v 3 , and the Boolean value is set to TRUE.
Step 5: Repeating Step 4, until a closed loop which is the identified hole is formed.
Step 6: Repeating Step 2–Step 4 until the matrix M does not have hole edges.
Output: The hole regions of the 3D mesh model.
Figure 2 illustrates the detection result based on the proposed method described in Algorithm 1, and the hole region can be detected effectively.

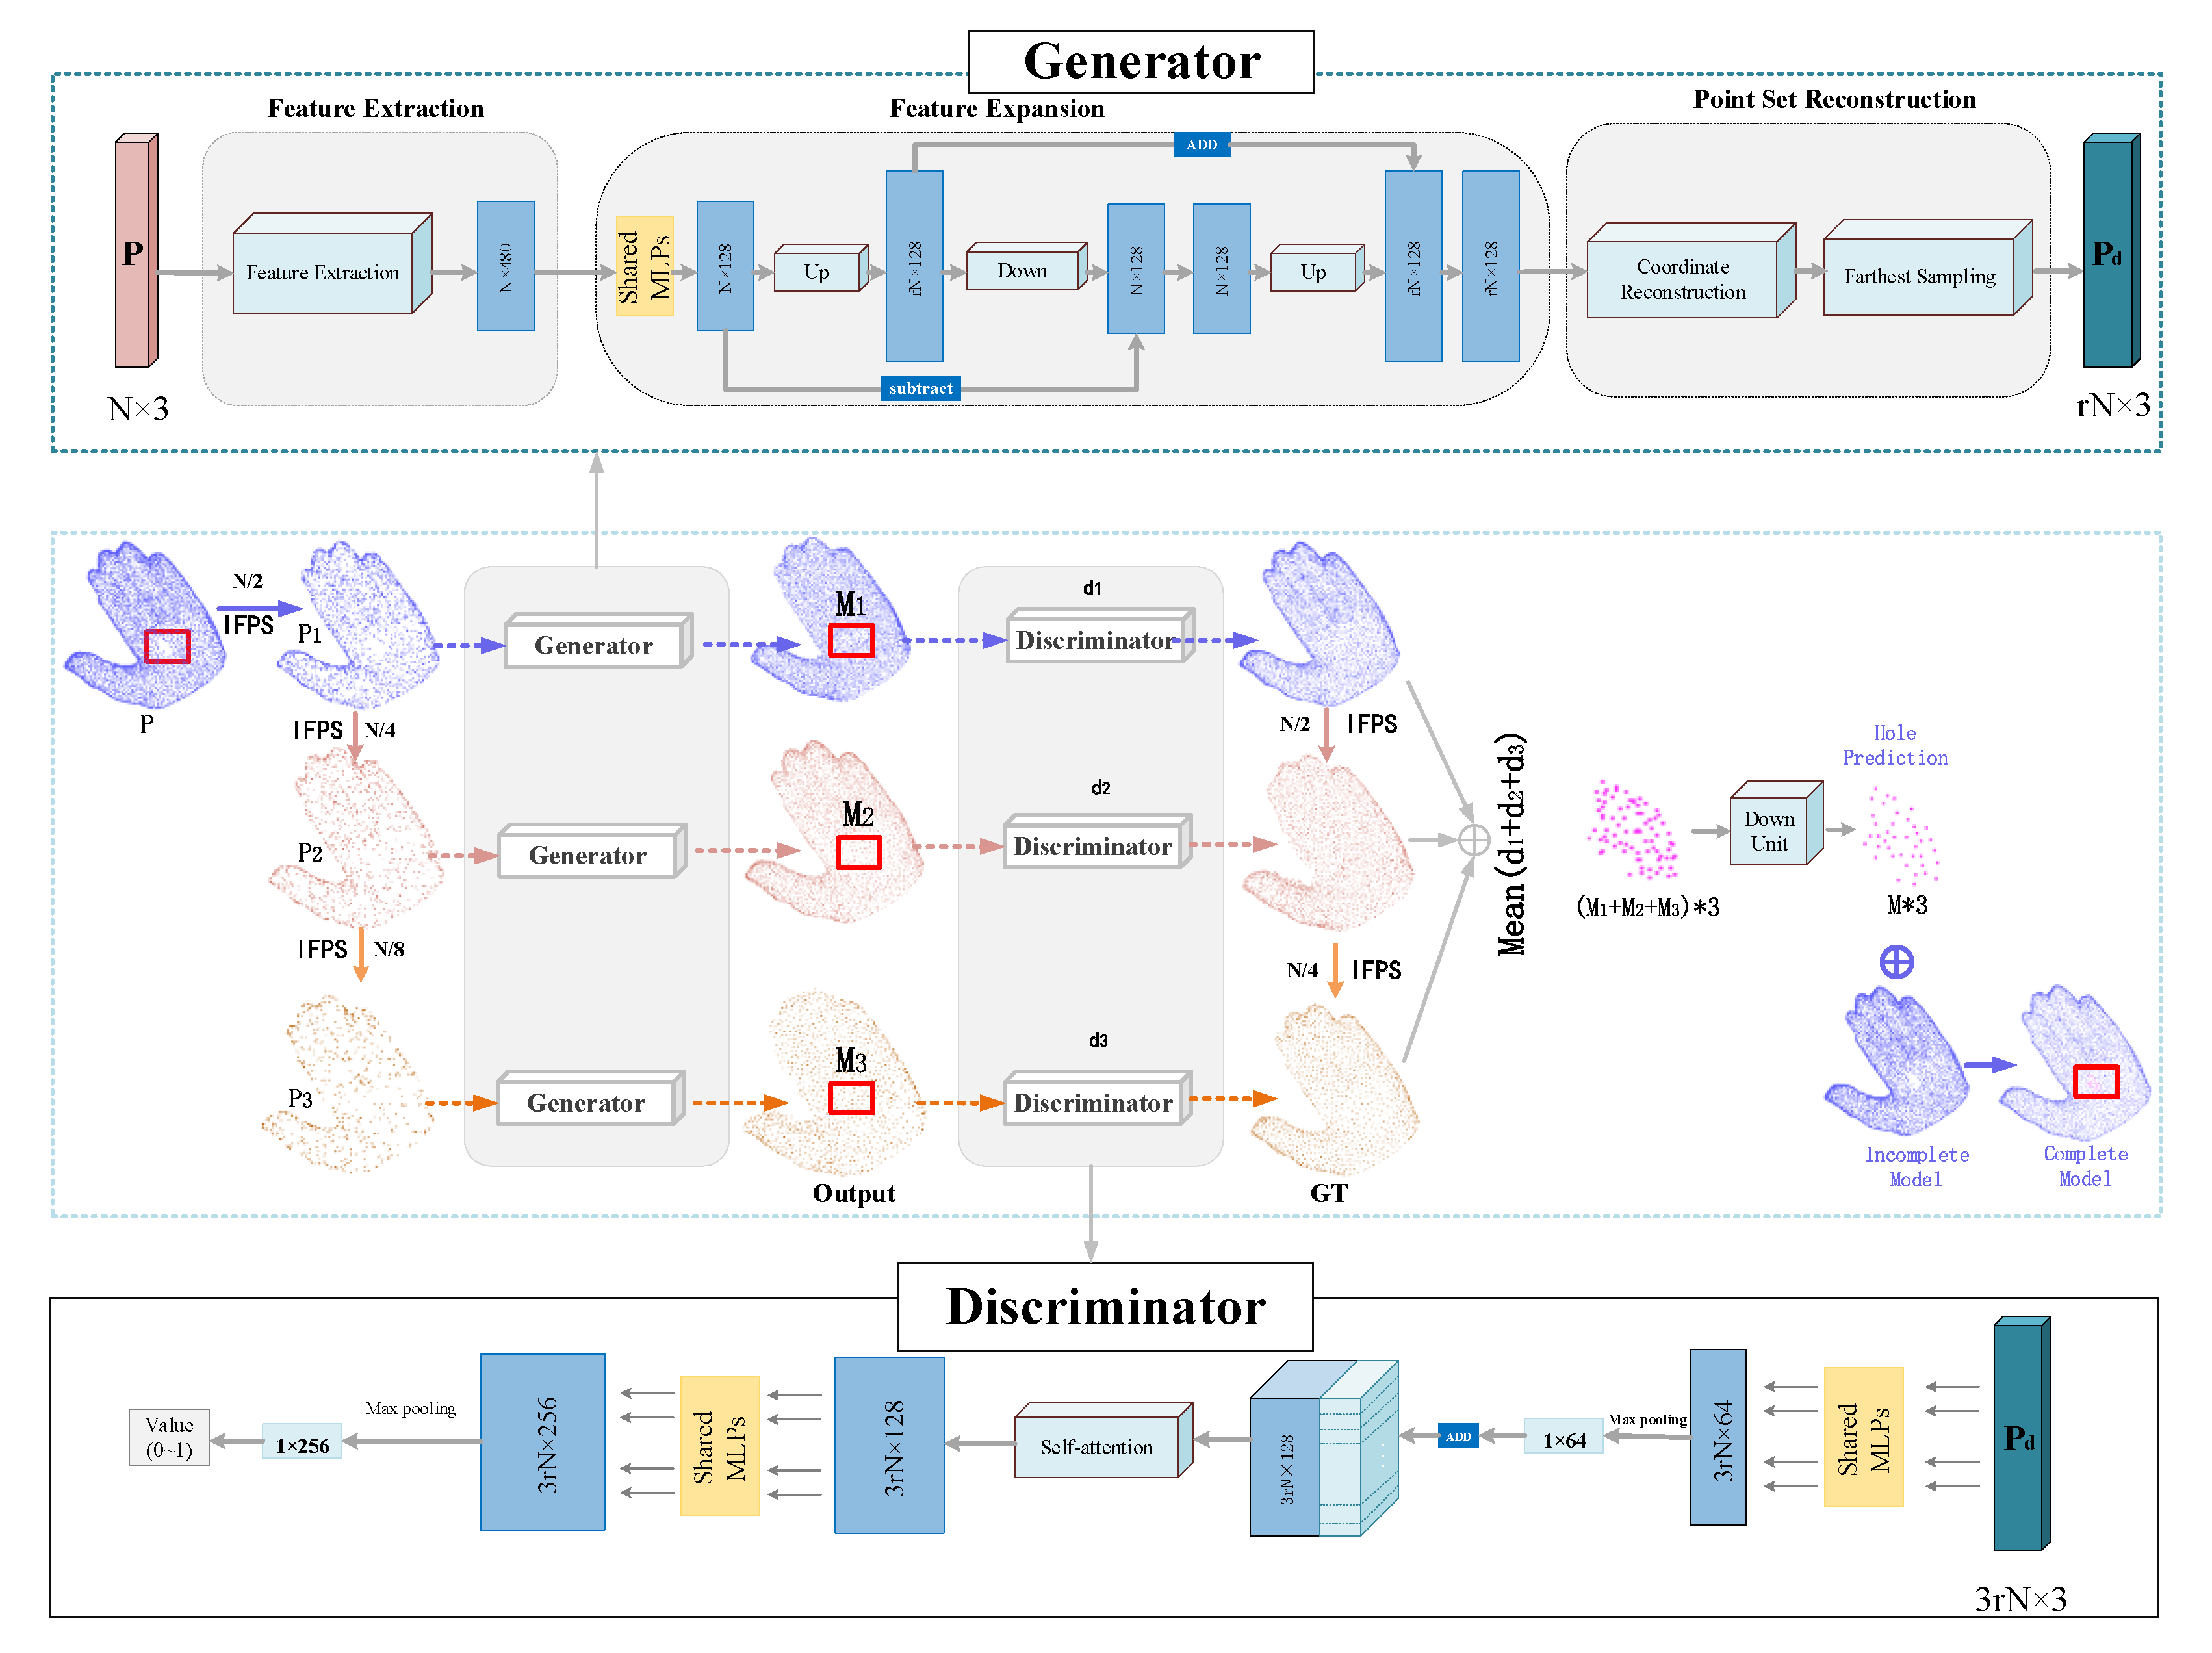
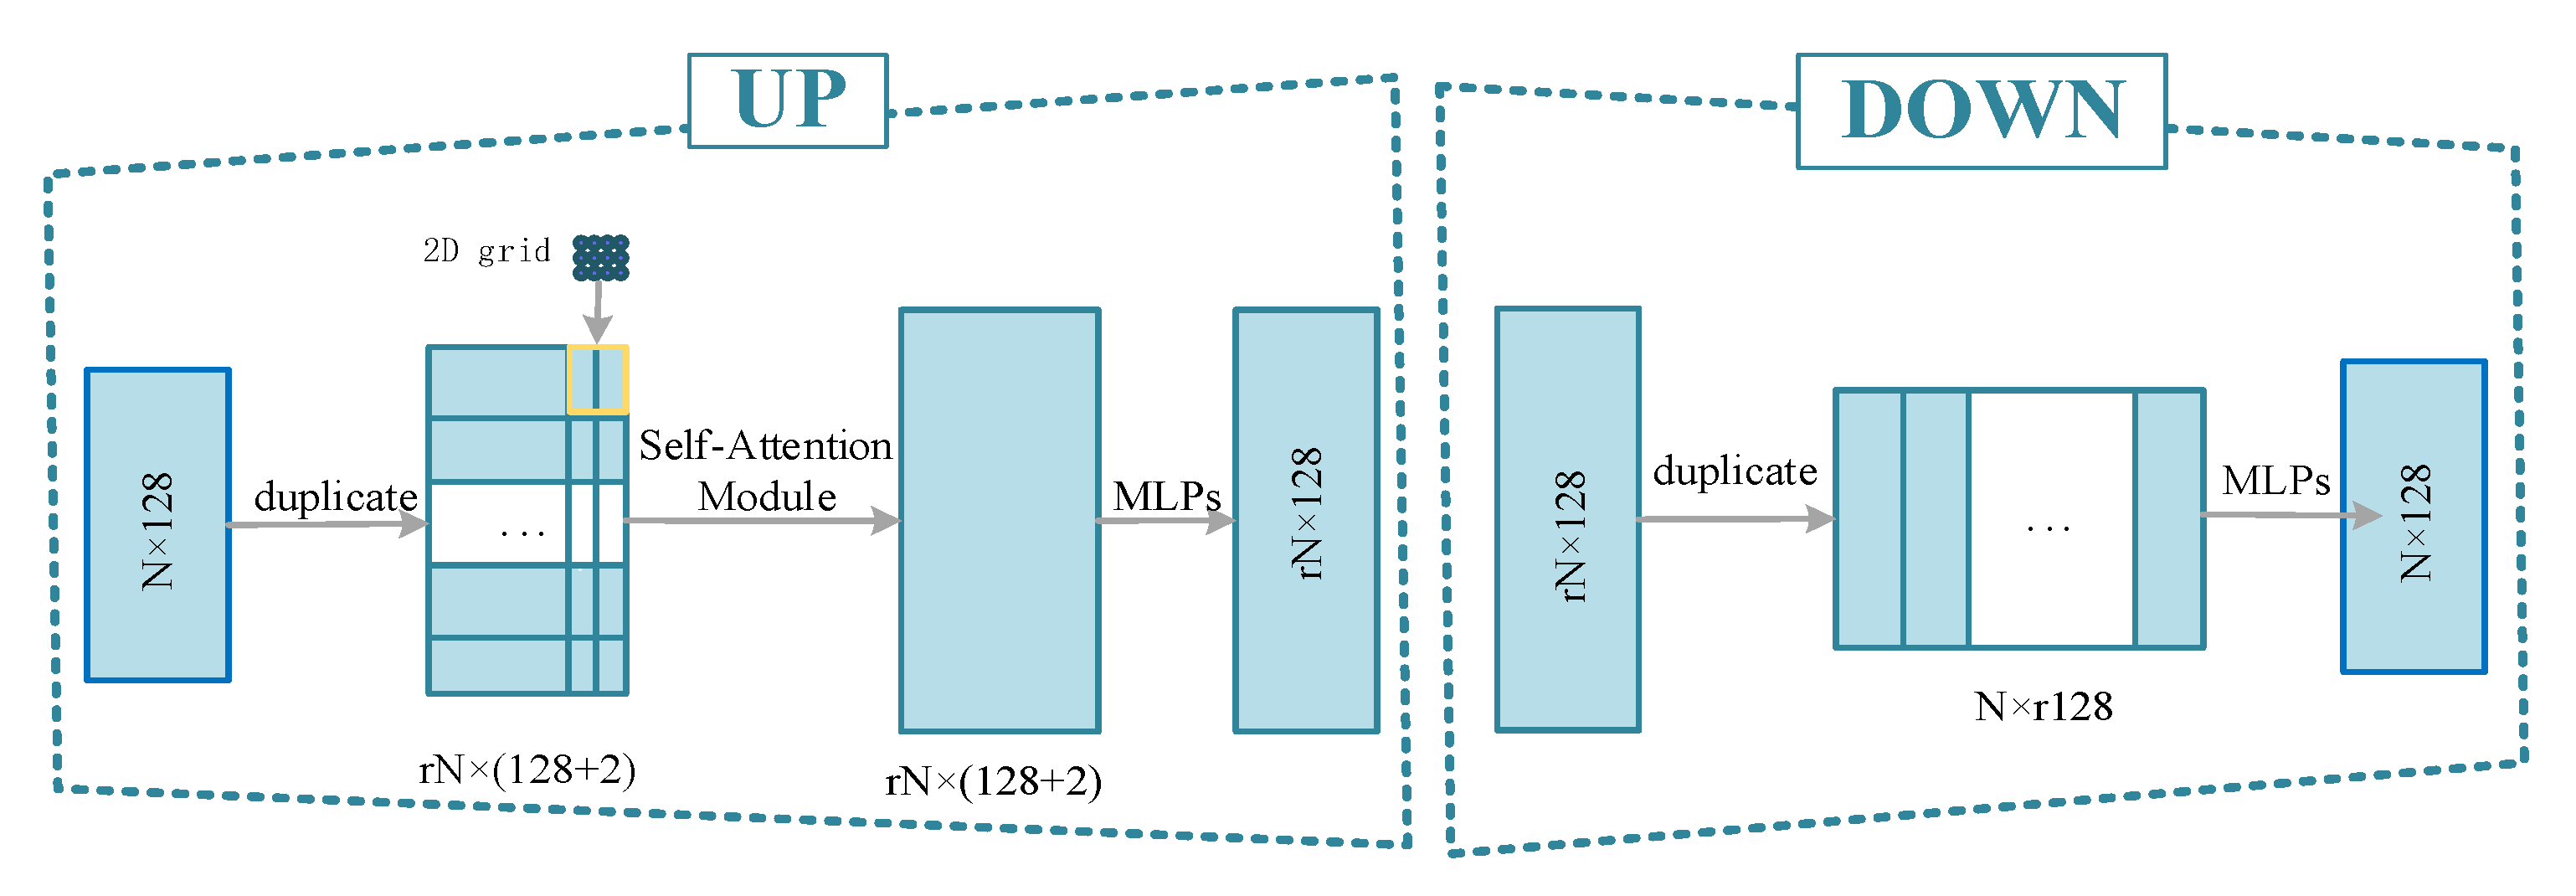
2.2. MU-GAN Architecture

The hole area can be regarded as a region with sparse distribution of points. The hole-filling task can be accomplished by increasing the density of the point cloud in the hole area, which can also be regarded as upsampling. In this section, an MU-GAN is designed based on the PU-Net [38]. As depicted in Figure 3, the architecture contains a generator and a discriminator. The purpose of the generator is to generate a point cloud that is denser than the input point cloud, and the purpose of the discriminator is to determine whether the input point cloud is real data or generated by the generator.
The generator is shown in the upper part of Figure 3. It has three components: the feature extraction module, the feature expansion module, and the point set reconstruction module. For the feature extraction module, the intra-level dense connections method in [39] is applied to extract the features from the input point cloud with data size N × d , where d = 3 . The method defines the local neighborhood in feature space, groups the features via KNN based on the feature similarity, and finally refines the features of each group through multi-layer perceptrons (MLPs). After the feature extraction, the size of the input P , the original complete point cloud, is converted to N × C , where C denotes the number of extraction features.
The feature expansion module serves the purpose to increase the number of points (from N to r N ). It should be noted that two key steps in the feature expansion module are the up and down modules, which can enable the generator to produce more diverse point distributions and are depicted as “up” and “down” operators in Figure 3. The detailed structure of these two modules is illustrated in Figure 4. More details about these modules can be referenced in [40].
In the point cloud reconstruction module, the 3D coordinate reconstruction of per-point features (generated from the feature expansion module) is carried out by a series of fully connected layers, and the dimension of the features is changed from r N × C to r N × 3 . Finally, the dense point cloud with the size of r N × 3 is generated.
In the training stage, the original complete point cloud is P which has 2048 points. The input data consist of three parts, which are P 1 (1024 points), P 2 (512 points), and P 3 (256 points) are the downsampled point cloud from P , P 1 , and P 2 , respectively. In other words, the inputs are different scales of the original point cloud. After using the three-point cloud as input of the generator, three dense generated point clouds can be obtained.
The discriminator is shown at the bottom of Figure 3. The input is the generated dense point cloud. Additionally, the target point cloud with r N points is downsampled at different scales, and then think of P , P 1 and P 2 as ground truth P g t . The output of the discriminator is a value between 0 and 1. If the confidence value is closer to 1, it indicates that the input is more realistic with the target distribution. Based on the network proposed in [35], the global features are obtained through a set of fully connected and max-pooling layers. To improve feature integration, a self-attention module is utilized after feature concatenation. Finally, the confidence value is generated by applying a set of MLPs, the max-pooling layer, and the fully connected layer to determine whether the input data are close to the true distribution.
To ensure the stability of the MU-GAN, and reduce the difference between the generated point cloud and ground truth, the least-squares loss is used:
l g e n = min 1 2 D P 1 2
l d i s = min 1 2 D P 2 + D P g t 1 2
where D P is denoted as the output of discriminator, and D P g t is the confidence value of ground truth. The generator tries to generate “real” samples to confuse the discriminator, and the discriminator distinguishes whether the input data come from the real data or the generated data.
The adversarial loss can ensure the realism of the generated point cloud. Since the generator will predict three-point cloud in various scales, our reconstruction loss consists of three terms d 1 , d 2 , d 3 . To reduce the distance between the input point cloud and the output point cloud, the minimum matching distance [35] is defined as reconstruction loss:
l r e c = d 1 + d 2 + d 3 = min 1 P d i = 1 3 P d i P g t i 2
Therefore, the overall loss function for MU-GAN is defined as
l G A N = α l g e n + β l r e c + γ l d i s                                        
where α, β and γ are the weights of generator loss, reconstruction loss, and discriminator loss.

2.3. MU-GAN-Based Hole FILLING framework

The goal of this work is to take a 3D CHart model with holes as input and produce a complete high-quality model as output. MU-GAN consists of roughly three stages: (1) Hole detection of the mesh model using Algorithm 1, and then transforming the mesh model into a point cloud model; (2) Acquiring k ( k = 3) point cloud data ( P 1 , P 2 , P 3 ) of different points of an artifact model P and upsampling them respectively. Then extracting the missing regions in the corresponding original point cloud as patches; (3) Merging the to-be-repaired input data and patches to obtain the final point cloud restoration results. The specific repair framework for this study is shown in Algorithm 2.
Algorithm 2: MU-GAN Based Hole Filling Framework
Initialize: Point cloud data of 3D CHart model.
Step 1: Construct the mesh model and locate the hole regions based on Algorithm 1.
Step 2: Convert the mesh model into point cloud data and extract the point cloud P containing the hole area.
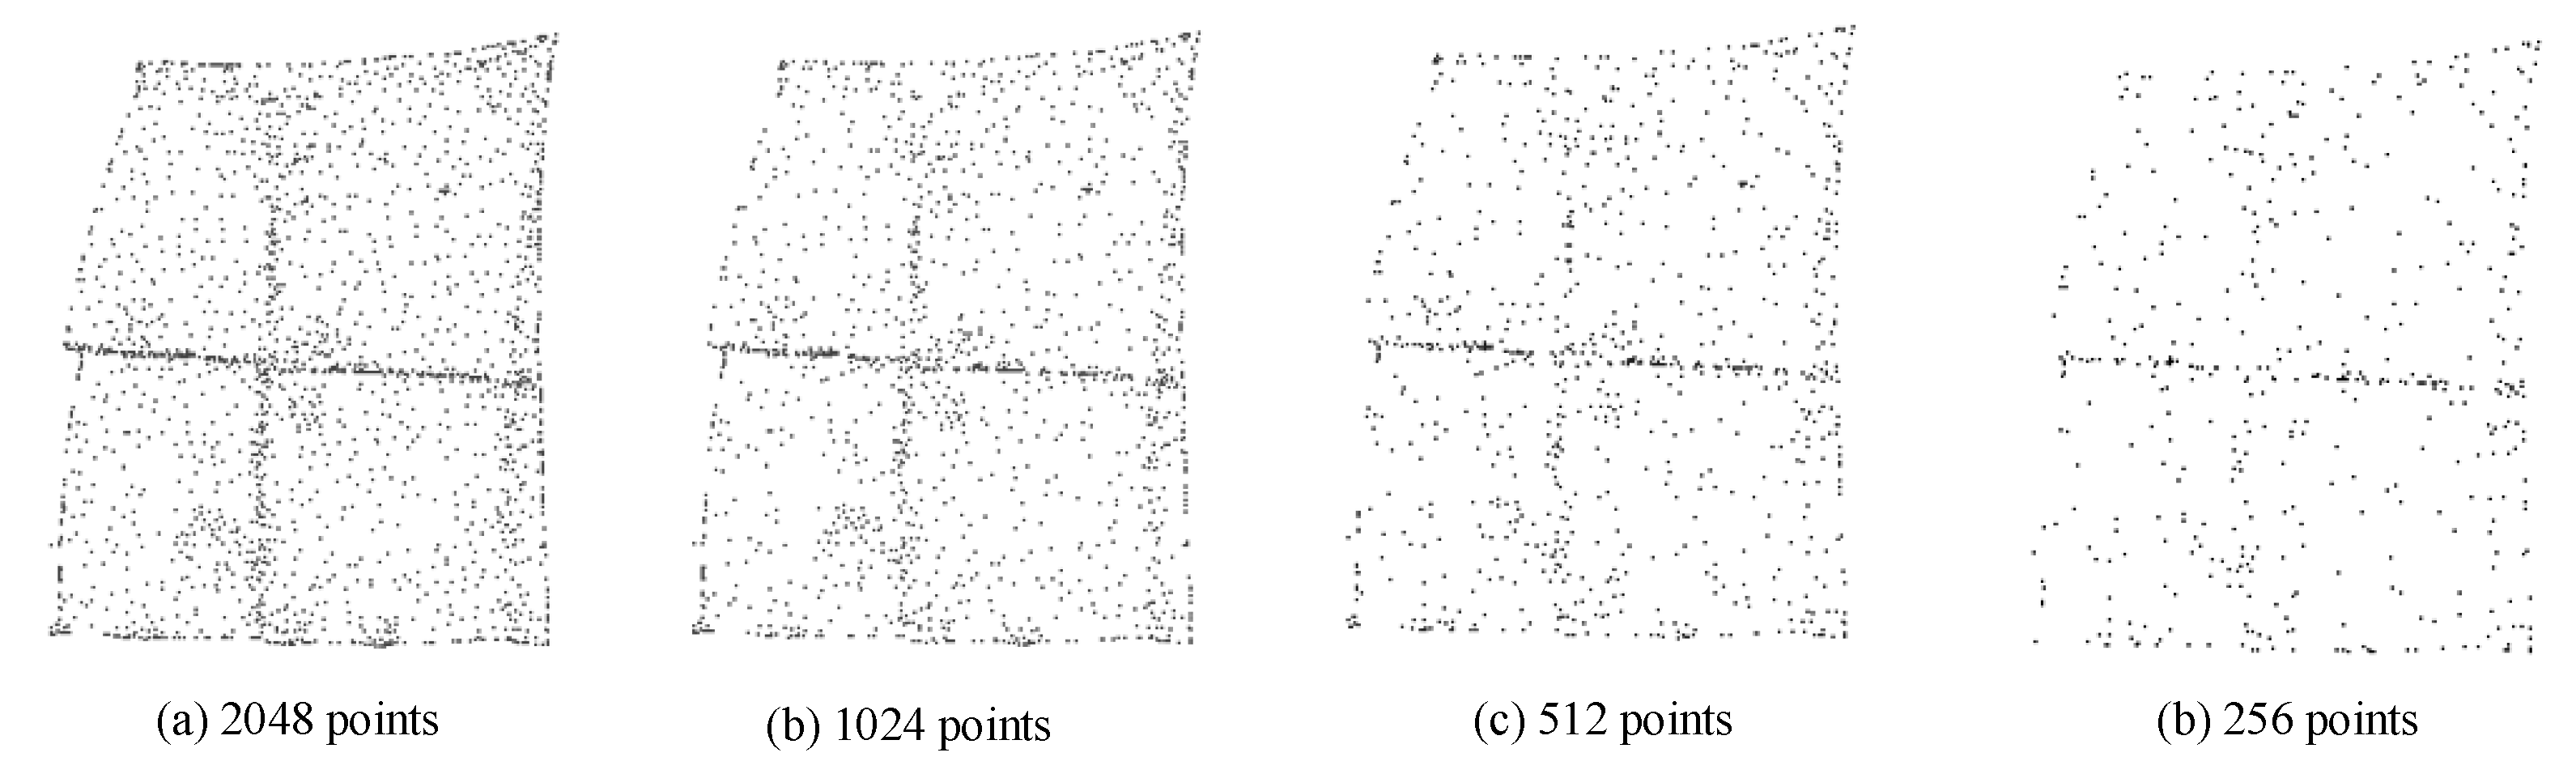
Step 3: Generating the downsampled point cloud P 1 , P 2   and P 3 . P 1 , P 2 and P 3 are the downsampled point cloud from P , P 1 and P 2 , separately.
Step 4: Input P 1 , P 2 and P 3 into the trained MU-GAN to obtain dense point cloud P d .
Step 5: Extracting the point cloud corresponding to the hole area in P d as a patch, is denoted as P h o l e .
Step 6: Merging P h o l e with incomplete original point cloud to generate the complete point cloud.
Output: 3D CHart model with no hole regions.

3. Experiments and Results

3.1. Dataset and Implementation Detail

Three-dimensional data of the Terracotta Warriors are acquired by using Creaform VIU 718 hand-held 3D scanners. Furthermore, the Terracotta Warriors are unearthed from the K9901 pit of Emperor Qinshihuang’s Mausoleum Site Museum. The scan resolution is 0.05 mm, which is conducive to scan speed, but the scanning accuracy is rough. The software Artect is used to automatically or manually align the scanned terracotta warriors to synthesize the entire model. Because the original point cloud has a large number of points, it occupies a very large memory and affects the efficiency of the algorithm. Therefore, the downsampling procedure is adopted to obtain a relatively sparse point cloud (as shown in Figure 5).
There are 8000 point cloud patches (7356 for training and 644 for testing) extracted from 40 whole CHarts to train the network. The original point cloud P is generated by sampling 2048 points from each patch uniformly. The default point number N of each patch is 2048, and the upsampling ratio is 2. Therefore, the input is randomly selected r = 1 2 N , 1 4 N , 1 8 N points from P (see Figure 6), and the target point cloud is N , 1 2 N , 1 4 N . For example, the input point cloud data with 256 points require upsampling to the 512 target points cloud data. The network is implemented using PyTorch and Python 3.7, and the Adam algorithm [41] is adopted as the optimization function with two parameters of 0.5 and 0.9. Where 0.5 is the exponential decay rate of the first-order moment estimation, 0.9 is the exponential decay rate of the second-order moment estimation. In the training phase, the generator and discriminator are trained alternately, and the initial learning rates are both set to 0.0001. We gradually decrease the learning rate by a decay rate of 0.5 per 50 k iterations until 10 6 . We employ batch normalization (BN) and RELU activation units at the generator. We trained the network for 120 epochs with a batch size of 28. We set α   = 0 . 1 ,   β = 100 and γ = 0.1 for all our experiments, with the hardware of AMD Ryzen7 2700 (2.39 GHz), 64 GB memory, and NVIDIA RTX TITAN.

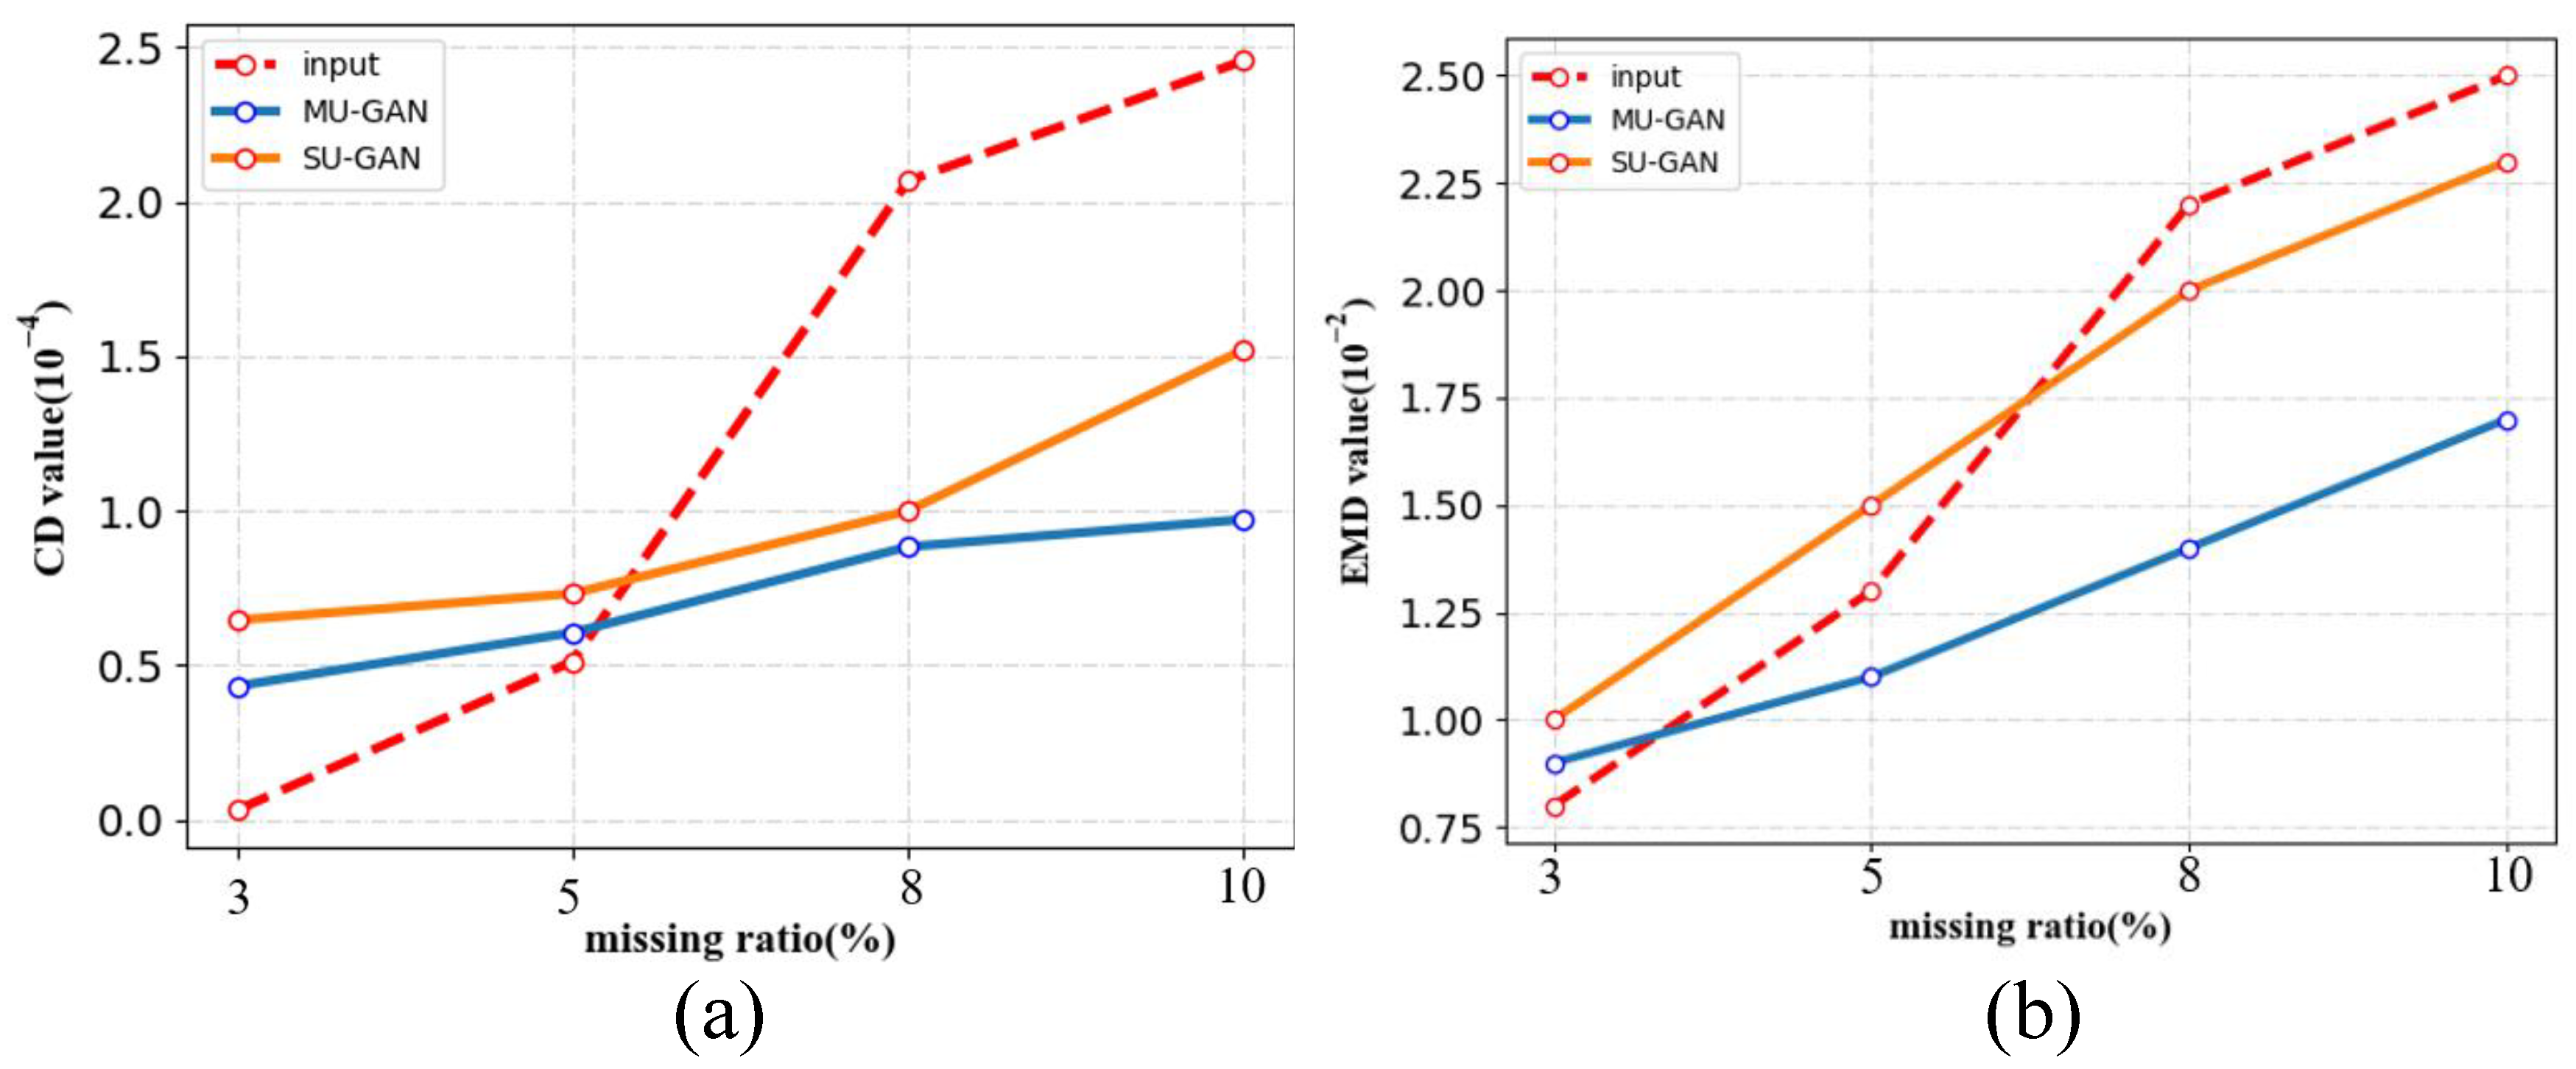
3.2. Evaluation Metrics

In the test phase, the local CHarts with holes are selected as the ground truth on each of the testing models, and the size of the input point cloud is unfixed. We randomly select 1 2 N , 1 4 N , 1 8 N points from a hole region patches as testing input. Due to the disorder of discrete point cloud, and to evaluate the completion results against the ground truth, we adopt two standard metrics introduced in [35]: Chamfer distance (CD) and Earth movers distance (EMD).
The CD denotes the distance between the generated point cloud P d and the ground truth P g t . The formula is symmetric, and the first part guarantees the minimum distance between the generated point cloud and the real point cloud, and the latter part ensures that the real point cloud is covered by the output point cloud.
CD P d , P g t = 1 P d i P d min j P g t i j 2 + 1 P g t i P g t min j P d j i 2
EMD is defined as follows:
EMD P d , P g t = min φ : P d P g t 1 P d i P d i φ i 2
where φ is the mapping generated point cloud to ground truth point cloud. EMD minimizes the average distance between the corresponding point. EMD will be higher than CD, because EMD is the point-to-point correspondence, whereas CD can be one to many.

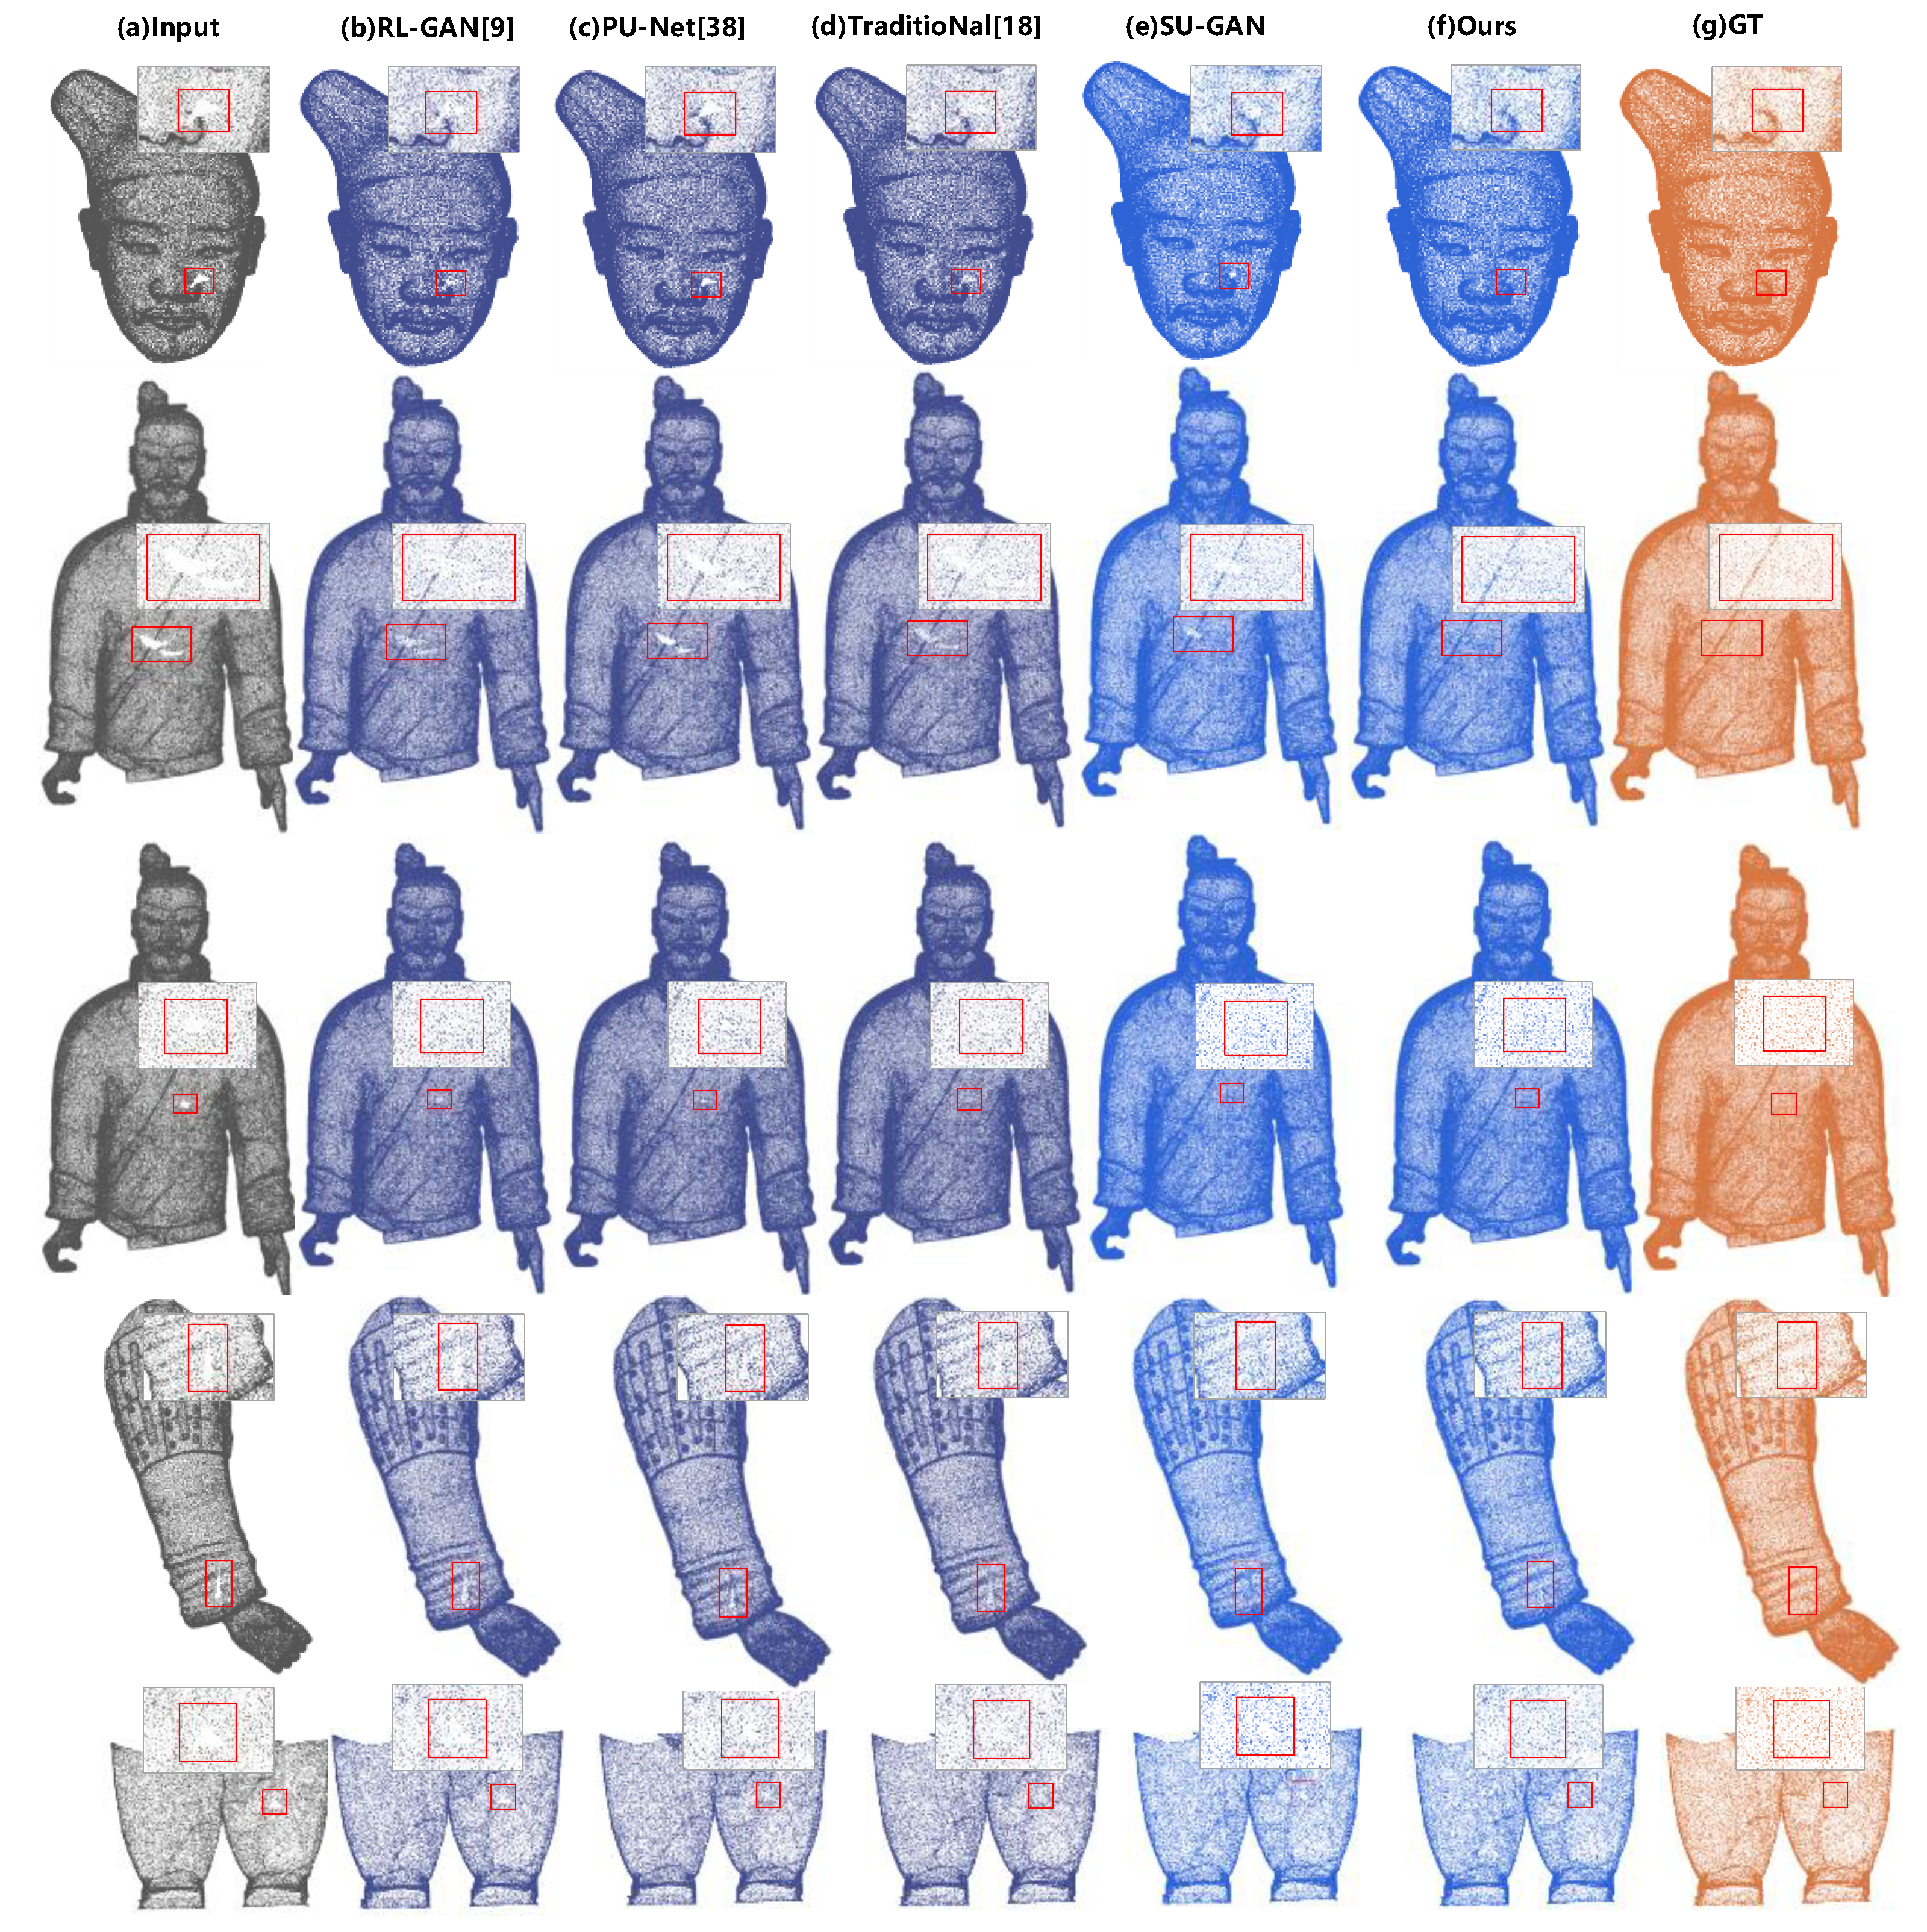
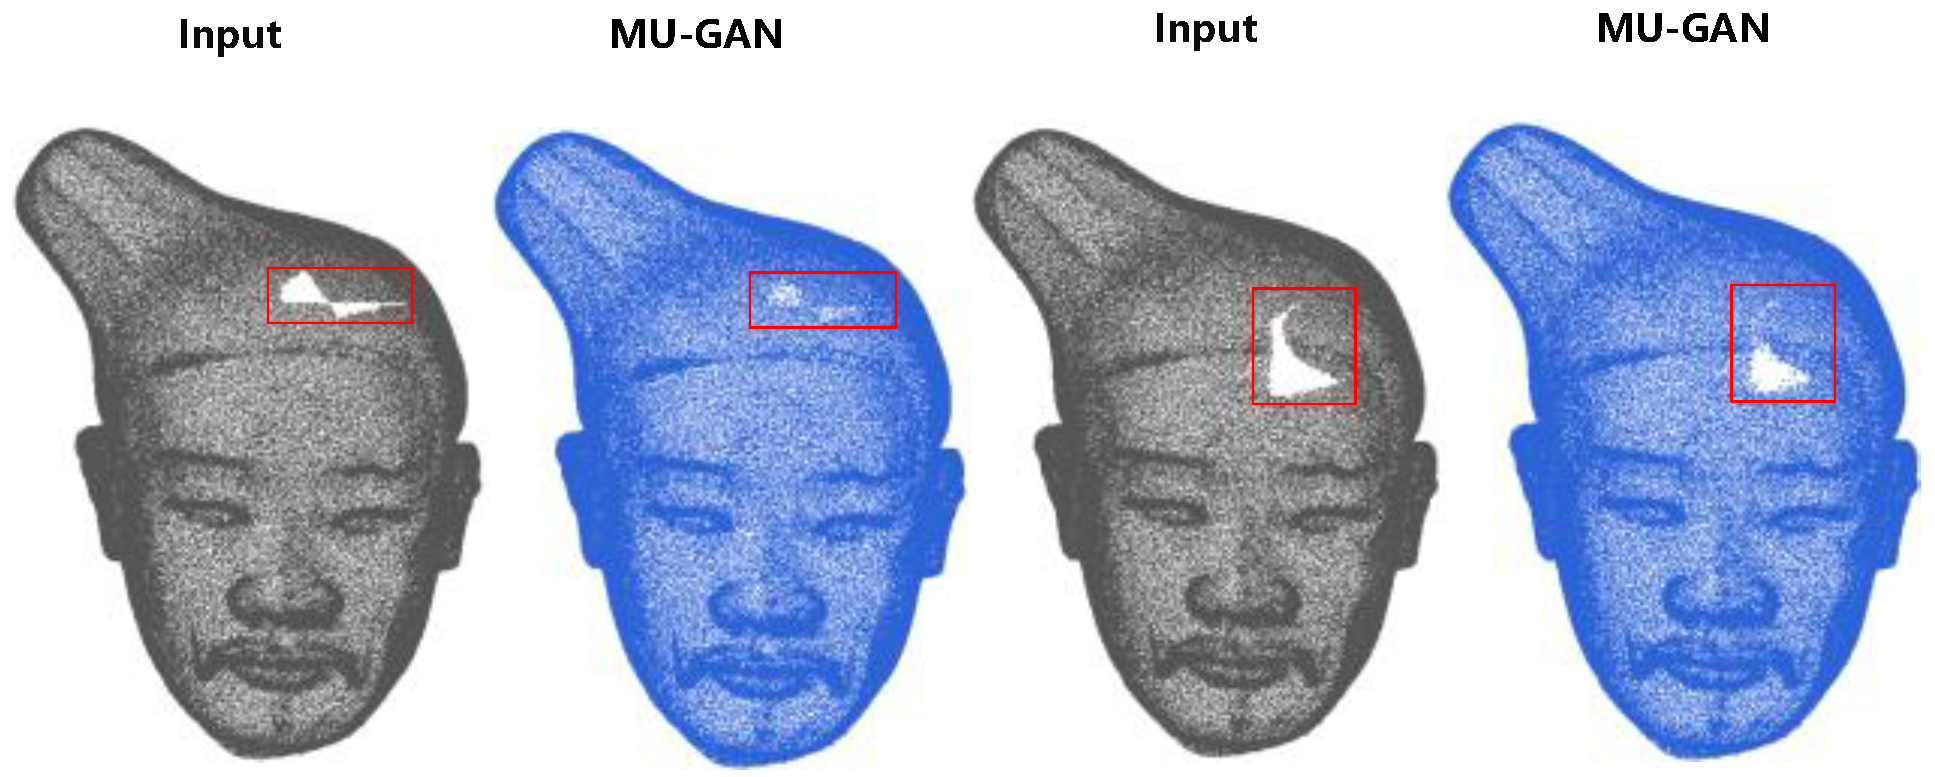
3.3. Experimental Results on MU-GAN

To verify the robustness of the proposed network, a small hole in each model from different parts of the complete CHarts model is generated for testing. Figure 7 shows the complete results of the input data. Our network has more reasonable repair results on both the head with more feature points and the body with fewer feature points. Specifically, we extract the hole region patches from the three different scales generated by MU-GAN; the final complete point cloud is generated by merging the hole region patches with the incomplete point cloud. By this method, not only the holes are filled, but also the high-fidelity features of the model are preserved. The final result is not affected by the downsampling at different scales because the combination of different scales of features can effectively retain more features of the original model.
To prove that the MU-GAN can retain the original structure and feature well for different hole sizes, a series of experiments are conducted. As shown in Figure 8, for Output-2, the output is realistic enough for small holes, while the output is not completed for large holes (e.g., rows 2 and 3). To overcome the problem that more information is not available for large holes, the features obtained by the three different scales should be merged to repair the incomplete model. The results show that the method can retain the structure information of the input point cloud well under different missing ratios. The MU-GAN can further improve the high-quality output for filing the missing region from the compact latent feature to low-level features.
To evaluate the performance of the proposed method and verify the necessity of multi-scale, the values of CD and EMD are compared between the single-scale upsampling GAN (SU-GAN) and MU-GAN, respectively. What needs to be explained is that the single scale means the P 1 , which is the downsampled two ratios from the original point cloud P . As illustrated in Figure 9, the values of CD and EMD are both the lowest when the missing ratio of the input point cloud is 3%. The reason is that the holes are so small that the surface of the point cloud is semantically reasonable. Additionally, we notice that the input point cloud is the best in terms of CD and EMD for 3% missing data. However, the completed point cloud is sufficiently realistic from our visual inspection in Figure 8 (row 1), while they might not be exactly aligned in every detail. As the proportion of missing data increases, our method outperforms the input point cloud and SU-GAN. For the missing ratio up to 15%, the performance of MU-GAN is improved by 34.15% and 22.44% for the CD and EMD, which is compared with that of SU-GAN. It shows that MU-GAN has a good restoration result and strong robustness for the CHarts model with different hole sizes.
In the following, we compare our method to several existing methods [18,37,42] and present both quantitative and qualitative comparisons on the CHarts test dataset.
Table 1 represents the results of the quantitative comparison. The CD and EMD values of different parts vary within a small range, sand it verifies the robustness of our model. Compared with other methods, the MU-GAN achieves the lowest EMD and CD. The CD and EMD values of RL-GAN and PU-Net are higher than the traditional method because the input point clouds of RL-GAN have a fixed size of 2048, and their repair results are too sparse and cannot generate dense point clouds. PU-Net is an upsampling network rather than a GAN network, so it cannot patch the holes completely. The effect of the traditional Poisson-based reconstruction is very close to the proposed method, whose generated point clouds are too uniform in every detail, resulting in a higher probability of alignment with the real data. However, the patches of the hole region generated by the traditional method do not conform to the feature distribution around the hole. The CD and EMD distance of the SU-GAN model in Table 1 are slightly higher than the MU-GAN model. It indicates that the generated results of the proposed method are more similar to the real point cloud. Multi-scale can obtain more dense and uniform repair results because the generator can obtain different levels of the geometric and semantic features.
Figure 10 shows the qualitative results. We visualize the SU-GAN (e) and MU-GAN (f), where the SU-GAN has the same generator and discriminator structure as the MU-GAN. It demonstrates that simply applying a SU-GAN framework is insufficient for the CHarts completion problem when the hole is large (e.g., Line 1 and Line 2). As shown in Figure 10, our completion results are more consistent with the distribution of the incompleted point cloud and more realistic and denser. All the methods can achieve good repaired results for the small hole (e.g., Line 3). More importantly, we can repair the CHarts with complex structures. Compared with other methods, our method can achieve more completed results for large holes. The RL-GAN method can effectively complete 3D models with simple features and fewer points (e.g., airplanes), but due to the limitation of the network input, the downsampling of the original model causes the lack of features, resulting in a mismatch between the generated model and the original model, and the complete hole part is sparse. PU-Net is also an upsampling method like our method. It can increase the number of points in the original point cloud and can fill in smaller holes effectively. However, for larger holes, the increased number of points cannot be extended to the hole area. The method based on the Poisson equation is mainly for the reconstruction of the 3D mesh. The complete result of the model with more complex surface features is too smooth, and the generated points are too uniform to be combined with the original model features. In summary, for the CHarts model with a complex surface structure and more points, our method performs better-completed results, higher spatial integration, and more grained detail.

4. Conclusions and Discussion

China is a country with an ancient culture, and how to restore and preserve these massive cultural relics is of great significance. Due to natural corrosion and human factors, many of the CHarts that have been initially restored have holes of varying sizes on their surface. In this work, we present a multi-scale upsampling GAN to repair these holes. The key of MU-GAN is comprised of a generator and a discriminator. The generator generates a dense point cloud based on the input point cloud with different scales, and the discriminator iteratively reduces the gap between the generated data and the real data. The MU-GAN can obtain both high-level features and low-level features from different scales to achieve high-quality completion results.
Compared with existing methods, the proposed method achieves state-of-the-art completion performance on real scan data, which maintain the original shape of the fine structure information while completing the shape. One interesting thing is that the effect of the traditional surface reconstruction method is very close to the proposed method because the generated point cloud is too uniform in every detail, resulting in a higher probability alignment with the ground truth point cloud. However, the hole region patches generated by the traditional method do not conform to the feature distribution around the hole. The CD and EMD distance of RL-GAN and PU-Net are lower than the traditional method; the reason is the size of the input point cloud of RL-GAN is fixed to 2048, which is too sparse and cannot complete the dense point cloud of CHarts, while the PU-Net is an upsampling network but not GAN network, so it cannot generate the point with good detail information. In addition, there are still some shortcomings in our proposed framework. Figure 11 shows some failure examples. The failure reason is that the hole is too large, and the head is too dense and uniform. The completed point cloud model in the second column is sparse. Additionally, the complete result in the fourth column can only complete the upper part, which misses less of the point cloud; the lower part cannot be completely repaired due to the large hole. Therefore, there is no good performance for the holes with the large missing area. As for future work, we will concentrate on the designing of a method that combines template-based and learning-based methods to encourage the network to fill the large holes. Another direction for future research is the combination of point-based and image-based approaches to apply the complete setup to both geometry and texture details.
In conclusion, the purpose of the current study is to complete the CHarts effectively, and the experimental demonstrates the practicability and high-fidelity on the CHarts of the proposed framework. We hope this work can provide a useful completion tool for the virtual restoration of three-dimensional cultural heritage artifacts.

Author Contributions

Conceptualization, Y.R., T.C., M.Z. and X.C.; methodology, Y.R. and T.C.; validation, Y.J.; formal analysis, X.C.; investigation, Y.J.; data curation, Y.J.; writing—original draft preparation, Y.R. and T.C. and Y.J.; writing—review and editing, G.G. and K.L.; supervision, M.Z. and X.C.; project administration, M.Z. and X.C.; funding acquisition, M.Z. All authors have read and agreed to the published version of the manuscript.

Funding

This research was funded by the State Key Program of National Natural Science Foundation of China (61731015); Key industrial chain projects in Shaanxi Province (2019ZDLSF07-02, 2019ZDLGY10-01); National Key Research and Development Program of China (2019YFC1521102, 2019YFC1521103, 2020YFC1523301); China Postdoctoral Science Foundation (2018M643719); Young Talent Support Program of the Shaanxi Association for Science and Technology (20190107); Key Research and Development Program of Shaanxi Province (2019GY-215); Major research and development project of Qinghai (2020-SF-143).

Institutional Review Board Statement

Not applicable.

Informed Consent Statement

Not applicable.

Data Availability Statement

The data presented in this study are available on request from the corresponding author. The data are not publicly available due to that the Terracotta Warriors involve a policy of secrecy over cultural heritage.

Acknowledgments

We thank the Emperor Qinshihuang’s Mausoleum Site Museum for providing the Terracotta Warriors data.

Conflicts of Interest

The authors declare that they have no known competing financial interests or personal relationships that could have appeared to influence the work reported in this paper.

References

  1. Fortes, M.A.; González, P.; Palomares, A.; Pasadas, M. Filling holes with shape preserving conditions. Math. Comput. Simul. 2015, 118, 198–212. [Google Scholar] [CrossRef]
  2. Kazhdan, M.; Bolitho, M.; Hoppe, H. Poisson surface reconstruction. In Proceedings of the Fourth Eurographics Symposium on Geometry Processing, Cagliari, Italy, 26–28 June 2006. [Google Scholar]
  3. Quinsat, Y. Filling holes in digitized point cloud using a morphing-based approach to preserve volume characteristics. Int. J. Adv. Manuf. Technol. 2015, 81, 411–421. [Google Scholar] [CrossRef]
  4. Wang, X.; Liu, X.; Lu, L.; Li, B.; Cao, J.; Yin, B.; Shi, X. Automatic hole-filling of CAD models with feature-preserving. Comput. Graph. 2012, 36, 101–110. [Google Scholar] [CrossRef]
  5. Zhao, W.; Gao, S.; Lin, H. A robust hole-filling algorithm for triangular mesh. Vis. Comput. 2007, 23, 987–997. [Google Scholar] [CrossRef]
  6. Attene, M. A lightweight approach to repairing digitized polygon meshes. Vis. Comput. 2010, 26, 1393–1406. [Google Scholar] [CrossRef]
  7. Sagawa, R.; Ikeuchi, K. Hole filling of a 3D model by flipping signs of a signed distance field in adaptive resolution. IEEE Trans. Pattern Anal. Mach. Intell. 2008, 30, 686–699. [Google Scholar] [CrossRef] [PubMed]
  8. Sahay, P.; Rajagopalan, A. Geometric inpainting of 3D structures. In Proceedings of the Computer Vision and Patten Recognition, Boston, MA, USA, 7–12 June 2015; pp. 1–7. [Google Scholar]
  9. Chen, C.; Cheng, K. A Sharpness-Dependent Filter for Recovering Sharp Features in Repaired 3D Mesh Models. IEEE Trans. Vis. Comput. Graph. 2008, 14, 200–212. [Google Scholar] [CrossRef] [PubMed]
  10. Cignoni, P.; Callieri, M.; Corsini, M.; Dellepiane, M.; Ganovelli, F.; Ranzuglia, G. Meshlab: An open-source mesh processing tool. In Proceedings of the Eurographics Italian Chapter Conference, Salerno, Italy, 2–4 July 2008. [Google Scholar]
  11. Elshishiny, H.E.E.D.; Bernardini, F.; Rushmeier, H.E. System and Method for Hole Filling in 3D Models. U.S. Patent 7,272,264, 18 September 2007.
  12. Harary, G.; Tal, A.; Grinspun, E. Context-based coherent surface completion. ACM Trans. Graph. 2014, 33, 1–12. [Google Scholar] [CrossRef]
  13. Pauly, M.; Mitra, N.J.; Wallner, J.; Pottmann, H.; Guibas, L.J. Discovering structural regularity in 3D geometry. In Proceedings of the SIGGRAPH’08: International Conference on Computer Graphics and Interactive Techniques, Dallas, TX, USA, 11–15 August 2008; pp. 1–11. [Google Scholar]
  14. Fu, Z.; Hu, W.; Guo, Z. Point cloud inpainting on graphs from non-local self-similarity. In Proceedings of the 2018 25th IEEE International Conference on Image Processing (ICIP), Athens, Greece, 7–10 October 2018; pp. 2137–2141. [Google Scholar]
  15. Fortes, M.A.; González, P.; Palomares, A.; Pasadas, M. Filling holes with geometric and volumetric constraints. Comput. Math. Appl. 2017, 74, 671–683. [Google Scholar] [CrossRef]
  16. Gai, S.; Da, F.; Liu, C. Multiple-gamma-value based phase error compensation method for phase measuring profilometry. Appl. Opt. 2018, 57, 10290–10299. [Google Scholar] [CrossRef] [PubMed]
  17. Hoang, V.-D.; Le, M.-H.; Hernández, D.C.; Jo, K.-H. Localization estimation based on Extended Kalman filter using multiple sensors. In Proceedings of the IECON 2013—39th Annual Conference of the IEEE Industrial Electronics Society, Vienna, Austria, 10–13 November 2013; pp. 5498–5503. [Google Scholar]
  18. Li, Y.; Geng, G.; Wei, X. Hole-filling algorithm based on poisson equation. Comput. Eng. 2017, 43, 209–215. [Google Scholar]
  19. Ngo, T.M.; Lee, W.S. Feature-First Hole Filling Strategy for 3D Meshes. In Proceedings of the Computer Vision, Imaging and Computer Graphics, Theory and Applications, Barcelona, Spain, 21–24 February 2013. [Google Scholar]
  20. Gai, S.; Da, F.; Dai, X. A novel dual-camera calibration method for 3D optical measurement. Opt. Lasers Eng. 2018, 104, 126–134. [Google Scholar] [CrossRef]
  21. Vokhmintcev, A.; Timchenko, M.; Alina, K. Real-time visual loop-closure detection using fused iterative close point algorithm and extended Kalman filter. In Proceedings of the 2017 International Conference on Industrial Engineering, Applications and Manufacturing (ICIEAM), Saint Petersburg, Russia, 16–19 May 2017; pp. 1–6. [Google Scholar]
  22. Gai, S.; Da, F.; Zeng, L.; Huang, Y. Research on a hole filling algorithm of a point cloud based on structure from motion. J. Opt. Soc. Am. A 2019, 36, A39–A46. [Google Scholar] [CrossRef] [PubMed]
  23. Dai, A.; Ruizhongtai Qi, C.; Nießner, M. Shape completion using 3d-encoder-predictor cnns and shape synthesis. In Proceedings of the IEEE Conference on Computer Vision and Pattern Recognition, Honolulu, HI, USA, 21–26 July 2017; pp. 5868–5877. [Google Scholar]
  24. Nguyen, D.T.; Hua, B.-S.; Tran, K.; Pham, Q.-H.; Yeung, S.-K. A field model for repairing 3d shapes. In Proceedings of the IEEE Conference on Computer Vision and Pattern Recognition, Las Vegas, NV, USA, 27–30 June 2016; pp. 5676–5684. [Google Scholar]
  25. Stutz, D.; Geiger, A. Learning 3d shape completion under weak supervision. Int. J. Comput. Vis. 2020, 128, 1162–1181. [Google Scholar] [CrossRef] [Green Version]
  26. Wu, Z.; Song, S.; Khosla, A.; Yu, F.; Zhang, L.; Tang, X.; Xiao, J. 3d shapenets: A deep representation for volumetric shapes. In Proceedings of the IEEE Conference on Computer Vision and Pattern Recognition, Boston, MA, USA, 7–12 June 2015; pp. 1912–1920. [Google Scholar]
  27. Han, X.; Li, Z.; Huang, H.; Kalogerakis, E.; Yu, Y. High-resolution shape completion using deep neural networks for global structure and local geometry inference. In Proceedings of the IEEE International Conference on Computer Vision, Honolulu, HI, USA, 21–26 July 2017; pp. 85–93. [Google Scholar]
  28. Sharma, A.; Grau, O.; Fritz, M. Vconv-dae: Deep volumetric shape learning without object labels. In Proceedings of the European Conference on Computer Vision, Munich, Germany, 8–14 September 2016; pp. 236–250. [Google Scholar]
  29. Qi, C.R.; Su, H.; Mo, K.; Guibas, L.J. Pointnet: Deep learning on point sets for 3d classification and segmentation. In Proceedings of the IEEE Conference on Computer Vision and Pattern Recognition, Honolulu, HI, USA, 21–26 July 2017; pp. 652–660. [Google Scholar]
  30. Fan, H.; Su, H.; Guibas, L.J. A point set generation network for 3d object reconstruction from a single image. In Proceedings of the IEEE Conference on Computer Vision and Pattern Recognition, Honolulu, HI, USA, 21–26 July 2017; pp. 605–613. [Google Scholar]
  31. Huang, Q.; Wang, W.; Neumann, U. Recurrent slice networks for 3d segmentation of point clouds. In Proceedings of the IEEE Conference on Computer Vision and Pattern Recognition, Salt Lake City, UT, USA, 18–22 June 2018; pp. 2626–2635. [Google Scholar]
  32. Qi, C.R.; Yi, L.; Su, H.; Guibas, L.J. Pointnet++: Deep hierarchical feature learning on point sets in a metric space. In Proceedings of the 31st Conference on Neural Information Processing Systems (NIPS 2017), Long Beach, CA, USA, 4–9 December 2017. [Google Scholar]
  33. Achlioptas, P.; Diamanti, O.; Mitliagkas, I.; Guibas, L. Learning Representations and Generative Models for 3D Point Clouds. In Proceedings of the International Conference on Machine Learning, Sydney, Australia, 6–11 August 2017. [Google Scholar]
  34. Yang, Y.; Feng, C.; Shen, Y.; Tian, D. Foldingnet: Point cloud auto-encoder via deep grid deformation. In Proceedings of the IEEE Conference on Computer Vision and Pattern Recognition, Salt Lake City, UT, USA, 18–22 June 2018; pp. 206–215. [Google Scholar]
  35. Yuan, W.; Khot, T.; Held, D.; Mertz, C.; Hebert, M. Pcn: Point completion network. In Proceedings of the 2018 International Conference on 3D Vision (3DV), Verona, Italy, 5–8 September 2018; pp. 728–737. [Google Scholar]
  36. Chen, X.; Chen, B.; Mitra, N.J. Unpaired point cloud completion on real scans using adversarial training. arXiv 2019, arXiv:1904.00069. [Google Scholar]
  37. Sarmad, M.; Lee, H.J.; Kim, Y.M. Rl-gan-net: A reinforcement learning agent controlled gan network for real-time point cloud shape completion. In Proceedings of the IEEE/CVF Conference on Computer Vision and Pattern Recognition, Long Beach, CA, USA, 16–17 June 2019; pp. 5898–5907. [Google Scholar]
  38. Yu, L.; Li, X.; Fu, C.-W.; Cohen-Or, D.; Heng, P.-A. Pu-net: Point cloud upsampling network. In Proceedings of the IEEE Conference on Computer Vision and Pattern Recognition, Salt Lake City, UT, USA, 18–22 June 2018; pp. 2790–2799. [Google Scholar]
  39. Yifan, W.; Wu, S.; Huang, H.; Cohen-Or, D.; Sorkine-Hornung, O. Patch-based progressive 3d point set upsampling. In Proceedings of the IEEE/CVF Conference on Computer Vision and Pattern Recognition, Long Beach, CA, USA, 16–17 June 2019; pp. 5958–5967. [Google Scholar]
  40. Li, R.; Li, X.; Fu, C.-W.; Cohen-Or, D.; Heng, P.-A. Pu-gan: A point cloud upsampling adversarial network. In Proceedings of the IEEE/CVF International Conference on Computer Vision, Long Beach, CA, USA, 16–17 June 2019; pp. 7203–7212. [Google Scholar]
  41. Kingma, D.P.; Ba, J. Adam: A method for stochastic optimization. arXiv 2014, arXiv:1412.6980. [Google Scholar]
  42. Ma, C.; Guo, Y.; Lei, Y.; An, W. Binary volumetric convolutional neural networks for 3-D object recognition. IEEE Trans. Instrum. Meas. 2018, 68, 38–48. [Google Scholar] [CrossRef]
Figure 1. Several types of holes existed on the surface of 3D Charts. (a) is a simple closed hole formed by connecting the edges of the triangular mesh; (b) is a simple hole with a small number of independent triangular meshes in the hole closed by the edges of the triangular mesh; (c) is an unclosed complex hole; (d) is a simple hole in the scanning data obtained by the scanner.
Applsci 12 04581 g001
Figure 2. Hole detection results; the hole is marked by the red line.
Applsci 12 04581 g002
Figure 3. Overview of MU-GAN. (1) We first obtain k (k = 3) point cloud data ( P 1 , P 2 , P 3 ) of different points of an artifact model P . A generator is used to generate up-sampled 2× clean, dense complete point cloud data for each noisy, sparse point cloud data. The generated multi-scale point cloud data are used as input to train the discriminator. (2) To generate uniform patches, the multi-scale feature-fused point cloud data are generated through the stages of feature extraction and point cloud reconstruction, and the missing regions are extracted as filler patches. (3) The input data to be repaired and the filler patches are merged to obtain the final point cloud repair results.
Applsci 12 04581 g003
Figure 4. The up module and down module in the generator of MU-GAN.
Applsci 12 04581 g004
Figure 5. (a) Point cloud of points directly acquired by the 3D scanner; (b) point cloud after the downsampling procedure with a sampling coefficient of 60%.
Applsci 12 04581 g005
Figure 6. Point cloud patches with different scales.
Applsci 12 04581 g006
Figure 7. Experimental results of different CHarts models with small holes. Output-2, Output-4, and Output-8 denote the point cloud generated from P 1 , P 2 , and P 3 separately. The text continues here.
Applsci 12 04581 g007
Figure 8. Experimental results of one CHarts model with different hole sizes, and the size increases from top to bottom. The missing ratios of the model are 3%, 5%, 10%, and 15%, respectively.
Applsci 12 04581 g008
Figure 9. (a) the CD value with different hole sizes; (b) the EMD value with different hole sizes.
Applsci 12 04581 g009
Figure 10. The comparison of completion results between other methods (bd), our SU-GAN (e), and MU-GAN (f) from inputs (a). The input of all methods is a point cloud patch containing holes.
Applsci 12 04581 g010
Figure 11. The examples of limited cases.
Applsci 12 04581 g011
Table 1. Quantitative comparison of CD ( 10 6 ) and EMD ( 10 1 ) among our methods and several existing methods.
ModelRL-GANPU-NetTraditionalOur-SUOur-Mu
CDEMDCDEMDCDEMDCDEMDCDEMD
head1.7200.09151.7100.08510.4530.08830.7880.07740.4090.0728
body1.1600.07530.6650.07340.3850.06850.5280.07070.2940.0676
arm1.9400.07140.9220.07420.2180.06930.2370.06880.2080.0674
leg1.0500.06921.0240.06280.9180.06960.5630.06030.4580.0599
Publisher’s Note: MDPI stays neutral with regard to jurisdictional claims in published maps and institutional affiliations.

